


-
Rice-based cropping systems provide one-third of grain production in China[1], and soil-derived N accounts for more than half of the N accumulated in rice biomass[2]. Mineralization of soil organic N (Nm) is therefore a key process regulating the soil N supply and shaping crop N uptake[3]. Because Nm largely determines the balance between soil N provision and fertilizer requirements, accurate assessment of Nm is essential for optimizing N management in rice cultivation[4,5]. Recent global analyses further highlight that variations in Nm strongly influence soil inorganic N pools, underscoring its importance in predicting plant-available N and guiding efficient fertilization strategies[6].
Current estimations of Nm in paddy soils rely heavily on field N-omission trials and laboratory incubations, each presenting inherent methodological constraints that limit their operational utility and scalability. Field and pot experiments infer soil intrinsic N supply from crop uptake without fertilizer application, thereby integrating realistic plant–soil–microbe interactions. Yet these measurements are confounded by external N inputs (e.g., deposition, irrigation, and N fixation) and substantial seasonal variability, making it difficult to isolate the actual contribution of soil Nm[7]. Laboratory incubations, despite offering greater environmental control, introduce other limitations. Aerobic incubation, which was originally developed for upland soils, fails to capture the anaerobic mineralization processes characteristic of flooded paddy soils[8−10]. Anaerobic incubation was used to estimate the Nm potential (N0) in paddy soils under simulated field conditions[11]. There was a good correlation between the measured Nm rate and N uptake during the rice growth period[12]. Although these controlled incubations provide fundamental insights into soil N supply capacity and its kinetic behavior, they are time-consuming, labor-intensive, and inherently low-throughput.
To overcome these constraints, short-term anaerobic incubations have been proposed as operational proxies for long-term mineralization, on the premise that early-phase Nm (over days to a few weeks) accounts for most of cumulative N release and correlates strongly with N0 estimated from extended incubations. Studies in submerged and upland soils have shown that Nm measured over 7–14 d, or even over a few days at elevated temperature, can serve as reliable indicators of potentially mineralizable N, substantially reducing incubation time while retaining predictive power for seasonal N supply[13−15]. In parallel, rapid chemical extraction methods offer a faster and more operationally convenient alternative by providing surrogate indicators of hydrolysable or available N fractions[16]. Among them, hot-water and NaHCO3 extractions are effective for characterizing the potential and intensity of Nm, as they capture labile organic N pools closely associated with soil mineralization dynamics[16,17]. However, the performance and transferability of these short-term incubation metrics and rapid extraction indices across contrasting paddy soil regions remain poorly constrained, particularly where differences in climate, texture, and organic matter stabilization may alter the relationships between these indices and long-term Nm. This uncertainty highlights the need to evaluate region-specific thresholds for short-term incubation and to test whether rapid–extraction–based indicators can provide robust, scalable estimates of Nm potential across major rice-growing regions.
The rate and extent of soil Nm are governed by a combination of physicochemical and biological factors that regulate organic N turnover[11,18,19]. Among these, intrinsic soil properties such as C/N ratio, clay content, pH, and organic matter stabilization play a dominant role in determining how rapidly mineralizable substrates become available to microbes[12]. For example, Gao et al.[20] reported that the C/N ratio was positively correlated with the Nm rate, and negatively correlated with N0 in black paddy soils of Northeast China (NC), while a study of paddy soils in southern China revealed a significant correlation between C/N ratio and Nm under anaerobic incubation[12]. Beyond substrate stoichiometry, pH and clay-related stabilization exert additional controls on Nm. In subtropical paddy soils, anaerobic Nm has been shown to vary systematically with pH, with lower pH promoting mineralization under flooded conditions[21]. More broadly, studies in temperate and boreal agricultural soils have demonstrated that increasing clay content enhances organo–mineral protection and modifies both the fraction and rate of Nm[22]. Thus, exploring the mechanisms behind regional differences in Nm under controlled incubation is essential for elucidating the drivers of soil N supply and optimizing N fertilizer management in contrasting rice ecosystems.
The YRD and NC are two important rice-growing regions in China. Rice production in these two areas is equivalent, with comparable annual rice production[23,24]. Despite similar yields (7.86 t ha−1 in the YRD, and 7.73 t ha−1 in NC), the average N fertilizer input over the past three decades was markedly higher in the YRD (279 kg N ha−1) than in NC (159 kg N ha−1), while the corresponding partial factor productivity of N fertilizer was substantially lower (35 kg kg−1 vs 54 kg kg−1)[25]. These contrasting patterns suggest that differences in soil N supply capacity, particularly Nm, may underlie regional disparities in N fertilizer efficiency (NUE). Revealing the patterns and mechanisms of regional N supply in soil can help identify differences in N fertilizer utilization between these two regions. For example, waterlogged incubation studies in the Mollisols-based rice soils of NC document substantial Nm potentials and distinct kinetic responses[26]. Previous process-based studies reported that gross Nm rates in the gleyed paddy soils of the YRD were more than an order of magnitude higher than those in the black paddy soils of NC[27]. However, current assessments often overlook spatial variability within regions, highlighting the need for a comprehensive evaluation of Nm characteristics across diverse site conditions.
Building upon these principles, this study hypothesizes that the distinct Nm behaviors observed in paddy soils from the YRD and NC are regulated by different combinations of soil physicochemical attributes such as organic matter quality, C/N ratio, pH, and clay content, which jointly modulate N turnover processes. A further hypothesis proposes that integrating rapid extraction indices with soil properties within a multivariate predictive framework can effectively quantify these region-specific mechanisms and enhance Nm estimation accuracy. To test this hypothesis, anaerobic incubation experiments and rapid extraction analyses were performed on 36 typical paddy soil samples from YRD, and 24 from NC. The objectives of linking incubation-derived Nm parameters with rapid extraction indicators and soil physicochemical variables are: to (i) reveal the underlying mechanisms driving Nm variability between the two rice-growing regions; and (ii) develop site-specific multiple regression models capable of accurately predicting long-term Nm and rates across contrasting agroecosystems (Supplementary Fig. S1).
-
The study was conducted in two representative rice-producing regions of China: the YRD and NC. The YRD sites (30.9–31.5° N, 119.8–120.6° E) are located on the low-lying alluvial plain around the Taihu Lake basin, characterized by a subtropical monsoon climate, with a mean annual temperature of 15–17 °C, and annual precipitation of approximately 1,180 mm. The dominant cropping system is a rice–wheat double rotation under alternating wet and dry management, and long-term puddling and irrigation have produced gleyed paddy soils that are classified as Hydragric Anthrosols in the Chinese Soil Taxonomy. By contrast, the NC sites (43.4–47.4° N, 124.7–128.8° E) are situated in the Songliao plain, which is characterized by a temperate continental monsoon climate with a mean annual temperature of about 3–10 °C, and annual precipitation of 400–800 mm, roughly 70%–80% of which falls between June and September. The region practices a single rice cropping system under continuous flooding, and soils are predominantly Mollisols-derived black paddy soils, rich in organic matter but constrained by lower temperatures and shorter frost-free periods[26]. Detailed geographic coordinates of all 60 sampling sites are provided in Supplementary Table S1.
A total of 60 paddy soil samples were collected, including 36 from the YRD and 24 from NC (Supplementary Fig. S2). The sampling sites were selected as typical case locations rather than as region-wide representative samples, aiming to capture local soil characteristics and management conditions within these two contrasting rice systems. In each field, composite soil samples (0–20 cm depth) were obtained using a soil auger from five randomly distributed points, and thoroughly homogenized. The samples were air-dried, gently crushed, and sieved (< 2 mm) before analysis. Soil pH was measured in a 1:2.5 (w/v) soil-to-water suspension using a multi-parameter ion meter (SG78, Mettler Toledo, Switzerland). Total nitrogen (TN), and total organic carbon (TOC) were measured by dry combustion using a C/N analyzer (Skalar Analytical, Netherlands). The TOC/TN ratio was expressed as C/N. Soil mineral N (NH4+–N and NO3−–N) was extracted with 2 mol L−1 KCl and quantified using a continuous-flow analyzer (Skalar Analytical, Netherlands). Soil organic N (TON) was calculated as the difference between TN and the sum of inorganic N forms. Detailed physicochemical data for all samples are provided in Supplementary Table S1. Cation exchange capacity (CEC) was determined using the modified ammonium acetate compulsory displacement method[28]. The soil particle composition (clay, silt, and sand fractions) was analyzed using the pipette method[29].
Incubation experiment
-
Anaerobically mineralizable N was determined based on the amount of N generated during a 112-d anaerobic incubation this was chosen as a standard long-term incubation duration for estimating Nm, following established soil incubation protocols and approximating the length of a typical single-season rice growing period for many medium-duration cultivars[30,31]. A 10 g soil sample was weighed in a 100 mL centrifuge tube; after adding 25 mL of deionized water, the 42 duplicated soil–water suspension samples for each soil were incubated at 30 ± 0.5 °C in a constant temperature incubator (SPH-450, Shanghai, China), and the centrifuge cap remained sealed throughout the incubation period. The incubation temperature of 30 °C was not intended to reproduce in situ seasonal soil temperatures mainly in the cold rice region of NC, where the mean growing-season air temperature is about 22–26 °C between June and August, but rather to provide a standardized, non-temperature-limited condition for estimating potential Nm. This choice is consistent with previous anaerobic incubation studies of paddy soils, including Mollisols-derived paddy soils in NC, which commonly use 30 °C to quantify Nm potential[20,26]. After incubation, three random samples were selected for extracting ammonium nitrogen (NH4+-N) in 2 mol L−1 KCl using a flow analyzer (Skalar Analytical, Netherlands). The Nm value was calculated by subtracting NH4+-N in the soil prior to incubation from the amount measured after incubation at 1, 3, 5, 7, 14, 21, 28, 42, 56, 70, 91, and 112 d.
$ \rm{Nm,\;nitrogen\;mineralization\;(mg\;kg}^{{-1}} )={\rm NH}_{ {4}}^{+} {{\text-}N(t)-NH}_{ {4}}^{ +} {{\text-}N(t}_{0}) $ (1) $ \rm{Nitrogen\; mineralization\; rate\; (mg\; kg}^{-1}\; day^{-1})=\Delta Nm/\Delta t $ (2) $ \mathrm{\Delta Nm=Nm(t}_{ \mathrm{n}} \mathrm{)-Nm(t}_{ \mathrm{n-1}} \mathrm{)} $ (3) $ \rm{Nmr,\;nitrogen\;mineralization\;ratio\;({\text{%}})=Nm/TON} $ (4) where, NH4+-N (t) is the NH4+-N content at a given sampling time during the incubation period,
$ \mathrm{N}_{ \mathrm{a}} \mathrm{=N}_{ \mathrm{0}} \mathrm{(1-e}^{ \mathrm{-kt}} \mathrm{)} $ (5) where, Na is the cumulative mineralized N, and N0 is the Nm potential. This model assumes that Nm follows a first-order kinetic model, namely a One-pool model[32].
Rapid soil test
-
Extractable potential available N was determined using a series of mild chemical extractants designed to quantify labile organic and inorganic N pools associated with short-term mineralization potential. Three extractants were employed: 0.01 mol L−1 sodium bicarbonate (NaHCO3), deionized water at room temperature (20 ± 1 °C, referred to as cold water extraction), and hot water (80 ± 1 °C). These methods have been shown to effectively reflect the size and activity of readily mineralizable N pools in agricultural soils[33,34]. In the bicarbonate extraction, 5.0 g of soil was shaken with 100 mL of 0.01 mol L−1 NaHCO3 for 15 min on an orbital shaker (150 rpm), following the procedure of Nunan et al.[35]. The suspension was then filtered twice through pre-washed filter paper until a clear extract was obtained. Ultraviolet absorbance at 205 nm (Na205) and 260 nm (Na260) was measured using a Molecular Devices SpectraMax M2 microplate reader (Greiner Bio-One UV-Star 96-well plates, 1 cm cell path length). Cold-water extractable NH4+-N (CWN) was determined as described by Curtin et al.[16]. In a preliminary step, readily soluble organic matter was removed using a deionized water extraction at room temperature (20 ± 1 °C; hereafter referred to as cold water extraction). This involved shaking 4 g of soil samples with 40 mL of deionized water in 50 mL centrifuge tubes for 30 min. The soil–water suspensions were then centrifuged at 1,053 g for 20 min. Then, the supernatant was filtered through a pre-leached filter paper (Munktell 393). For hot-water extraction, an additional 4.0 g of soil with 40 mL of added deionized water in 50 mL centrifuge tubes was placed in a water bath at 80 °C for 16 ± 0.5 h. The tubes were centrifuged at a force of 3,850 g for 5 min, and the supernatant solution was collected after filtration to measure the hot water extractable NH4+-N (HWN) content, extractable total N (HWETN) content, subtract NH4+-N and NO3−-N from for the content of extractable organic N (HWEON), and the ultraviolet absorbance values at 205 nm (HW205), and 260 nm (HW260).
Statistical analysis
-
All raw data processing was conducted using Office 2023. Pearson correlation between physicochemical properties, rapid extractions, and Nm, and Nmr, and variance analysis (ANOVA) were performed using SPSS statistical software (version 20.0, IBM SPSS Inc.). An indication of the variation associated with estimated means is provided by the least significant difference (LSD) at a 5% level and an asymptotically large denominator degree of freedom. The relationships between long-term Nm (LTNm), long-term Nm ratio (LTNmr), rapid extract indices, short-term Nm (STNm), short-term Nm ratio (STNmr), and other soil variables were quantified using Spearman's rank correlation analysis. To assess the robustness of these correlations, a non-parametric bootstrap resampling approach was applied. Specifically, for each variable pair, 1,000 bootstrap samples were drawn with replacement from the original dataset. For each resample, the Spearman correlation coefficient (r) was recalculated, yielding a bootstrap distribution of r values. The point estimate was defined as the observed correlation coefficient (r), while the 95% confidence interval (CI) was determined from the 2.5th and 97.5th percentiles of the bootstrap distribution.
To quantitatively determine the shortest representative incubation duration for predicting LTNm and LTNmr, Spearman's rank correlation analysis was performed between Nm and Nmr values obtained at each incubation time point before 112 d and the corresponding 112-d cumulative Nm and Nmr. The correlation coefficient (r) between short-term and long-term measurements was used as an indicator of how well a given short-term measurement represented LTNm. For each region, this study calculated r(d) over the entire incubation period and identified rmax as the maximum correlation attained. The minimum representative incubation period was then defined as the earliest day on which r(d) reached at least 75% of rmax, beyond which additional incubation time contributed only a slight improvement to the prediction of LTNm behavior. The 75% threshold was chosen a priori as a pragmatic criterion indicating that a short-term measurement captures most of the attainable correlation (three-quarters of the asymptotic value), consistent with standard practice in soil N dynamics and related environmental modelling[36,37].
The relationships between soil physicochemical properties, Nm, and Nmr were evaluated using a piecewise structural equation model (SEM) in R (version 4.5.1). The model was constructed with the piecewiseSEM package, allowing simultaneous estimation of multiple linear mixed models to explore both direct and indirect effects among variables[38]. Model selection and path optimization were based on Akaike's Information Criterion (AIC) and test of directed separation (Fisher's C and Chi-square statistics). Standardized path coefficients were obtained to assess the relative importance of each variable. The direct effects were obtained from standardized path coefficients estimated for each regression component. The indirect effects were calculated as the product of standardized coefficients along mediated causal paths.
The multivariate linear prediction model was established in R (version 4.5.1) using the stepwise regression method implemented in the MASS package. Model selection was based on the AIC to identify the optimal combination of explanatory variables. To evaluate model robustness and predictive performance, a 10-fold cross-validation was conducted using the caret package, and model accuracy was assessed by the coefficient of determination (R2), and root mean square error (RMSE). Figures were drawn using R (version 4.5.1).
-
The soil samples collected from the representative rice-growing sites within the YRD and NC exhibited a wide range of physicochemical characteristics. Overall, soils from the YRD sites showed significantly (p < 0.01) lower TN, TOC, C/N ratio, and CEC compared with those from the NC sites (Supplementary Fig. S3). No significant difference in pH was observed between the two soil sets (Supplementary Fig. S3). Differences in soil texture were also evident: paddy soils from the YRD sites contained significantly lower clay and higher silt proportions than those from NC (p < 0.01). These findings reflect inherent contrasts between the two typical rice production environments, namely the fine-textured, organic-rich black paddy soils in NC and the relatively coarser, less fertile gleyed paddy soils in the YRD, which together provide a meaningful basis for analyzing site-specific Nm mechanisms.
The paddy soils from the representative YRD sites exhibited markedly higher Nm rates during the early incubation phase (1–14 d) compared with those from the NC sites (Fig. 1a). As incubation progressed, the difference between the two sets of soils gradually diminished. The N0 were 105.53 and 74.49 mg kg−1 in the YRD and NC, respectively (Fig. 1b). The mineralization process was most rapid within the first two weeks, after which it slowed markedly. Approximately 84.7% and 64.8% of total Nm occurred within this period in the YRD and NC soils, respectively, indicating that the organic N mineralized during the early incubation phase was predominantly labile and N-rich.
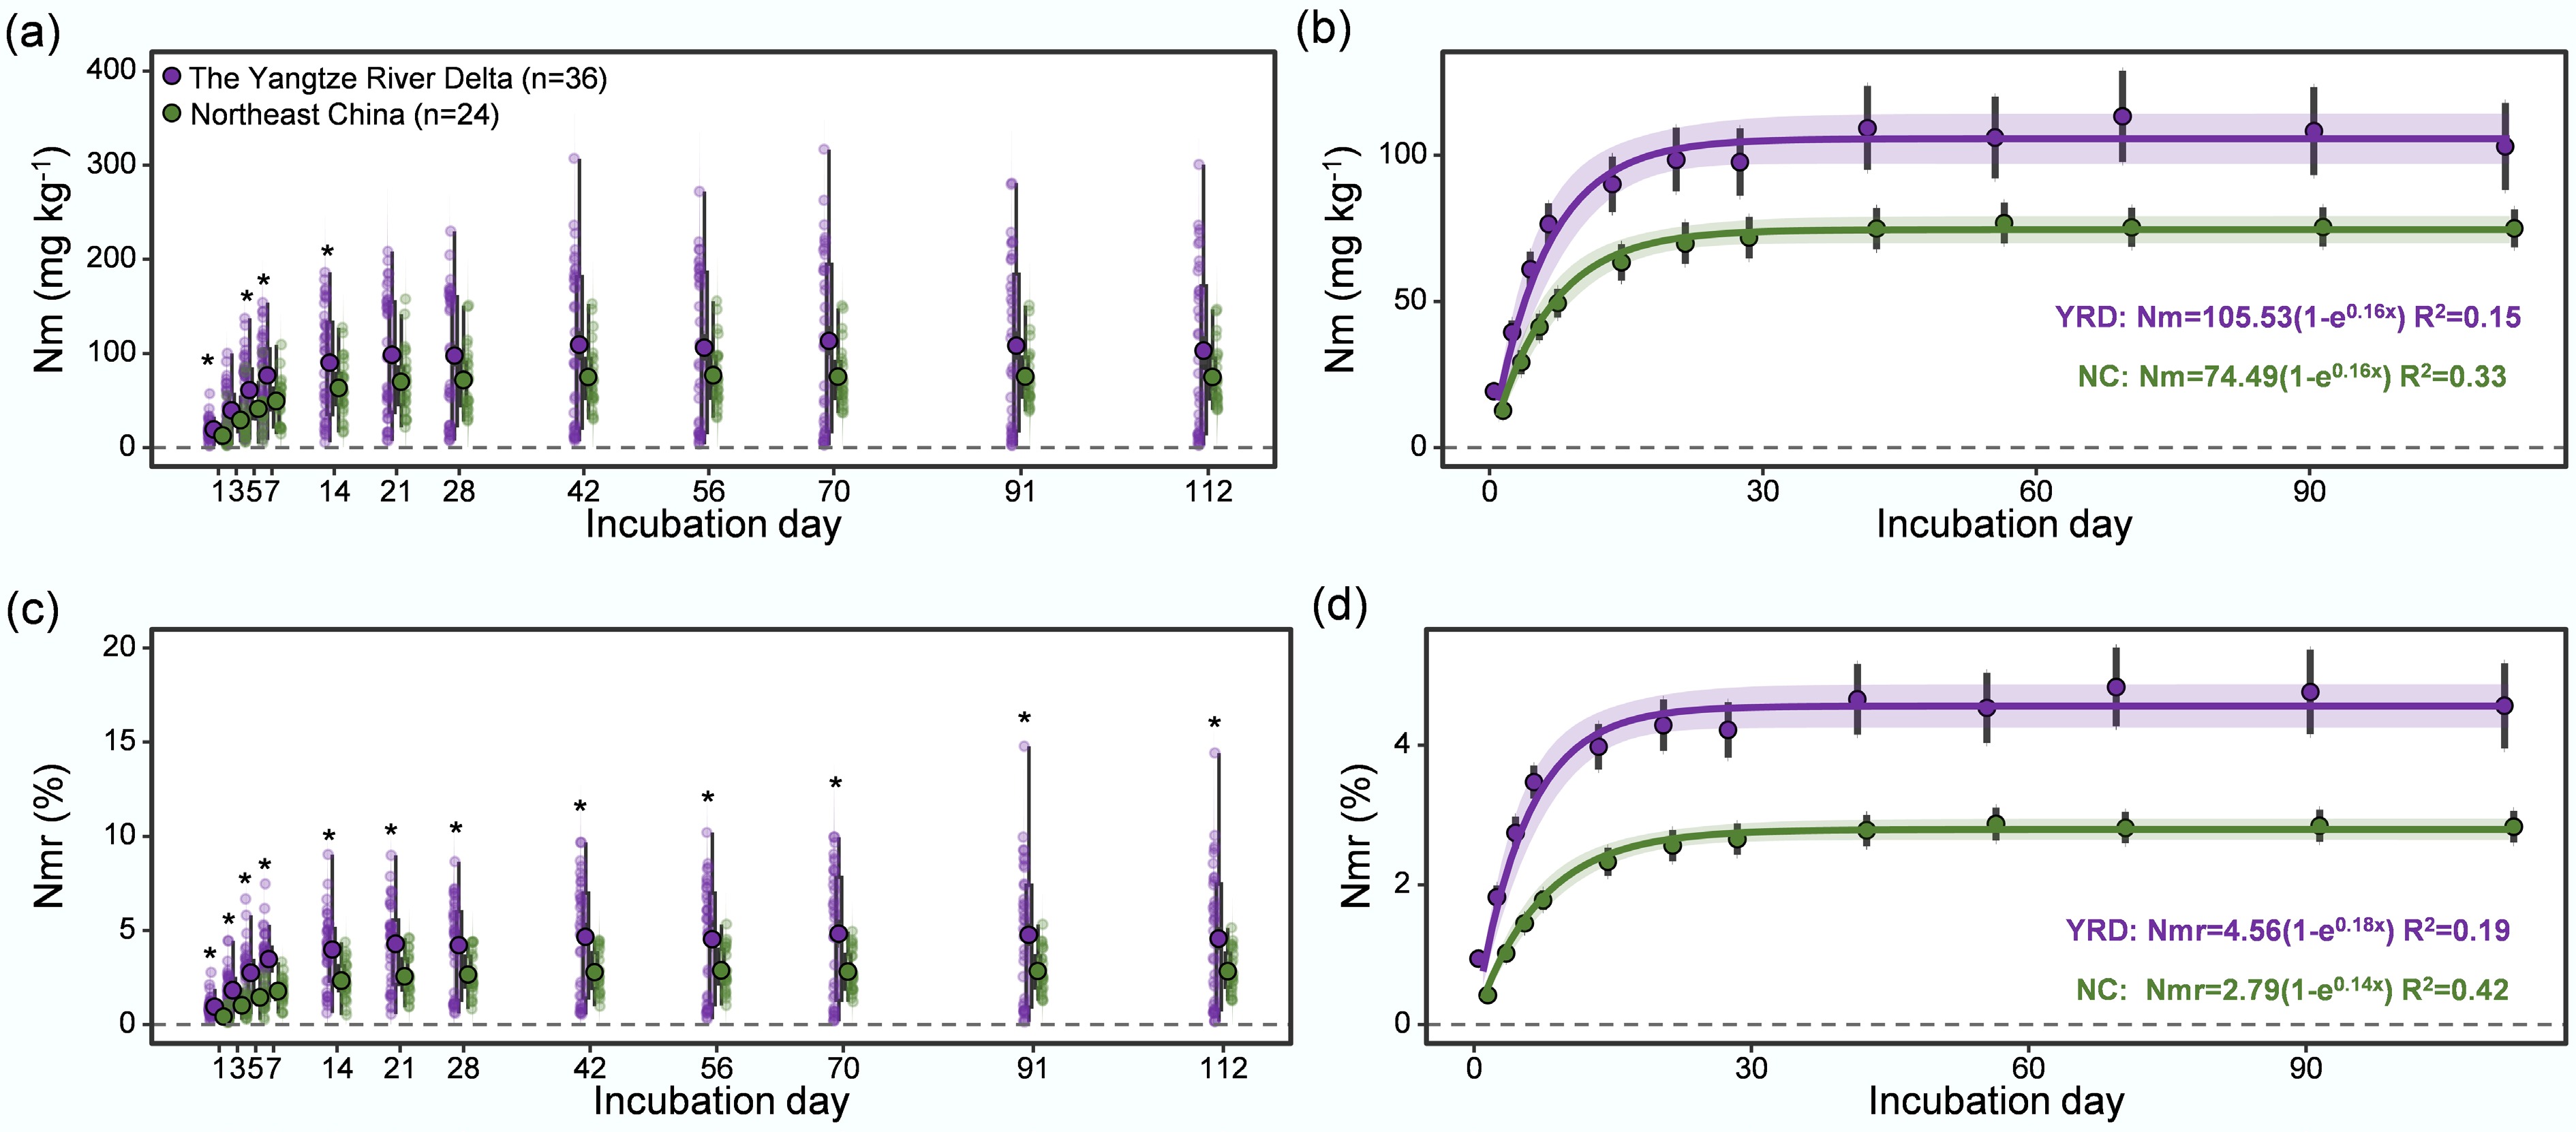
Figure 1.
(a) Nitrogen mineralization (Nm), (c) nitrogen mineralization ratio (Nmr), and One-pool model for average (b) Nm, and (d) Nmr during a 112-d anaerobic incubation at 30 °C under soil samples from the Yangtze River Delta (YRD), and Northeast China (NC). Nm represents the amount of cumulative mineralized NH4+-N. Nmr represents the ratio of the amount of cumulative mineralized NH4+-N to the total soil nitrogen content (TON). The purple and green solid circles represent the means for 36 and 24 samples in the YRD and NC, respectively. N, sample size. * Significant difference between two regions (p < 0.05).
Although soils from the YRD sites contained lower TN concentrations than those from the NC sites, they exhibited significantly higher Nmr, that is, Nm per unit of TON, throughout the incubation period (Fig. 1c). Unlike Nm, the difference in Nmr between the two sites remained significant (p < 0.01) across all incubation times, with the Nmr potential in the YRD soils being approximately 63% higher than that in the NC soils (Fig. 1d).
The relationship between short-term and long-term incubation
-
During the 112-d incubation period, a broad range of Nm values was observed in soils from representative rice-growing sites in the YRD and NC. To identify the minimum incubation time capable of reliably reflecting long-term mineralization dynamics (LTNm), Spearman's rank correlation coefficients (r) were calculated between Nm values at each earlier incubation day and those at 112 d. The correlation coefficient increased with incubation time but showed only marginal improvement beyond a particular duration (Fig. 2a, c). Based on this relationship, the threshold incubation length was determined to be 7 d for the YRD soils, and 14 d for the NC soils (Fig. 2a, c). Under these respective incubation periods, Nm exhibited strong correlations with LTNm, with determination coefficients (R2) of 0.57 for the YRD sites and 0.75 for the NC sites (Fig. 2b, d).
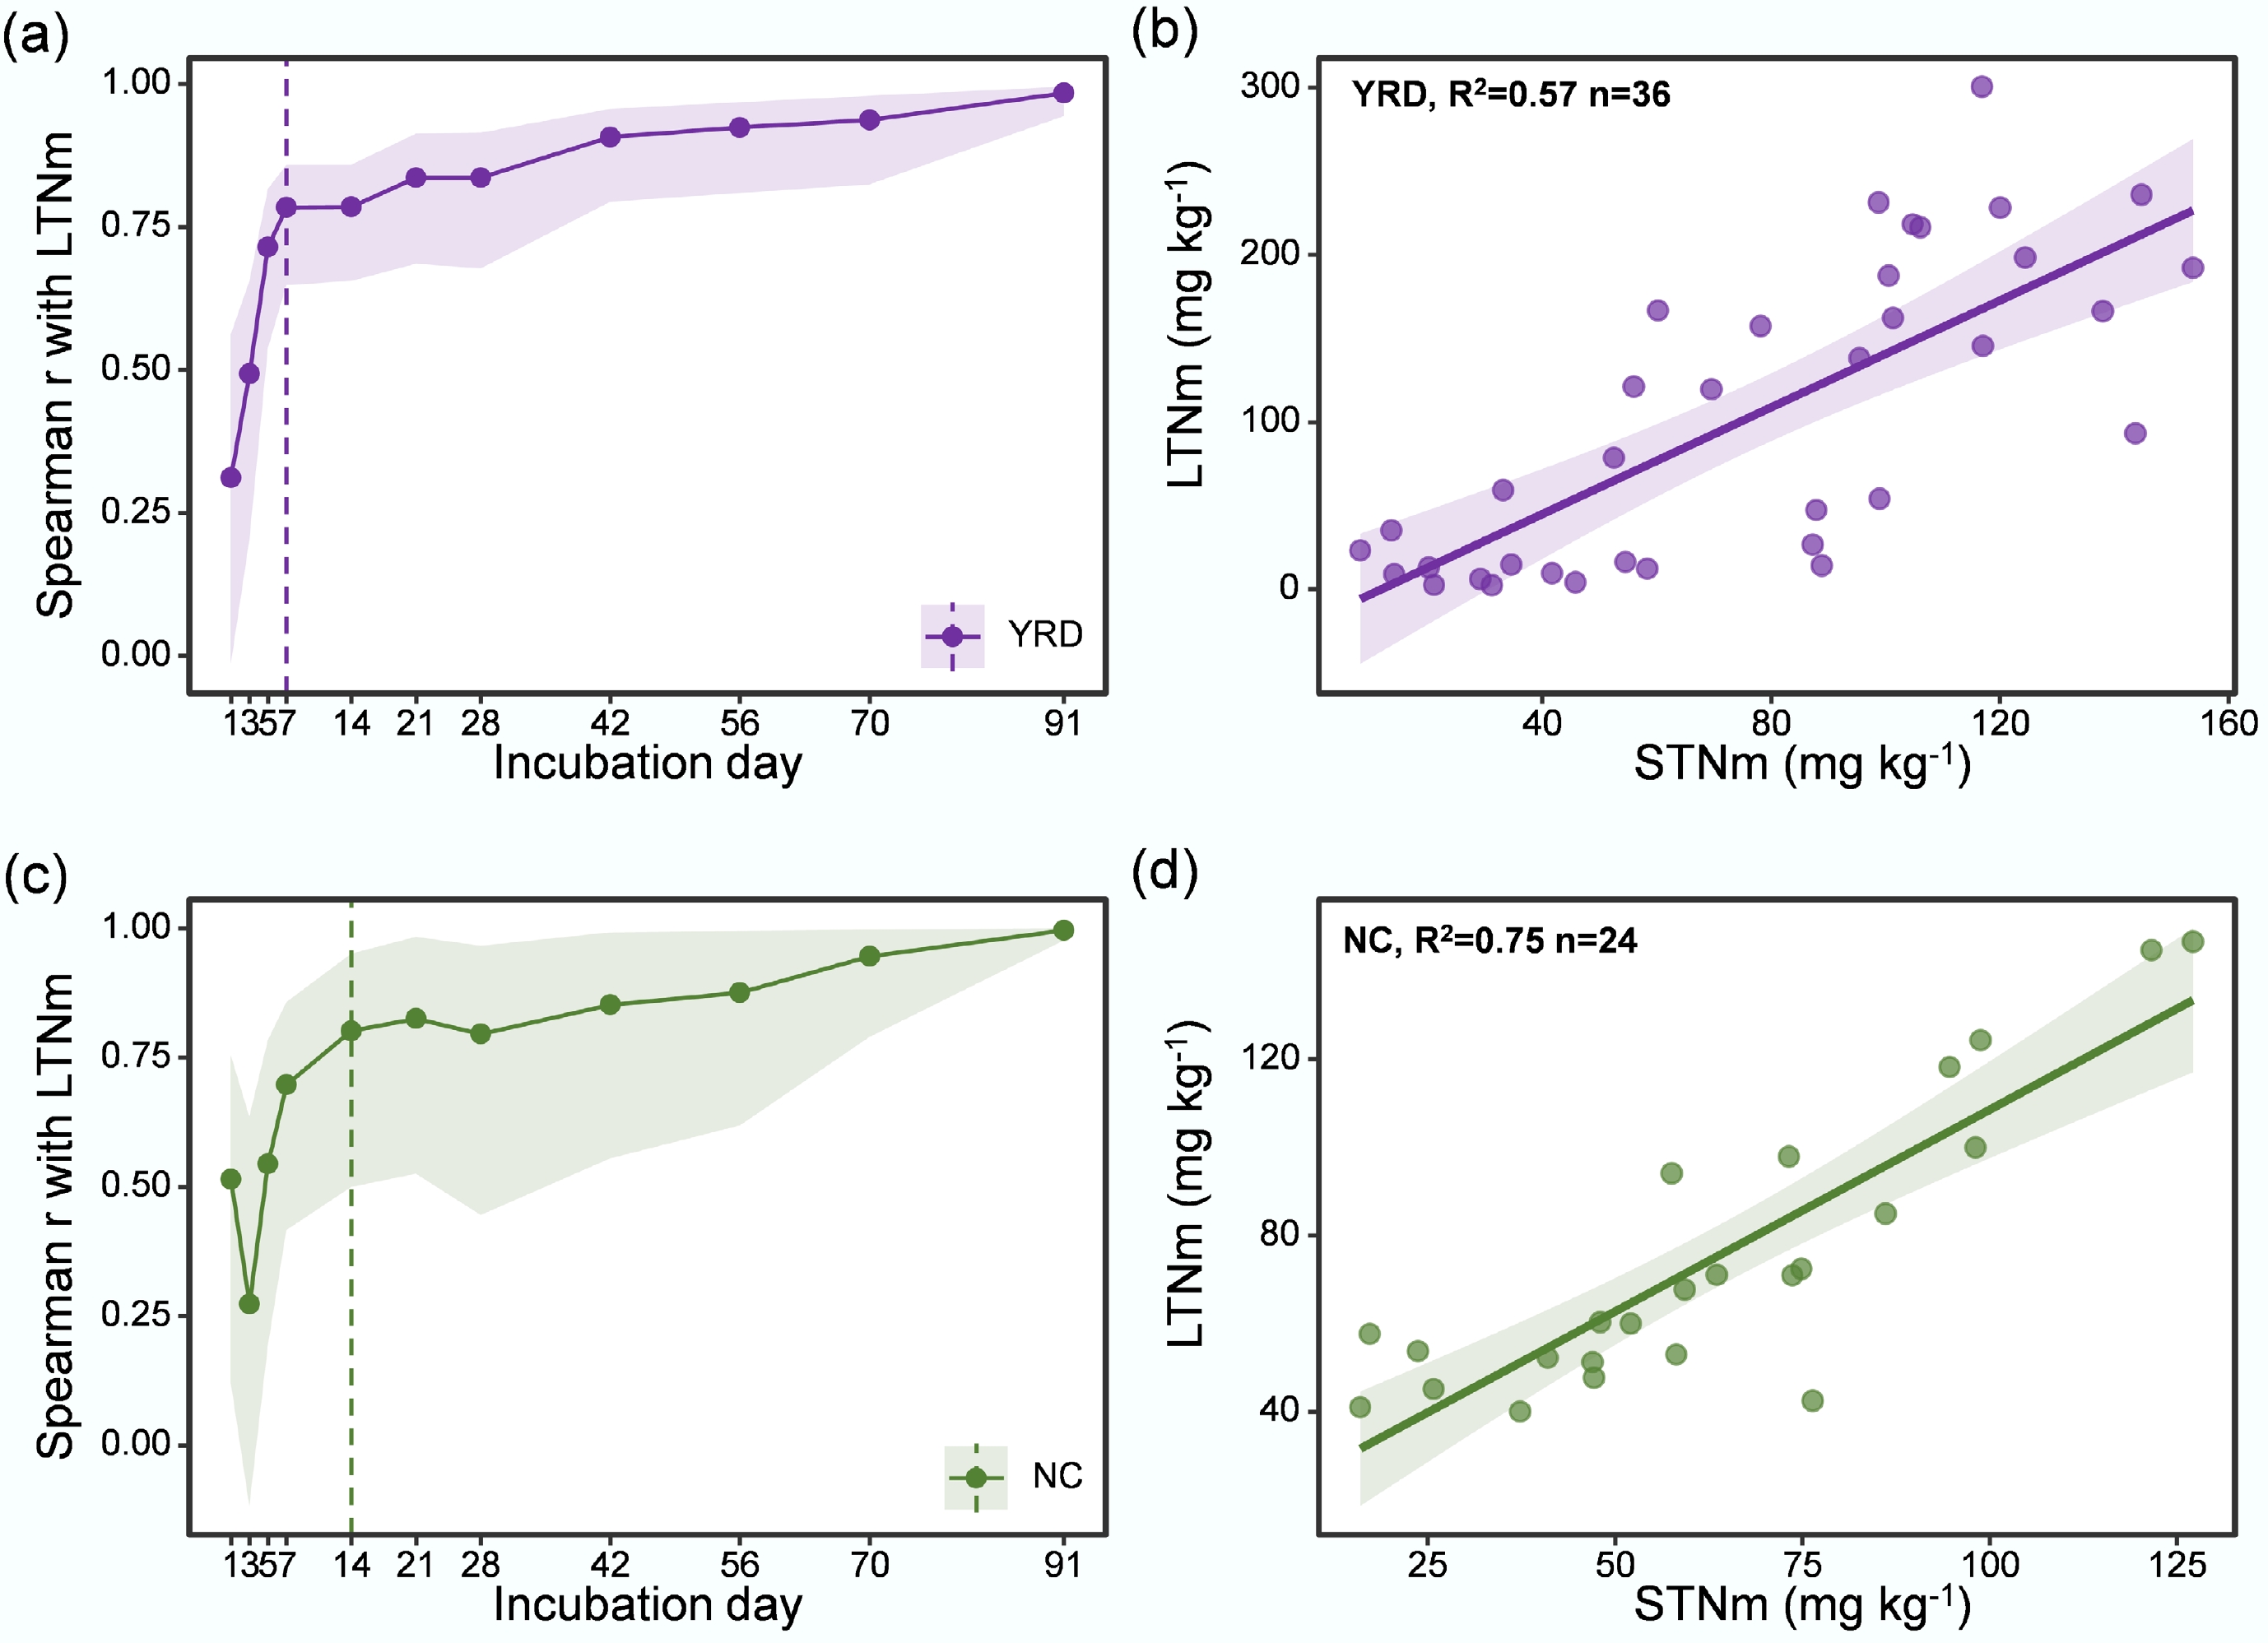
Figure 2.
Relationship of short-term Nm (STNm) with LTNm in the (a), (b) YRD, and (c), (d) NC, respectively. Abbreviations were as in Fig. 1. Shadows represent a 95% confidence interval. Dashed vertical lines denote thresholds for Spearman r to determine the shortest incubation day to represent LTNm. For YRD and NC, the best STNm incubation days were 7 and 14, respectively.
The trend in the correlation r between Nmr at each incubation day, and that at 112 d followed a pattern similar to that observed for Nm. The correlation increased rapidly during the early incubation phase and then plateaued, indicating that extended incubation provided limited additional explanatory power. Based on the criterion, the shortest representative incubation period capable of reflecting LTNmr was identified as 21 d for the YRD soils, and 14 d for the NC soils (Supplementary Fig. S4a, S4c). Under these incubation durations, STNmr exhibited strong and significant relationships with LTNmr, with R2 of 0.53 for the YRD soils, and 0.63 for the NC soils (Supplementary Fig. S4b, S4d).
The relationship between rapid extraction and long-term incubation
-
Rapid extraction tests revealed clear regional contrasts in labile organic N pools (Fig. 3a). Across all extractants (NaHCO3, cold water, hot water), UV-absorbing fractions and extractable N concentrations were consistently higher in the YRD soils than in those from NC (Fig. 3a). The HWETN and HWEON also showed pronounced differences between the two areas. The HWETN averaged 47.4 mg kg−1 in the YRD soils and 18.6 mg kg−1 in the NC soils, while the corresponding HWEON values were 24.7 and 16.0 mg kg−1, respectively. These findings indicated that soils from the YRD sites contained a greater proportion of easily hydrolysable N compounds responsive to mild extractants, consistent with their more vigorous short-term mineralization activity.
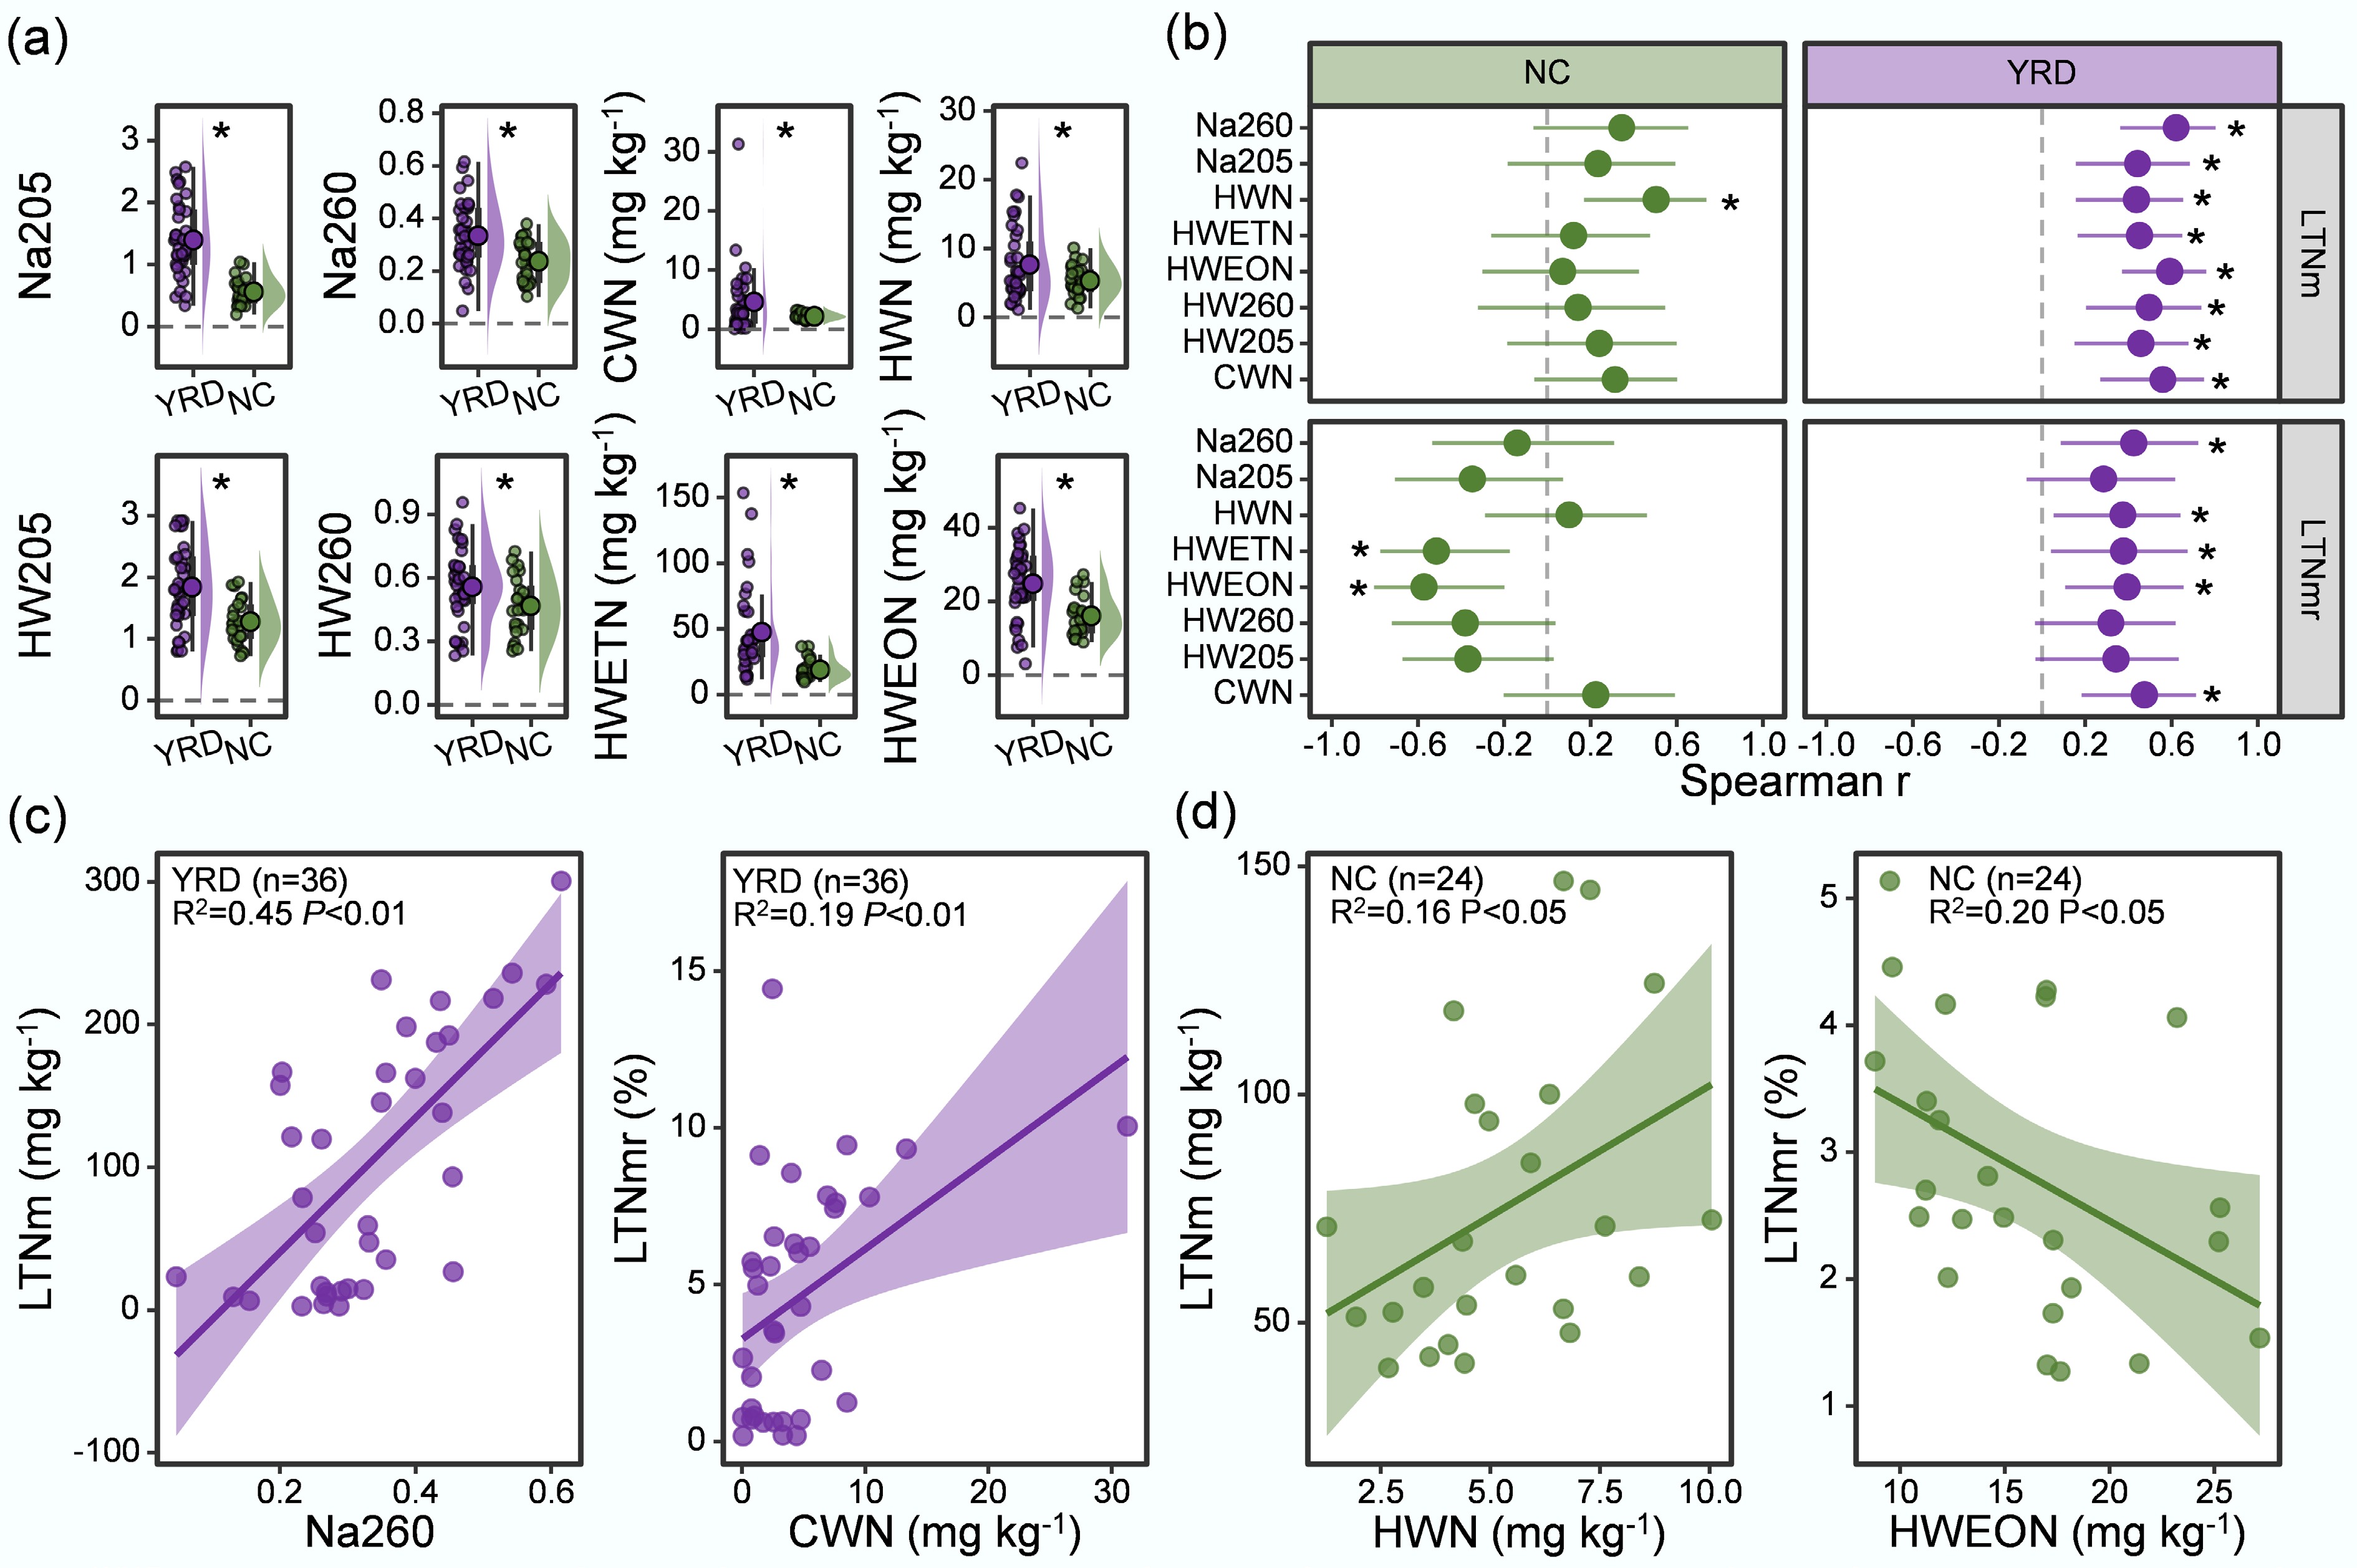
Figure 3.
(a) The rapid extraction results from paddy soils in the two rice-growing regions studied. (b) The Spearman correlation coefficients obtained using rapid extractions with long-term Nm (LTNm) and long-term Nm ratio (LTNmr) in the YRD and NC. (c) The linear relationships between Na260 with LTNm and between CWN with LTNmr in the YRD. (d) The linear relationship between HWN with LTNm and between HWEON with LTNmr in NC. Abbreviations were as in Fig. 1. Na205, Na260, HW205, and HW260 represent the ultraviolet absorbance values obtained using the 0.01 mol L−1 NaHCO3 and hot water extractions at 205 and 260 nm, respectively. CWN and HWN represent the NH4+-N content obtained from cold- and hot-water extractions, respectively.
Rapid extraction indices showed significant correlations with LTNm in both regions, but differed in their dominant predictors (Fig. 3b). In the YRD soils, Na260 showed the strongest correlation with LTNm (Spearman r = 0.62). In contrast, for the NC soils, the NH4+-N extracted using hot water was significantly (p < 0.05) correlated with LTNm (r of 0.75, Fig. 3b). Overall, the rapid extraction indices displayed stronger associations with LTNm in the YRD soils than in the NC soils. Similarly, the patterns for the LTNmr differed between the two typical soil groups. In the YRD soils, CWN showed the best correlation with LTNmr (r = 0.47), whereas in the NC soils, the HWEON was the most effective predictor (r = 0.57; Fig. 3b).
Linear regressions demonstrated strong predictive relationships between the rapid extraction indices and both LTNm and LTNmr in soils from these two rice-growing regions (Fig. 3c, d). For the YRD soils, Na260 showed a significant (p < 0.05) predictive relationship with LTNm, explaining 45% of its variation, whereas in the NC soils, the HWN accounted for 16% of the variation. Regarding LTNmr, the best-performing indicators differed between soil groups. In the YRD soils, CWN exhibited the strongest predictive power, explaining 78% of the variation in LTNmr (p < 0.01), while in the NC soils, the HWEON explained 20% of the variation (p < 0.01). These modest coefficients of determination are typical for single chemical or labile-N indices applied across heterogeneous soils, where mineralization reflects the combined influence of organic matter quality, texture, and pH rather than any single pool. It showed that simple, rapid extraction parameters can serve as efficient predictors of both LTNm and LTNmr, though the optimal predictors differ across typical paddy soil environments.
The soil factors affecting site-specific differences on LTNm and LTNmr
-
In soils from the representative rice-growing sites, LTNm exhibited significant correlations (p < 0.05) with multiple physicochemical properties. Specifically, in the YRD soils, LTNm was positively associated with TN (Spearman r = 0.62), TOC (r = 0.61), mineral N (r = 0.62), and CEC (r =0.51), and negatively associated with pH (r = −0.79, Fig. 4a). In the NC soils, significant negative correlations were observed between LTNm and pH content (r = −0.74, p < 0.05; Fig. 4a). For the LTNmr, distinct influencing factors were also identified across the two typical soil environments. In the YRD soils, LTNmr was significantly correlated with CEC (r = 0.51), TN (r = 0.34), TOC (r = 0.41), mineral N (r = 0.52), and pH (p < 0.05), while in the NC soils, pH, TN, and CEC were the dominant controlling factors.

Figure 4.
(a) The Spearman correlation coefficients obtained using the soil physicochemical properties with long-term Nm (LTNm) and long-term Nm ratio (LTNmr) in the YRD and NC. (b) The linear relationship between pH with LTNm and LTNmr in the two regions. Shaded areas denote 95% confidence intervals. Abbreviations are as in Fig. 1. TN, total soil nitrogen content. TOC, total organic carbon content. C/N, TOC to TN ratio. CEC, cation exchange capacity.
Among the significant factors influencing LTNm and LTNmr in soils from the representative rice-growing sites, soil pH emerged as the dominant variable (Fig. 4a). In the YRD soils, pH alone accounted for 59% of the variation in LTNm and 49% of the variation in LTNmr (Fig. 4b). In contrast, in the NC soils, pH explained 17% and 34% of the respective variability (Fig. 4b). It showed that soil acidity–alkalinity plays a critical but site-specific role in regulating Nm processes.
SEM further clarified region-specific control pathways (Fig. 5a, c). In the YRD soils, LTNm was directly influenced by Na260 and pH, while TOC and mineral N affected LTNm indirectly through Na260 (Fig. 5b). In the NC soils, pH exerted the most substantial direct effect, with HWN serving as an additional direct predictor. For LTNmr, pH was the principal direct driver in the YRD soils (Supplementary Fig. S5a, S5b). CEC and mineral N had notable indirect effects via pH (Supplementary Fig. S5b). In the NC soils, HWEON had a direct adverse impact on LTNmr (−0.44), while TN, clay content, and pH indirectly affected LTNmr through HWEON (Supplementary Fig. S4d). pH had direct effects on LTNmr in the YRD, with path coefficients of −0.69 (Supplementary Fig. S4a, S4b). CEC and mineral N indirectly affect LTNmr through their impacts on pH (Supplementary Fig. S5b). The direct effects of HWEON on LTNmr were −0.44 in NC. TN, Clay, and pH affect LTNmr by influencing HWEON in NC soils (Supplementary Fig. S5d). Collectively, these findings highlight that different N pools and soil properties dominate the control of LTNm and LTNmr across typical paddy soil environments, emphasizing the interactive effects of pH and labile N fractions in regulating Nm.
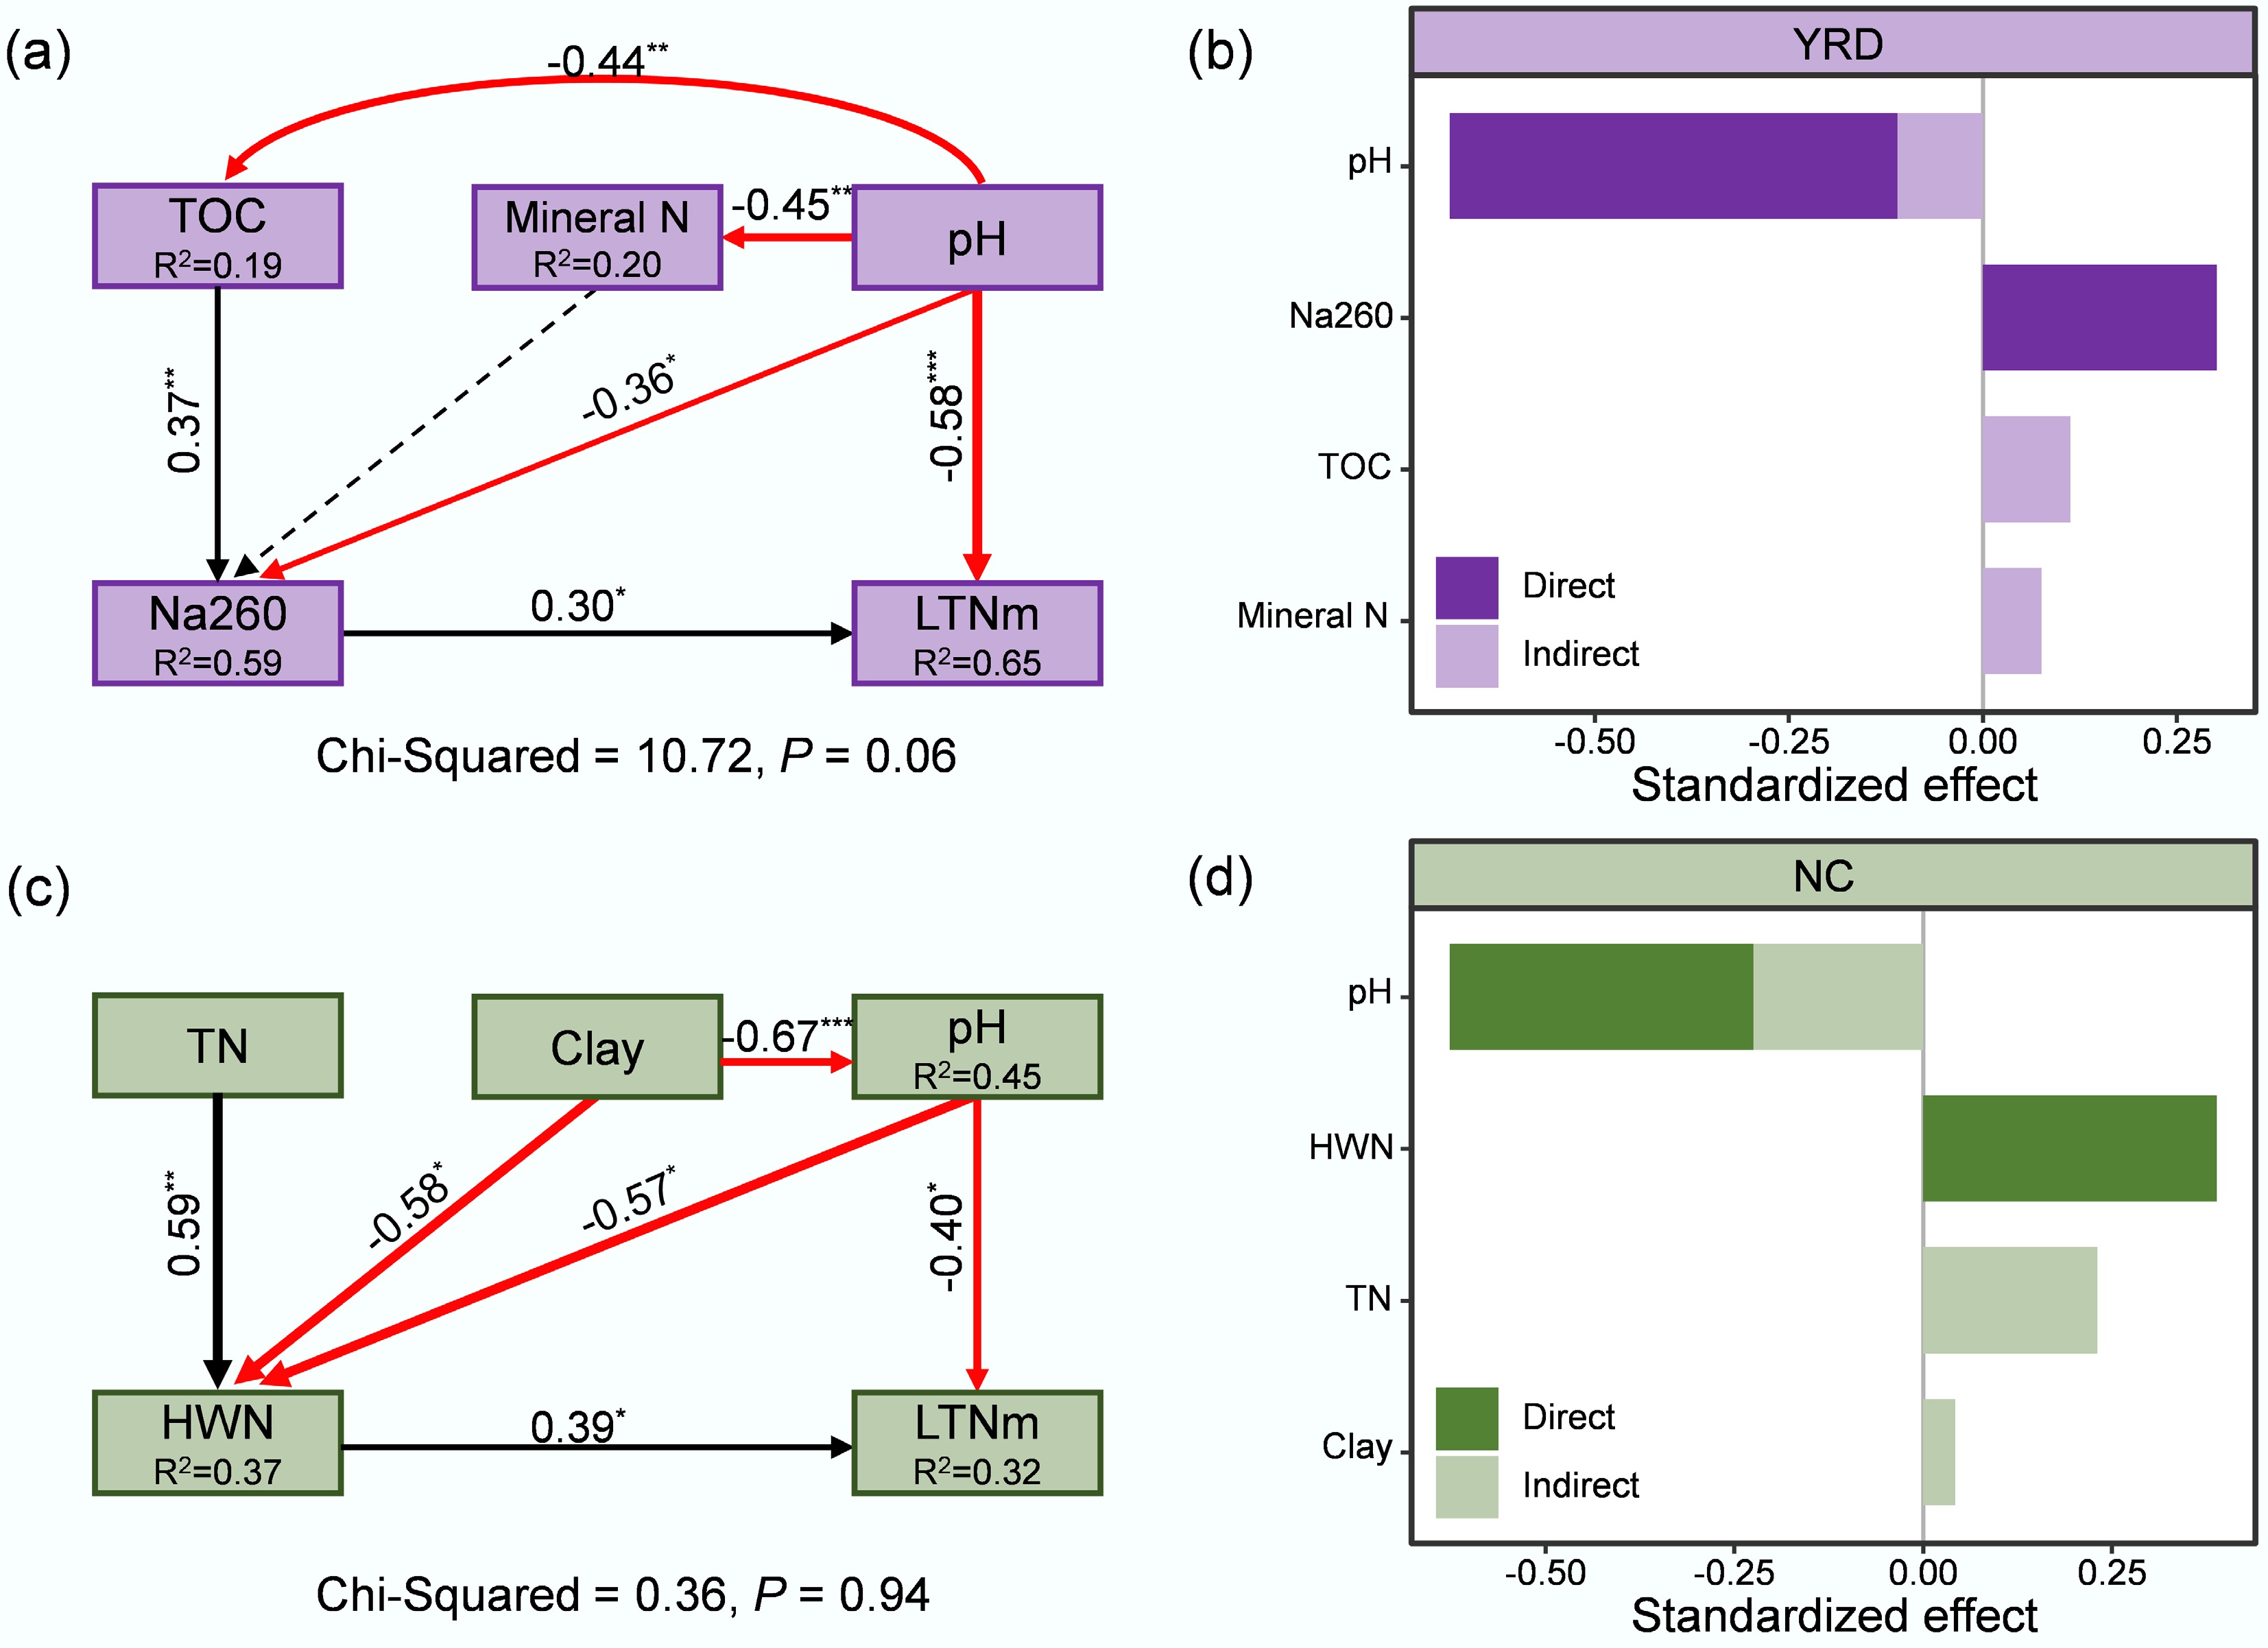
Figure 5.
(a), (c) The structure equation modeling analysis showing the effects of soil physicochemical properties and rapid extraction indices on LTNm in the typical paddy soils of the YRD and NC. (b), (d) Standardized direct and indirect effects of key factors on LTNm in the two regions. The Chi-square (χ2) test evaluates the overall goodness of fit between the proposed model and the observed data. Abbreviations are consistent with those in Fig. 1. ** p < 0.01; *** p < 0.001.
Development and validation of multivariate prediction models for LTNm and LTNmr
-
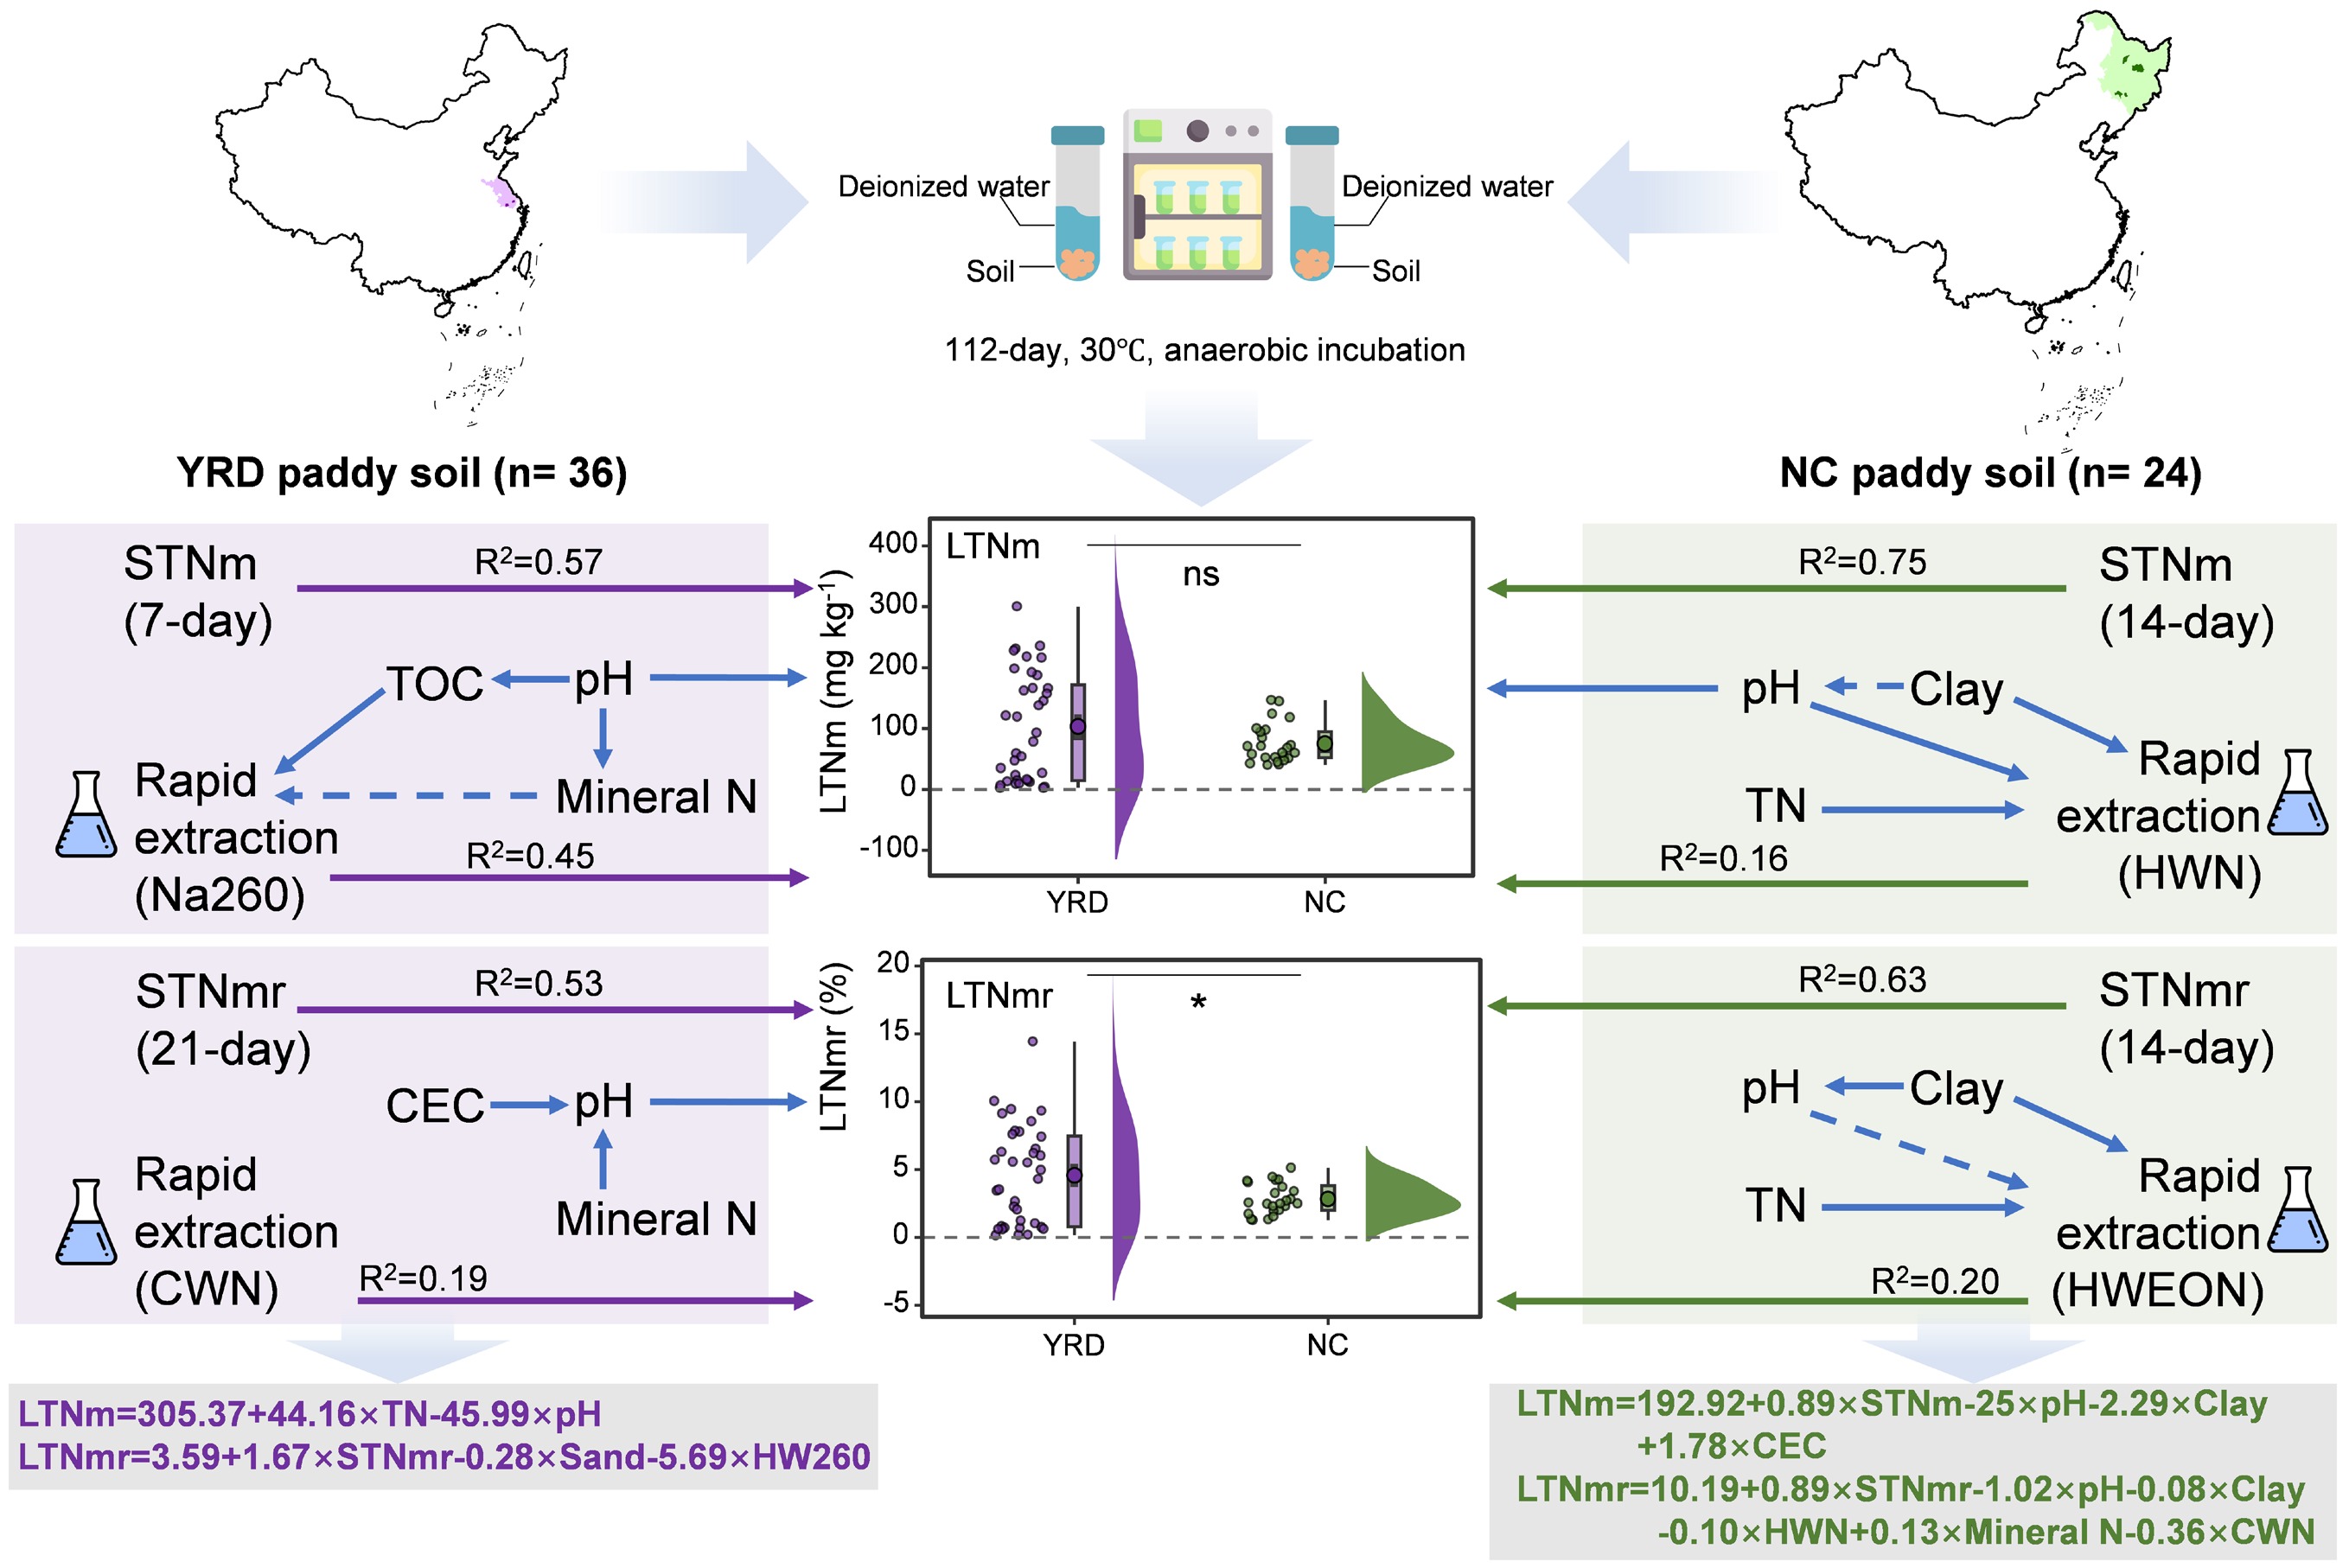
In soils from the representative YRD rice-growing sites, a multivariate regression model incorporating TN and pH provided the best prediction of LTNm, explaining 68% of the variation (Table 1; Fig. 6a). In this model, LTNm increased with higher TN but decreased with increasing pH. For the NC soils, the optimal LTNm model included pH, STNm, CEC, and clay content, achieving an 88% explanatory power (Table 1; Fig. 6c). In this case, LTNm was positively influenced by STNm and CEC, while higher pH and clay content reduced mineralization potential. Ten-fold cross-validation of these site-specific models yielded predictive accuracies of 63% and 75% for the YRD and NC soils, respectively, confirming the stability of the fitted relationships (Fig. 6a, c).
Table 1. The stepwise regression equation obtained using the soil physicochemical properties and rapid extractions to predict the LTNm and LTNmr in the YRD and NC
Regions Dependent variable Independent variable p value R2 Regression equation YRD (n = 36) LTNm TN, pH < 0.001 0.68 LTNm = 305.37 + 44.16 × TN − 45.99 × pH LTNmr C/N, STNmr, pH, Sand, HW260 < 0.001 0.88 LTNmr = 3.59 + 1.67 × STNmr − 0.28 × Sand − 5.69 × HW260 NC (n = 24) LTNm pH, Clay, STNm, CEC < 0.001 0.83 LTNm = 192.92 + 0.89 × STNm − 25 × pH − 2.29 × Clay + 1.78 × CEC LTNmr pH, Clay, HWN, Mineral N, CWN, STNmr < 0.001 0.84 LTNmr = 10.19 + 0.89 × STNmr − 1.02 × pH − 0.08 × Clay − 0.10 × HWN + 0.13 × Mineral N − 0.36 × CWN LTNm and LTNmr represent the long-term nitrogen mineralization and long-term nitrogen mineralization ratio, STNm and STNmr represent the short-term nitrogen mineralization at 7 and 14 d in the YRD and NC, and short-term nitrogen mineralization ratio at 21 and 14 d in the YRD and NC, respectively. 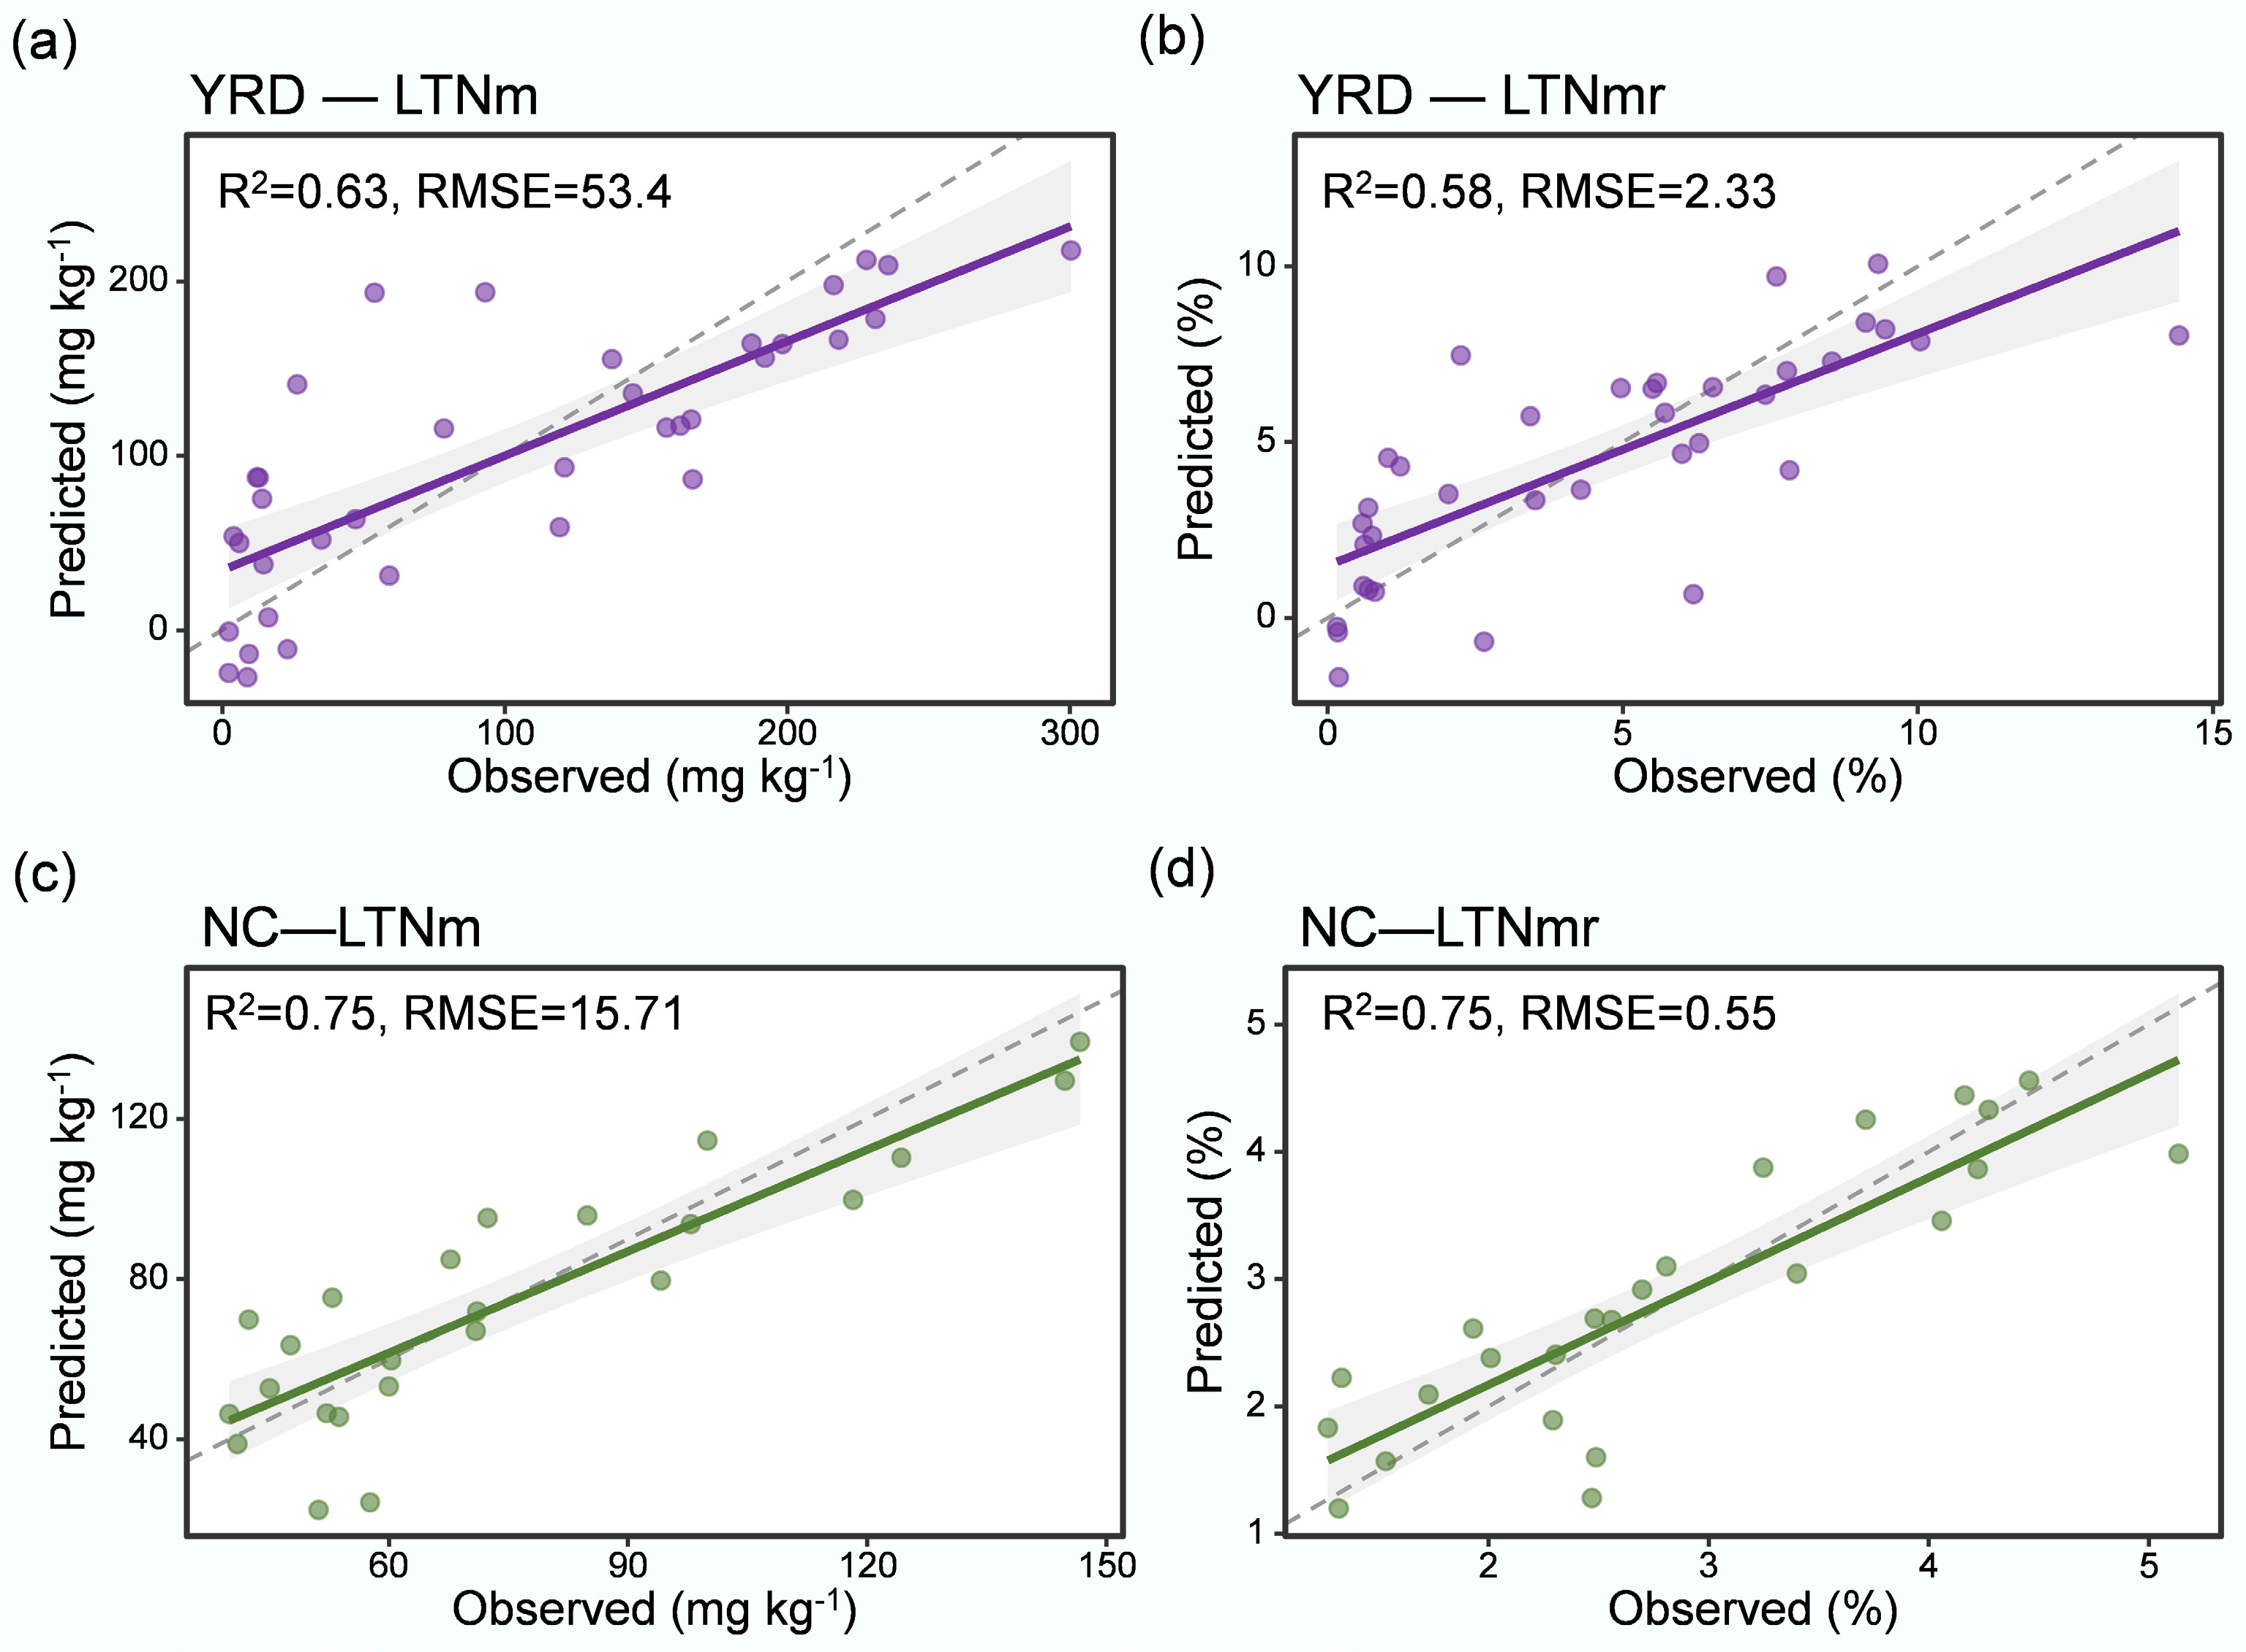
Figure 6.
(a), (c) Predicted long-term Nm (LTNm), and (b), (d) long-term Nmr (LTNmr) for typical paddy soils in the YRD and NC, derived from stepwise multiple regression models incorporating the factors listed in Table 1. Abbreviations are consistent with those in Fig. 1. Shaded areas denote 95% confidence intervals. RMSE, root mean square error.
For LTNmr, the predictive models also differed between the two typical paddy soil environments. In the YRD soils, a model including C/N, HW260, pH, sand, and STNmr explained 88% of the variance (Table 1; Fig. 6b). Higher STNmr and lower HW260 and sand content were associated with greater LTNmr, indicating the combined influence of short-term mineralization and labile organic N on mineralization efficiency. In contrast, for the NC soils, the best-fitting model included pH, clay, HWN, mineral N, CWN, and STNmr, explaining 84% of the variance (Table 1; Fig. 6d). In this model, LTNmr increased with STNmr and mineral N but declined with higher pH, clay, and HWN values (Table 1). Ten-fold cross-validation confirmed strong predictive reliability, with 58% and 75% of the variance explained for the YRD and NC soils, respectively (Fig. 6b, d). Overall, these results demonstrated that integrating rapid extraction indices and short-term incubation data with key soil physicochemical properties substantially enhances the accuracy of LTNm and LTNmr predictions in typical rice-growing soil systems.
-
The contrasting Nm behaviors observed between the YRD and NC soils illustrate how Nm dynamics are shaped by region-specific soil formation environments rather than by absolute nutrient stocks (Fig. 1b). Instead of mirroring differences in TN content, the stronger Nm response in the YRD points to a system where organic matter undergoes faster biochemical turnover (Supplementary Fig. S3). Conversely, the subdued Nm response in the NC black soils suggests that a considerable share of their organic N is chemically stabilized or microbially inaccessible. These findings align with previous research, which reported that cumulative Nm in gleyed paddy soil from the YRD (23.7 mg kg−1) exceeded that in black paddy soil from the NC (16.0 mg kg−1), with respective primary mineralization rates of 2.95 mg kg−1 d−1 and 0.20 mg kg−1 d−1 during 21-d anaerobic incubation without N fertilization[39]. However, it focused on two benchmark soils and a short (21-d) incubation window, and therefore could not establish whether the observed contrast is representative at the regional scale. By contrast, this study evaluates 36 YRD and 24 NC paddy soils under a much longer 112-d incubation, showing that the higher Nm of YRD soils is a consistent regional pattern rather than a site-specific anomaly. Collectively, these results provide strong evidence that the two typical rice-growing soils possess distinct Nm capacities and transformation efficiencies, supporting the hypothesis that environmental and soil physicochemical contrasts drive region-specific Nm behavior.
Soil Nm is governed by multiple interacting factors, including substrate quality and soil physicochemical properties. Previous studies have demonstrated that the pH, TN, TOC, and clay content are key determinants of Nm in paddy soils[40,41]. For instance, Li et al.[12] reported significant correlations between these variables and Nmr in Jiangsu Province, where fertilizer regimes, water management, and crop rotations were tightly controlled, which partially aligns with our findings that TN, TOC, and pH were significantly correlated with LTNm in soils from the YRD soils (Fig. 4a). Under such location-experiment conditions, TN, and related bulk C-N indicators effectively integrate the cumulative effects of repeated fertilization and thus emerge as dominant predictors of Nm. In the present study, by contrast, soils were sampled from fields managed under typical local farming practices, with more heterogeneous rotations and tillage histories; under these real-world conditions, TN, TOC, and pH remain essential, but their effects are expressed alongside those of texture and labile N pools, indicating a more complex control on LTNm. Similar relationships were also observed in black paddy soils with varying reclamation histories in NC, where TN and C/N were identified as the principal controls of Nm rates[20]. These results collectively suggest that both the quantity and decomposability of organic matter determine the extent of Nm, but the strength of these controls differs between soil types. The mechanistic path analysis further clarified these site-specific relationships. In the YRD soils, Na260, and pH exerted the most potent direct effects on LTNm, reflecting the acid–base conditions on microbial mineralization potential. In contrast, in the NC soils, TN, clay, HWN, and pH were the dominant drivers of LTNm (Fig. 5c), consistent with previous findings that soil acidity exerts a stronger constraint on mineralization activity in black paddy soils due to differences in clay mineralogy and organic matter composition[26,42]. Overall, these findings indicate that while TN content is a universal driver of mineralization potential, the interaction between pH and organic matter quality modulates N mineralization differently across these two typical rice-growing soil systems.
Long-term incubation remains the most widely accepted benchmark for quantifying the potential mineralizable N pool (N0), yet its operational constraints make it unsuitable for routine use[16,19]. For this reason, defining short-term incubation windows that reliably approximate long-term dynamics is essential for developing efficient, scalable Nm assessment frameworks. In this study, instead of relying on fixed incubation durations, a threshold-based approach was employed to determine the shortest incubation period that maintains a sufficiently strong correspondence with LTNm (Fig. 1a, c). The fact that different soil types required different minimum incubation durations reflects inherent contrasts in organic matter quality, stabilization mechanisms, and microbial activation rates (Fig. 2a, c). Paddy soils formed under warm, humid, and gleyed conditions typically contain a larger fraction of hydrolysable or microbially processed organic N and therefore reach their representative threshold more rapidly. In contrast, soils developed under colder climates or enriched in humified organic matter often contain a greater proportion of physically or chemically protected N forms, which prolong the transition from initial microbial reactivation to sustained mineralization. This pattern aligns with evidence showing that substrate lability and organo–mineral associations govern the rate at which soils progress through the early mineralization phases that dominate long-term N release[16,43]. It highlights that any universal short-term proxy is unlikely to apply across contrasting soil systems; instead, incubation length should be adapted to regional soil characteristics and their dominant stabilization–decomposition pathways.
The strong performance of rapid chemical extractions across the two soil regions demonstrate their potential as mechanistically meaningful surrogates for long-term incubation–derived Nm metrics. Notably, the predictive strengths of individual extractants differed between the YRD and NC soils (Fig. 3c, d). These region-specific predictive strengths emphasize that these assays do not act as universal proxies but instead reflect region-specific organic matter chemistry and microbially accessible N pools. The mechanistic path-analysis results further elucidated these patterns (Fig. 5b). Multiple studies across contrasting agroecosystems report that these operationally defined pools co-vary with mineralization capacity and often explain a substantial proportion of spatial variation in LTNm, highlighting their functional relevance[13]. A key reason why weak-alkali and hot-water extractions track cumulative mineralization lies in their chemical selectivity. Hot water mobilizes labile, hydrolysable organic N (amino-N, peptides, microbial products) that microbes mineralize early in incubation, while NaHCO3 solubilizes microbially derived/UV-active organic matter; the resulting UV205/UV260 signals contain quality information about DON that aligns with observed short-term and cumulative Nm dynamics[44]. Rather than acting as replacements for incubations, these methods provide scalable, spatially responsive indicators of mineralizable N, enabling broader landscape-level assessments that long-term incubations alone cannot achieve.
Establishment and accuracy of the site-specific LTNm and LTNmr models
-
The contrasting performances of single-factor models across the two paddy soil regions highlight that no universal predictor of LTNm or LTNmr exists. Instead, the explanatory power of any individual soil property or extraction index is inherently shaped by regional pedogenic environments and organic matter characteristics. This is consistent with earlier studies showing that the explanatory power of TN, C/N, or pH varies substantially with soil texture and the degree of organic matter stabilization, and that single predictors rarely capture more than a modest share of Nm variability in heterogeneous soils[45,46]. The regional divergence in rapid extraction indices likewise highlights their context-dependent nature. UV-active or hydrolysable fractions may be statistically significant. Still, their predictive capacity remains inherently constrained because they represent only a portion of the mineralizable substrate and do not account for protection mechanisms in clay-rich or humified soils[33,47]. This behavior aligns with evidence that extractable organic N indicators explain limited variance when used alone and perform best when embedded in multivariate frameworks that incorporate soil physical and chemical factors (Table 1). This agrees with evidence that the effective duration for short-term incubation depends on the size and accessibility of the labile organic N pool[48]. Collectively, these results underscore that single-factor relationships provide only partial insight into Nm behavior, and that reliable long-term Nm prediction requires calibration to region-specific soil properties rather than relying on any single indicator.
The stepwise multivariate regressions markedly improved prediction accuracy for both LTNm and LTNmr compared with single-factor fits. Whereas individual soil or chemical variables explained less than 45% of the variance in LTNm, the integrated models incorporating soil physicochemical factors, rapid extraction indices, and short-term incubation parameters explained up to 75% for LTNm and LTNmr after 10-fold cross-validation (Fig. 6). This improvement demonstrates that Nm is a multi-mechanistic process governed jointly by substrate quantity (e.g., TN, TOC), substrate quality (e.g., HW260, Na260), and environmental constraints (e.g., pH, clay, CEC)[49−51]. In the southern paddy soils, models anchored by TN and pH performed best for LTNm, whereas in finer, clay-rich, more humified NC soils, accurate LTNm prediction required adding STNm, CEC, and clay (Table 1). Similar soil-type dependencies in model structure and predictor importance have been reported for paddy soils and broader mineralization datasets: single correlations with pH, clay, and CEC often appear weak or inconsistent, yet multiple regression frameworks that integrate these variables become significant and substantially improve explained variance[52,53]. Overall, the present results confirm that stepwise multivariate frameworks capture the interactive controls on mineralization far more effectively than single-factor models, but their transferability across soil types remains limited.
Uncertainty and implication of site-specific Nm models
-
While this study elucidated the relationships among soil physicochemical properties, rapid extraction indices, and Nm in typical paddy soils, several uncertainties remain. First, the experiments were conducted under constant temperature and moisture conditions, which do not fully represent field environments where temperature and water fluctuations strongly influence mineralization rates and microbial turnover. Further research should quantify the temperature sensitivity coefficient (Q10) of Nm to enable model correction across climatic gradients, as temperature has been shown to alter mineralization kinetics and N availability in paddy systems[54]. Moreover, because rice cultivation alternates between wet and dry periods, future experiments should explicitly evaluate moisture and precipitation variability, as these factors can accelerate or suppress Nm depending on redox dynamics. Additionally, this study was conducted without N fertilizer application, and therefore, regional Nm characteristics with N fertilizer addition will be identified in follow-up studies. Another important source of uncertainty lies in the behavior of fixed ammonium, which is mineralized primarily from soil organic N but can also be immobilized and re-released from mineral lattices. Schimel & Bennett[4] emphasized that the dynamic equilibrium between microbial uptake and mineral fixation strongly governs the availability of N. In paddy soils, previous studies have shown that gleyed soils exhibit a stronger NH4+ fixation capacity than black paddy soils, thereby influencing adequate N supply during rice growth[39]. Extending this understanding of NH4+ fixation–release dynamics to regional scales will improve the prediction of both N supply potential and retention capacity across diverse rice ecosystems.
Linking the present incubation results with regional NUE patterns helps explain why NC achieves higher NUE with lower N inputs than the YRD, despite broadly similar rice yields. Multi-decadal monitoring shows that average N fertilizer inputs in NC rice systems are 43% lower than those in the YRD, while the partial factor productivity of N is markedly higher in NC than in the YRD[25]. Pot and incubation experiments using representative black soils from NC and gleyed paddy soils from YRD further demonstrate that, under identical climate, cultivar, and management conditions, the NC soils deliver greater soil-N-derived uptake and higher NUE than the YRD soils, reflecting stronger soil N supply and retention capacity[39]. Together with multi-scale analyses showing that regional rice NUE is tightly controlled by soil N dynamics and local climate-soil interactions[27], these findings suggest a coherent interpretation of our Nm patterns. The present results indicate that, at a standardized temperature and moisture regime, YRD soils express a relatively large mineralizable N pool (higher N0), whereas NC soils mineralize more conservatively. In the field, however, farmers in YRD tend to combine this intrinsically high Nm potential with excessive N inputs, leading to large N surpluses and depressed NUE, while NC systems operate at moderate N rates that are better matched to soil N supply and retention, sustaining yields with higher NUE and smaller surpluses[55,56]. In this context, the site-specific Nm models developed here linking short-term incubation thresholds and rapid extraction indices to LTNm for each region, providing a mechanistic bridge between soil N supply and fertilizer strategies, and could be used to refine region-tailored N recommendations that explicitly account for the contrasting Nm capacities of YRD and NC paddy soils.
Accurately determining an economically and agronomically optimal N application rate remains a key challenge in sustainable rice production. The soil N supply capacity, primarily governed by Nm, provides a fundamental basis for defining this target rate. The present study demonstrates that Nm and its controlling factors vary significantly across typical paddy soil systems, and that these differences can be effectively captured through a multivariate, site-specific prediction model that integrates soil physicochemical parameters, rapid extraction indices, and short-term incubation data. Such an approach advances beyond previous studies that primarily compared Nm across isolated soil samples by identifying mechanistic drivers that differ among soil types and by developing predictive models adaptable to local soil conditions. When integrated with the Stanford equation for seasonal N budgeting, similar models based on intrinsic soil properties, such as the C/N ratio or extractable labile N fractions, have been shown to guide substantial fertilizer savings[55,57]. Compared with conventional N application, the recommended fertilizer N rate could be reduced by 20%–40%[58]. Nevertheless, the current model was developed under laboratory incubation without exogenous N input, which introduces uncertainties when extrapolated to field conditions. Future work should therefore incorporate interactive factors, including the priming effect, temperature sensitivity (Q10), moisture variability, and fixed NH4+–N release to refine predictions of in situ soil N supply. Coupling the multivariate Nm model with field validation and process-based N cycling models will enable a quantitative assessment of its applicability in dynamic rice-growing environments. Such integration will be critical for advancing region-specific, precision N management frameworks that link soil functional indicators to adaptive fertilizer recommendations.
-
This study demonstrated that Nm and its derived indicators (LTNm and LTNmr) vary considerably among typical paddy soils, reflecting inherent differences in soil physicochemical and biological characteristics. By integrating soil properties, short-term incubation results, and rapid extraction indices, this study established multivariate, site-specific prediction models that substantially improved the accuracy of Nm estimation compared with single-factor approaches. These models effectively captured both direct and indirect controls on key variables, including TN, pH, CEC, and extractable organic N, underscoring the need to account for soil-type–specific pathways when predicting N mineralization potential.
The findings confirm that rapid chemical extractions and short-term incubations can serve as reliable surrogates for long-term N mineralization under controlled conditions. However, their predictive effectiveness depends strongly on soil texture, organic matter composition, and N form. Models developed for one soil type or climatic condition may not directly apply to others, emphasizing the need for regionally calibrated Nm models to support precision N management.
In practical terms, the multivariate Nm prediction framework developed in this study provides a scientific basis for estimating soil N supply capacity and optimizing fertilizer recommendations. Incorporating these models into site-specific N budgeting tools could enable faster, data-driven adjustments to N application strategies, which help to balance agronomic productivity with environmental sustainability. Future research should validate these relationships under field conditions and include dynamic factors such as temperature, moisture fluctuations, and fertilizer–microbe interactions to further enhance the robustness of soil N supply predictions.
-
It accompanies this paper at: https://doi.org/10.48130/nc-0025-0014.
-
Not applicable.
-
The authors confirm their contributions to the paper as follows: Siyuan Cai: writing original draft, formal analysis; Yujuan Liu: material preparation, investigation, data curation, formal analysis; Yuqi Chen: resources; Xiuyun Liu: resources; Lingying Xu: writing review and editing; Yingying Wang: resources; Xu Zhao: conceptualization, methodology, supervision, writing review and editing; Xiaoyuan Yan: writing review and editing. All authors commented on previous versions of the manuscript and approved the final version.
-
The datasets used or analyzed during the current study are available from the corresponding author upon reasonable request.
-
This work was supported by the Natural Science Foundation of Jiangsu Province (Grant No. BK20241700), the National Natural Science Foundation of China (Grant No. 32402694), the Youth Innovation Promotion Association of the Chinese Academy of Sciences (Grant No. Y201956), Young Elite Scientists Sponsorship Program by CAST (Grant No. 2023QNRC001), Frontier Project from the Institute of Soil Science, Chinese Academy of Sciences (Grant No. ISSASIP2406), and the National Key Research and Development Program of China (Grant No. 2017YFD200104). We thank the anonymous reviewers for their valuable feedback.
-
The authors declare that they have no conflict of interest.
-
Full list of author information is available at the end of the article.
- The supplementary files can be downloaded from here.
- Copyright: © 2026 by the author(s). Published by Maximum Academic Press, Fayetteville, GA. This article is an open access article distributed under Creative Commons Attribution License (CC BY 4.0), visit https://creativecommons.org/licenses/by/4.0/.
-
About this article
Cite this article
Cai S, Liu Y, Chen Y, Liu X, Xu L, et al. 2026. Nitrogen mineralization characteristics, drivers, and prediction in paddy soils of representative regions in the Yangtze River Delta and Northeast China. Nitrogen Cycling 2: e002 doi: 10.48130/nc-0025-0014 

Nitrogen mineralization characteristics, drivers, and prediction in paddy soils of representative regions in the Yangtze River Delta and Northeast China
- Received: 30 October 2025
- Revised: 03 December 2025
- Accepted: 16 December 2025
- Published online: 13 January 2026
Abstract: Soil mineralized nitrogen (N) constitutes a significant source of plant-available N in paddy systems, and improving its rapid assessment is critical for guiding fertilizer decisions in China's major rice-producing regions. Yet, the spatial variability of N mineralization (Nm) dynamics, and the indicators that best represent long-term Nm across subregions remain insufficiently understood. This study analyzed 36 and 24 paddy soil samples from the Yangtze River Delta (YRD) and Northeast China (NC), respectively, to compare regional Nm behaviors and identify mechanistic and operational predictors. Long-term Nm potential (N0) was substantially higher in the YRD soils, exceeding that of the NC by 29.4%, reflecting regional contrasts in substrate lability. Using anaerobic incubations and first-order kinetic modeling, the shortest representative incubation duration was defined as the threshold at which short-term Nm (STNm) reliably reflected long-term Nm (LTNm). It was found that this threshold differed markedly between regions (7–14 d, R2 = 0.57–0.75), reflecting contrasts in substrate lability and organic matter stabilization. Rapid chemical extractions demonstrated strong potential for estimating long-term Nm. In the YRD, UV-absorbing dissolved organic N fractions (HW260) were closely associated with Nm potential. In contrast, in the NC, hydrolysable hot-water–extractable N (HWN) provided a more mechanistically relevant proxy. Across sites, pH exerted the most decisive influence on LTNm, while other factors varied in their interrelationships. Integrating rapid chemical indices with soil properties significantly improved long-term Nm prediction. The optimal models combined TN, pH, and HW260 in the YRD (R2 = 0.63) and CEC, pH, clay content, and 14-d STNm in the NC (R2 = 0.75), demonstrating high predictive accuracy and clear geographic differentiation. Collectively, this study revealed distinct Nm behaviors among regions, and developed site-specific models by combining short-term incubation and rapid extraction methods, emphasizing the need for region-tailored prediction frameworks for accurate Nm assessment in paddy soils.