


-
The livestock industry represents the world's largest and fastest-growing source of NH3 emissions[1]. Global NH3 emission from livestock production was 29.8 Tg N in 2018[1], accounting for about 50% of total agricultural emissions (60 Tg N), and contributed significantly to global atmospheric N deposition[2,3]. China is currently the world's largest emitter of NH3, primarily due to its rapidly expanding animal farming sector[4,5]. The country's annual livestock farming NH3 emissions equaled the total agricultural NH3 emissions of Europe and the United States[6,7]. Intensive animal farms are hotspots of NH3 emissions[8]. Intensifying the deposition of NH3 around animal farms may selectively affect microbially mediated inorganic N transformations[9]. Ammonia-rich conditions may not only affect functional gene abundance related to N cycling, but also drive shifts in the diversity and structure of nitrifiers and denitrifiers[9], which have intrinsic links to N2O emissions[10]. However, the mechanisms underlying NH3 deposition effects on soil N2O emissions from animal farms are poorly understood.
NH3, though not a greenhouse gas, can indirectly contribute to nitrous oxide (N2O) formation[11,12]. This occurs when soil microbes convert the deposited NH3 through nitrification and denitrification. As the third most significant greenhouse gas[13], and a primary ozone-depleting agent in the stratosphere[14], N2O has a global warming potential 298 times greater than that of CO2 over a century[5,15]. Soils function dynamically as sources or sinks for atmospheric N2O[16], and their roles are determined by environmental conditions and agricultural practices. Agricultural soils[11,17] and adjacent intensive farming areas have emerged as increasingly significant sources of N2O emissions[18,19]. Globally, anthropogenic N2O emissions are approximately 6.7 Tg N yr−1[20], and agriculture is responsible for nearly half of this total[17,21]. Livestock production contributes about 14.5% of anthropogenic N2O emissions[13]. N2O emissions from animal farms contributed about 10% of anthropogenic N2O emissions[20,22].
High-level NH3 emissions from intensive animal farms are a strong source of NH3 deposition in adjacent ecosystems through dry/wet deposition[8], and form a natural gradient of atmospheric NH3 deposition. High NH3 conditions may disrupt the balance between nitrification and denitrification, along with microbial regulatory feedback, potentially favoring organisms best suited to the high availability of NH4+[9,21]. AOA and ammonia-oxidizing bacteria (AOB) are two primary groups of microorganisms responsible for ammonia oxidation, a crucial step in the global nitrogen cycle[23]. AOA generally dominates ammonia oxidation in N-limited soils, whereas AOB dominates ammonia oxidation in N-rich environments[24]. However, high NH3 conditions around animal farms may influence the pattern between AOA and AOB by creating conditions that are either favorable or limit their growth, further influencing the abundance of AOA and AOB. Soil pH strongly influences soil nitrifiers[25]. Long-term high NH3 deposition around animal farms may lead to soil acidification, which in turn may increase AOA abundance, even in NH3-rich environments. Therefore, NH3 deposition and ecological adaptations together influence the abundance of AOA and AOB[26].
Large NH3 deposition gradients have been observed near animal farms (within 1 km)[8,27,28]. However, the manner in which a steep gradient of NH3 deposition around animal farms affects soil emissions of N2O and N-cycling microbes is poorly understood. Because nitrifiers and denitrifiers have distinct substrate requirements and physiological traits[29], NH3 deposition may differentially influence their activities, resulting in varied effects on soil N2O fluxes. Transect studies at a large poultry farm in Scotland showed a positive impact of NH3 deposition on soil N2O emissions[30]; however, the underlying microbial mechanisms were not explored. Further research is needed to investigate the microbial mechanisms driving NH3 deposition-induced soil N2O fluxes in and around intensive animal farms.
To address these knowledge gaps, this study investigated N2O emissions near the source area of an intensive pig farm in south-central China. The objectives were to: (1) clarify the fate of NH3 deposition from animal farming by quantifying N2O emissions as one pathway and to establish the corresponding emission factor; and (2) determine if NH3 deposition as different from oxidised N deposition (e.g., NO3− deposition), by directly supplying substrate for nitrification, enhances more N2O emissions in terrestrial natural ecosystems, and to verify nitrification as the dominant source of the emitted N2O through microbiological evidence.
-
The study was conducted at a pig farm (31°38'53" N, 113°13'48" E; 101 m a.s.l.), located in Suizhou, northeastern Hubei Province, China (Fig. 1). The region is part of a typical hilly subtropical region of central China, with no major anthropogenic NH3 pollution sources nearby. During the experimental period, the area exhibited a northern subtropical monsoon climate characterised by a mean annual temperature of 15.6 °C and a mean annual precipitation of 940 mm[27]. Forest covers approximately 50% of the total area within a 500 m radius of the farm, predominantly consisting of evergreen coniferous vegetation. According to the Food and Agriculture Organization of the United Nations soil classification system, the soil surrounding the pig farm varies by direction. Cambisol, derived from slate and shale, dominates the N (north), E (east), NE (northeast), S (south), and SE (southeast) transects, whereas Irragric Anthrosol, derived from slate and shale, occupies the W (west), NW (northwest), and SW (southwest) transects. The average soil temperature and soil moisture content during the study period were 21.0 °C and 12.8%, respectively (Supplementary Figs S1 & S2). The area-weighted mean atmospheric NH3 deposition rate within 500 m of the farm was estimated to be 40 kg N ha−1 yr−1[27]. Additional details regarding land-use patterns and farm characteristics are available in Yi et al.[27].
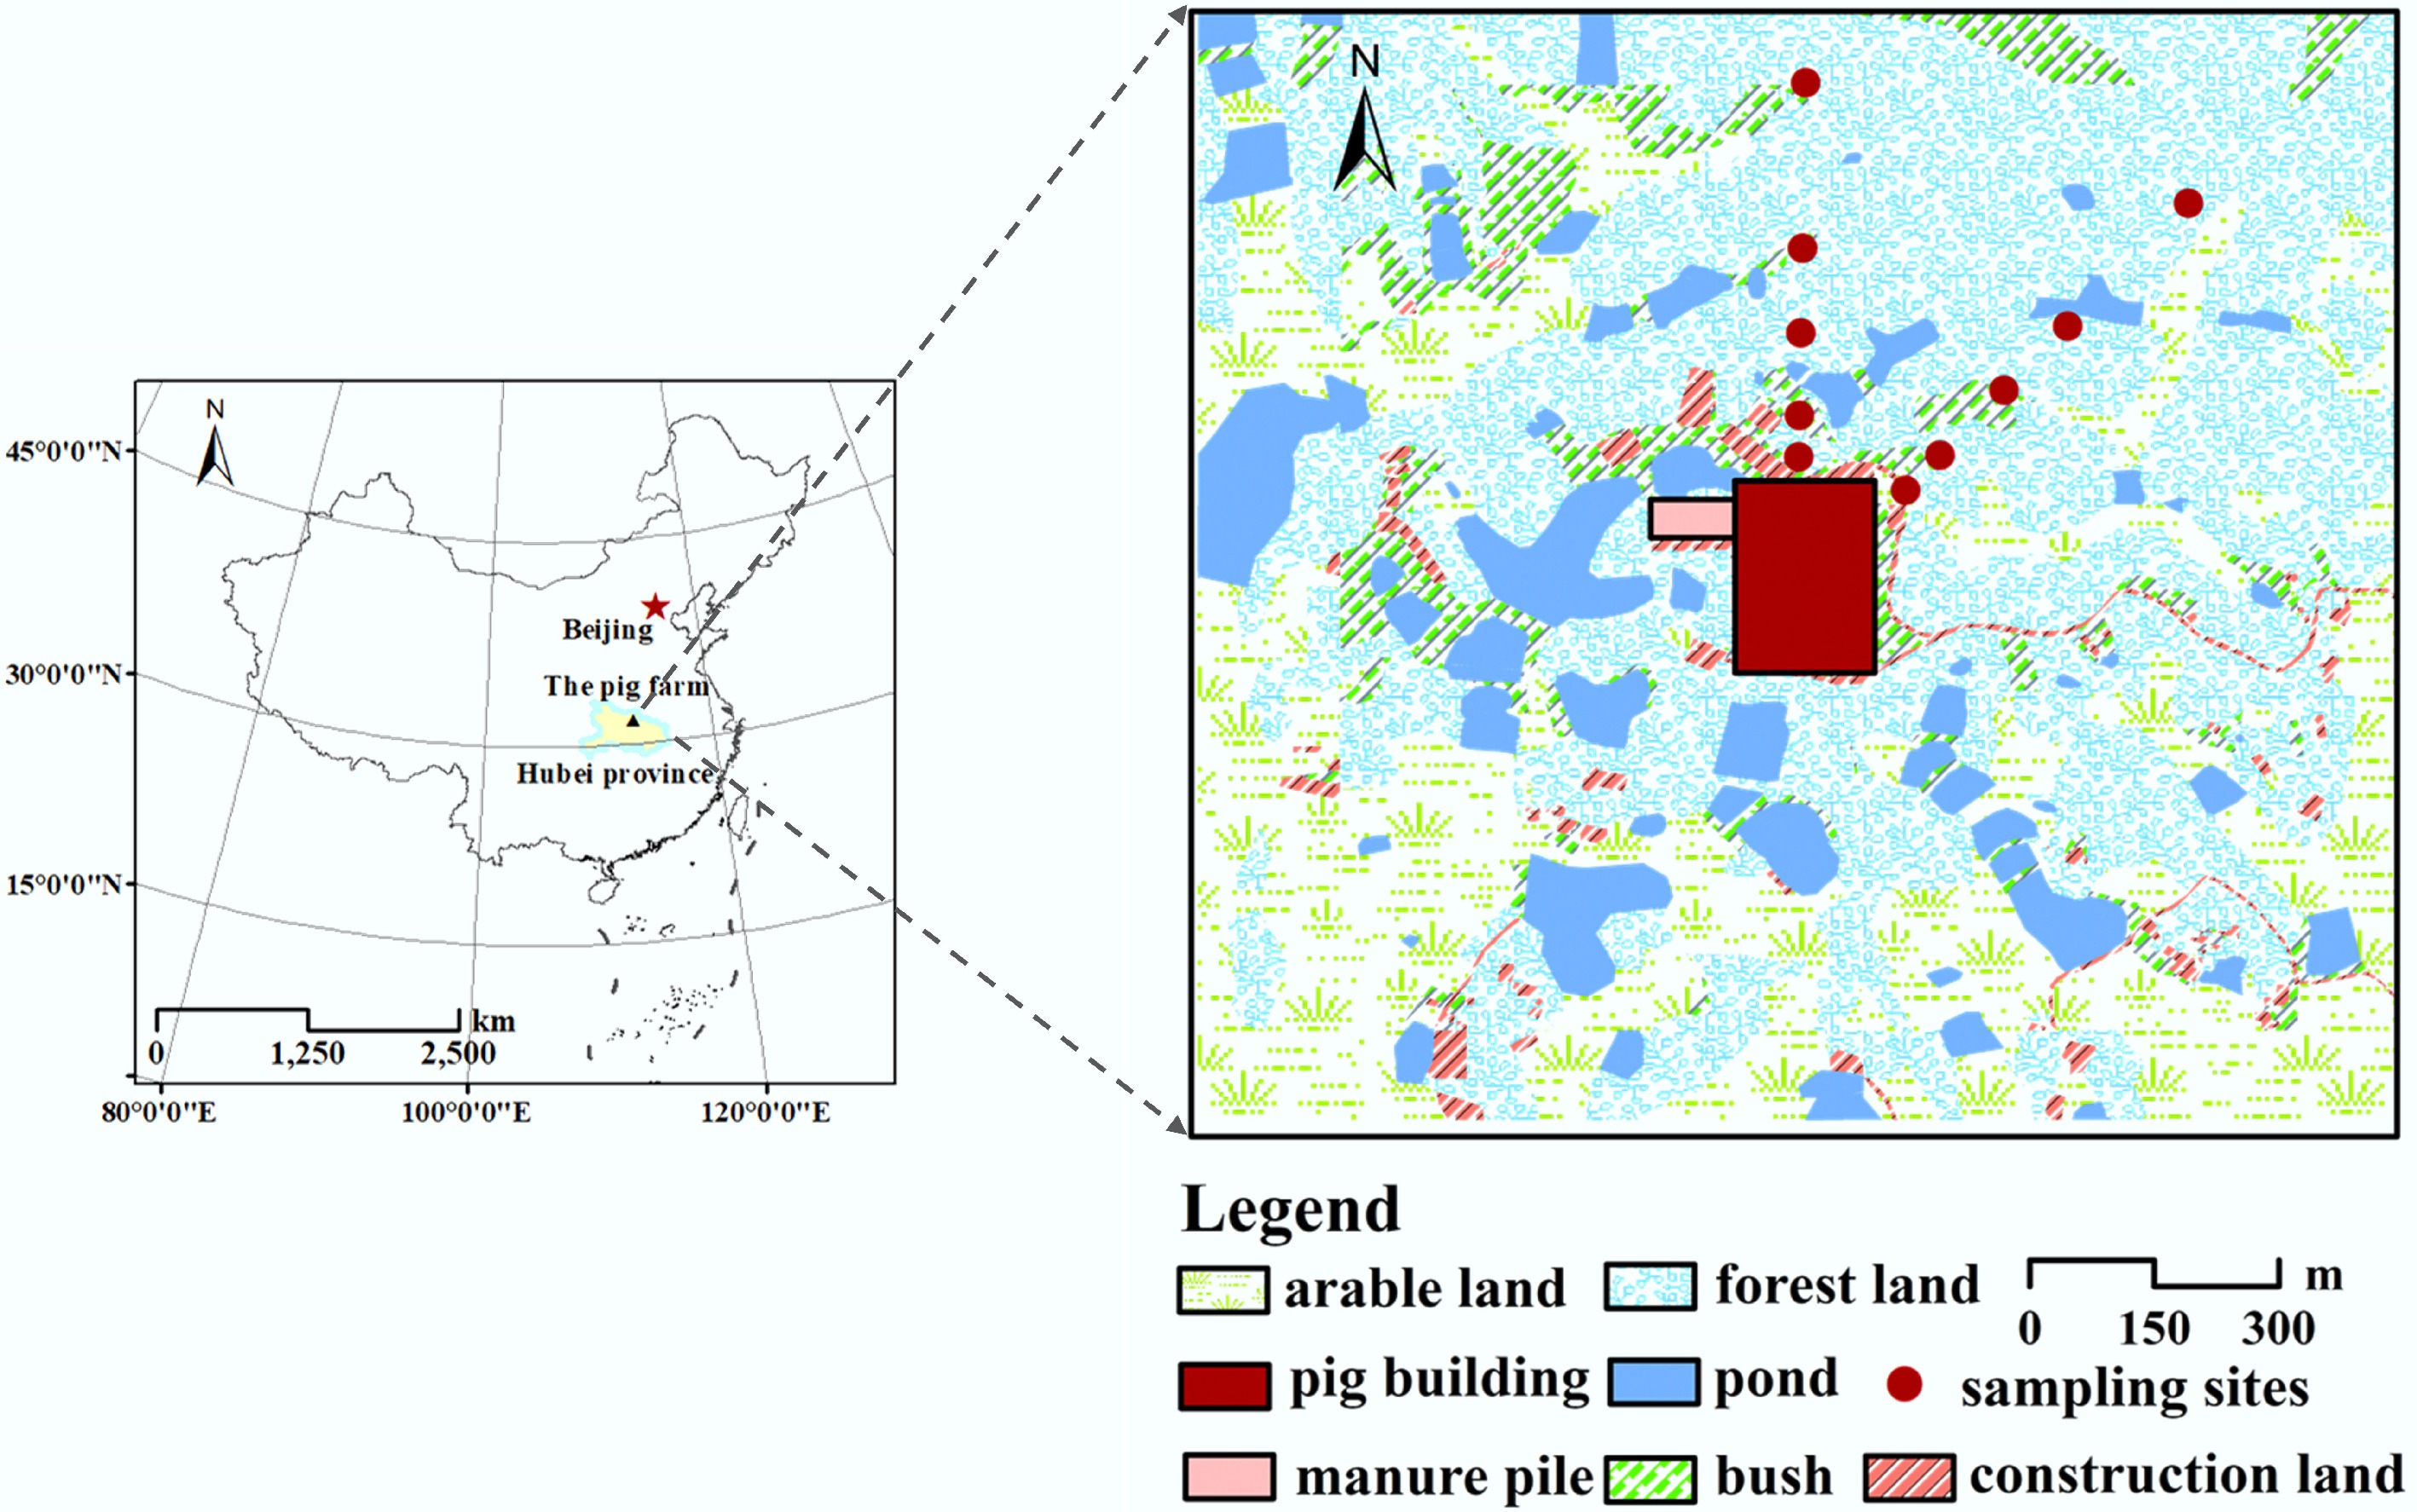
Figure 1.
The geographical location of the pig farm.
Soil sampling and chemical analysis
-
Soil samples were collected from a depth of 0–10 cm along the main downwind transects (N and NE transects) of the pig farm at distances of 50, 100, 200, 300, and 500 m. Sampling was conducted from August 2018 to July 2019, with additional sampling in November 2024. Prior to collection, the litter and vegetation layers were carefully removed. Three replicate soil samples were collected within a 1 m radius at each site to form composite samples, minimizing the effects of soil heterogeneity. After collection, the composite samples were immediately sieved through a 2 mm mesh to remove stones and roots and then stored in sealed plastic bags. The samples were transported to the laboratory and stored at 4 °C until further analysis. Soil extractions were performed using 0.5 mol L−1 K2SO4 solutions at a soil-to-solution ratio of 1:5[31], and NO3−-N and NH4+-N concentrations were determined using a continuous flow analyzer (AA3, SEAL Analytical GmbH, Norderstedt, Germany).
In-situ flux measurements of N2O
-
Soil N2O fluxes were measured using the static closed-chamber method. This study comprised ten in-situ monitoring sites (with three replicates per site) along the N and NE transects of the pig farm. N2O flux measurements were conducted near the soil sampling positions. Gas samples were collected once a month from August 2018 to July 2019 using the static chamber method. At each site, three chamber pedestals were installed in the field throughout the sampling period, with a spacing of < 1 m between adjacent pedestals. Pedestals were inserted 10 mm into the soil. Each chamber had an inner diameter of 20 cm and a height of 22 cm, with a 3.2 mm wall thickness. Gas sampling along the same transect was conducted between 9:00 and 12:00 or between 14:00 and 17:00 on each sampling day. During each sampling event, the sampling chamber was gently fitted onto the pedestal and carefully sealed for 30 min flux measurements. Gas samples were collected using 30 mL syringes equipped with a three-way stopcock. Prior to sampling, the syringes were flushed twice with fresh air and pumped three times to ensure proper mixing of the chamber gas. Samples were collected at 0, 15, and 30 min after chamber closure. Each 30 mL sample was injected into a 12 mL pre-evacuated glass vial (Labco, High Wycombe, UK) and analyzed within one week using gas chromatography (Agilent 7890, USA). Soil temperature and moisture were measured manually at a depth of 10 cm near the pedestals using portable probes (JM624 digital thermometer, Living-Jinming Ltd, China; TDR100, Spectrum, USA).
Soil N-addition incubation in the laboratory
-
The effects of NH3 deposition on soil N2O emissions were studied using laboratory incubation experiments at a constant temperature. The soil used for incubation was collected from a forest located approximately 200 m northeast of the pig farm in July 2019 and transported to the laboratory in plastic woven bags. The soil was passed through a 2 mm mesh sieve, thoroughly mixed, and stored frozen at −20 °C until incubation. Initial soil characteristics were as follows: NO3−-N: 0.2 mg kg−1, NH4+-N: 5.2 mg kg−1, SOC: 6 g kg−1, TN: 0.4 g kg−1, TP: 0.2 g kg−1, pH: 5.7 (soil to deionized distilled water ratio 1:2.5), soil bulk density: 1.4 g cm−3. The water-filled pore space (WFPS) of the soil was calculated from the gravimetric soil water content and bulk density. The experiment included ten treatments with three replicates each: (1) 20% WFPS, (2) 40% WFPS, (3) 60% WFPS, (4) 80% WFPS, (5) 100% WFPS, (6) 60% WFPS + urea, (7) 60% WFPS + ammonia sulfate, (8) 60% WFPS + ammonium nitrate, (9) 60% WFPS + potassium nitrate, and (10) 60% WFPS + glucose.
The experimental soil was slowly thawed and pre-incubated at 25 °C for one week to reactivate microorganisms to near-normal states. For the incubation experiment, 200 g of pre-incubated soil was weighed for each treatment. Nitrogen sources (urea, ammonia sulfate, ammonium nitrate, and potassium nitrate) were added at 100 mg N fresh soil kg−1, and glucose was added at 200 mg C fresh soil kg−1. These amendments were evenly applied in the aqueous solution using a sprayer, thoroughly mixed with a glass rod, and then transferred to culture bottles. Each 500 mL glass bottle (86 mm diameter × 178 mm height) containing the experimental soil was covered with a perforated film to permit gas exchange while minimizing moisture loss. Thirty bottles were incubated in the dark at 25 °C for 35 d. Soil water content was measured at 7, 14, and 21 d by weighing the bottles. In the experiment, the amount of water replenishment was less than 0.5 g. N2O flux was measured 12 times over the 35 d incubation period. Gas sampling was performed on days 1, 2, 3, 5, 7, 9, 11, 14, 20, 25, 30, and 35. Gas sampling was performed daily between 18:00 and 22:00. Before sampling, bottles were ventilated for 5 min and sealed using rubber stoppers. Gas samples (20 mL) were collected at 0, 1, 2, and 3 h using a 30 mL syringe with a three-way stopcock and transferred to pre-evacuated 12 mL glass vials (Labco, High Wycombe, UK). After sampling, stoppers were removed and the bottles were recovered with film until the subsequent sampling. All samples were analyzed within 7 d using the aforementioned method.
Method of calculating N2O emissions
-
The emission of soil N2O was calculated by Eq. (1):
$ F=\dfrac{M}{{V}_{0}}\times H\times \dfrac{P}{{P}_{0}}\times \dfrac{{T}_{0}}{T}\times \dfrac{{d}_{c}}{{d}_{t}} $ (1) where, F is the flux of N2O (mg m−2 h−1); M is the molar weight of N2O, 44.0 g mol−1; V0 is the molar volume of N2O under standard conditions, 22.4 L mol−1; P0 and T0 are the air pressure and temperature in the standard state of an ideal gas, 1,013 hPa and 273 K, respectively; H is the height of the sampling chamber (m); P and T are the atmospheric pressure and temperature at the time of sampling; dc/dt is average rate of change of concentration with time (ng μL−1 h−1). During the observation period, atmospheric pressure changes were small. Therefore, the atmospheric pressure in the chamber during sampling was treated as standard atmospheric pressure in the calculation.
Annual N2O emissions were calculated by summing the monthly N2O emissions in Eq. (2).
$ M=\sum {F}_{i}\times {D}_{i}\times 2.4 $ (2) where, M is the annual emission flux of N2O (kg ha−1 yr−1); F is the monthly emission flux of N2O (mg m−2 h−1); i is the month, 1–12; Di is the number of days per month; 2.4 is the unit conversion coefficient.
Soil DNA extraction and quantitative PCR of functional genes
-
Soil DNA was extracted from nine fresh soil samples (< 0.5 g) using 2X Taq Plus Master Mix (P211/P212, Nuoweizan, China). In November 2024, topsoil samples (0–10 cm depth) were collected with five replicates along two transects: the N and NE transect at distances of 50, 200, 100, 300, and 500 m from the pig farm. Immediately after collection, soils intended for DNA extraction were flash-frozen in liquid nitrogen, while those designated for physicochemical analysis were refrigerated at 4 °C. The physicochemical properties of the soil samples are presented in Supplementary Table S1. Successful DNA extraction was verified by agarose gel electrophoresis. The abundances of ammonia oxidizers (AOA amoA and AOB amoA) and denitrifiers (nirS, nirK, and nosZ) were quantified following the method of Zhang et al.[29]. Gene-specific primers (Supplementary Table S2) were obtained from Shanghai Majorbio Bio-pharm Technology Co. Ltd. Quantitative measurements were performed using a T100 Thermal Cycler PCR system (Bio-Rad, USA) and verified using a NanoDrop2000 spectrophotometer (NanoDrop2000, Thermo Fisher Scientific, USA). All qPCR assays were conducted in triplicate. Amplification efficiencies were: 103.18% (R2 = 0.9995) for AOA, 106.53% (R2 = 0.9997) for AOB, 105.26% (R2 = 0.9985) for nirK, 105.26% (R2 = 0.9971) for nirS, and 101.19% (R2 = 0.9994) for nosZ.
-
The soil NO3−-N and NH4+-N content generally declined with increasing distance from the pig farm, although there were no significant correlations between inorganic N content and distance from the pig farm (Figs 2 & 3). The NH4+-N content along the N and NE transect was consistently higher than the NO3−-N content. However, Shen et al.[32] reported a significantly higher soil NO3−-N content in a cattle feedlot in Victoria, Australia. A possible explanation is that more NH4+ is input than consumed in the study area. The NO3−-N content along the NE transect was slightly higher than along the N transect. However, the NH4+-N levels along the N transect were slightly higher than those along the NE transect.
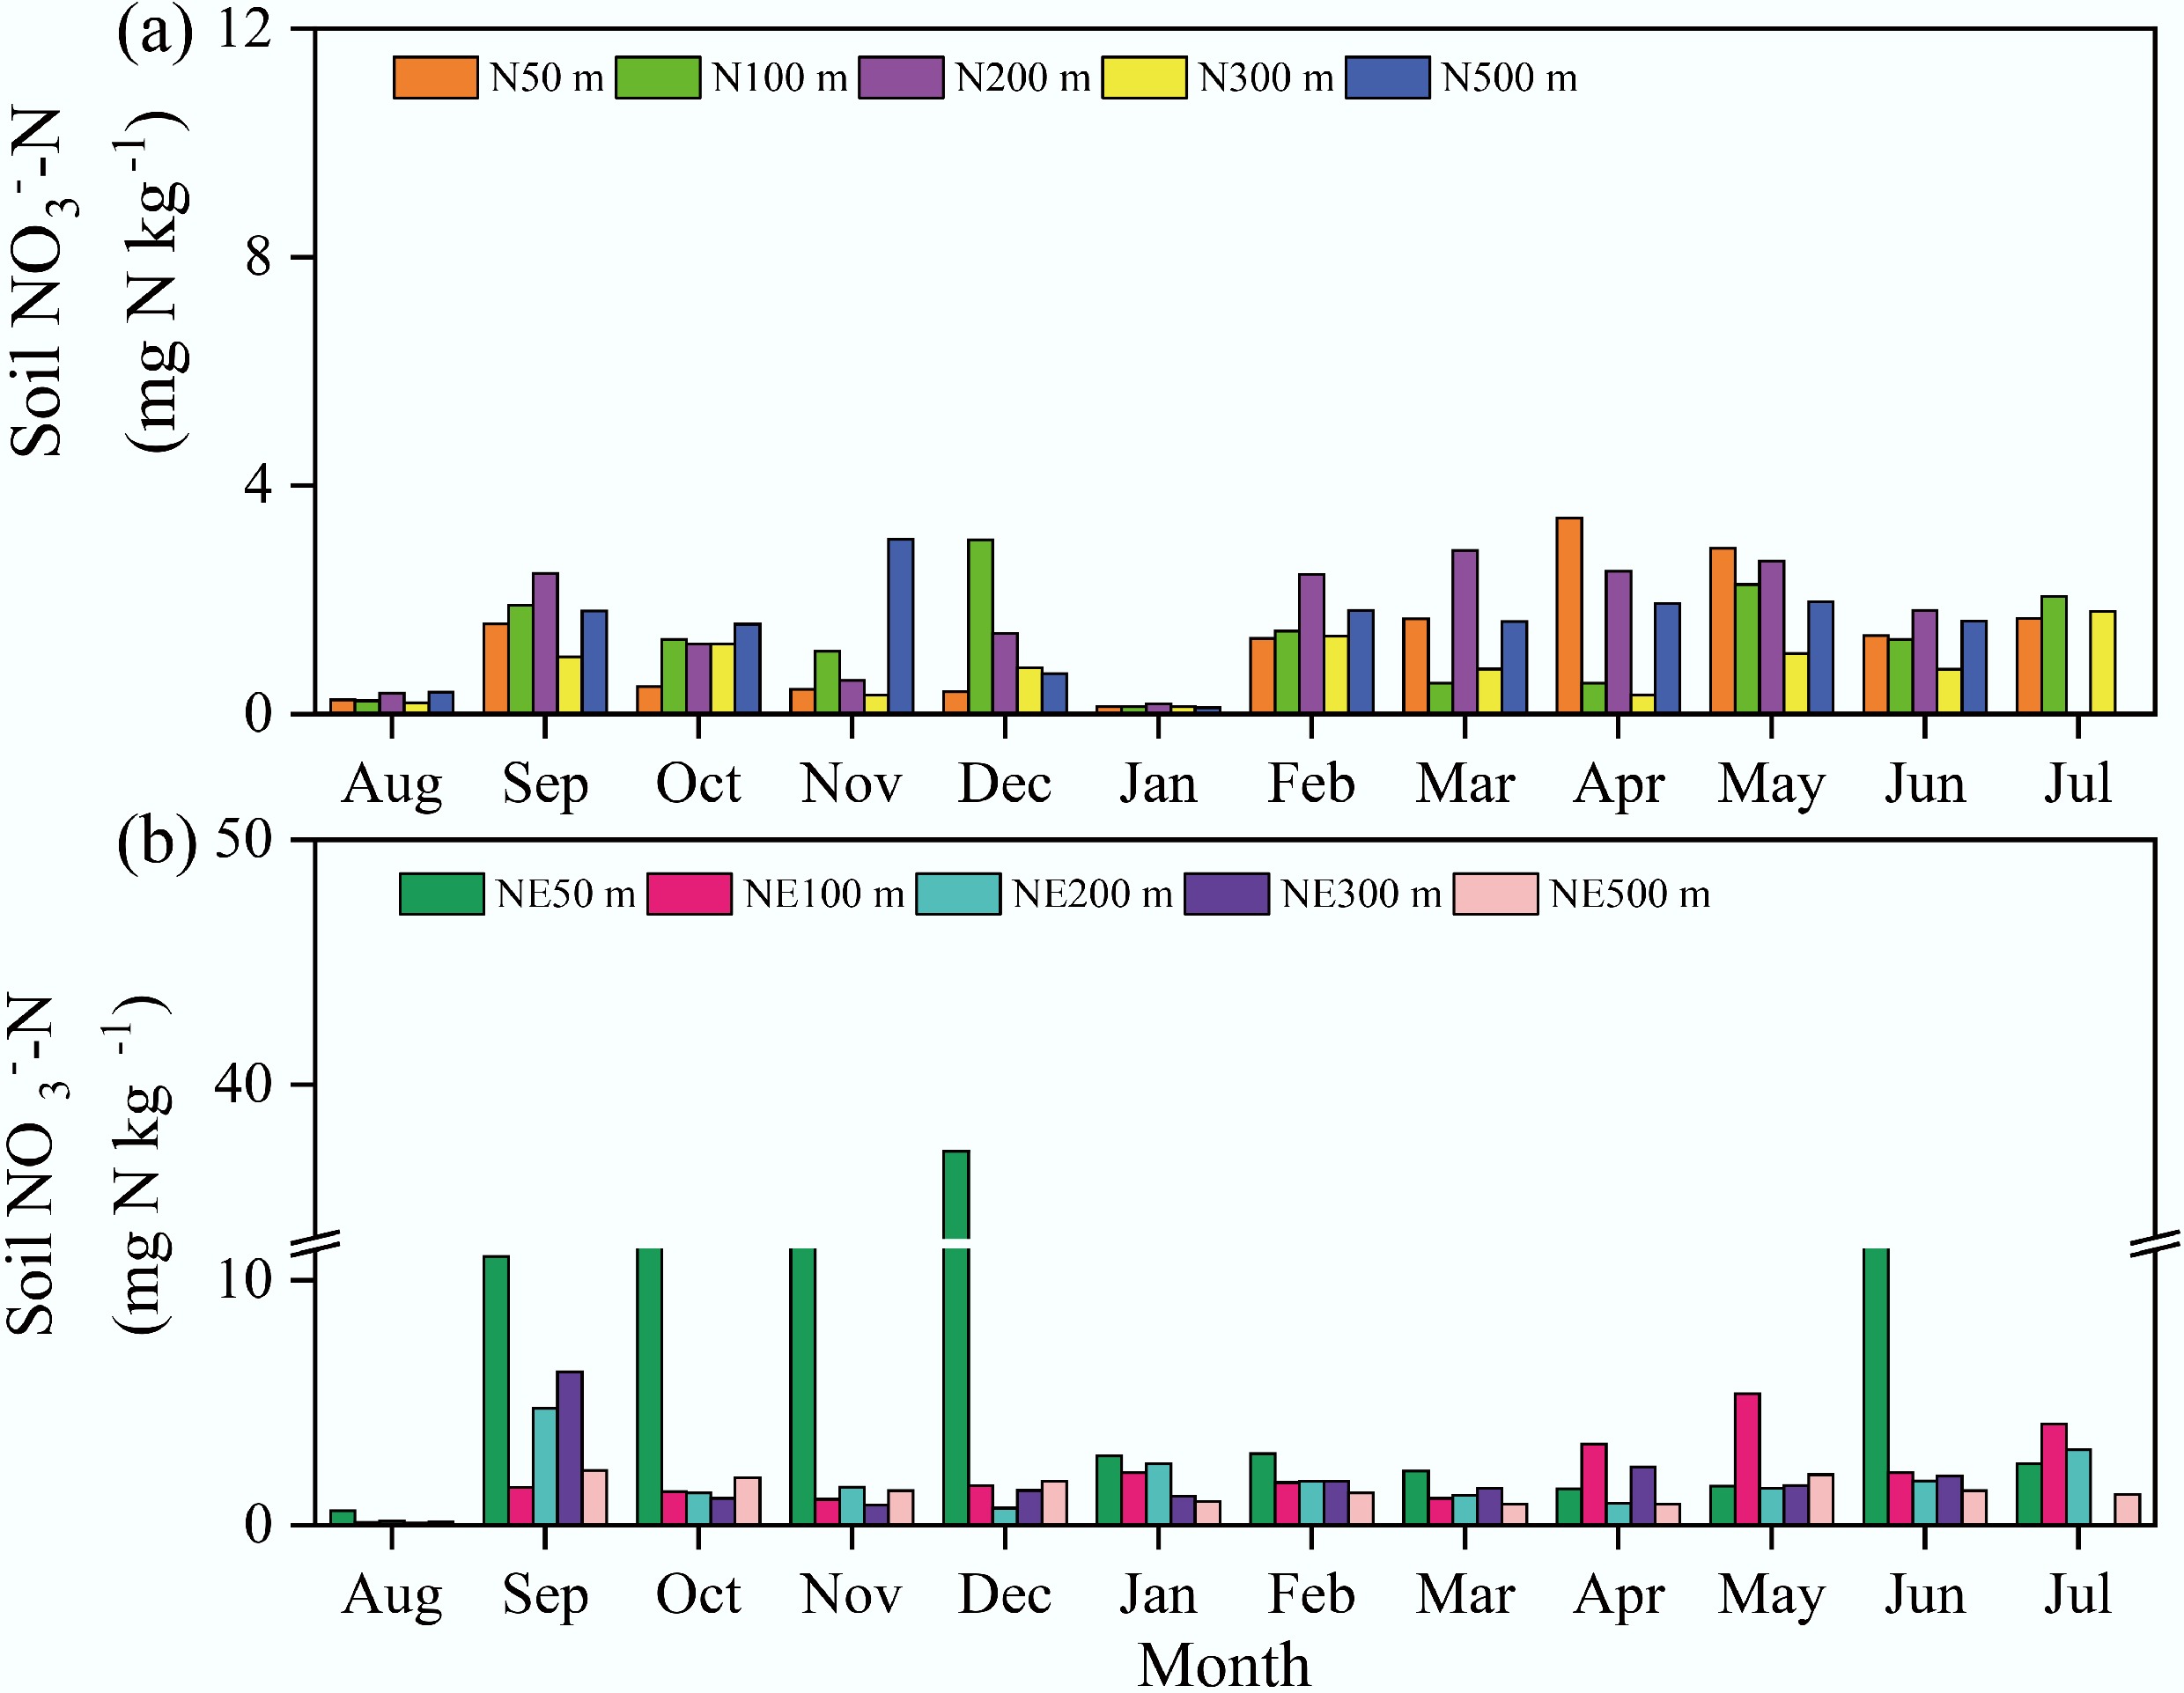
Figure 2.
Soil NO3−-N concentrations in the N and NE transects of the pig farm from August 2018 to July 2019.
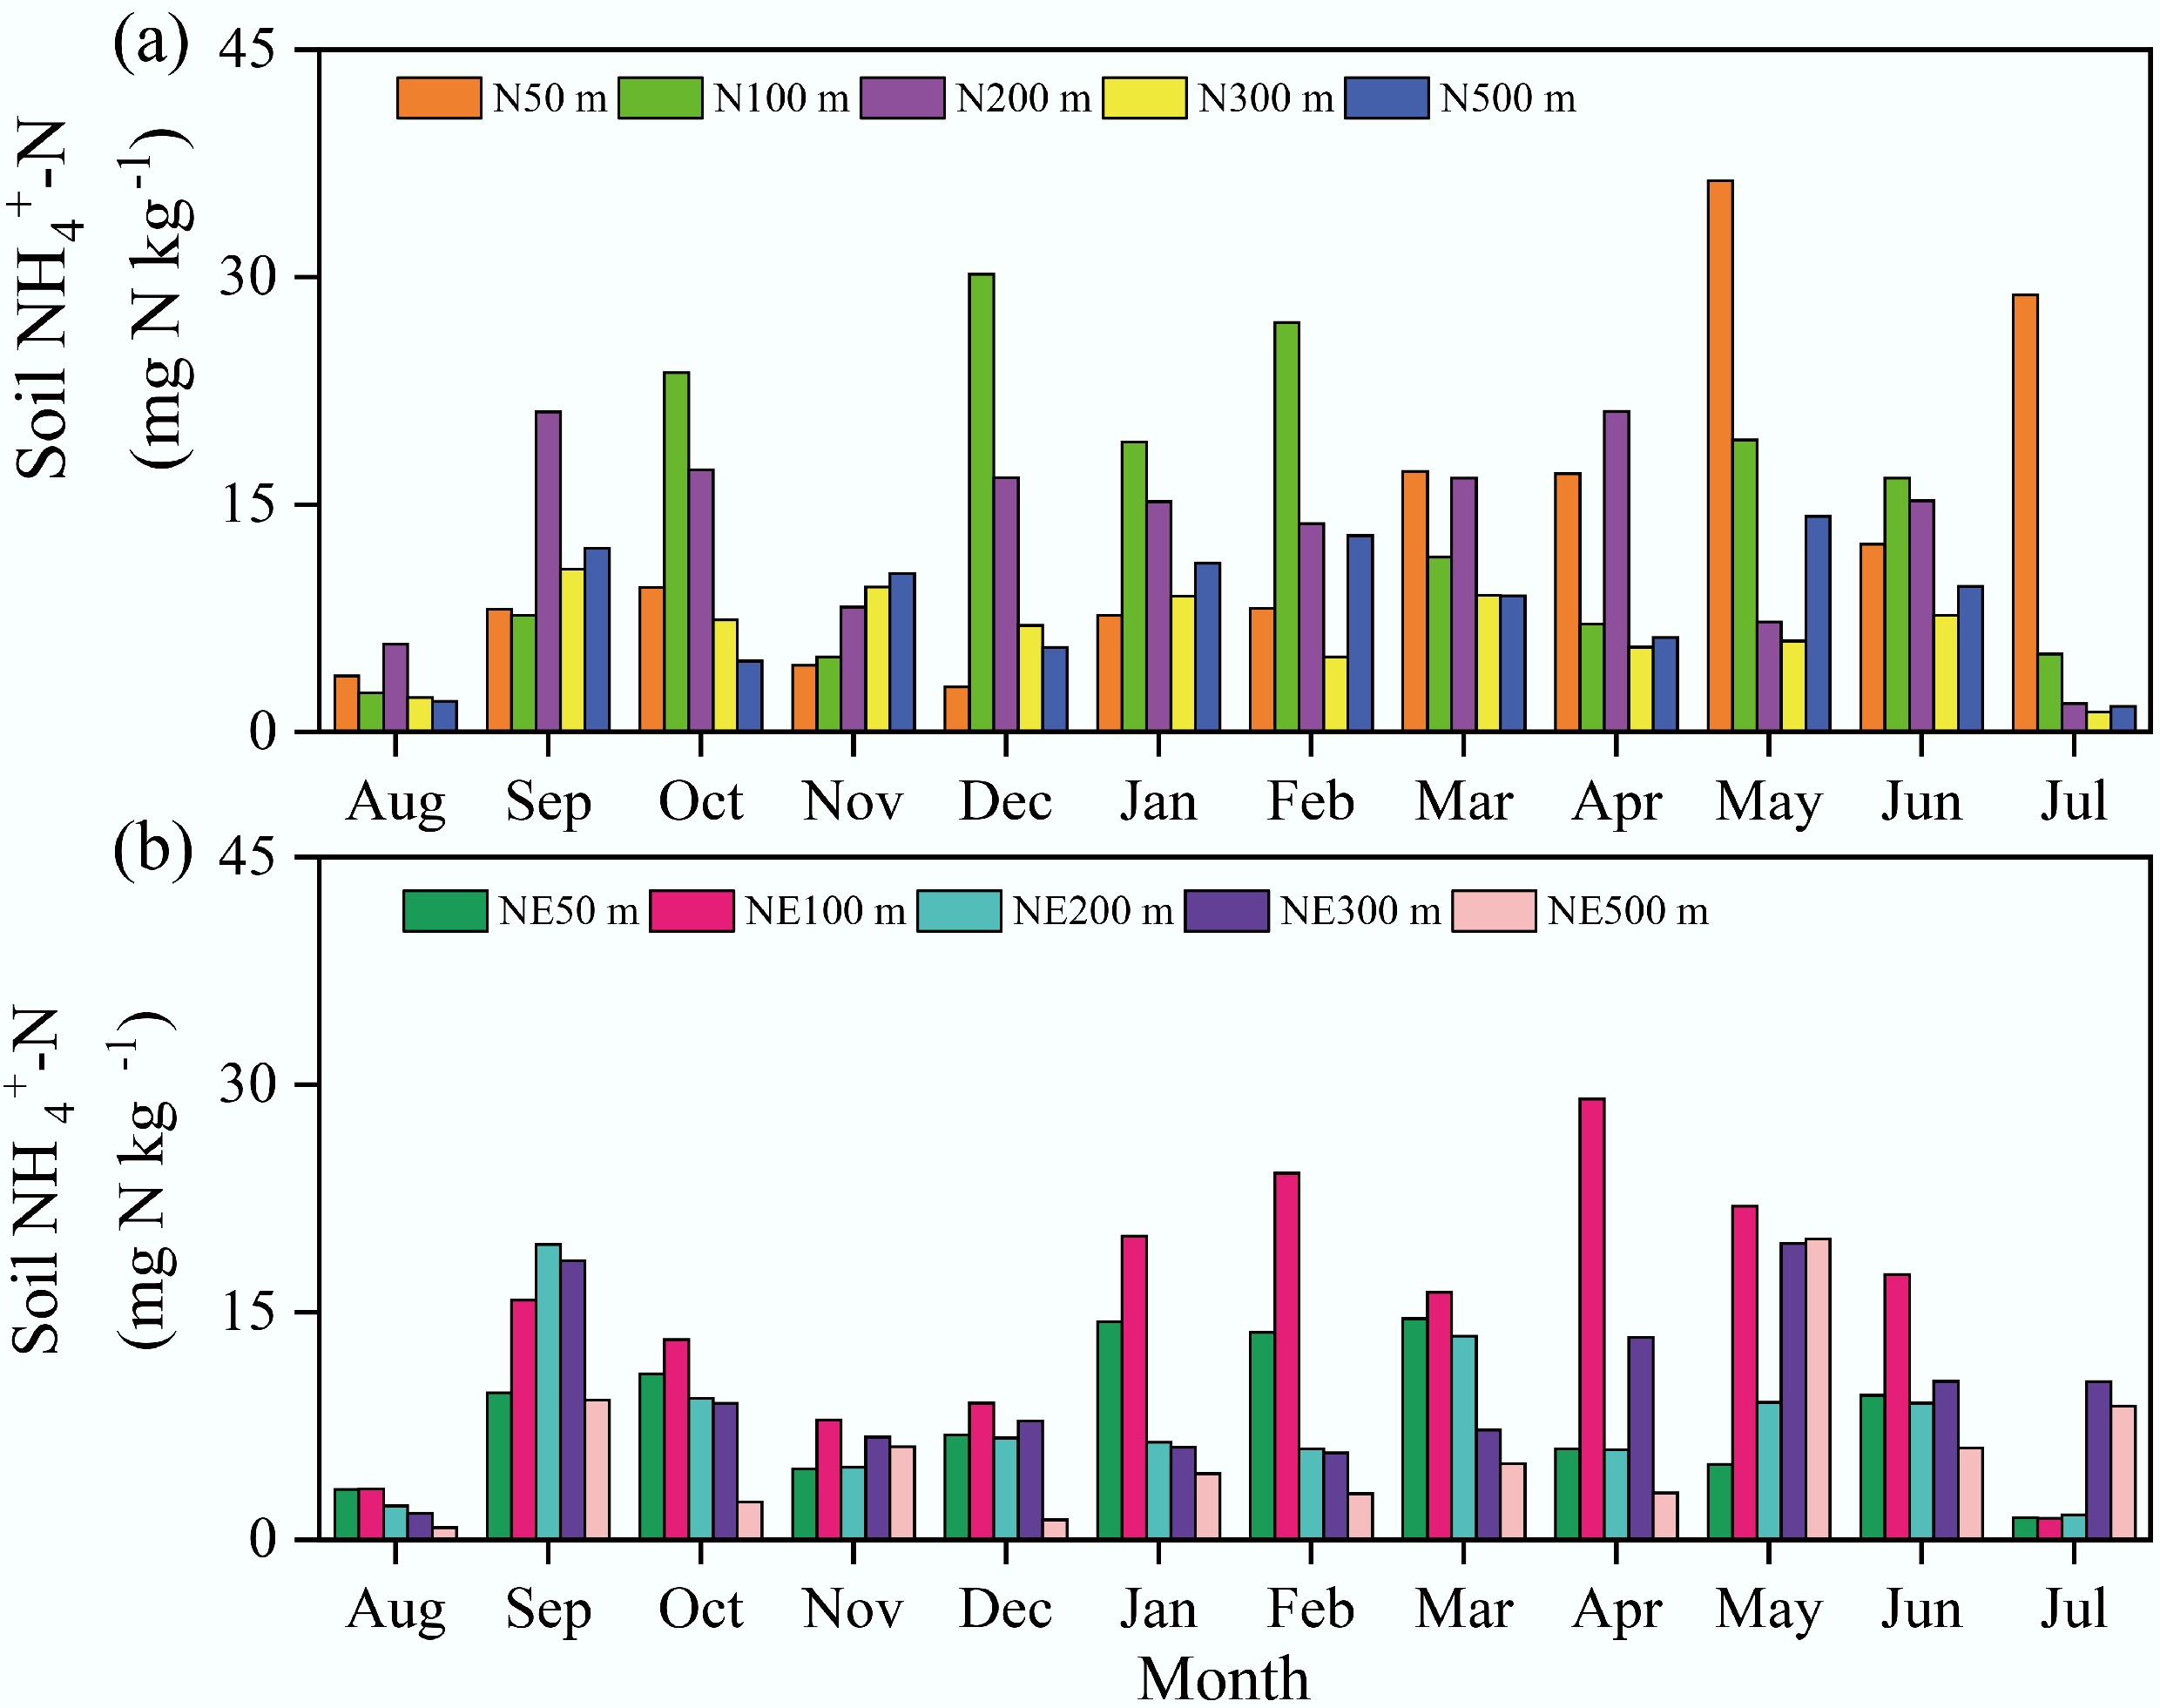
Figure 3.
Soil NH4+-N concentrations in the N and NE transects of the pig farm from August 2018 to July 2019.
Soil NO3−-N content varied considerably, ranging from 0.1 to 3.4 mg kg−1 along the N transect and 0.1 to 37.3 mg kg−1 along the NE transect (Fig. 2), with averages of 1.3 and 3.4 mg kg−1, respectively. Annual mean NO3−-N levels along both transects at distances of 50, 100, 200, 300, and 500 m from the pig farm were 1.3, 1.3, 1.7, 0.8, and 1.5 mg kg−1 (N transect) vs 9.7, 2.1, 1.8, 1.8, and 1.4 mg kg−1 (NE transect). Notably, elevated concentrations occurred at the 50 m sampling point along the NE transect from September to December. Measured NH4+-N concentrations ranged from 1.3 to 36.3 mg kg−1 (mean: 11.2 mg kg−1) along the N transect and from 0.8 to 29.1 mg kg−1 (mean: 9.3 mg kg−1) along the NE transect (Fig. 3). Annual average NH4+-N concentrations at 50, 100, 200, 300, and 500 m from the pig farm were 13.0, 14.6, 13.4, 6.7, and 8.3 mg kg−1 for the N transect, and 8.3, 15.0, 7.8, 9.7, and 5.8 mg kg−1 for the NE transect, respectively. In July and August, soil NH4+-N was maintained at relatively low concentrations.
Dynamics of N2O emissions under field conditions
-
In this study, soils adjacent to the pig farm predominantly served as net sources of atmospheric N2O throughout the observation period (Fig. 4). Temporally, the N transect showed single-peak dynamics, with maximum emissions occurring in August and September 2018. Conversely, the NE transect displayed bimodal variation, featuring a primary peak (September–November 2018) and a secondary peak (March–May 2019). Daily N2O flux measurements along the N transect ranged from 0 to 9.0 g N ha−1 d−1 (mean: 1.2 g N ha−1 d−1), whereas fluxes along the NE transect varied from 0 to 2.9 g N ha−1 d−1 (mean: 0.8 g N ha−1 d−1). Comparative analysis revealed consistently higher average daily fluxes along the N transect than the NE transect at all measured distances: 50 m (2.3 vs 1.1 g N ha−1 d−1), 100 m (1.3 vs 0.8 g N ha−1 d−1), 200 m (1.4 vs 0.7 g N ha−1 d−1), 300 m (0.9 vs 0.5 g N ha−1 d−1), and 500 m (1.1 vs 0.9 g N ha−1 d−1).
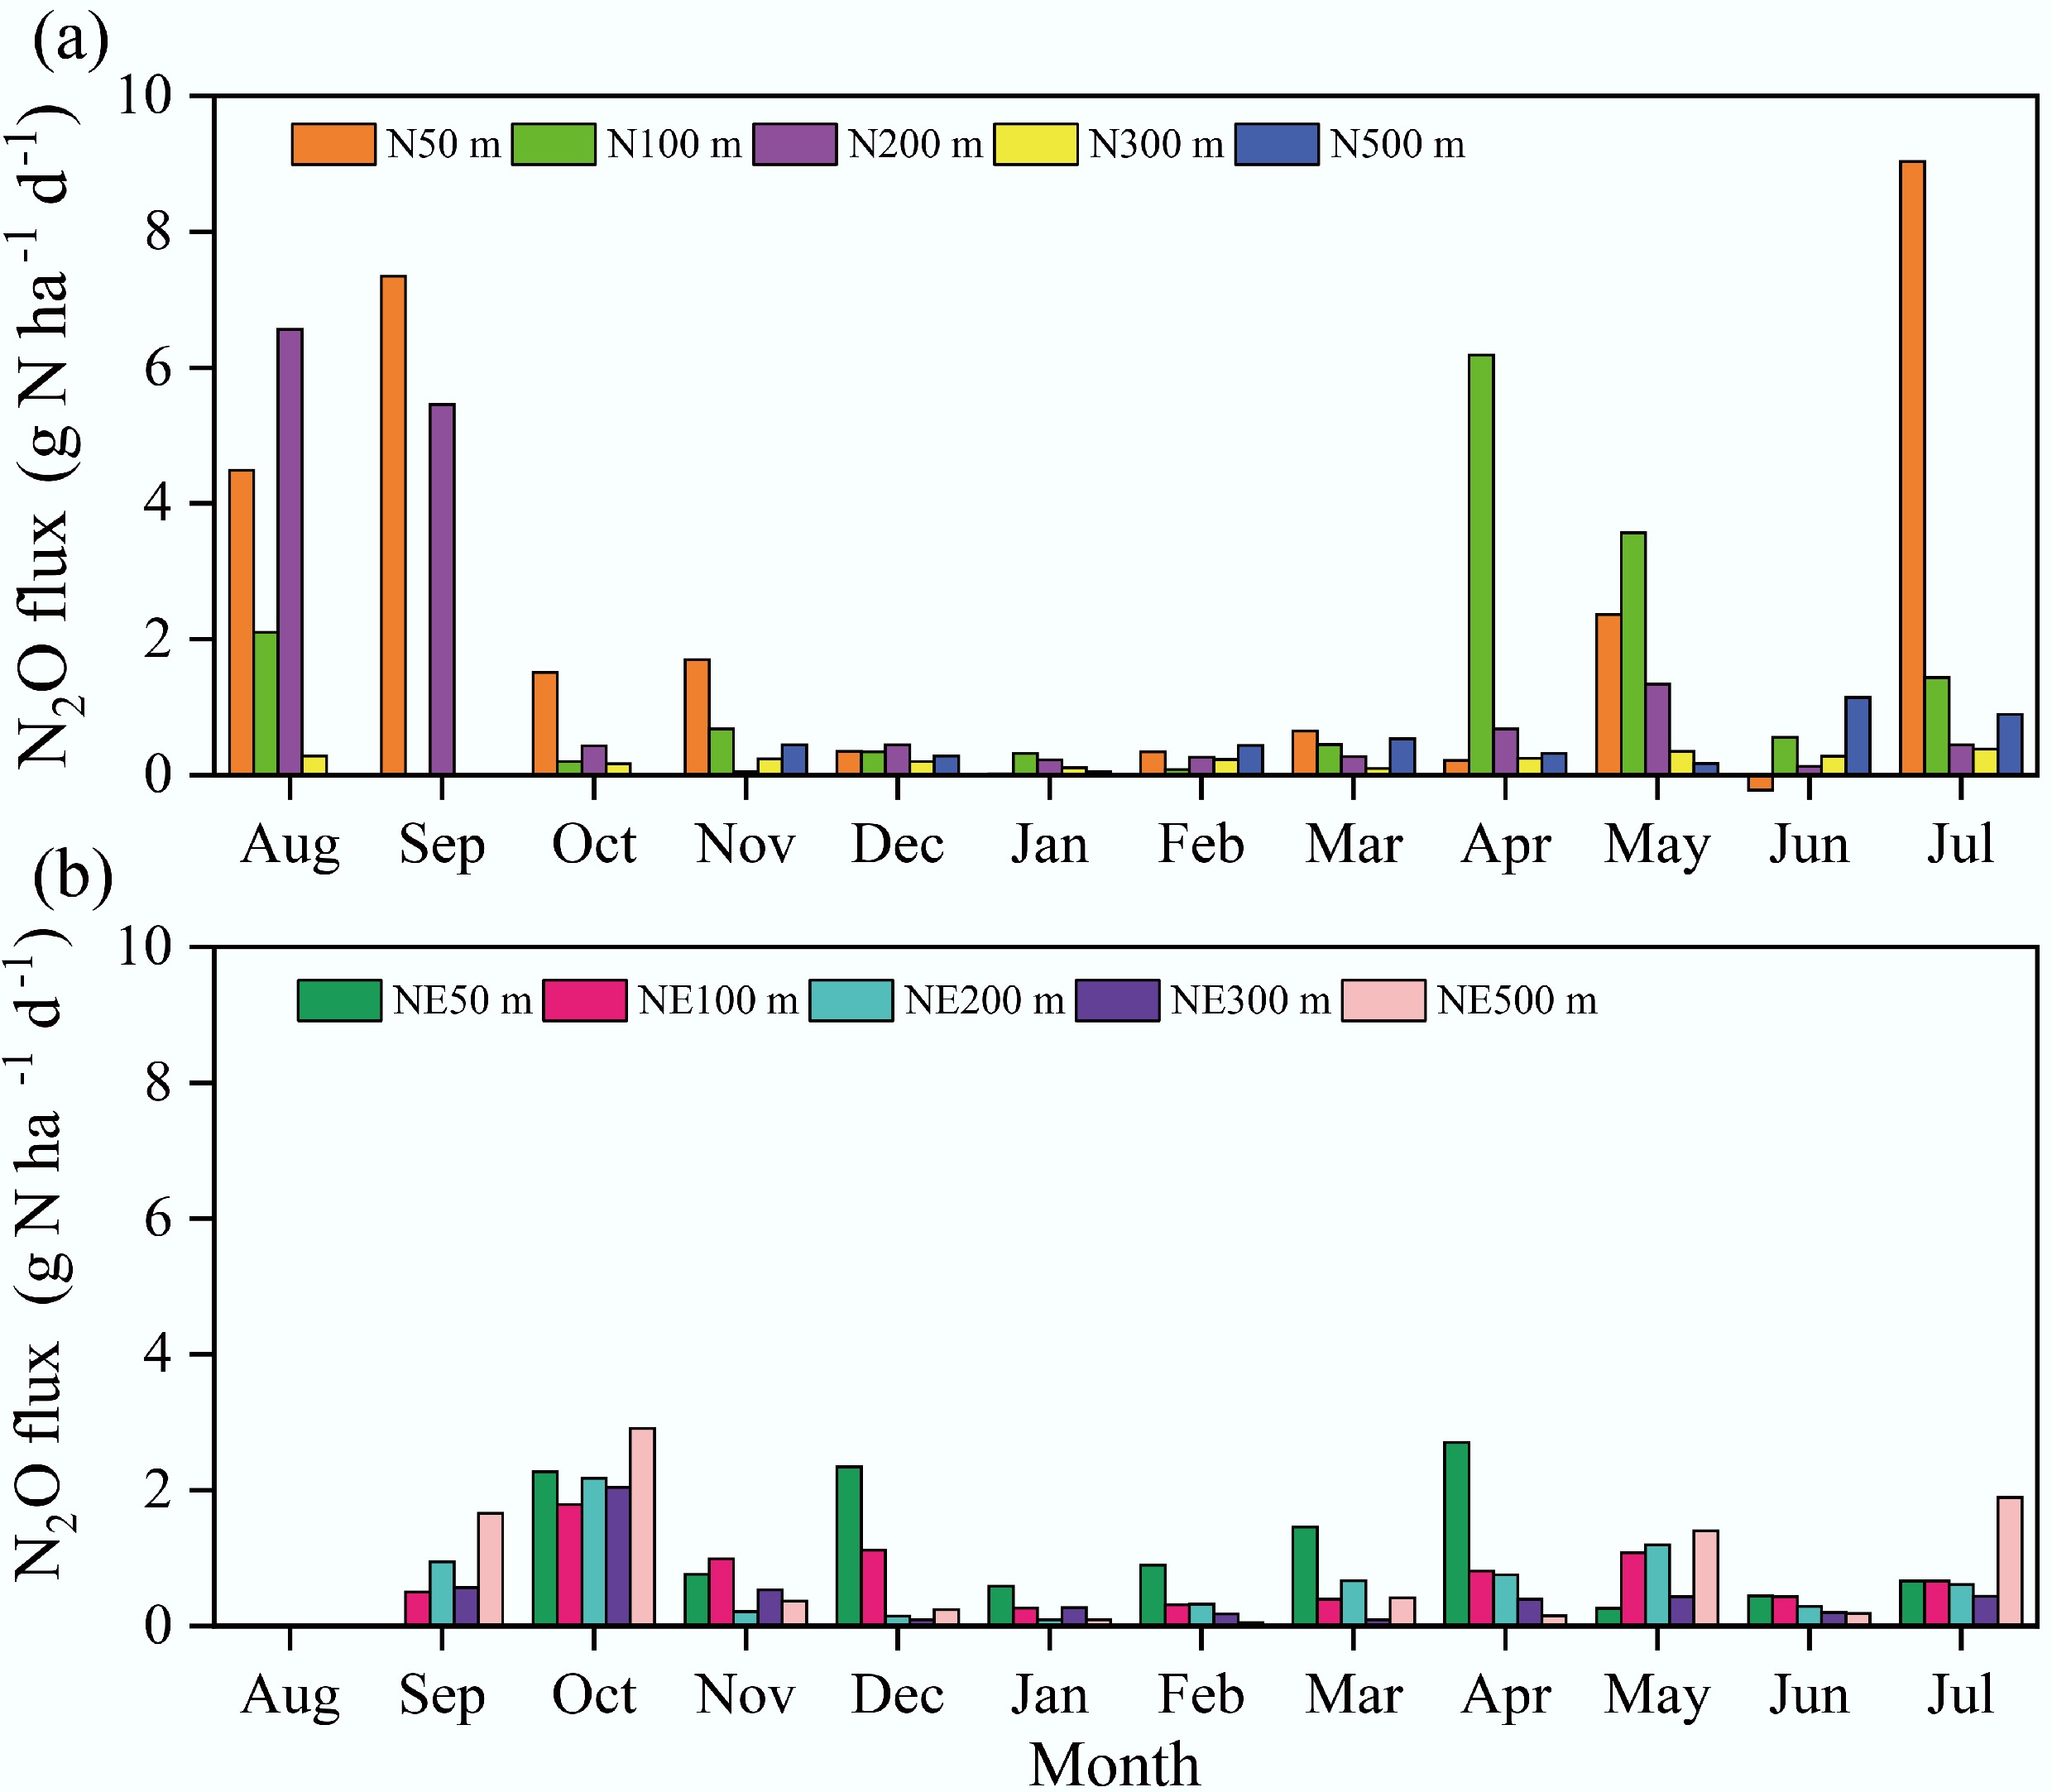
Figure 4.
Soil N2O emissions in the N and NE transects of the pig farm from August 2018 to July 2019.
N2O emissions in a laboratory study
-
During the incubation experiment, soil N2O emissions across all treatments generally followed similar patterns with incubation time (Fig. 5a). These increased rapidly to a peak during the first 3 d, declined to a low level, and then increased slightly. N2O emissions fluxes across all treatments ranged from –39.6 to 648.2 μg N m−2 h−1, with a mean flux of 41.9 μg N m−2 h−1 over the 35 d incubation period. Negative values indicate soil uptake of N2O. In the initial cultivation phase, N addition did not immediately increase N2O emissions, except when urea was added.
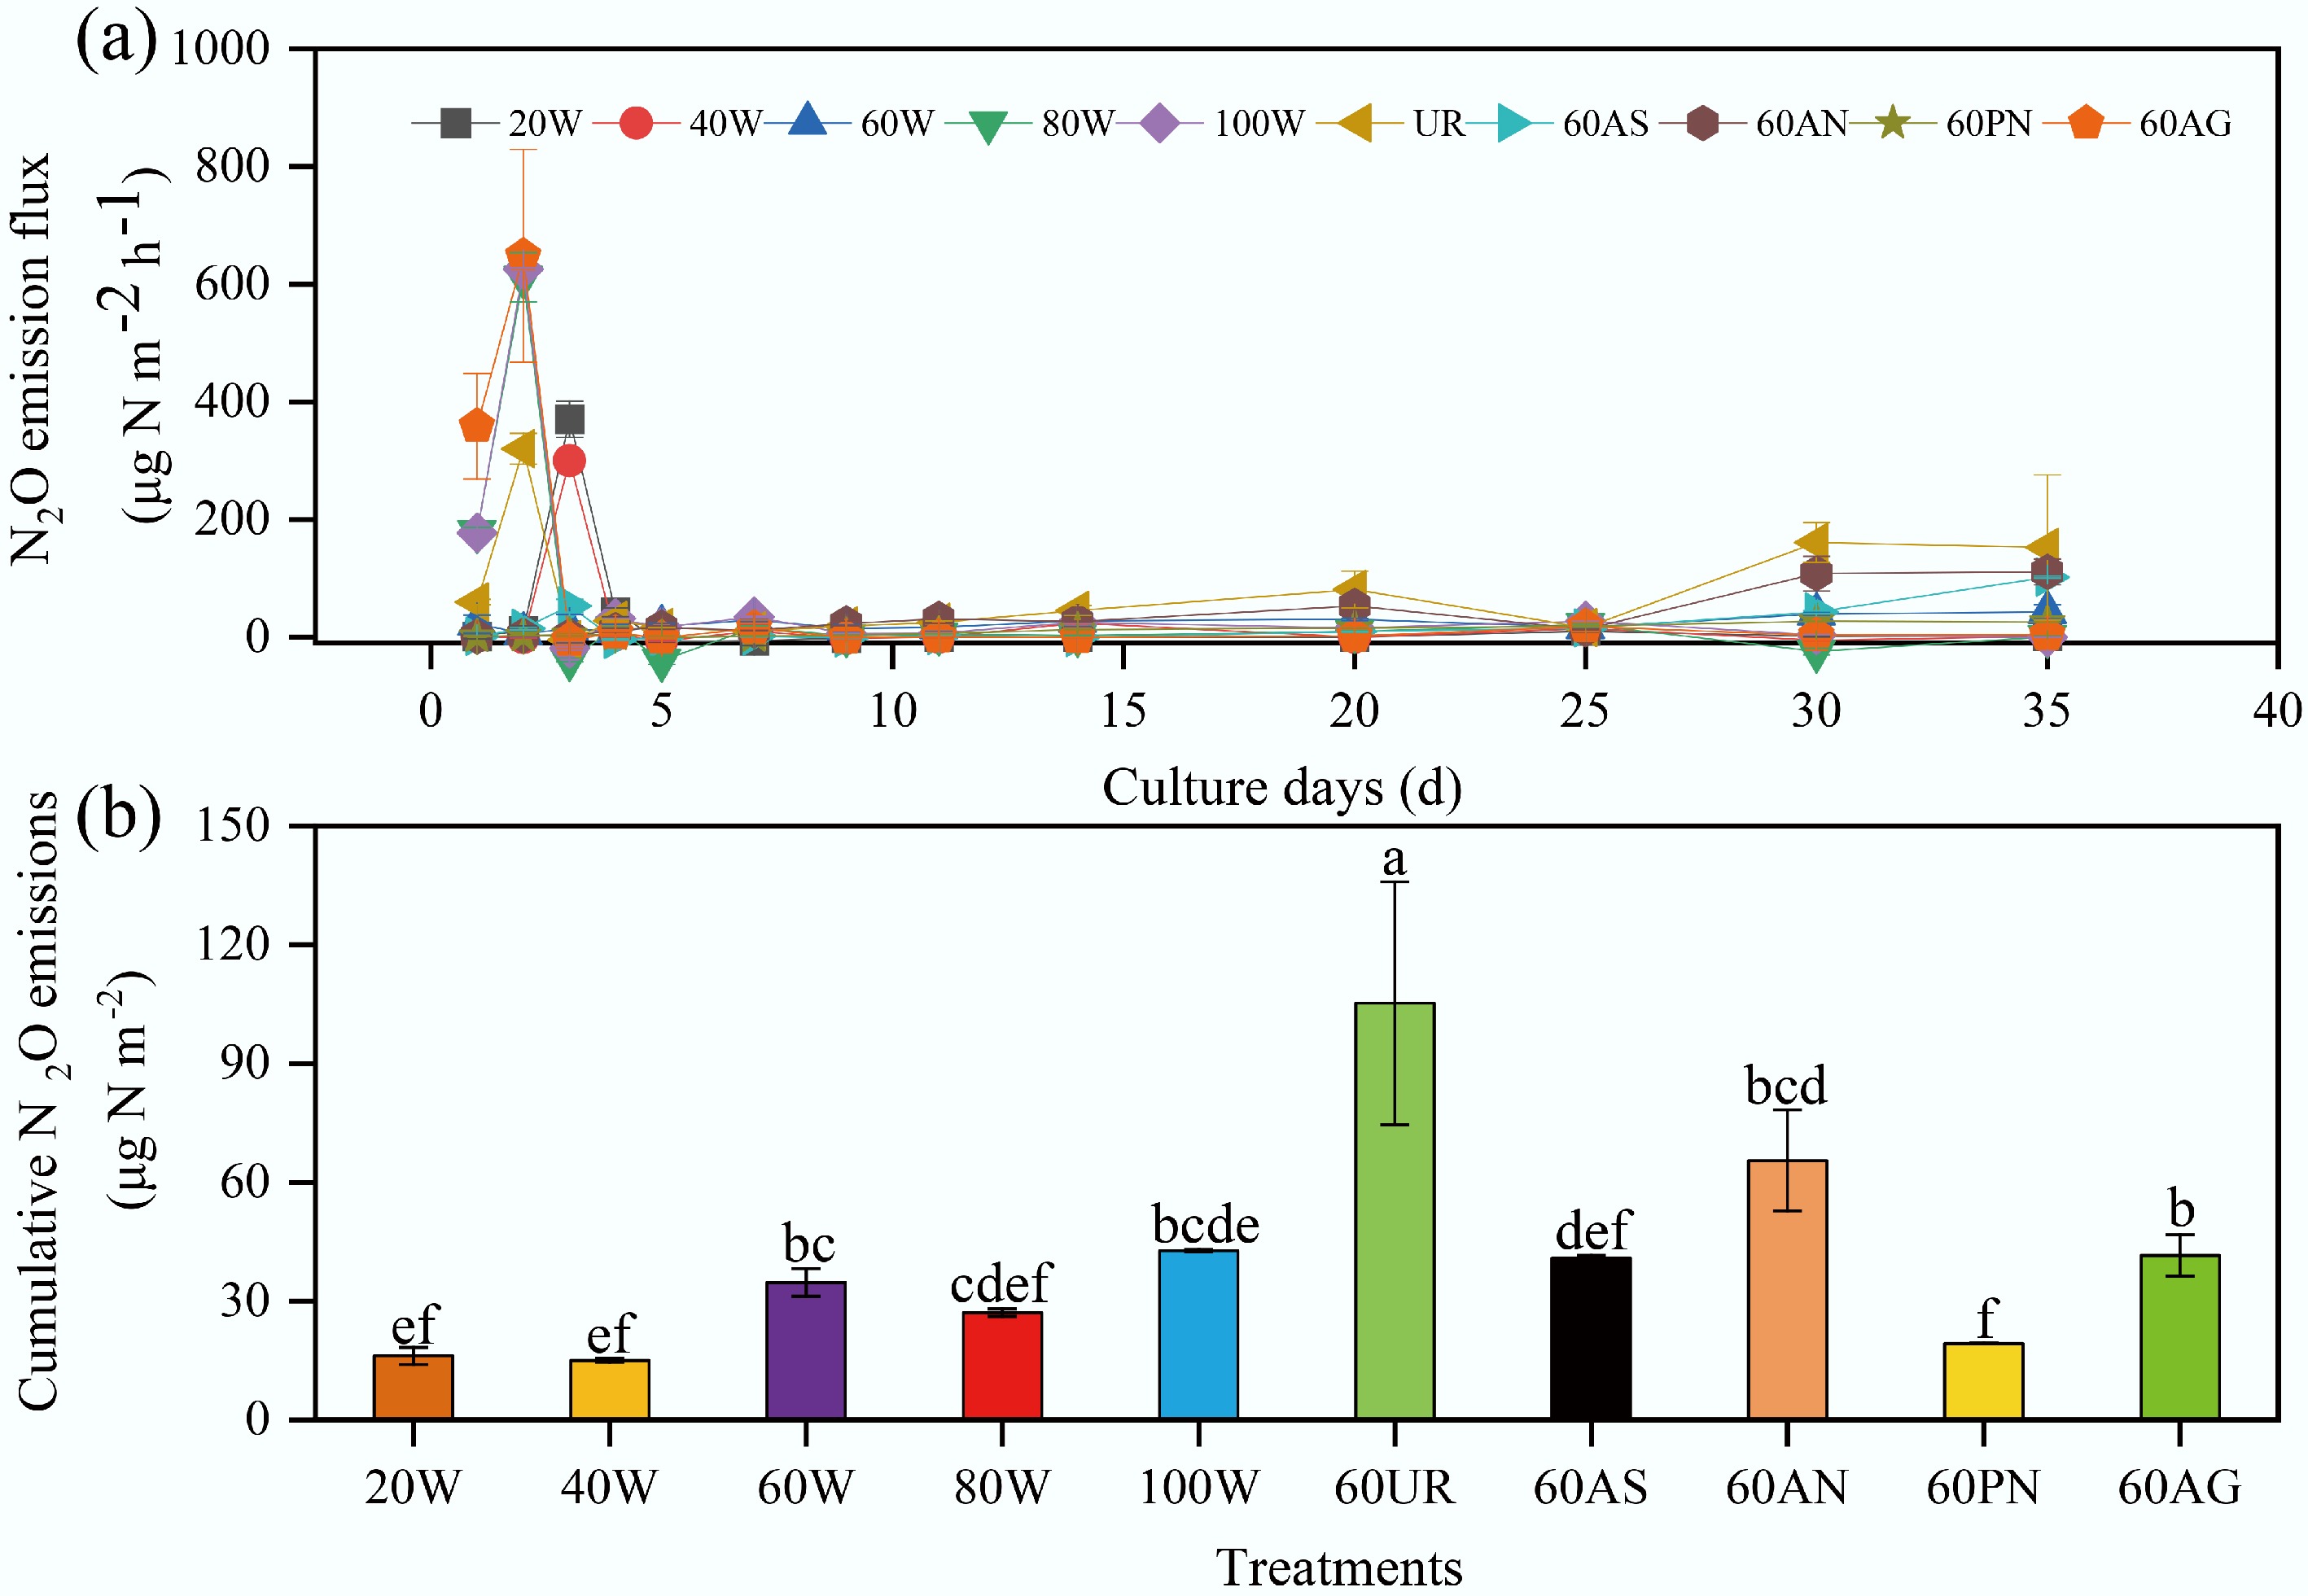
Figure 5.
(a) Soil N2O emission fluxes under different treatments. (b) Cumulative N2O emissions under different treatments. The abbreviations in the figure denote: 20 W−20% WFPS, 40 W−40% WFPS, 60 W−60% WFPS, 80 W−80% WFPS, 100 W−100% WFPS, 60UR−60% WFPS + urea, 60AS−60% WFPS + ammonium sulfate, 60AN represents−60% WFPS + ammonium nitrate, 60PN represents–60% WFPS + potassium nitrate, and 60AG represents–60% WFPS + glucose.
Throughout the experiment, the highest cumulative N2O emissions occurred in the 60% WFPS + urea treatment, followed by the 60% WFPS + ammonium nitrate. The lowest cumulative emissions were observed at the 40% WFPS (Fig. 5b). The 35 d cumulative N2O emissions for water-only treatments ranged from 15 to 42.8 μg N m−2, representing 4.3%−12.1% of total soil inorganic nitrogen. Nitrogen-amended treatments showed cumulative emissions ranging from 19.3 to 105.2 μg N m−2, accounting for 0.5%−2.6% of total soil inorganic nitrogen. The urea-amended treatment released significantly more N2O than the other nitrogen treatments. The 60% WFPS + glucose treatment produced cumulative N2O emissions of 41.6 μg N m−2, representing 11.8% of total soil inorganic nitrogen.
Abundances of AOA amoA, AOB amoA, nirS, nirK, and nosZ genes
-
The abundances of AOA amoA, AOB amoA, nirS, nirK, and nosZ along the N and NE transects of the pig farm are shown in Fig. 6. The abundance of AOA amoA generally decreased with increasing distance from the pig farm. Additionally, the abundances of the AOA amoA gene in the soil along the N and NE transects were significantly higher (average 4.6 × 10⁶ and 4.3 × 10⁵ copies g−1 fresh soil, respectively) than those of the AOB amoA gene (average 1.3 × 10⁴ and 1.5 × 10⁴ copies g−1 fresh soil, respectively). The AOA amoA: AOB amoA ratios decreased with increasing distance from the pig farm, except at 50 m on the N transect (R2 = 0.63, p < 0.05). The ratios were 7, 861, 101, and 18 at distances of 50, 100, 300, and 500 m, respectively, along the N transect downwind of the pig farm. The ratios in the NE transect were 310, 231, 36, 2, and 4 at distances of 50, 100, 200, 300, and 500 m, respectively. However, the trend in the abundances of nirK, nirS, and nosZ with increasing distance from the pig farm was not significant (R2 < 0.05, p > 0.2). Along the N and NE transects, abundances ranged from 8.7 × 10⁷ to 1.5 × 10⁸, and 6.9 × 10⁷ to 1.2 × 10⁸ copies, 1.2 × 10⁶ to 3.2 × 10⁶, and 1.6 × 10⁶ to 3.5 × 10⁶ copies, and 1.8 × 10⁶ to 6.7 × 10⁶ , and 1.5 × 10⁶ to 3.1 × 10⁶ copies, per g of fresh soil for nirK, nirS, and nosZ, respectively.
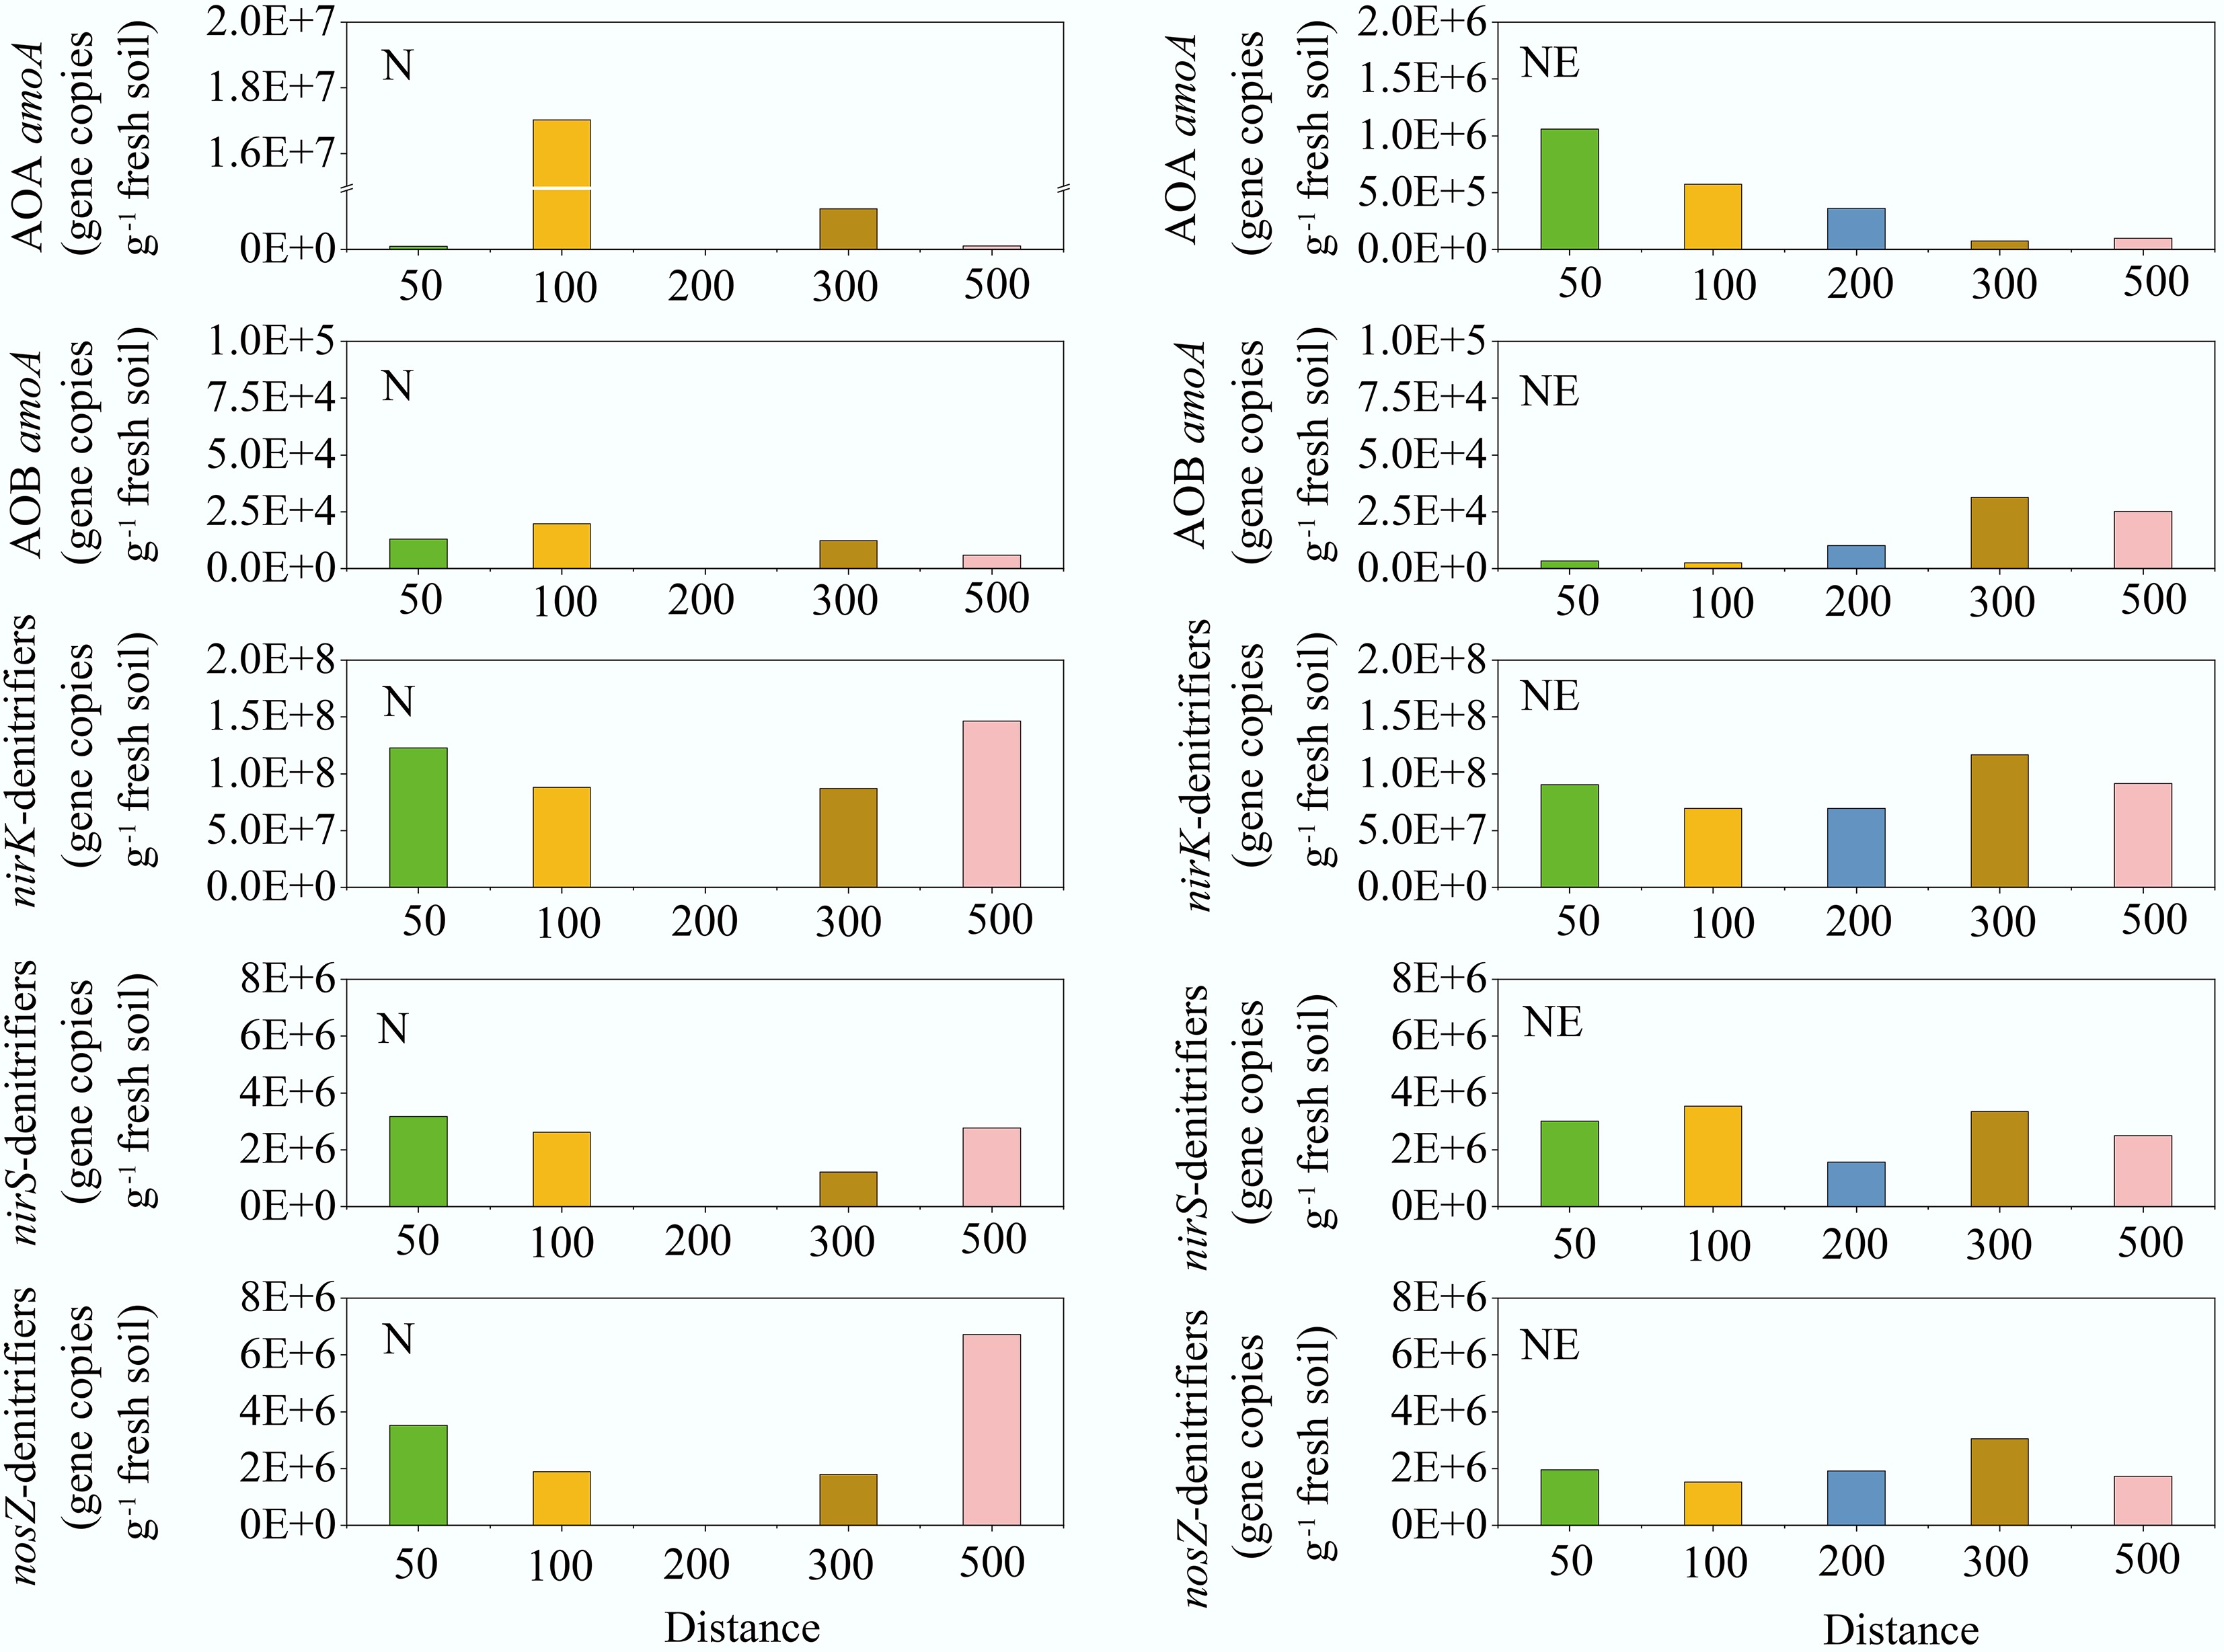
Figure 6.
The abundances of AOA amoA, AOB amoA, nirS, nirK, and nosZ genes in the N and NE transects of the pig farm.
-
As shown in Fig. 7a, the annual fluxes of N2O emissions along the NE transect ranged from 0.2 to 0.4 kg N ha−1 yr−1, with an average value of 0.3 kg N ha−1 yr−1. Annual fluxes of N2O emissions along the N transect declined from 0.8 kg N ha−1 yr−1 at 50 m to 0.4 kg N ha−1 yr−1 at 500 m (mean: 0.5 kg N ha−1 yr−1). N2O emissions generally decreased with increasing distance from the pig farm (R2 > 0.7, p < 0.05). The results suggest that elevated NH3 deposition might stimulate N2O increases by enhancing substrate availability (through the enrichment of NH4+ in soil) for denitrification and nitrification. These findings are consistent with those of previous studies conducted at dairy farms in central England[33] and poultry/pig farms in Scotland and East Anglia[30]. However, local spatiotemporal variations in environmental conditions (e.g., soil moisture) may have weakened the linear relationship between N2O emissions and NH3 deposition during the study period. The average annual cumulative N2O emissions near the pig farm were 0.4 kg N ha−1 yr−1 (Fig. 7a). The result was slightly higher than the 0.3 kg N ha−1 yr−1 reported by Ellis et al.[33] downwind of a central England dairy farm. This result matched the 0.4 kg N ha−1 yr−1 observed in subtropical forestland under natural conditions[34]. However, the value was lower than measurements from a southern China coniferous plantation (1 kg N ha−1 yr−1)[35]; Hubei's Heshengqiao pine plantation (0.7 kg N ha−1 yr−1)[36]; and subtropical Masson pine forest soil (1.6 kg N ha−1 yr−1)[37]. The differences are likely attributable to the significantly higher precipitation levels in the above regions (> 1,300 mm) compared with those in the study area (940 mm).
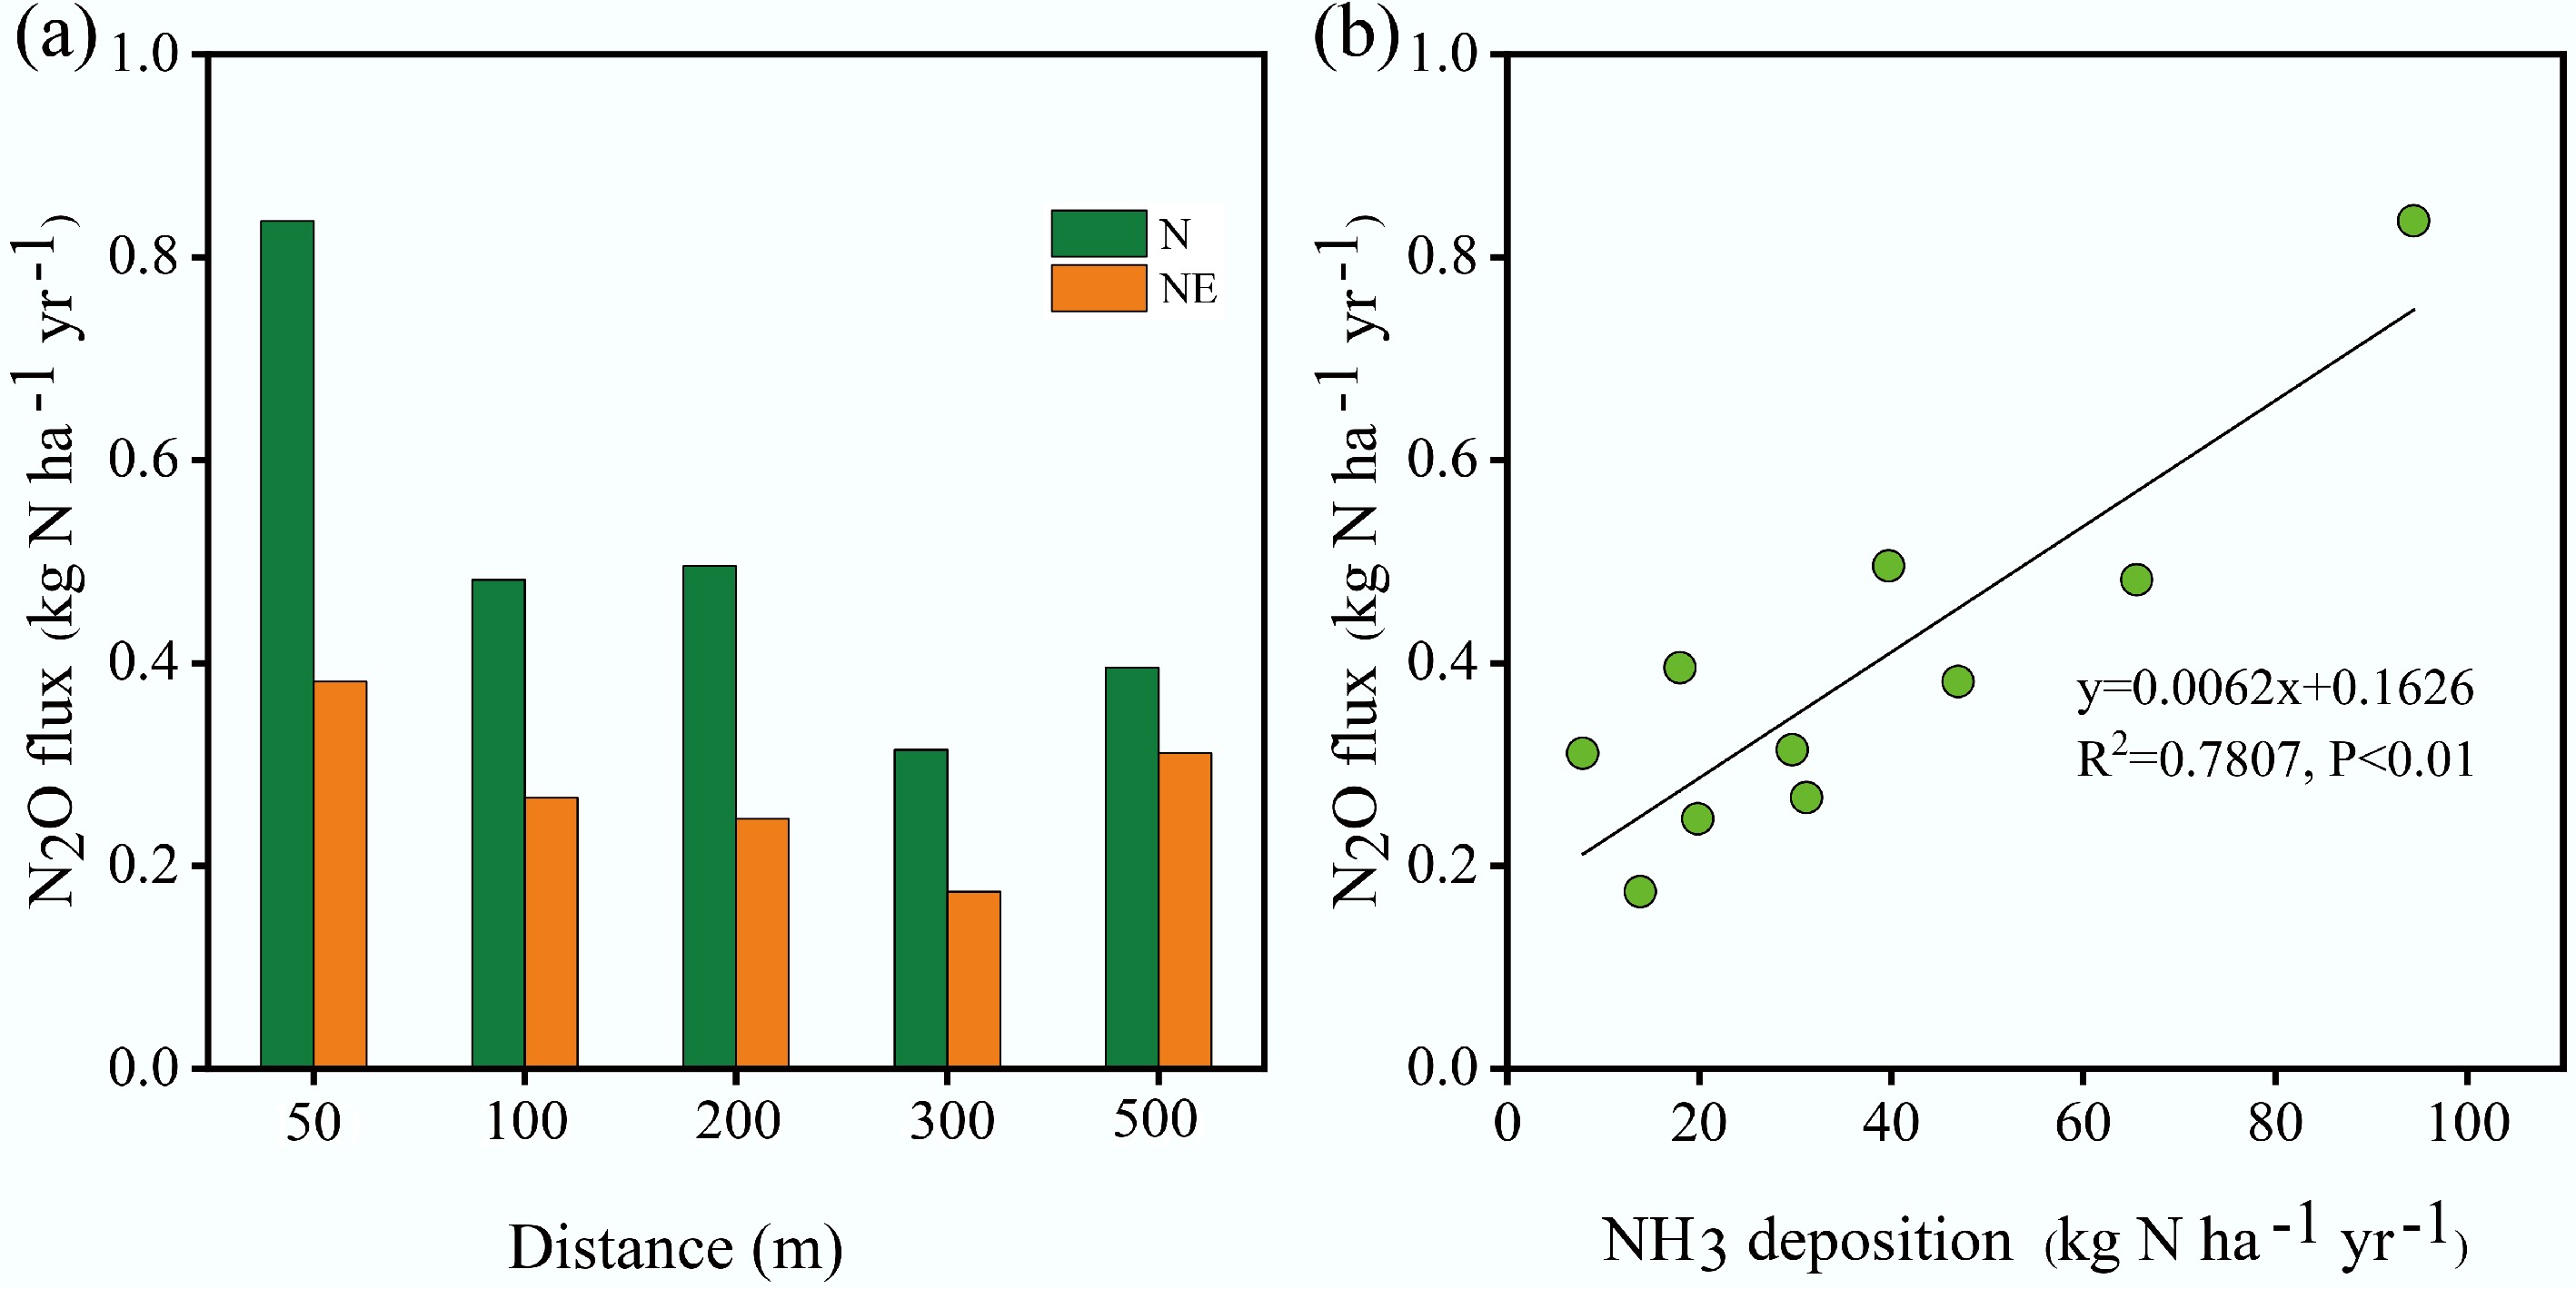
Figure 7.
(a) N2O flux at different distances from the pig farm along the N and NE transects. (b) Relationship between NH3 deposition and N2O flux.
The N2O production pathways are significantly influenced by climate, soil pH, SOC, and soil texture. Increased precipitation boosts N2O flux owing to enhanced substrate availability and microbial activity[38]. The soil in the study area is acidic, likely because of NH3 deposition from the farm. In acidic and aerobic soils, nitrification remained active and is primarily driven by acid tolerance[39], while the denitrification pathway is inhibited[40]. SOC serves as an essential carbon source for microbial metabolism during N cycling[41]. SOC levels influence the relative contributions of nitrification and denitrification to overall N2O emissions[42]. The sandy soil texture in the study area created more aerobic microenvironments, favoring N2O production pathways associated with ammonia oxidation[43].
A strong positive correlation was observed between NH3 deposition and N2O emissions (Fig. 7b). Extrapolating this relationship across eight wind directions within 500 m of the farm (Supplementary Table S3) revealed annual emissions of 69.7 kg N yr−1, representing 1.3% of total NH3 deposition[27]. This exceeds the IPCC's default 1% emission factor for N deposition-induced N2O[44], suggesting that animal-farm-deposited NH3 undergoes substantial re-emission as N2O. Consequently, such emissions might constitute an important 'secondary agricultural' N2O source[18,19].
Effects of N forms on soil N2O emissions
-
The results of the incubation experiment showed significant differences in cumulative N2O emissions among treatments with urea, NH4+-N, and NO3−-N additions (Fig. 5). Urea significantly increased soil N2O emissions, as reported by Götze et al.[45]. This was likely due to substantial NH3 production from urea hydrolysis and, by extension, supported the conclusion that nitrification was the dominant N2O-producing process. The incubation results indicate that the 60% WFPS + ammonia sulfate treatment emitted more N2O than the 60% WFPS + potassium nitrate treatment, which suggests that soil N2O emissions were influenced by N form. Furthermore, the field monitoring experiments indicated that soil N2O emissions showed a stronger positive correlation with soil NH4+-N (Supplementary Fig. S3) than with NO3−-N (Supplementary Fig. S4). With mechanistic support from incubation results and correlation-based evidence from field results, these findings suggest that NH3/NH4+-N deposition may lead to higher N2O emissions than NO3−-N deposition. A similar conclusion was reached in field studies of Yu et al.[46] and Li et al. [35].
This field study revealed that soil N2O emissions exhibited a clear negative correlation with soil moisture (Supplementary Fig. S5). However, a study on intact soil cores obtained from 13 European sites under controlled laboratory conditions showed that N2O emissions were positively correlated with soil moisture[47]. This may be attributed to the high NH4+-N content of the soil, which makes nitrification a significant source of soil N2O emissions. Higher soil moisture may inhibit nitrification (an aerobic process)[48]. A positive relationship between soil N2O emissions and soil temperature was observed in the study (Supplementary Fig. S6). This was likely because compared to denitrification, nitrification responded more significantly and directly to warm, aerobic conditions at the study sites[49].
The findings suggested that nitrification is the most prevalent source of N2O emissions, consistent with the results of several previous studies[29,50,51]. This may be related to soil pH and moisture conditions at the experimental sites. Low soil pH (soil pH ~5.0) (Supplementary Table S1) favored the activity of AOA[52], but was detrimental to the activity of both AOB and denitrifying bacteria[53]. Similarly, lower soil moisture levels negatively affected the function of denitrifying bacteria[54].
Regulation of the N-cycle functional genes on soil N2O emissions
-
As observed in the current study, the abundance of AOA amoA generally decreased with increasing distance from the pig farm (Fig. 6), likely because NH3 deposited from the farm elevated soil NH4+ concentrations and provided substrates for nitrifying microorganisms. Notably, AOA amoA gene abundances significantly exceeded those of AOB amoA gene throughout the study area. The AOA : AOB amoA ratios exhibited a distance-dependent decline, ranging from two to 861 (average = 174) within 500 m downwind. The natural gradient of atmospheric NH3 deposition near animal farms may drive shifts in soil nitrifier abundance. However, the dominance of the AOA gene abundance did not indicate that its function was dominant. Functional dominance in nitrification is moderated by factors such as gene expression, enzyme kinetics, and environmental context. A previous study reported that AOA abundance is closely correlated with its functional dominance in nitrification[55]. The acidic soils in this study might support AOA growth more than AOB[39]. Chronically high NH3 deposition from farms may exacerbate soil acidification[56,57]. This might lead to the expansion and increased activity of AOA, whereas AOB activity would decline[39]. Therefore, in environments with chronically high NH3 deposition, nitrification undergoes a community shift with AOA becoming dominant in the nitrifying community. Regression analysis revealed a positive correlation between N2O flux and AOA amoA abundance (R2 = 0.4737, p < 0.05) (Supplementary Fig. S7), indicating that NH3 deposition modulated the AOA populations, which in turn governed nitrification-derived N2O emissions. These findings are consistent with observations from China's Gurbantunggut Desert, where AOA primarily regulates N2O production[58], but contrast with Xizang alpine meadow ecosystems where AOB dominates[29]. No statistically significant relationship was detected between N2O flux and denitrification genes (nirS, nirK, and nosZ). This is likely due to the inhibition of denitrification under aerobic conditions. Collectively, these findings demonstrate that soil N2O emissions can be partially explained by the abundance of nitrogen-cycling functional genes[59].
-
This study investigated the effects of elevated NH3 deposition near a pig farm on soil N2O emissions and their subsequent influence on N-cycle functional genes. Total N2O emissions within a 500 m radius of the pig farm were estimated at 69.7 kg N yr−1, accounting for approximately 1.3% of the total estimated NH3 deposition from the farm. N2O fluxes were positively correlated with NH3 deposition, soil ammonium (NH4+-N), and the abundance of ammonia-oxidizing archaea (AOA). This suggests that NH3 deposition boosted N2O emissions, mainly by enhancing AOA-mediated nitrification. Lab experiments confirmed that NH4+-N produced larger N2O fluxes than nitrate-N (NO3−-N) at 60% soil water-filled pore space. Future research could utilize 15N tracer techniques to quantify the relative contributions of nitrification and denitrification and explore the underlying microbial mechanisms that drive soil N2O fluxes.
-
It accompanies this paper at: https://doi.org/10.48130/nc-0025-0023.
-
Not applicable.
-
The authors confirm their contributions to the paper as follows: Wuying Yi: analysed the data, wrote the paper; Guoping Liu: revised the manuscript; Man Kang: conducted the analytical work; Juan Wang: conducted the analytical work; Hongzhao Yuan: conducted the analytical work; Deli Chen: revised the manuscript; Jinshui Wu: revised the manuscript; Jianlin Shen: conceived, designed and financially supported the study. All authors commented on previous versions of the manuscript, reviewed the results, and approved the final manuscript.
-
The datasets generated during and/or analyzed during the current study are available from the corresponding author on reasonable request.
-
This work was supported by the National Key Research and Development Program of China (Grant No. 2024YFC3711903), and the National Natural Science Foundation of China (Grant No. 42477378).
-
The authors declare that they have no conflict of interest.
-
Full list of author information is available at the end of the article.
- The supplementary files can be downloaded from here.
- Copyright: © 2026 by the author(s). Published by Maximum Academic Press, Fayetteville, GA. This article is an open access article distributed under Creative Commons Attribution License (CC BY 4.0), visit https://creativecommons.org/licenses/by/4.0/.
-
About this article
Cite this article
Yi W, Liu G, Kang M, Wang J, Yuan H, et al. 2026. Increased soil N2O emissions under natural gradient of atmospheric NH3 deposition. Nitrogen Cycling 2: e011 doi: 10.48130/nc-0025-0023 

Increased soil N2O emissions under natural gradient of atmospheric NH3 deposition
- Received: 30 October 2025
- Revised: 16 December 2025
- Accepted: 29 December 2025
- Published online: 28 January 2026
Abstract: Regions near intensive livestock farms experience high atmospheric ammonia (NH3) deposition. However, the effects of this deposition on local soil nitrous oxide (N2O) emissions remain underexplored. This study investigated the effects of farm-originated NH3 deposition on soil N2O emissions and nitrogen-cycle genes. Soil N2O fluxes were measured downwind (50–500 m) of an intensive pig farm in central southern China. Laboratory incubations also tested the effects of the nitrogen form and soil moisture on these fluxes. Results showed that N2O emissions generally increased with NH3 deposition. Within a 500 m radius, total N2O emissions were estimated at 69.7 kg N yr−1, representing 1.3% of the total NH3-N deposited (5,400 kg N yr−1). N2O fluxes were positively correlated with NH3 deposition, soil ammonium (NH4+-N), and the abundance of ammonia-oxidizing archaea (AOA). This suggests that NH3 deposition increases N2O emissions, primarily by boosting AOA-mediated nitrification. Lab experiments confirmed that NH4+-N produced larger N2O fluxes than nitrate-N (NO3−-N) at 60% soil water-filled pore space. In conclusion, atmospheric NH3 deposition significantly increased soil N2O emissions near livestock farms, highlighting the need to consider its role in accelerating global warming.
-
Key words:
- N2O emission /
- NH3 deposition /
- Greenhouse gas /
- Functional genes /
- Animal farms