


-
Crop straw is a massive agricultural byproduct, and its rational utilization is central to sustainable farming—yet challenges persist in balancing practicality with environmental benefits. China, for instance, produces approximately 824 million tons of crop straw annually, but only around 40% is effectively utilized[1]. Notably, while straw burning has been officially prohibited in most Chinese regions to curb atmospheric pollution and greenhouse gas emissions, it remains incidentally prevalent in practice. Straw burning remains prevalent in remote areas, primarily due to its low cost and tight planting windows[2,3]. Even unmanaged straw piles often ignite naturally, generating black carbon (BC)-rich ash that accumulates in surface soils[4]. Critically, these same remote farmlands—where straw burning persists—widely rely on plastic mulch films (PMFs) to boost yields (China consumes ~75% of global PMFs[5]), leading to widespread PMF debris (microplastics, MPs) in soils[6]. This creates a realistic, understudied scenario: BC from straw burning/wildfires and PMF debris coexist in agricultural soils, yet how their interactions affect antibiotic resistance genes (ARGs)—a major global health threat—remains unknown.
The emergence of antibiotic resistance poses a global public health crisis, threatening food security, and economic stability[7,8]. Deaths caused by antibiotic-resistant bacteria (ARB) are rising due to multi-drug-resistant 'super bacteria'[9,10], with projections of 10 million annual deaths by 2050[11,12]. Soil ecosystems are key reservoirs of ARGs, and their proliferation is exacerbated by anthropogenic stressors—including PMFs. PMF-derived MPs act as ARG vectors (facilitating horizontal transfer[13−15]), alter soil physicochemical properties and microbial communities, and even promote ARG migration to crops (e.g., leafy vegetables[16]), posing food safety risks. While straw-derived materials (e.g., biochar) have shown promise in curbing ARG proliferation[17−19], the effects of BC from straw burning (the most common BC source in the aforementioned coexistence scenario) on ARG dynamics—especially in PMF-contaminated soils—remain unclarified. This gap is critical, as BC and PMF debris coexist in millions of hectares of Chinese farmlands, making their interaction a pressing, unaddressed issue for soil health and ARG control.
The extensive use of PMF has led to severe soil MP accumulation: Chinese agricultural soils contain 7,100–42,900 plastic particles per kilogram (average: 18,760 particles/kg)[6], with PMF residues as the primary source[20]. MPs can reshape soil C/N/P cycling and microbial communities[21,22], which in turn influence ARG prevalence[16]. However, existing studies on ARG-MP interactions rarely consider BC—a common soil component in straw-burning regions. Worse, crop residues (straw) and PMFs frequently coexist in soils, and their interactions (e.g., BC modifying PMF degradation or microbial responses) could indirectly regulate ARG dissemination. Yet how BC affects microbial communities, ARG abundance in PMF-contaminated soils, and ARG migration in soil-crop systems during crop growth cycles remains poorly understood.
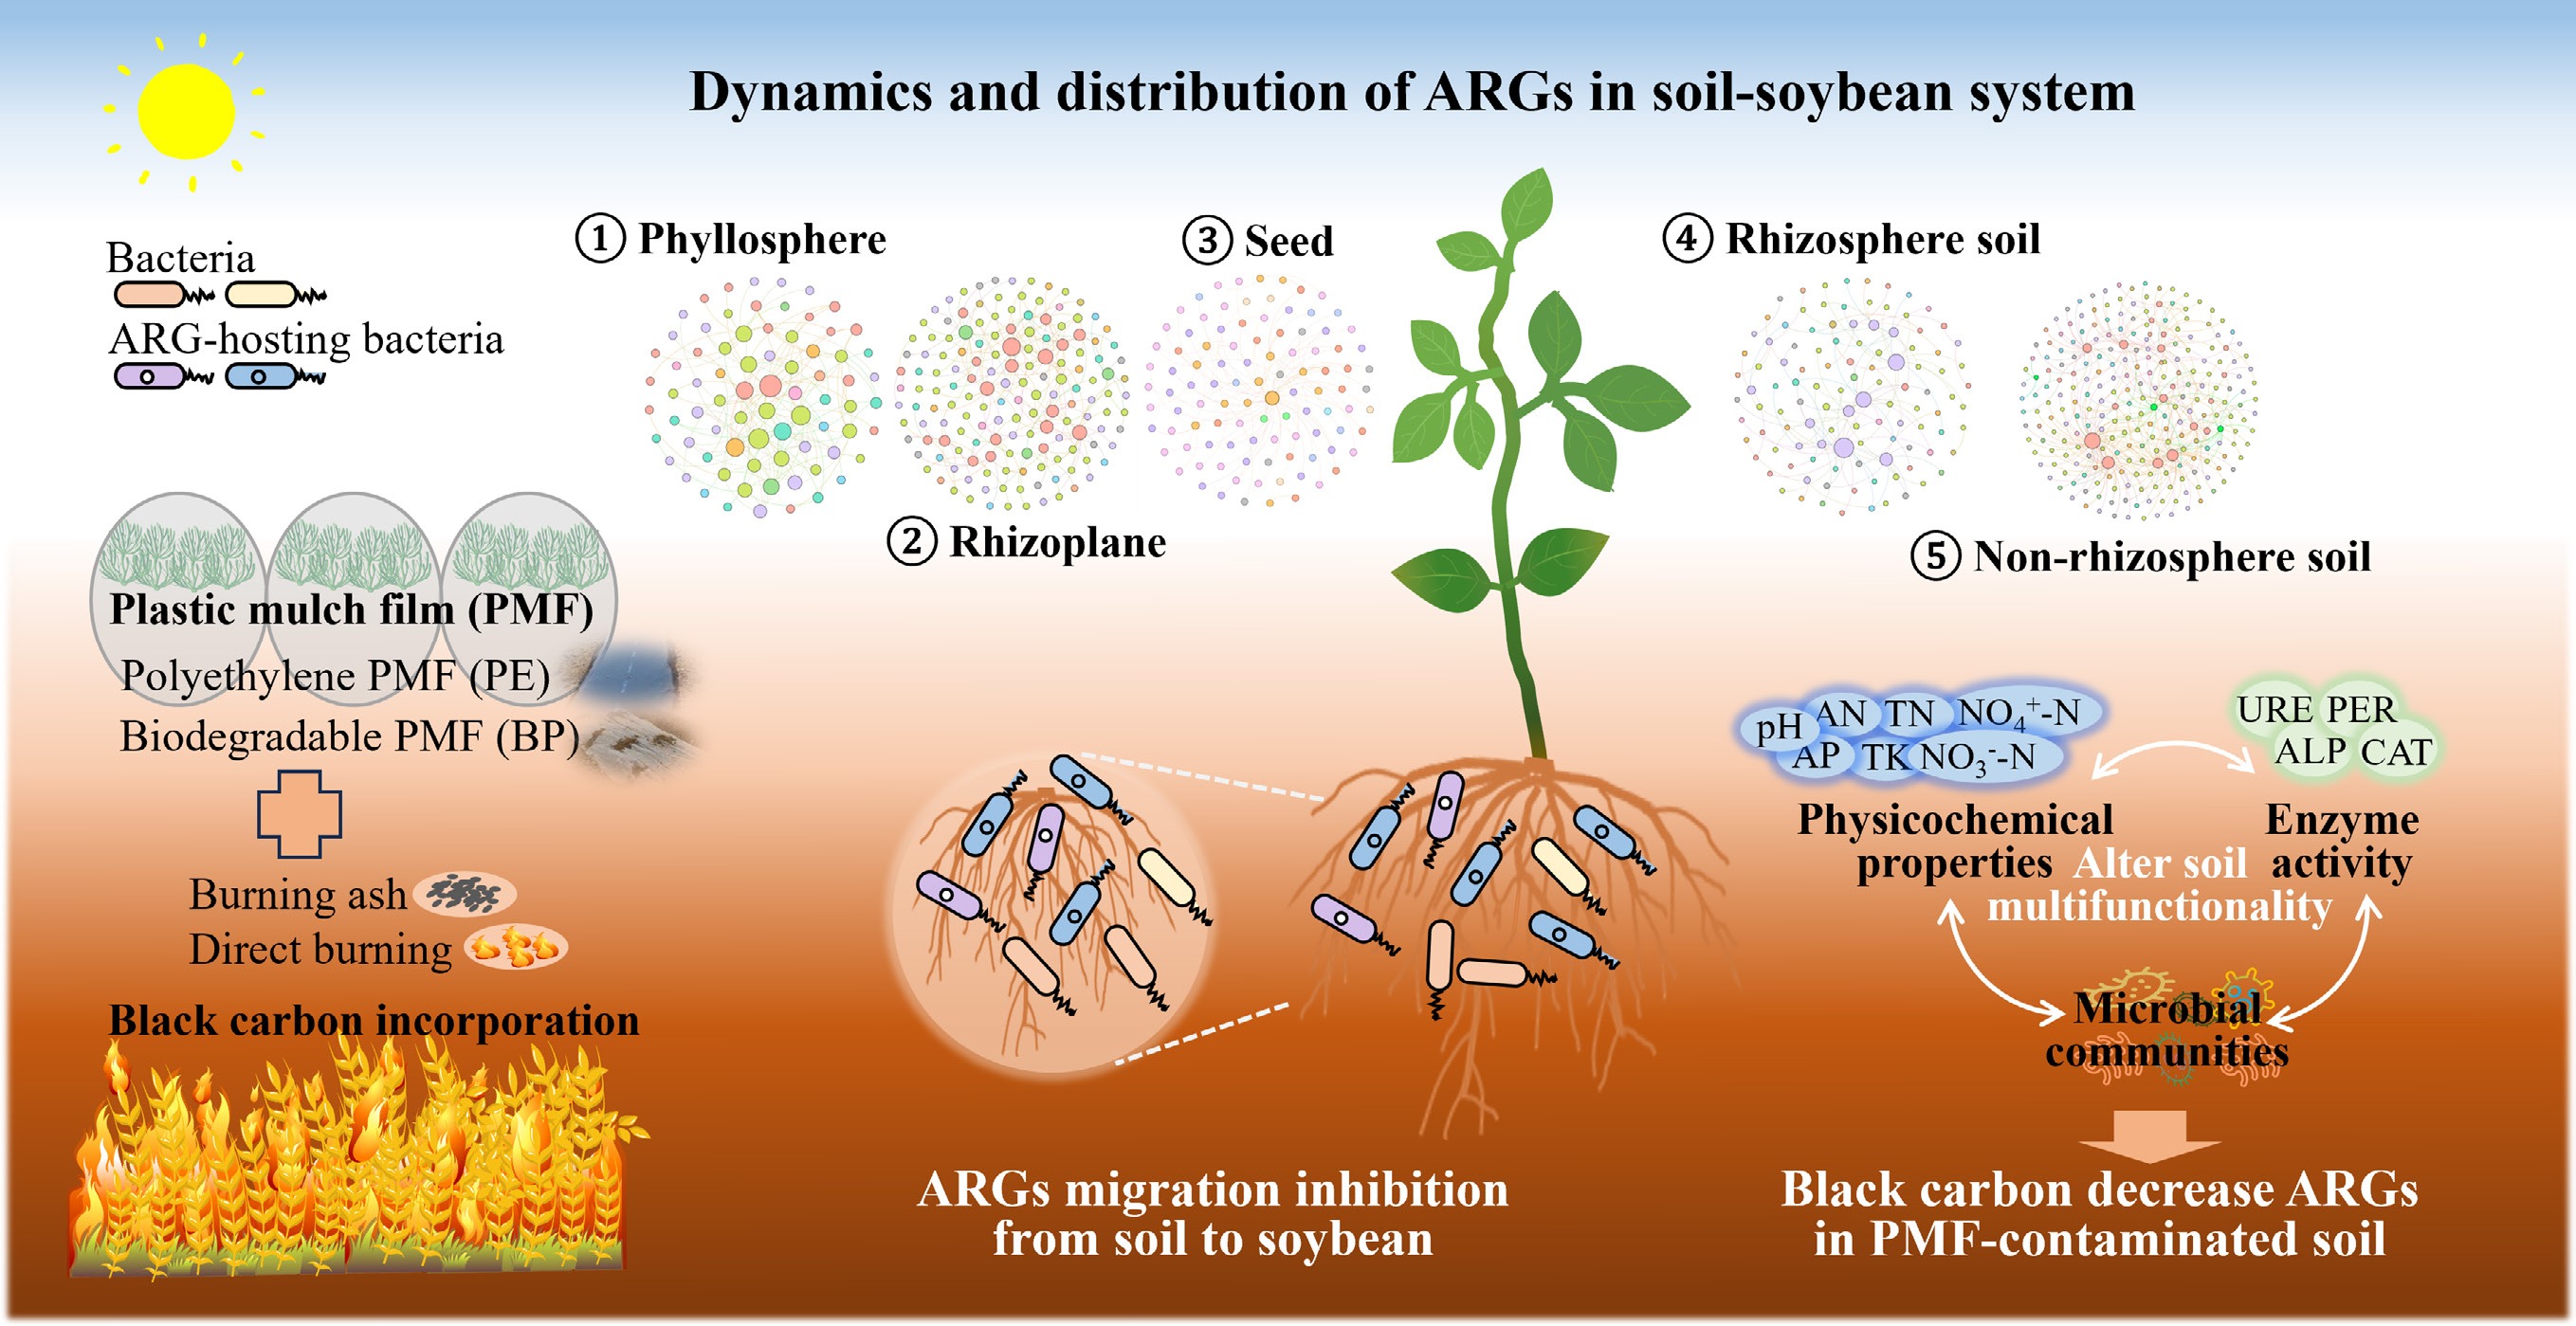
It was hypothesized that BC could reduce ARG abundance in soils containing PMF debris and inhibit ARG migration from soil to crops by modifying soil physicochemical properties and microbial community structures. To test this hypothesis, the effects of BC incorporation (exogenous BC addition and in-situ straw burning) on the distribution of ARGs in soybean non-rhizosphere soil, rhizosphere soil, rhizoplane, phyllosphere, and seeds were systematically investigated in the presence of PMF debris. Microbial communities and ARG abundance in soil-soybean systems were also compared across different growth stages (vegetative and reproductive) under varying PMF treatments. Finally, the driving factors influencing ARG propagation in soil-soybean systems were identified and potential mechanisms by which BC mitigates ARG dissemination explored. The present findings provide valuable insights into using BC as a strategy to reduce antimicrobial resistance and address knowledge gaps in agricultural management for ARG control.
-
Soil (0–20 cm) was collected from an agricultural land in Yuncheng, Shanxi Province (35°41' N, 110°83' E), China. This is a typical agricultural soil in the North China Plain, characterized as a sandy loam (59.17% sand, 23.65% silt, and 17.18% clay), with a pH value of 8.30 (Supplementary Table S1). The properties of this soil (high sand content and alkaline pH) align with conditions where BC is prone to retention and PMFs degrade slowly, making the findings representative of similar semi-arid, alkaline agricultural regions. The site is rotationally farmed for wheat and soybeans and has no history of using PMFs or organic wastes (e.g., compost, biosolids) containing plastic. After removing stones, broken branches, and fallen leaves, the soil was air-dried and screened through a 2 mm nylon sieve as the test soil (Supplementary Text S1 & Text S2). Wheat straw was collected from the same farmland immediately after harvest. PE was obtained from an agricultural warehouse. BP (90% polybutylene adipate-co-terephthalate (PBAT), and 10% polylactic acid (PLA)) was purchased from Shenzhen Greennature Biodegradable Technology Co., Ltd. (Shenzhen, China). The two types of PMFs were cut into 5–10 mm pieces. The size of film fragments was based on literature investigations that determined the size ranges of mulching film fragments in agricultural soils[20]. Soybean seeds were sourced from the Institute of Crop Sciences, Chinese Academy of Agricultural Sciences (Beijing, China).
Experimental design
-
Soybean pot experiments were conducted with and without PMF debris and BC (Supplementary Fig. S1). Test soils (300 g each) were placed in plastic pots (10.0 cm × 8.5 cm, inner diameter × height). Based on previous studies, PMF debris was added at a ratio of 1% (w/w, 3 g per pot) and manually mixed uniformly into the soil to ensure thorough contact with the soil matrix. An equivalent amount of BC (w/w, 3 g) was incorporated into the soil through two treatments: (1) exogenous BC addition: BC (derived from the same batch of wheat straw as used for in-situ burning) was mixed into the soil; (2) in-situ wheat straw burning: wheat straw (same batch as BC source) was directly burned on the soil surface, with the resulting BC-rich ash mixed into the soil. The experiment included eight treatments, each with three replicates: soil without PMF debris or wheat straw (CK), soil with PE (PE), soil with BP (BP), soil with exogenous BC (A), soil with PE and exogenous BC (PEA), soil with BP and exogenous BC (BPA), soil with PE and in-situ wheat straw burning (PEB), and soil with BP and in-situ wheat straw burning (BPB).
Before sowing, the soil in each treatment was incubated for 15 d to stabilize microbial activity, after which soil samples were collected as the initial control (0 month). Subsequently, 3–5 soybean seeds were sown in each pot. All pots were placed outdoors under natural conditions, with soil humidity maintained at about 60%. Samples of soybean rhizosphere soil, non-rhizosphere soil, rhizoplane, phyllosphere, and seed were collected at the vegetative stage (1 month) and reproductive stage (3 months) for microbial sequencing and real-time quantitative PCR (RT-qPCR) analyses. In total, 216 samples were collected: 24 at the early stage, 72 during growth, and 120 at harvest.
PMFs and ash characterization
-
PMFs (PE and BP) were extracted from the soil, rinsed with sterile deionized water, and dried at 60 °C for characterization. Scanning electron microscopy (SEM; Thermo Scientific Quattro S, USA) was used to examine the morphology of pristine PMFs (PE_0m, PEB_0m, BP_0m, and BPB_0m), and those after 3 months of incubation (PE_3m, PEA_3m, PEB_3m, BP_3m, BPA_3m, and BPB_3m), enabling a comparison of morphological changes under different treatments. Fourier transform infrared spectroscopy (FTIR; Thermo Scientific iS50, USA) was used to analyze the chemical structure of PMFs by monitoring functional group changes within the 400–4,000 cm−1 range. The organic elemental composition of wheat straw BC was determined using an Elemental Analyzer (EA; Elementar vario Micro cube, Germany). The BC contained 55.31% C, 0.77% N, 15.17% O, 2.45% H, and 1.20% S. The microstructure and elemental composition of the BC were further analyzed using a Hitachi SU8100 SEM equipped with energy-dispersive spectroscopy (SEM-EDS). SEM images revealed that the BC particles were large, irregularly shaped, and layered (Supplementary Fig. S2).
Physicochemical properties and enzyme activity of soils
-
Soil pH was measured using a pH meter (Sartorius PB-10) with a soil-water ratio of 1:2.5 (w/v). Soil mechanical composition was determined by laser particle size analysis. Electrical conductivity (EC) was measured using a DDSJ-308F conductivity meter. Total nitrogen (TN) and alkali hydrolyzed nitrogen (AN) were determined by the Kjeldahl digestion and alkali hydrolysis diffusion methods, respectively. Ammonia nitrogen (NH4+–N) and nitrate nitrogen (NO3––N) were measured by potassium chloride extraction. Total phosphorus (TP) and total potassium (TK) were analyzed by flame spectrophotometry. Available phosphorus (AP) was extracted with 0.5 M NaHCO3 and determined using the molybdenum-antimony colorimetric method. Soil catalase (CAT) activity was determined by potassium permanganate titration. Alkaline phosphatase (ALP), urease (URE), and peroxidase (PER) activities were determined using the colorimetric method.
Microbial community analysis
-
The TIANNAMP Soil DNA Kit for Soil (TIANGEN, China) was used to extract DNA from samples. The primer pair 338 F (5'-ACTCCTACGGGAGGCAGCAG-3'), and 806 R (5'-GGACTACHVGGGTWTCTAAT-3') were used to amplify 16S rRNA genes of the bacterial community in soil samples. For plant samples, the primer pairs 799F 5'-AACMGGATTAGATACCCKG-3' and 1193R 5'-ACGTCATCCCCACCTTCC-3' were used. Amplification products were sequenced using Illumina's Miseq PE300 platform. Raw sequences were quality-filtered with QIIME software, and operational taxonomic units (OTUs) were clustered at 97% similarity using UPARSE (Supplementary Tables S2–S4).
Quantification of 16S rRNA genes, ARGs, and MEGs
-
First, the abundance of 271 ARGs and mobile genetic elements (MGEs) in one soil and one soybean sample was determined by RT-qPCR. Based on these results, genes with wide distribution and high abundance were selected for further analysis across all samples. These genes included: sulfonamide (sul1 and sul2), tetracycline (tetS, tetO-02, tetJ, tetL-02, and tetC-02), aminoglycoside (AAC(6')-II, AADA5-01, and AMPC-06), β-lactamase (BLAOXA1/BLAOXA30, BLATEM, BLAZ, and PBP5), fluoroquinolones, quinolones, flufenicol, chloramphenicol, and amphenicin (FCA) (CMX(A)), macrolidene-lincoamido-streptomycin B (MLSB) (ERM(35), ERM(36), ERMA, ERMX, and MEXF), vancomycin resistance gene (VANSC-02), and MGEs (tnpA-04, intI1, and tnpA-07).
Relative abundance was calculated using the 2−ΔCᴛ method, where ΔCᴛ = Cᴛ (target gene) − Cᴛ (16S rRNA gene), and Cᴛ represents the critical cycle number. Fold change (FC) was used to compare the abundance of ARGs and MGEs across different groups: ΔΔCᴛ = ΔCᴛ (treatment) − ΔCᴛ (reference), FC = 2−ΔΔCᴛ. Bioaccumulation factor (BAF) quantified ARG enrichment capacity in soybean leaves and roots relative to soil: BAF = RAsoybean/RAsoil. Primer sequences of all target genes are listed in Supplementary Table S5.
Statistical analysis
-
All experiments were conducted in triplicate. Prior to statistical analysis, the normality of data distribution was tested using the Shapiro-Wilk test. Data are presented as mean ± standard deviation. Differences between treatments were assessed using one-way ANOVA in IBM SPSS 27, with a significance threshold of p < 0.05. GraphPad Prism 10, Origin 2019, and R 4.0.3 were used for data graphical visualization.
-
After three months of incubation in soil (PE_3m and BP_3m), the PMF debris surface became rough, exhibiting cracks and noticeable deformation due to soil abrasion (Fig. 1a). Direct straw burning (PEB_0m and BPB_0m) caused heat deformation, resulting in surface curling, folds, clumping, and irregular edges. After three months, the number of holes increased in PEB_3m and BPB_3m. In BC-added treatments (PEA_3m and BPA_3m), BP PMF debris displayed rougher surfaces than PE PMF debris, likely due to the preferential microbial degradation of BP materials. Under straw burning treatments (PEB_3m and BPB_3m), PE PMF debris deformed more extensively than BP PMF debris, possibly because the thinner PE (0.014 mm) was more susceptible to heat deformation.
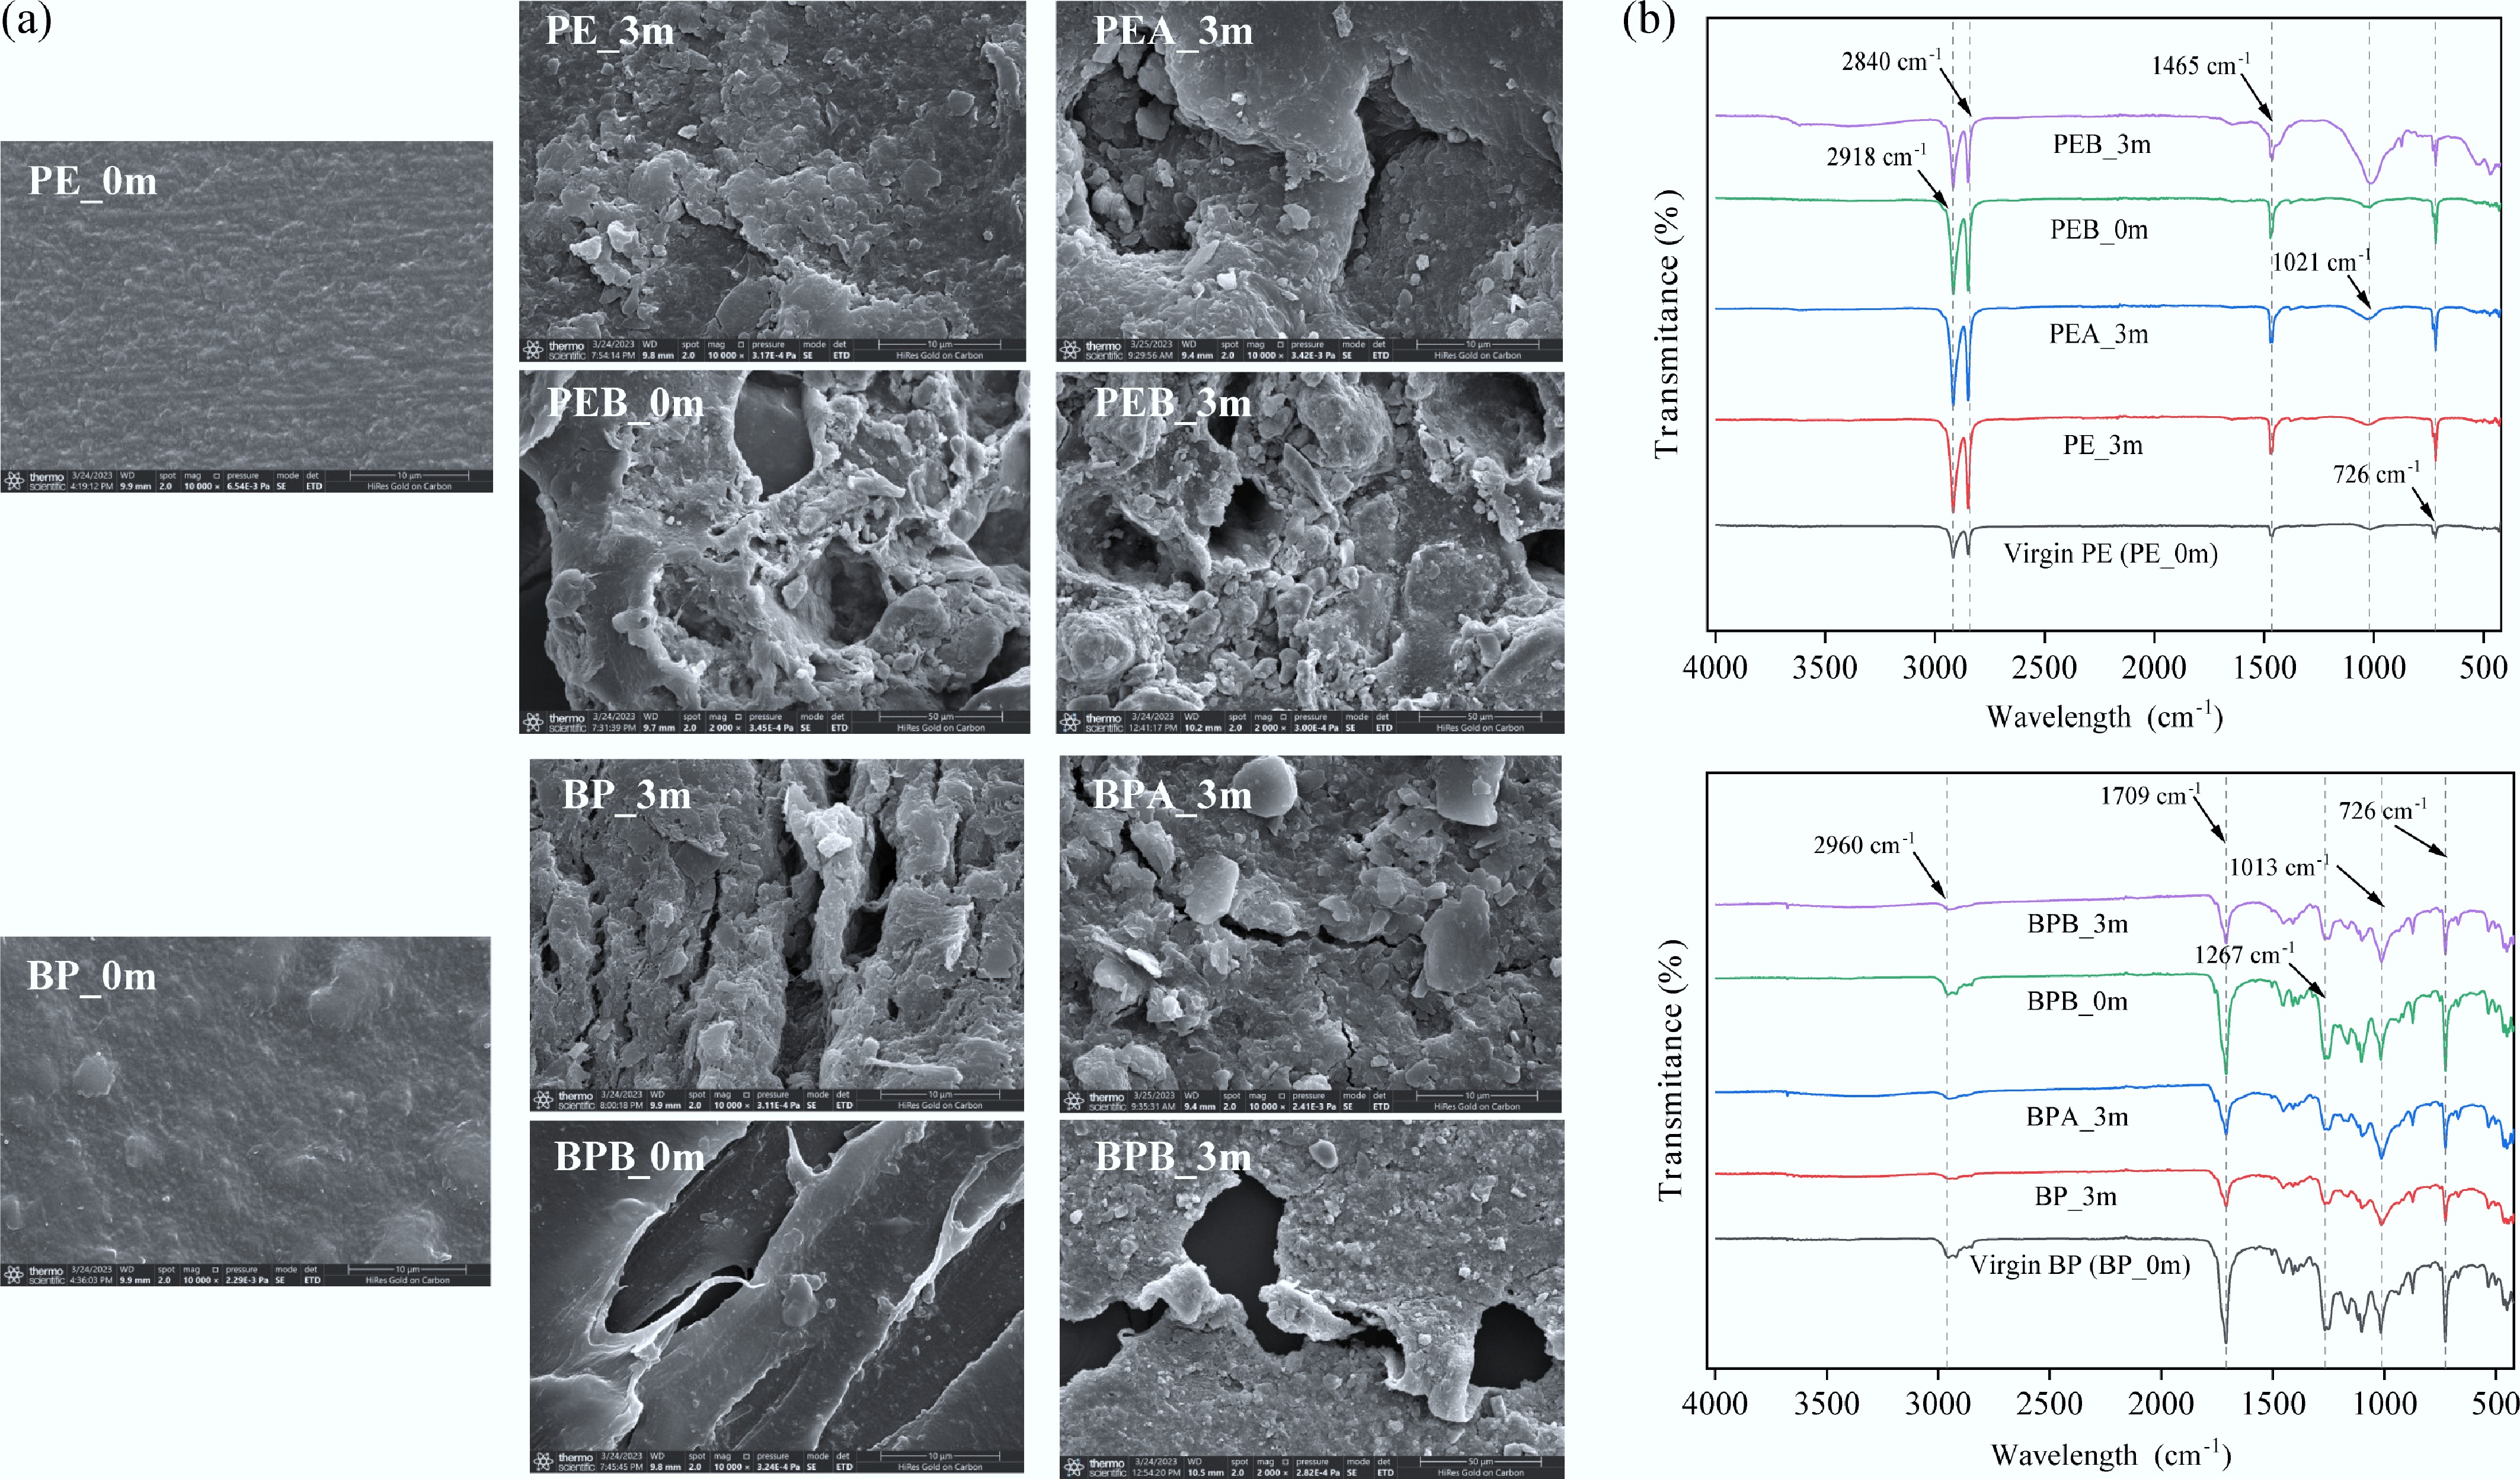
Figure 1.
Characterization of PMFs. (a) Scanning electron microscope (SEM) images, and (b) Fourier transform infrared spectra (FTIR) of PMF (PE and BP) under different treatments.
Compared to the initial PE (PE_0m), PE_3m, PEA_3m, and PEB_3m exhibited stronger peaks at 2,918, 2,840, 1,465, and 719 cm–1 (Fig. 1b), implying an increase in C–H, C–O, and O-H groups, oxidation in the polymer chain, and aging of PE[23]. Notably, peaks at 1,021 cm–1 appeared in PEB_0m and PEB_3m. For BP samples (BP_3m, BPA_3m, and BPB_3m), weaker peaks at 1,709, 1,267, 1,013, and 726 cm–1 demonstrated decreased C=O, C–O, and O-H groups (Fig. 1b) signifying surface degradation, which was attributed to the oxidation and decomposition of BP into O-containing compounds[24]. These findings revealed that PMF debris underwent mechanical degradation, while BP PMFs also experienced biodegradation after soil burial. Additionally, straw burning had a stronger impact on PMF functional groups compared to BC treatments. The observed changes in the physicochemical properties of PMFs may further influence microbial community responses and ARG dynamics in soil-crop systems.
Physicochemical properties of soils
-
Compared to CK (pH 8.56–9.50), PE (pH 8.03–8.95) and A (pH 7.74–9.32) treatments reduced soil pH, while BP (pH 9.24–9.59) increased it (Supplementary Fig. S3a). The addition of BC in PEA (pH 7.83–9.54) elevated soil pH compared to PE alone, whereas PEB (pH 7.91–9.18) remained stable. Both BPA (pH 8.53–9.45) and BPB (pH 8.81–9.10) reduced soil pH relative to BP alone. These pH changes likely reflect the effects of MPs and BC on soil porosity and the microbiome[25,26]. Soil TN content increased under PE (14.75% and 14.55%) and BP (3.28% and 5.45%) treatments, likely due to pH changes affecting nutrient mobility (Supplementary Fig. S3b). AN content decreased consistently over time in PEB and BPB treatments, while other treatments initially increased AN before a subsequent decrease (Supplementary Fig. S3c). CK had the highest AN content (94.27 mg/kg) at 1 month. BC reduced AN in PE-amended soils, with the most significant reductions observed in direct burning treatments. Overall, NH4+–N content decreased over time across all treatments (Supplementary Fig. S3d). PE increased soil NO3––N content by 48.67%–136.28%, while BP decreased it by 44.97%–48.38% relative to CK (Fig. 2a), consistent with previous findings that PBAT and PLA MPs reduce NO3––N levels[24,27]. The interconnected C, N, and P cycles in soil ecosystems were evident in the observed microbial activity[28]. MPs affected soil C/N/P-associated bacteria, influencing soil nutrient cycling[21].
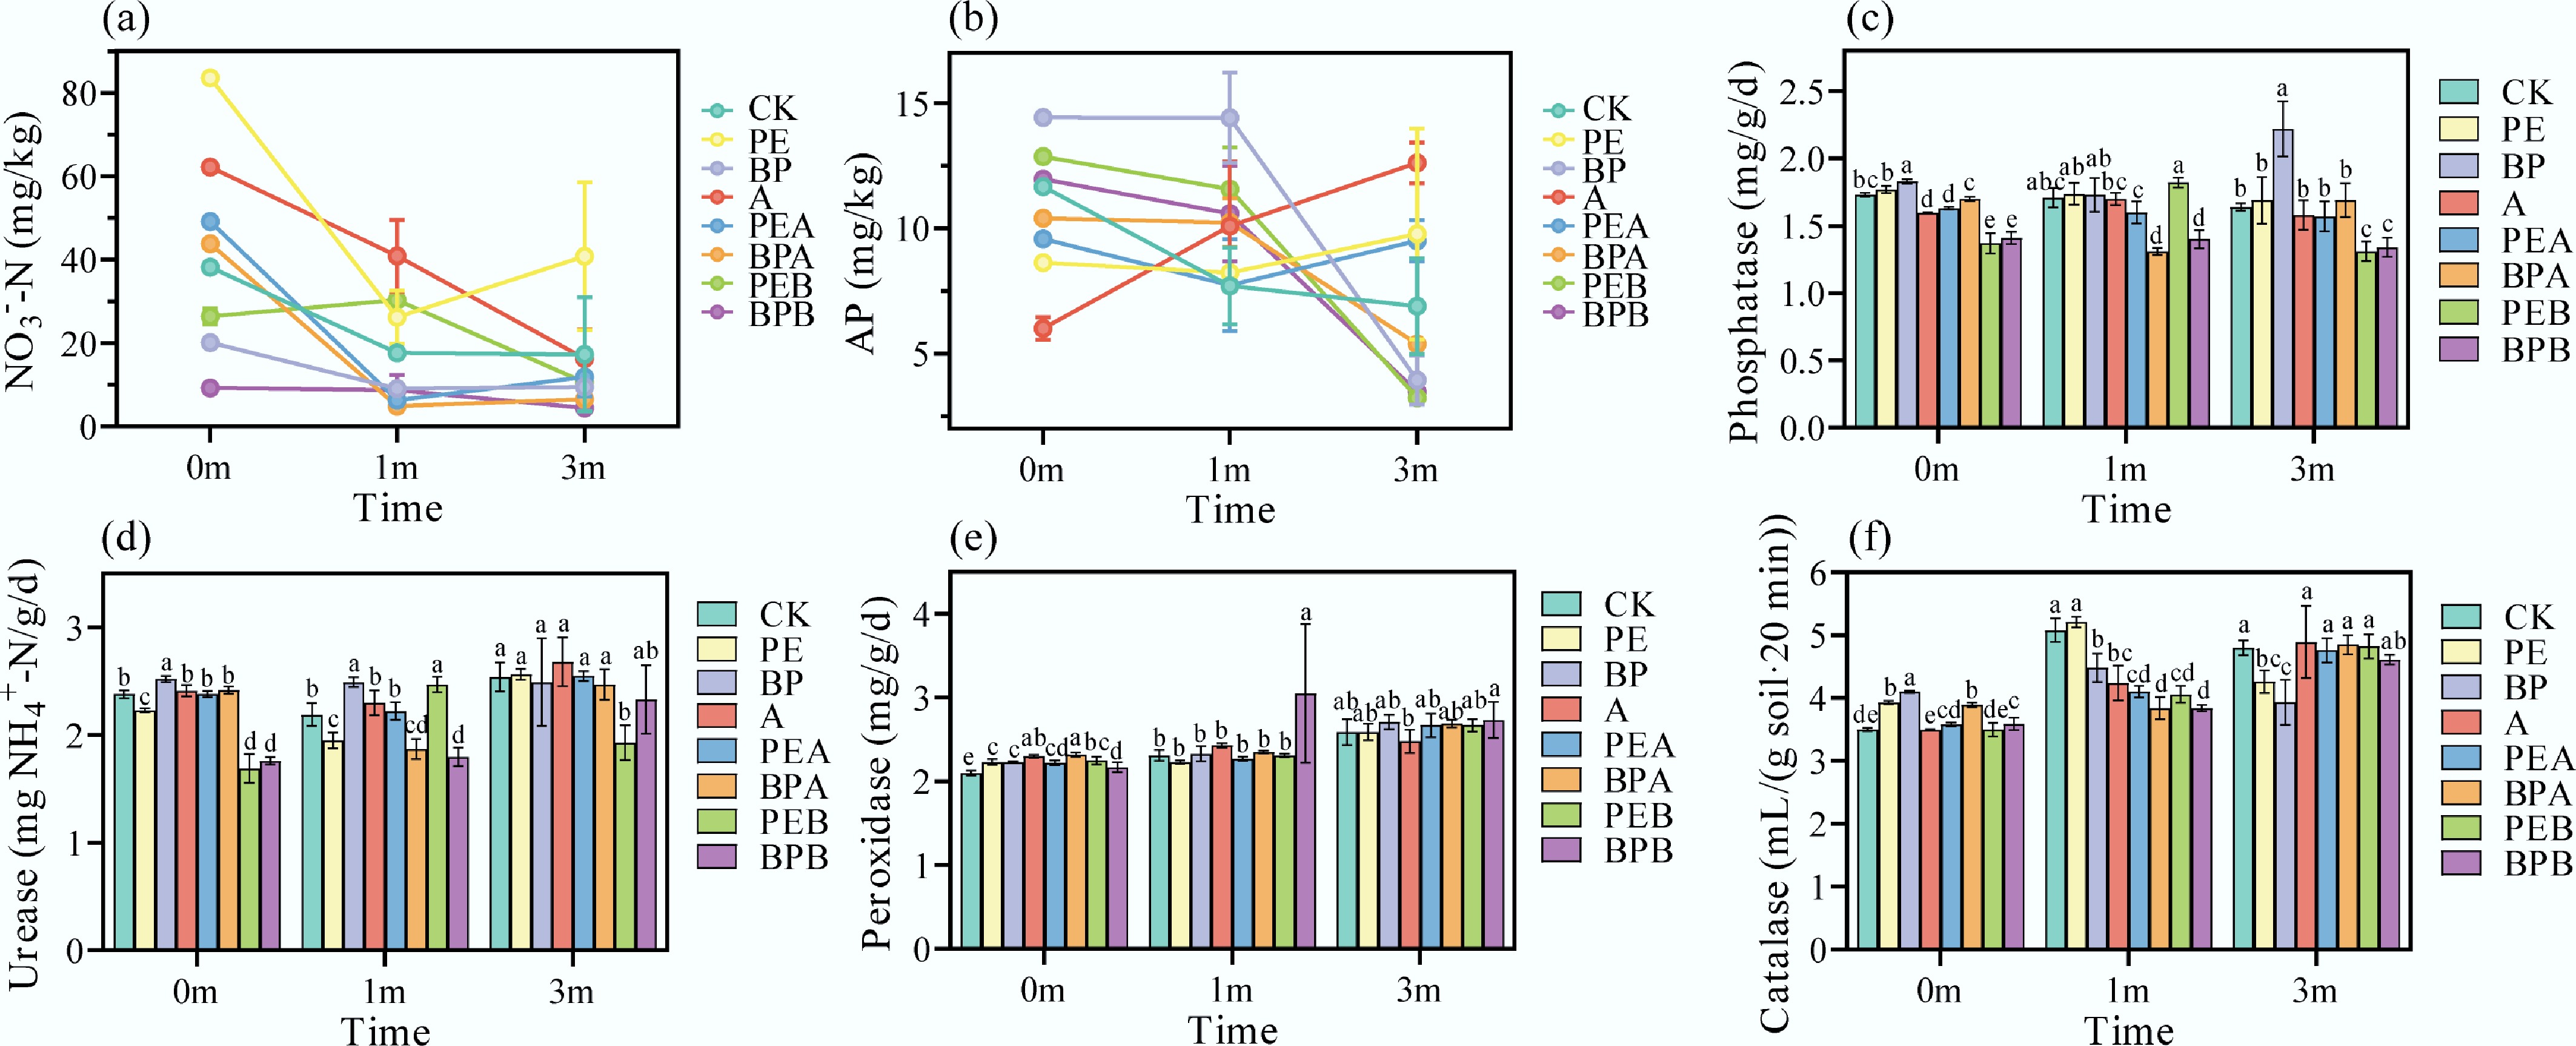
Figure 2.
(a), (b) Soil physical-chemical properties, and (c)–(f) enzymatic activities under different treatments at the beginning of the experiment (0m), and after incubation for 1 month (1m), and 3 months (3m). The error bar represents the standard deviation (n = 3). Lowercase letters indicate significant differences between treatments.
During incubation, TP content generally decreased over time (Supplementary Fig. S3e), consistent with studies showing reduced TP with extended soil coverage[29]. P and K are both important soil nutrient elements and participate in physiological processes such as plant energy metabolism, signal transduction, and growth and development. BC increased TP and TK content, as P (1.3%) and K (2.6%) in the BC dissolved and accumulated in soil (Supplementary Fig. S3e, f). At 1 month, all treatments increased TP content due to BC and PMF residues influencing root growth and the mineralization of organic P. Available phosphorus (AP) content decreased over time in CK, possibly due to soybean utilization for growth (Fig. 2b). After three months, A (82.90%) and PE (41.74%) increased AP, while BP, BPA, and BPB decreased AP content by 22.03%–42.90%. The degradation process of MPs may release P and increase its availability in the soil. MPs may also affect P transformation processes by stimulating enzyme activity and altering the composition of microbial communities[30]. Generally, non-biodegradable films (PE) lowered soil pH and increased NO3––N (136.28%) and AP (41.74%), while biodegradable films (BP) elevated pH but reduced NO3––N (48.38%) and AP (42.90%). BC modified the effects of PMF on soil properties.
Enzyme activity of soils
-
Soil enzymes are crucial for nutrient cycling, energy flow, and substance conversion, making them pivotal indicators of soil fertility[31]. ALP activity, essential for P transformation and supply to plants[32], increased by 1.56%–3.05% under PE and 1.17%–35.37% under BP treatments relative to CK (Fig. 2c). However, A and PEA decreased ALP by 0.58%–7.71% and 4.27%–6.43%, respectively. Similarly, BPA and BPB reduced ALP activity, consistent with their pH-reducing effects. ALP activity typically correlates positively with soil pH, as higher pH favors enzyme activity. URE activity, vital for nitrogen cycling, increased with BC addition (A) by 1.26%, 5.02%, and 5.51% at months 0, 1, and 3, respectively (Fig. 2d). PE decreased URE activity by 10.96%, while BP increased it by 13.70%. The impact of BC on URE activity depended on PMF type; for example, BPA and BPB decreased URE activity by 14.61% and 17.96%, respectively. Reduced URE activity can negatively impact soil fertility and N cycling[33].
PER activity, essential for organic matter decomposition, increased across all treatments over time (Fig. 2e). Before soybean planting, most treatments except A and PEB enhanced CAT activity (Fig. 2f). By month 3, PE and BP decreased CAT activity by 11.25% and 18.13%, respectively. In PE and BP groups, CAT activity initially rose and then fell, peaking during the soybean growth period. PMF residues may have temporarily boosted microbial activity or enhanced soil porosity and aeration, increasing CAT activity[34].
Dynamics of ARGs and MGEs in soils
-
ARG abundance in CK remained stable over the incubation period (Fig. 3a; Supplementary Fig. S4a, b). At 0 months (S_0m), PE and BP treatments increased total ARG abundance by 38.22% and 15.10%, respectively, while BC treatments reduced ARG abundance (Supplementary Fig. S4a). During the first month, the total relative abundance of ARGs ranged from 2.80 × 10⁻³ to 4.66 × 10⁻³ copies/16S rRNA gene (Supplementary Fig. S4a, b), and by month 1 (S_1m), ARGs decreased across all treatments (Supplementary Fig. S4b). However, by month 3, ARG abundance levels remained higher than the initial levels in several treatments (Fig. 3a). PMF exposure significantly increased the risk of ARG dissemination into the soil. Differences in crop rooting activity and the degradability of PE and BP PMFs resulted in distinct ARG dynamics in rhizosphere soil, suggesting that crop cultivation influences ARG abundance. In rhizosphere soil, ARG levels followed the order: PEB > PE > PEA, and BP > BPA > BPB (Fig. 3b). Straw burning increased ARG abundance in the rhizosphere of the PE group but decreased it in the BP group. Specifically, in the PEB group, genes such as ampC-06, blaTEM, cmxA, tetS, tnpA-04, and tnp-07 increased by 102.66%, 265.86%, 1,445.35%, 428.72%, 109.08%, and 1,194.36%, respectively, compared to the PE group (Fig. 3d). Conversely, the BPB group reduced these genes (ampC-06, cmxA, sul1, sul2, intI1, and tnpA-04) by 90.58%, 63.80%, 91.83%, 96.51%, 38.44%, and 62.20%, respectively, compared to the BP group. These results suggest that straw burning impacts ARG dynamics differently depending on the type of PMF, likely due to differences in degradability. Previous studies have reported higher ARG abundances in biodegradable polybutylene succinate (PBS) microplastics-treated soils compared to conventional microplastic (PE and polystyrene (PS)) treatments, attributed to increased Proteobacteria and decreased Acidobacteria populations[35]. In this study, ARG abundance was higher in non-rhizosphere soil than in rhizosphere soil (Fig. 3a, b), consistent with greater microbial community diversity in non-rhizosphere soil. Interestingly, previous studies have shown higher ARG abundance in rhizosphere soils due to rhizosphere effects[36], but the results of this study differ, likely influenced by root growth, plant species, and soil type[37,38].
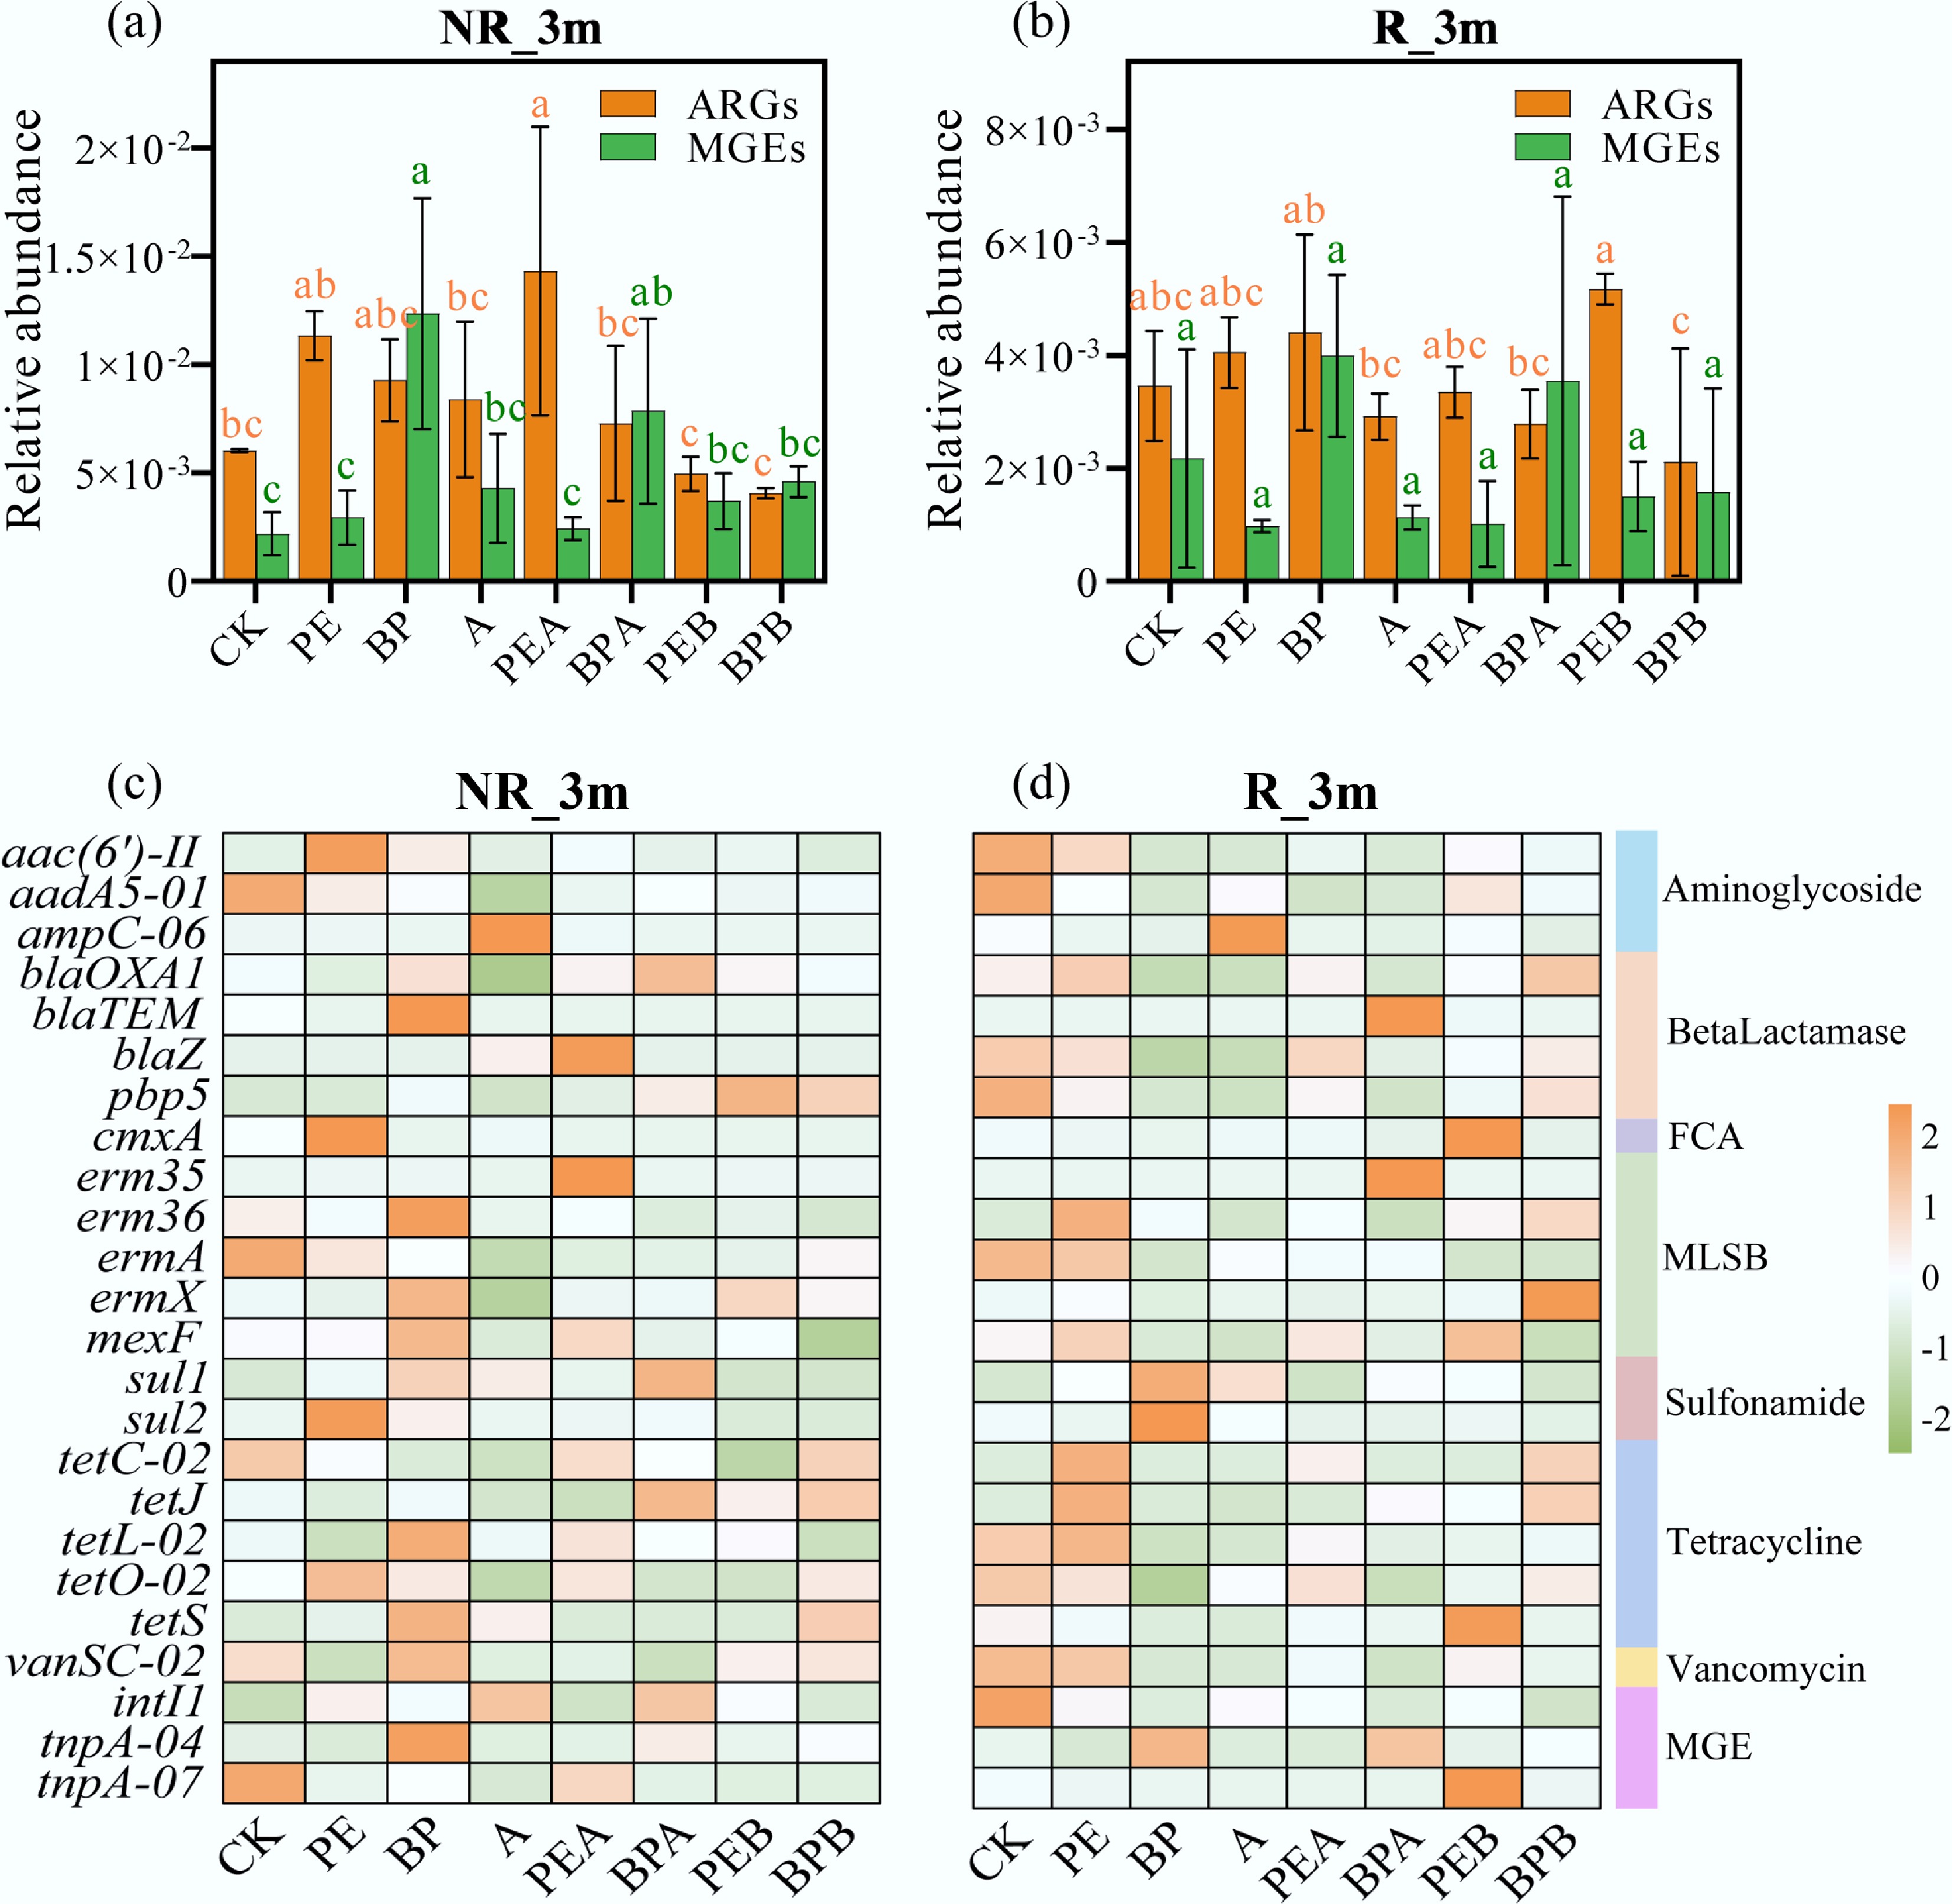
Figure 3.
Relative abundance of antibiotic resistance genes (ARGs) and mobile genetic elements (MGEs) in (a) and (c) non-rhizosphere soil (NR_3m), and (b) and (d) rhizosphere soil (R_3m) under different treatments after incubation for three months. Error bars represent standard deviations (n = 3). Lowercase letters indicate significant differences between treatments.
Distribution of ARGs and MGEs in soil-soybean systems
-
ARGs and MGEs were detected in soil, soybean phyllosphere, rhizoplane, and soybean seeds. Plants can transfer ARGs from bulk soil to rhizosphere soil and subsequently to bacterial communities within plant tissues[39]. Horizontal transfer via MGEs is the primary mechanism driving ARG dynamics in soil-soybean systems[40]. The abundance of ARGs in soybean phyllosphere, rhizoplane, and seeds was significantly lower than in the soil (Figs 3, 4; Supplementary Figs S4, S5), and the abundance of ARGs in soybean seeds was the lowest, likely because not all ARG-carrying bacteria in the soil are transported to plants[41]. Some microorganisms migrate through plant stomata, are absorbed by roots, or reach leaves, acting as carriers of ARGs in soil-crop systems[42]. The relative abundance of ARGs in the phyllosphere (1.58 × 10⁻⁴–5.73 × 10⁻⁴ to 1.04 × 10⁻³–2.00 × 10⁻² copies/16S rRNA gene) and rhizoplane (8.84 × 10⁻⁴–4.09 × 10⁻³ to 1.63 × 10⁻³–5.04 × 10⁻³ copies/16S rRNA gene) increased by nearly two orders of magnitude from the vegetative stage (1m) to the reproductive stage (3m) (Supplementary Figs S4 & S5). This suggests continuous ARG enrichment in plant tissues as the plants grow. The higher abundance of ARGs and MGEs in the phyllosphere compared to the rhizoplane may be due to differences in microbial community composition. Certain microbial taxa are more likely to colonize leaves. Moreover, leaves, being exposed to the air, are more susceptible to contamination by environmental ARGs. Zhi et al. demonstrated similar findings, showing higher ARG and MGE abundances in carrot leaves compared to underground parts[40]. Another study indicated that all ARGs in the plant microbiome originate from the soil[43]. Therefore, the increase in ARGs and MGEs in soybean phyllosphere, rhizoplane, and seeds is likely primarily sourced from soil.
PMFs and BC treatments significantly altered ARG and MGE abundance in both soil and soybean. During the reproductive stage, PE and BP treatments reduced ARG abundance in the phyllosphere by 93.68% and 66.64%, respectively (Fig. 4a). ARG abundance followed the order: PE > PEB > PEA, and BPA > BP > BPB. BC reduced ARGs in PE treatments but increased them in BP treatments. Straw burning reduced total ARG abundance in both PE and BP treatments, with the most pronounced effects observed in the BPB group, likely due to BP's greater degradability. The BPB group decreased ARGs by 73.16%–100% compared to BP (Fig. 4a, d). In the PEB group, sul1, sul2, erm36, ermA, and ermX were reduced by 75.78%, 69.90%, 77.22%, 84.58%, and 69.08%, respectively, compared to PE, while the BPB group reduced these genes by 94.34%, 97.57%, 95.57%, 100%, and 97.35%, respectively, compared to BP. In the rhizoplane, PE and BP increased ARGs by 21.88% and 39.05%, respectively, while exogenous BC addition reduced ARGs by 19.13% during the reproductive stage (Fig. 4b, e). Straw burning reduced ARGs in the BPB group by 28.16% compared to BP, further highlighting its effectiveness in reducing ARGs in biodegradable PMF treatments (Fig. 4b, e). In addition, exogenous BC addition (PEA: 45.90%, BPA: 48.22%) and straw burning (PEB: 56.08%, BPB: 79.77%) significantly reduced the total ARG abundance in soybean seeds (Fig. 4c, f). Overall, direct straw burning was more effective in reducing ARG abundance than exogenous BC addition due to its combined effects of high temperature and BC production. Furthermore, straw burning significantly inhibited ARG migration from soil to leaves, reducing the bioaccumulation factor (BAF) of ARGs in the phyllosphere by 53.76% and 84.83% in the PEB and BPB groups, respectively (Supplementary Fig. S6).
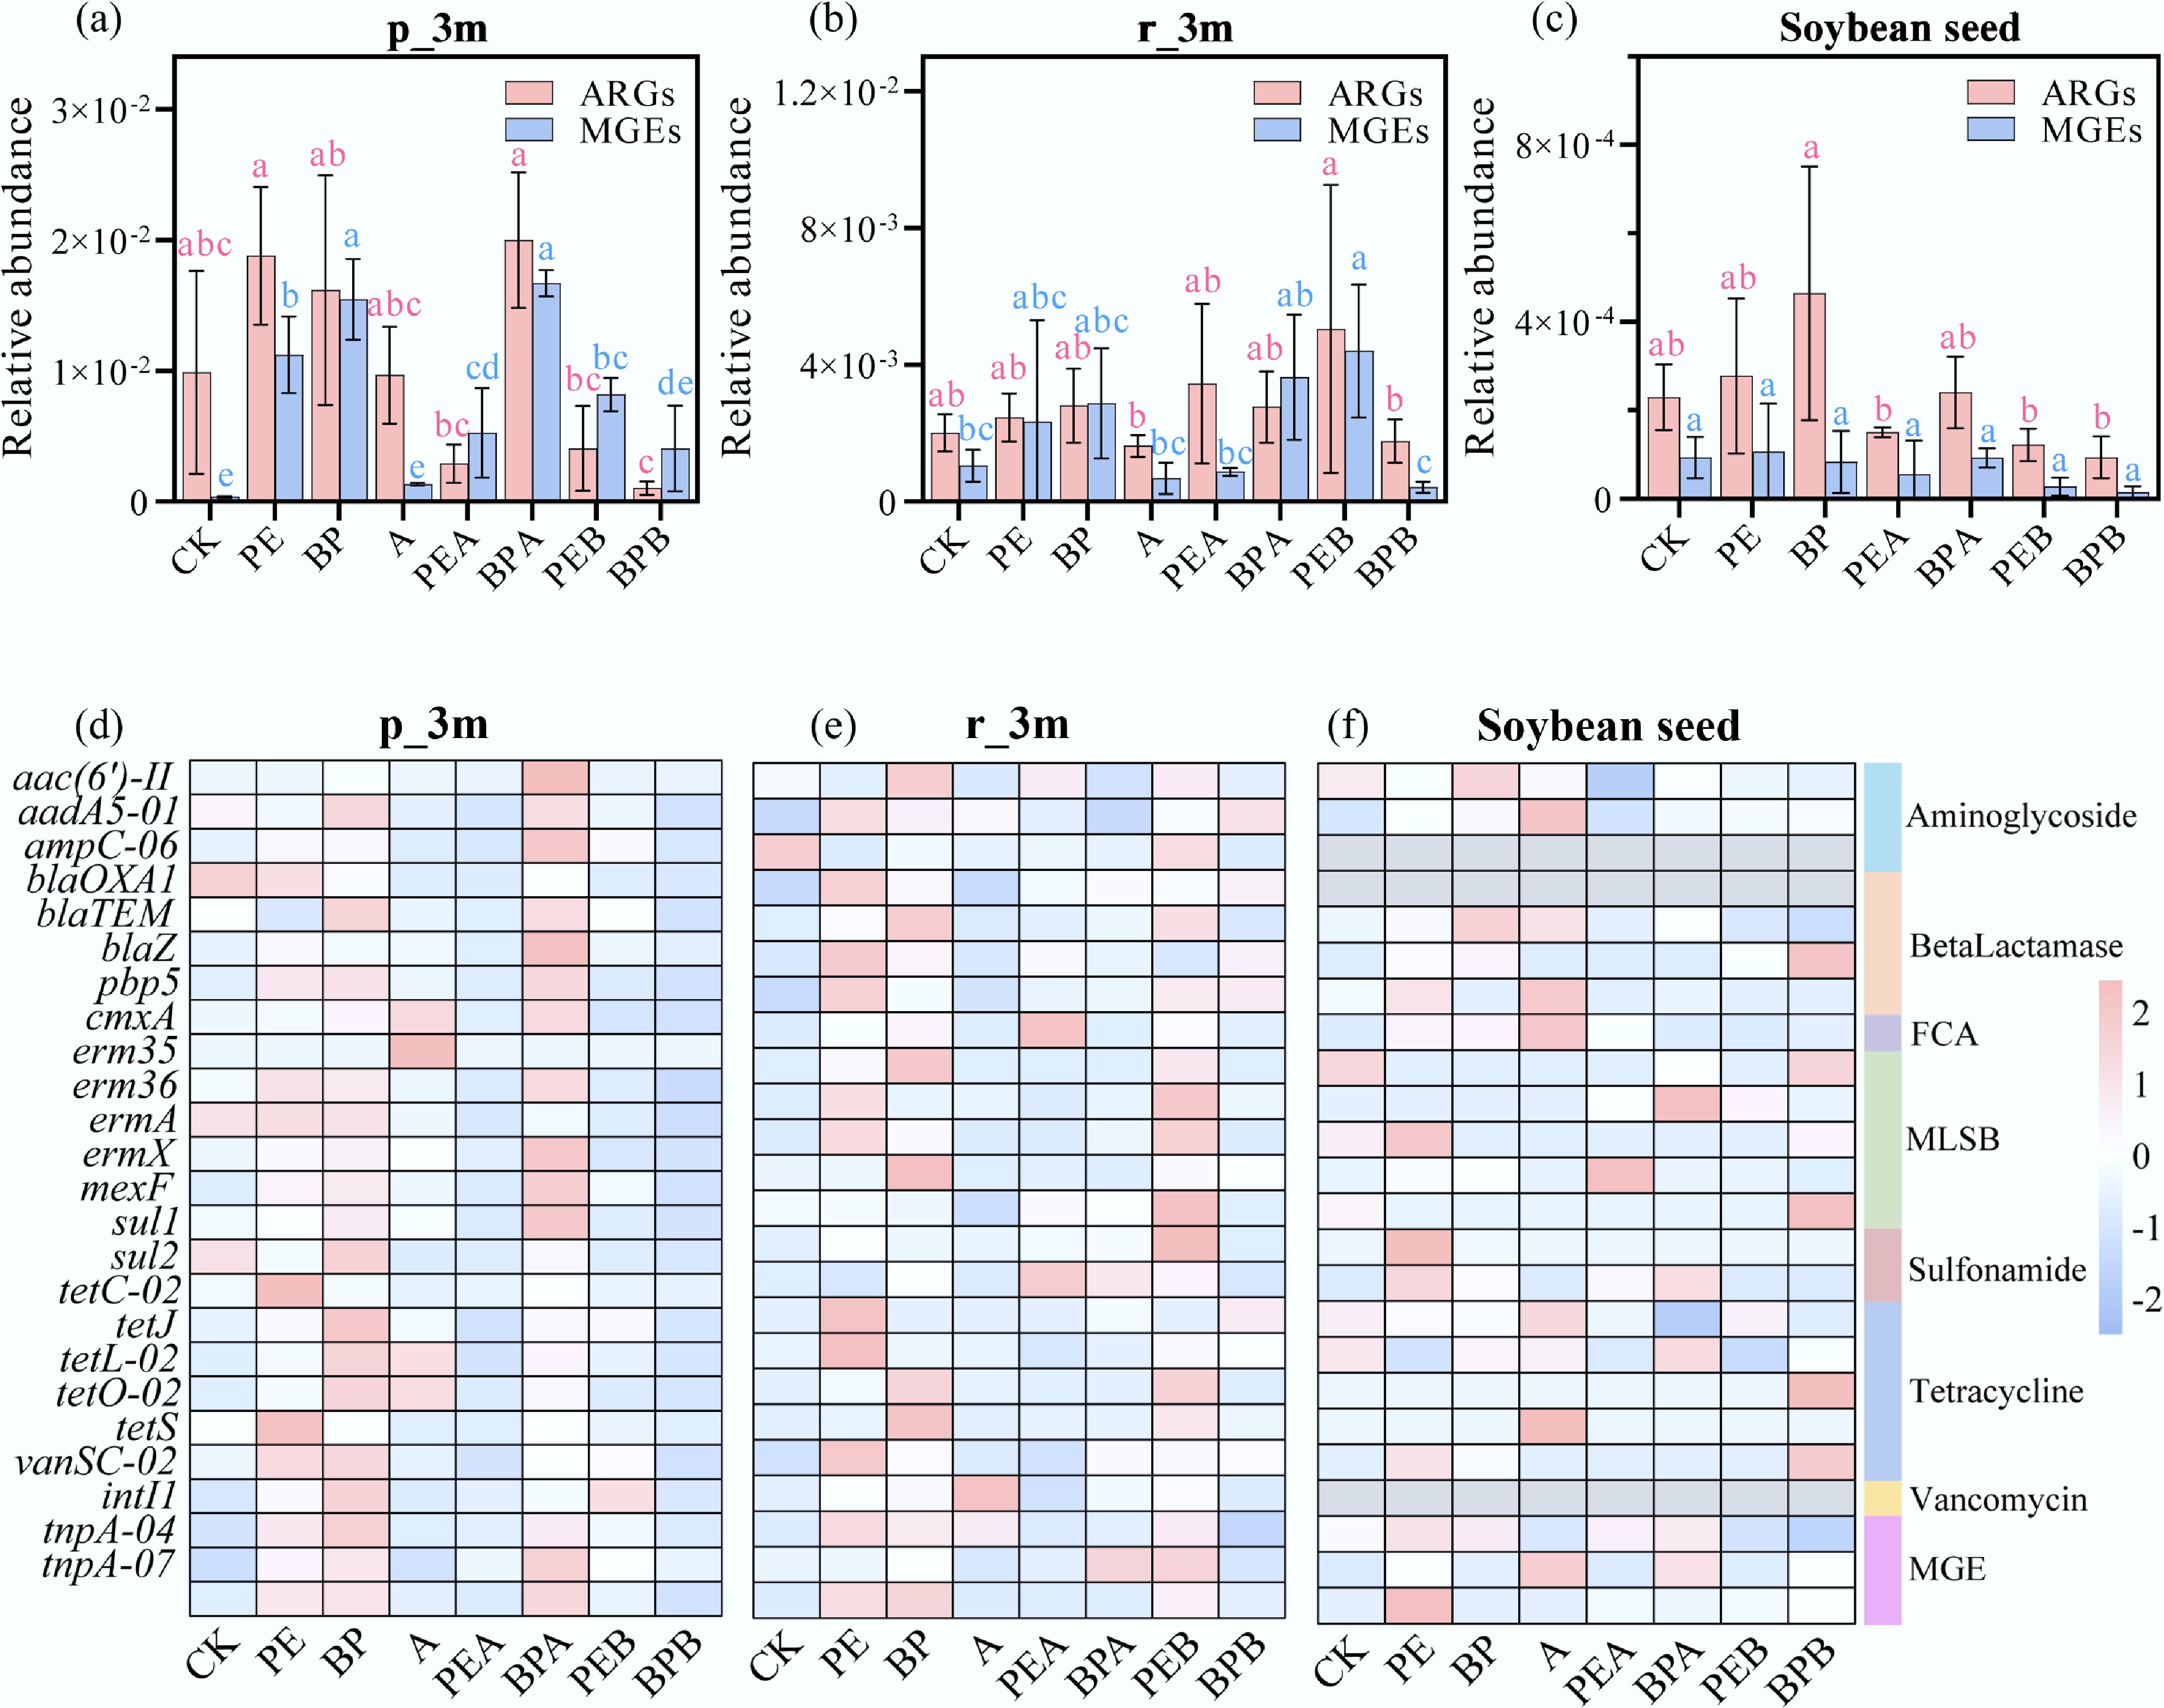
Figure 4.
Relative abundance of antibiotic resistance genes (ARGs) and mobile genetic elements (MGEs) in soybean phyllosphere [p_3m, (a) and (d)], rhizoplane [r_3m, (b) and (e)], and seed (c) and (f) under different treatments after incubation for three months (3m). Error bars represent standard deviations (n = 3). Lowercase letters indicate significant differences between treatments.
MGEs, including one integrase marker gene (intI1) and two transposase marker genes (tnpA-04 and tnpA-07), were detected. Total MGE abundances ranged from 1.26 × 10⁻⁴–1.69 × 10⁻² in soil samples and 1.43 × 10⁻⁵–2.44 × 10⁻¹ in crop samples (Figs 3, 4; Supplementary Figs S4, S5). The patterns of MGE abundance closely mirrored those of ARGs, suggesting MGEs play a significant role in ARG distribution in soil-plant systems. Horizontal transfer of ARGs from exogenous ARBs to local microorganisms via MGEs remains a critical mechanism influencing ARG dynamics, consistent with prior studies[40].
Correlation between ARGs and MGEs
-
Correlation analysis revealed noticeable relationships between many ARGs and MGEs (Supplementary Figs S7, S8), supported by previous studies[44]. These results suggest that ARGs and MGEs may share the same microbial hosts. In plant samples, transposons (tnpA-04 and tnpA-07) exhibited positive correlations with nearly all detected ARGs (p < 0.05). Additionally, the integron gene (intI1) was positively correlated with tetC-02, tetJ, tetL-02, tetO-02, and tetS in plant samples (p < 0.05). However, in soil samples, intI1 did not show significant correlations with tetC-02, tetJ, tetO-02, or tetS (p > 0.05) and exhibited a negative correlation with tetL-02. Overall, correlations between ARGs and MGEs were stronger in plant samples than in soil samples, potentially due to lower microbial diversity in plants. Reduced diversity may lead to individual microorganisms carrying more ARGs compared to soil microbial communities.
Impact of habitat, growth stage, and pollutants on ARGs and MGEs
-
Principal component analysis (PCA) was employed to assess the impact of habitat, growth period, and pollutants on ARGs and MGEs. The results implied that habitat was the primary factor influencing ARG and MGE distribution, followed by growth periods and pollutants (Supplementary Figs S9–S11). These findings align with microbial community patterns, which are often shaped by host bacteria. During the vegetative stage (1m), phyllosphere and rhizoplane samples exhibited some overlap in PCA plots. However, at the reproductive stage (3m), distinct clustering was observed, reflecting shifts in microbial community composition due to root and leaf development. These shifts likely influenced plant-microbe interactions and the prevalence of ARGs. PC1 and PC2 accounted for 53.16% and 15.07% of the variance, respectively (Supplementary Fig. S9). Non-rhizosphere soil displayed minimal variation across different growth stages but showed clear differentiation from rhizosphere soil (Supplementary Fig. S9). PCA score plots further revealed that PMFs (PE and BP) and BC significantly influenced the distribution and abundance of ARGs in soil-plant systems (Supplementary Figs S10, S11). Non-metric multidimensional scaling (NMDS) analysis corroborated these findings, emphasizing that ARG variations across treatments were closely linked to bacterial community differences (Supplementary Fig. S12). When evaluating ARG abundance, the influence of microbial communities should not be overlooked[16].
Microbial responses in soil-soybean systems
-
To elucidate the relationship between ARGs and microorganisms, microbial community succession was analyzed across habitats (rhizosphere soil, non-rhizosphere soil, soybean phyllosphere, rhizoplane, and seeds) at different growth stages. Soil exhibited markedly higher alpha diversity than soybean tissue, with non-rhizosphere soil having greater diversity than rhizosphere soil (Supplementary Figs S13–S15). Before planting (0 months), straw burning treatments (PEB and BPB) reduced alpha diversity, indicating disruption of soil community structure and a temporary reduction in microbial diversity. By one month, microbial diversity indices (Sobs and Shannon) in all treatments surpassed those of the CK group, suggesting microbial adaptation over time (Supplementary Fig. S13). After three months, microbial diversity fully recovered to CK levels. Non-rhizosphere soil Sobs index in PEB/BPB was 79.3%–114.2% of CK, and Shannon index was 83.2%–112.6% of CK. Rhizosphere soil indices showed similar trends (96.6%–103.5% of CK for Sobs, 99.2%–102.1% for Shannon) (Supplementary Fig. S13). This indicates that while straw burning temporarily influenced microbial succession, it did not cause long-term adverse effects on microbial diversity, soil C/N/P cycling, or soil health. Principal coordinate analysis (PCoA) and NMDS analyses revealed clear separation between rhizosphere and non-rhizosphere soil communities, with overlapping samples across growth stages. This suggests habitat had a stronger influence on community structure than growth periods (Supplementary Figs S16–S18). Straw burning treatments (PEB and BPB) were distinctly separated from other treatments, highlighting the impact of straw burning on microbial community composition (Supplementary Figs S16–S18). Over time, microbial communities across treatments diverged further, reflecting treatment-specific effects (Supplementary Fig. S19). PC1 and PC2 explained 33.62% and 10.54% of community variation, respectively. Factors such as growth stage, habitat, and exogenous substances influenced microbial community composition, consistent with the NMDS and Venn analysis (Supplementary Figs S20, S21).
At the phylum level, Actinobacteriota, Proteobacteria, Chloroflexi, and Acidobacteriota dominated rhizosphere and non-rhizosphere soil, accounting for 23.26%–54.81%, 21.68%–42.27%, 4.35%–16.55%, and 2.16%–17.03%, respectively (Fig. 5a). Bacterial communities in rhizosphere and non-rhizosphere soil exhibited clear differences, while variations among non-rhizosphere samples across growth stages were minimal. In the phyllosphere and rhizoplane, five phyla (Proteobacteria, Actinobacteriota, Firmicutes, Bacteroidota, and Myxococcota) constituted over 95% of total reads (Supplementary Fig. S22). Proteobacteria were the dominant phylum across all samples, with relative abundances ranging from 54.04%–73.83%, 25.49%–59.33%, 71.88%–83.29%, and 79.93%–90.30% in p_1m, p_3m, r_1m, and r_3m, respectively, indicating its prevalence in the phyllosphere and rhizoplane. Similarly, Proteobacteria were the dominant phylum in soybean seeds, with relative abundance ranging from 93.84% to 99.89% (Supplementary Fig. S23). Firmicutes, which are strongly associated with ARGs[41,45], were 18.17% and 8.09% lower in PEB_p_3m and BPB_p_3m compared to PE_p_3m and BP_p_3m, respectively. This reduction may explain the lower ARG abundance observed in the phyllosphere after straw burning treatments.
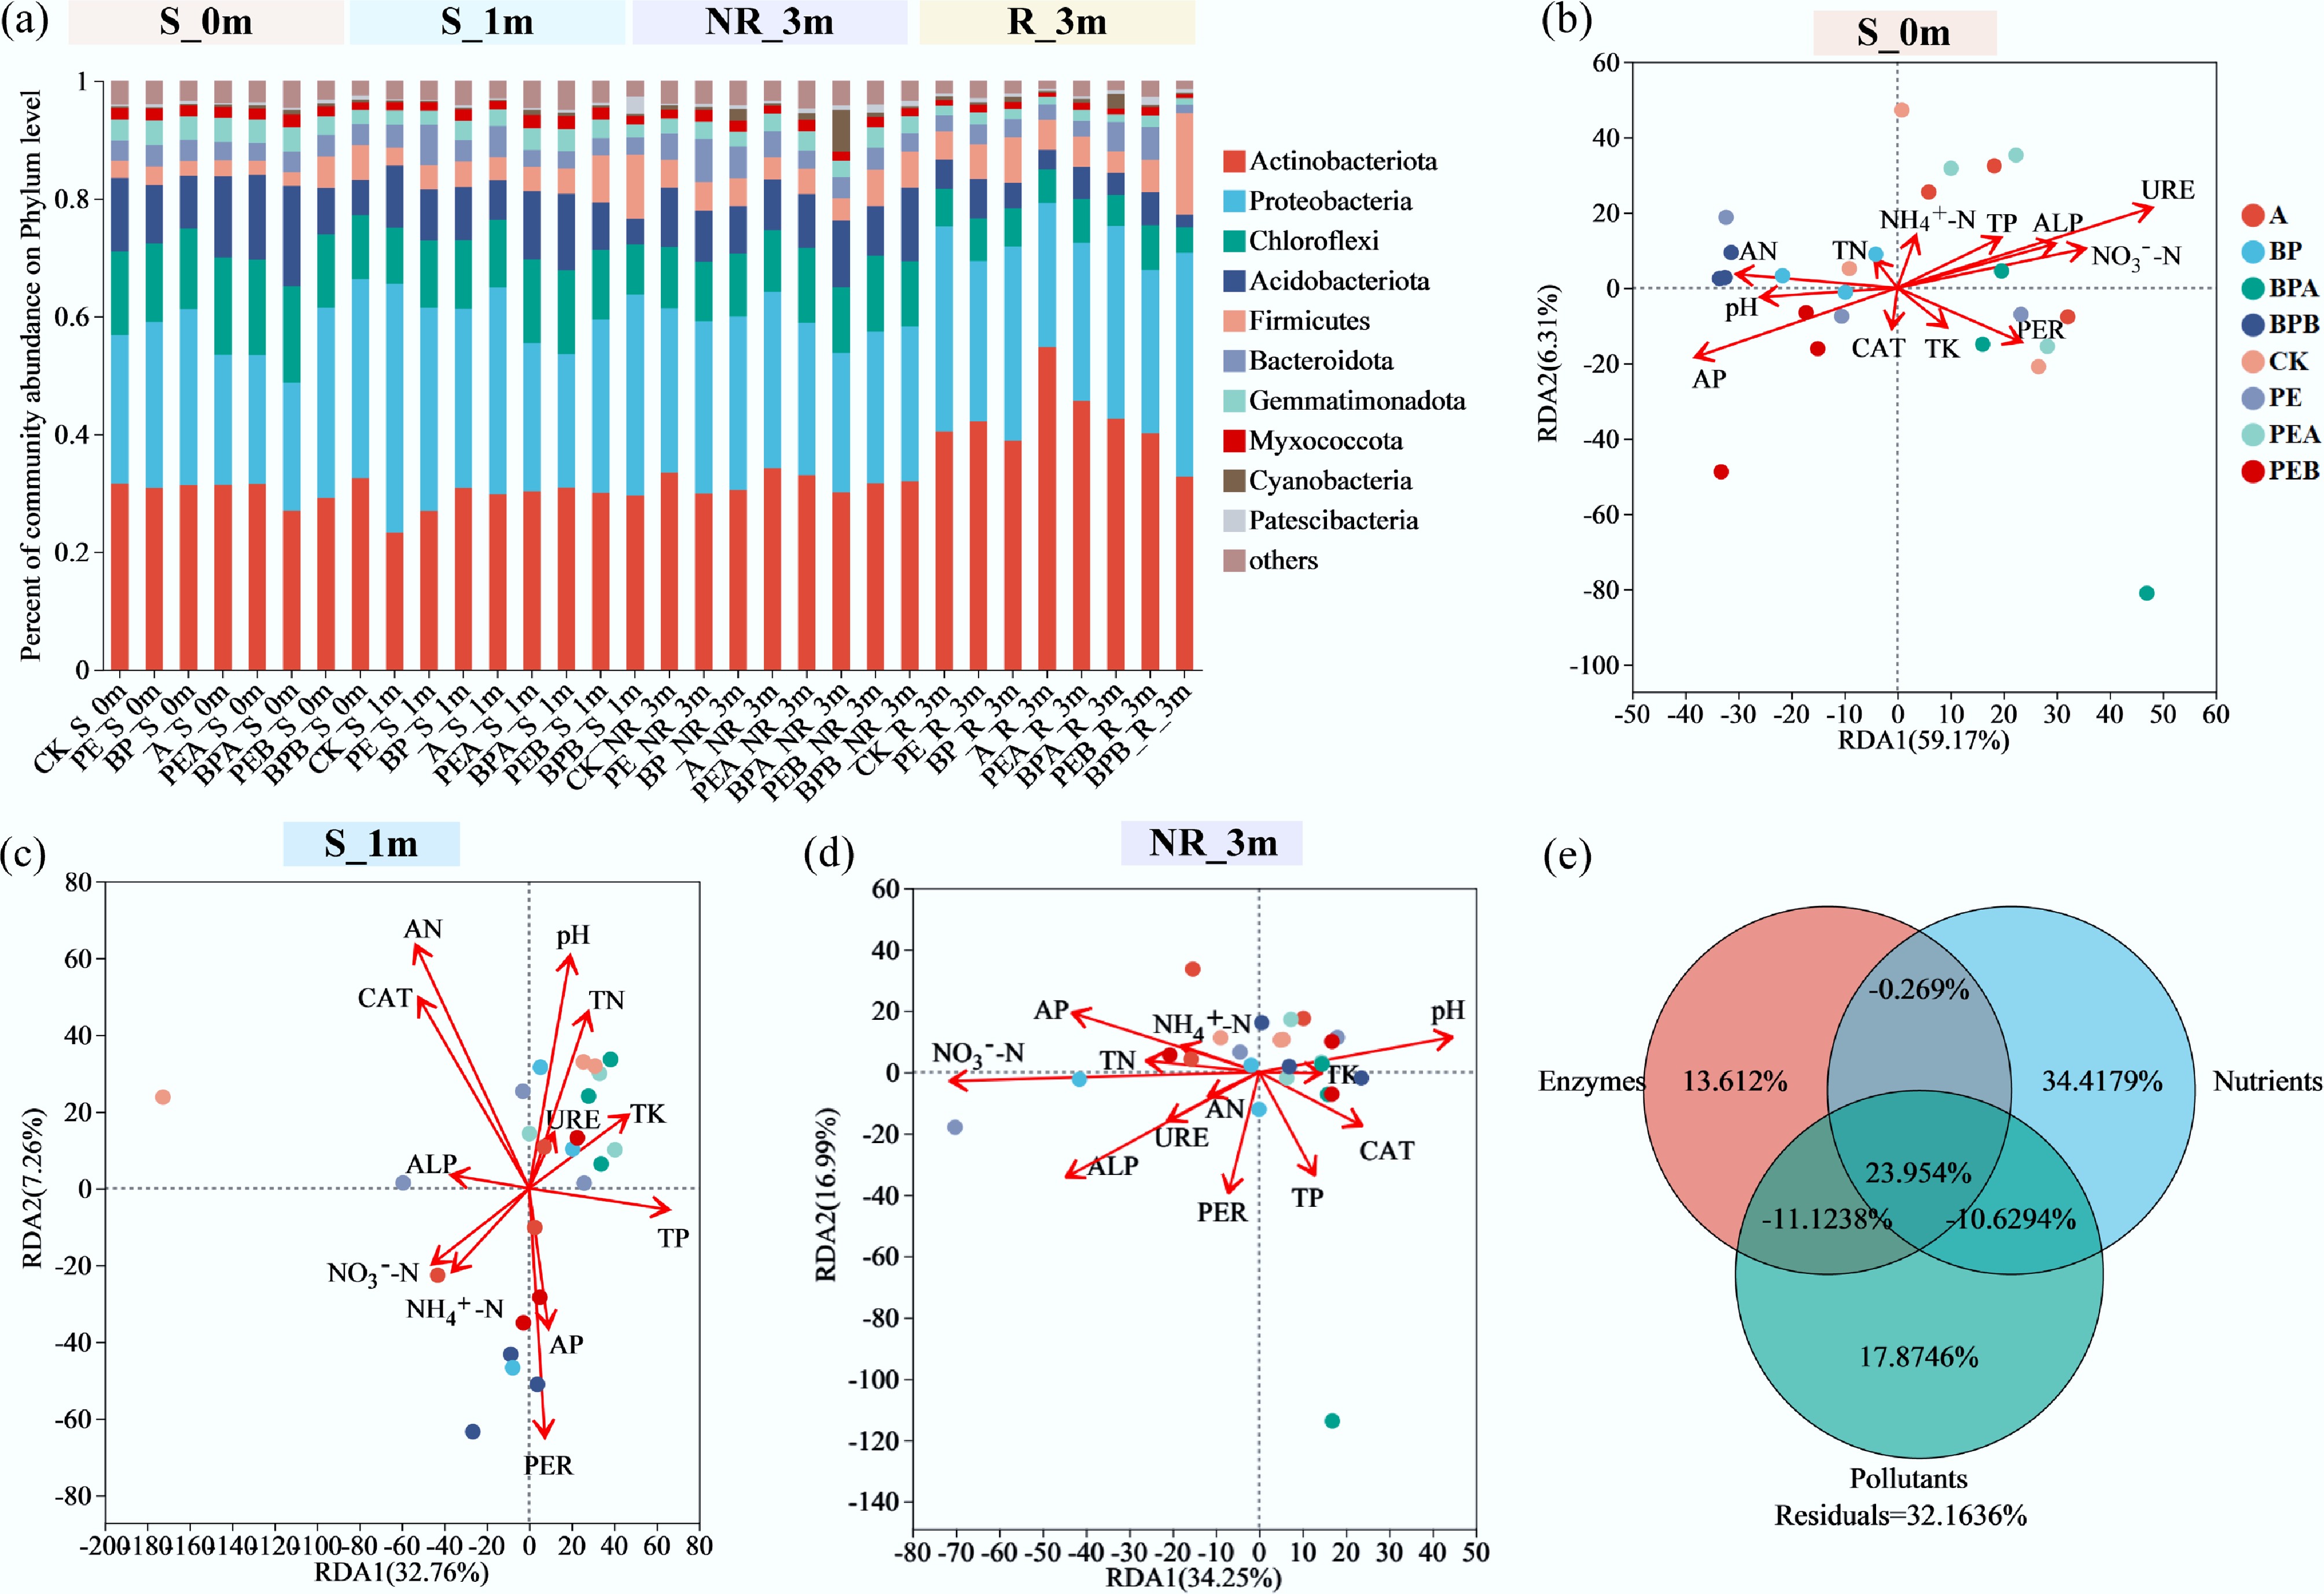
Figure 5.
(a) Soil bacterial communities of different treatments at phylum levels at the beginning of the experiment (0m), and after incubation for 1 month (1m) and 3 months (3m). (b)–(d) Redundancy analysis (RDA) reflects the relationship between environmental variables and soybean non-rhizosphere soil bacterial communities. (e) Variance partitioning analysis (VPA) shows the explanation of enzymes, nutrients, and pollutants to the difference in bacterial communities of soybean non-rhizosphere soil.
At the genus level, Pseudarthrobacter was more abundant in rhizosphere soil (12.23%–23.80%) compared to non-rhizosphere soil (3.34%–8.17%) (Supplementary Fig. S24). Sphingomonas, norank_f_JG30-KF-CM45, Vicinamibacterales, Vicinamibacteraceae, and Gemmatimonadaceae were more prevalent in non-rhizosphere soil. At the soybean reproductive stage, the relative abundance of Arthrobacter increased notably in non-rhizosphere soils, while exogenous BC addition treatment elevated the abundance of Sphingomonas. Arthrobacter, a common soil bacterium, exhibits diverse metabolic capabilities, including the decomposition of organic matter such as plant residues and root exudates[46]. This increase may reflect enhanced organic matter degradation in non-rhizosphere soils. Sphingomonas, a plant-growth-promoting bacterium known for aiding in the remediation of heavy metals and organic pollutants[47], showed increased abundance in exogenous BC addition-treated soils, likely linked to improved soil conditions and enhanced rhizosphere interactions. Compared to non-rhizosphere soil, rhizosphere soil exhibited higher abundances of Ensifer, Pseudoxanthomonas, Blastococcus, Nocardioides, and Allorhizobium-Neorhizobium-Pararhizobium-Rhizobium. Both Ensifer and Allorhizobium-Neorhizobium-Pararhizobium-Rhizobium are nitrogen-fixing bacteria associated with legumes, forming symbiotic relationships with soybean roots[48,49]. The relative abundance of Ensifer in rhizosphere soil was 11.15%, 1.04%, 7.79%, 1.34%, 0.90%, 0.93%, 0.78%, and 22.39% in CK, PE, BP, A, PEA, BPA, PEB, and BPB treatments, respectively. All treatments, except BPB, reduced the abundance of Ensifer. Allorhizobium-Neorhizobium-Pararhizobium-Rhizobium showed no significant differences among treatments.
The most abundant genera in the rhizoplane and phyllosphere were Novosphingobium, Sphingomonas, and unclassified_f_Xanthomonadaceae (Supplementary Fig. S25). Novosphingobium dominated the rhizoplane with relative abundances of 1.15%–3.15%, 0.84%–1.89%, 1.71%–6.14%, and 7.14%–18.60% in p_1m, p_3m, r_1m, and r_3m samples, respectively. Similarly, unclassified_f_Comamonadaceae was also more abundant in the rhizoplane (2.88%–6.32%) than in the phyllosphere (0.38%–3.11%), whereas Pseudomonas exhibited higher abundance in the phyllosphere. Nitrogen-fixing rhizobia, including Ensifer, Allorhizobium-Neorhizobium-Pararhizobium-Rhizobium, and Bradyrhizobium play critical roles in fixing atmospheric nitrogen into NH4+–N, which is essential for plant nutrition[49−51]. These genera were more abundant in the rhizoplane than in the phyllosphere, with their abundance increasing from the vegetative to reproductive stages (r_3m > r_1m). However, the abundances of Ensifer and Allorhizobium-Neorhizobium-Pararhizobium-Rhizobium were reduced across all treatments, particularly when straw burning coexisted with PMFs (PEB and BPB). These findings suggest that PMFs and BC negatively impacted soybean root growth in the short term. In soybean seeds, g__unclassified_f__Alcaligenaceae dominated absolutely, with a relative abundance of 86.99%–94.19% (Supplementary Fig. S26). The abundance of g__unclassified_f__Alcaligenaceae and ARGs decreased after BC treatments, compared with single PE or BP treatments. It is likely that g__unclassified_f__Alcaligenaceae serves as a host of ARGs or is involved in their horizontal transfer. The reduction in its abundance leads to fewer ARG dissemination opportunities.
Correlation between soil environmental variables, bacterial communities, and ARGs
-
To investigate the effects of soil environmental variables on microbial communities across different treatments, redundancy analysis (RDA) was performed using 12 environmental variables (Fig. 5b–d). Before soybean planting, RDA explained 65.48% of the variation in bacterial community composition at the phylum level, with URE, AP, NO3––N, AN, ALP, and pH being the most influential factors (Fig. 5b). At one and three months, RDA accounted for 40.02% and 51.24% of the bacterial community variation, respectively (Fig. 5c, d). Variance partitioning analysis (VPA) further explored the contributions of different factors to the variation in soil bacterial communities. Nutrients (soil physicochemical properties), enzyme activity, and pollutants (PE, BP, A, and B) collectively explained 67.84% of the variation, with individual contributions of 47.47%, 26.17%, and 20.08%, respectively (Fig. 5e). Interestingly, interactions among these variables accounted for 23.95% of the variation. Nutrients are critical for microbial growth and activity, enabling microbes to withstand environmental disturbances[51,52]. PMFs and BC influenced the soil microbiome by altering nutrient availability.
Mantel test analysis revealed significant positive correlations between ARGs, bacterial communities, and soil variables. At 0 months, NO3––N, URE, and ALP positively correlated with ARG abundance (p < 0.05), while ARGs also correlated positively with TK (Fig. 6a). At one month, soil nitrogen content (NH4+–N, NO3––N, and AN) and CAT were significant factors influencing ARG abundance (p < 0.01) (Fig. 6b). By three months, AP content emerged as the sole significant factor affecting ARGs (p < 0.01) (Fig. 6c). The Spearman heatmap further illustrates the relationships between environmental variables and individual ARGs (Supplementary Fig. S27). Environmental factors had consistent effects on ARGs within the same subclass. For example, at 0 months, NO3––N was negatively correlated with aminoglycoside resistance genes (aac(6')-II and aadA5-01), MLSB resistance genes (erm35 and erm36), and sulfonamide resistance genes (sul1 and sul2) (p < 0.05). Conversely, AP was positively correlated with these genes (p < 0.05), likely due to its role in promoting microbial growth and selection pressures related to environmental pollution. These findings align with previous studies showing that nutritional factors promote the persistence and dissemination of ARGs in the environment[53]. Overall, the most influential environmental factors affecting ARGs were NO3––N, AP, and ALP. Spearman heatmaps also highlighted correlations between environmental variables and bacterial communities at the genus level (Supplementary Fig. S28). Similar factors exhibited consistent correlations with specific bacterial genera. For example, enzymes (PER and CAT) were negatively correlated with Sphingomonas, norank_f__JG30-KF-CM45, norank_f__Roseiflexaceae, and norank_f__Gemmatimonadaceae. Conversely, nutrients (NO3−-N, TN, and NH4+–N) were positively correlated with Sphingomonas, norank_f__JG30-KF-CM45, norank_f__norank_o__Gaiellales and norank_f__67-14.
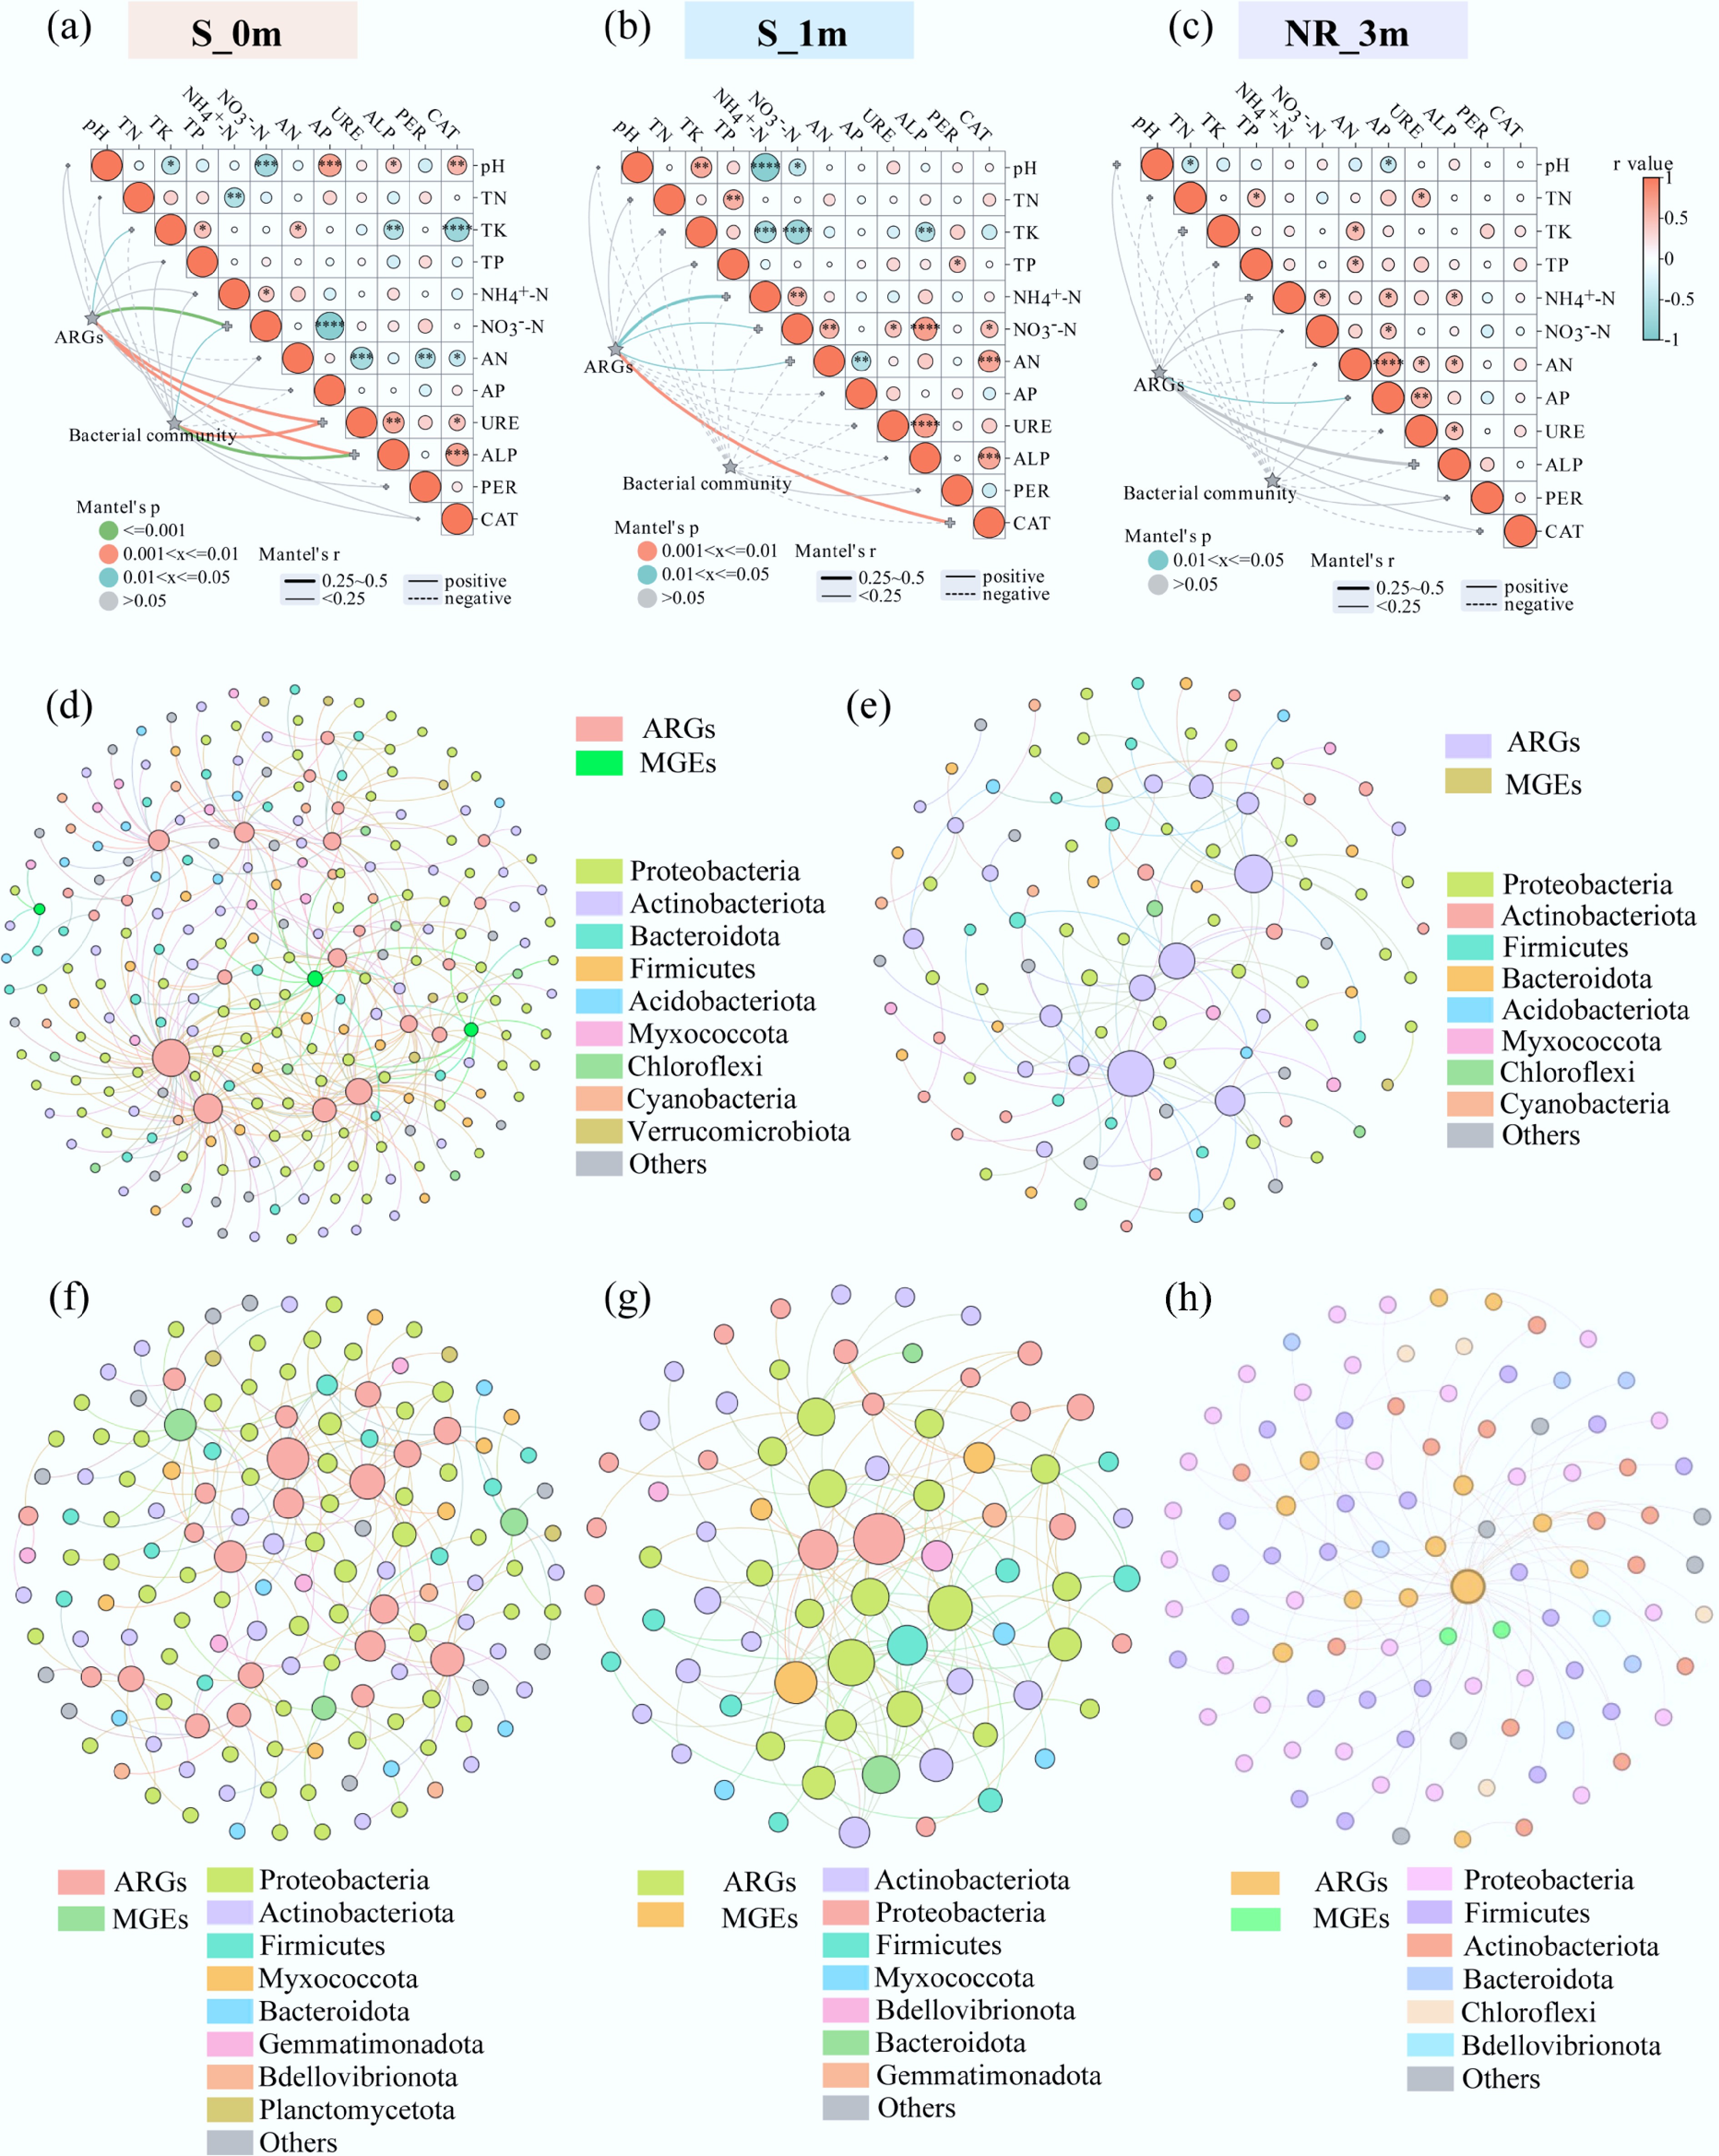
Figure 6.
(a)−(c) Mantel test analyzed the relationship between antibiotic resistance genes (ARGs), bacterial communities, and environmental variables of soybean non-rhizosphere soil at the beginning of the experiment (0m), and after incubation for one month (1m) and three months (3m). Network analysis of ARGs-bacteria in (d) non-rhizosphere soil, (e) rhizosphere soil, (f) rhizoplane, (g) phyllosphere, and (h) soybean seed. The size of the nodes reflects the number of connections. In the network diagram, the correlation coefficient is r ≥ 0.5, and the significance level is p < 0.05.
Symbiotic mode among ARGs, MGEs, and bacteria
-
The interactions between ARGs, MGEs, and bacterial communities were analyzed through network analysis in non-rhizosphere soil, rhizosphere soil, rhizoplane, phyllosphere, and seed (Fig. 6d–h). Strict criteria were used for removal and filtration, including a correlation threshold (|rho| > 0.5), and significance level (p < 0.05). In non-rhizosphere soil, the network consisted of 246 nodes and 386 edges, encompassing 22 bacterial phyla (Fig. 6d). Proteobacteria, Actinobacteriota, and Bacteroidota exhibited the highest diversity among bacterial genera. ARGs such as sul2, sul1, cmxA, and pbp5 demonstrated significant host potential, interacting with multiple bacterial genera. For instance, sul1 was negatively correlated with Arthrobacter, Domibacillus, norank_f__Myxococcaceae, Sphingoaurantiacus, and Geodermatophilus (p < 0.05, r > 0.65), but positively correlated with Ensifer, Pseudoflavitalea, and Azotobacter (p < 0.05, r > 0.65). The rhizosphere soil network included 110 nodes and 117 edges (Fig. 6e). Compared to non-rhizosphere soil, this network lacked blaOXA1, blaZ, and tnpA-07, suggesting that rhizosphere microbial communities did not significantly associate with these genes.
The rhizoplane network comprised 152 nodes and 185 edges, spanning nine bacterial phyla, with Actinobacteriota, Proteobacteria, and Firmicutes being the most prevalent (Fig. 6f). Certain ARGs, such as erm35, ermA, blaOXA1, tetS, and tetO-02, were positively correlated with Methyloversatilis (p < 0.05, r > 0.5). In the phyllosphere, the network contained 76 nodes and 146 edges, with erm36, ermA, and tnpA-04 exhibiting the highest host potential (Fig. 6g). Notably, the phyllosphere network lacked the phyla Planctomycetota and Chloroflexi, distinguishing it from the rhizoplane network. In soybean seeds, the network consisted of 99 nodes and 101 edges, encompassing 11 bacterial phyla (Fig. 6h), with Proteobacteria, Firmicutes, and Actinobacteriota being the most prevalent. There was a positive correlation between ARGs and most of the bacteria. Across habitats, Proteobacteria, Firmicutes, Bacteroidota, and Actinobacteriota emerged as the primary potential hosts for ARGs and MGEs, underscoring their critical roles in ARG transmission and dissemination[51]. ARGs and MGEs demonstrated a symbiotic relationship with bacteria in both soil and soybean systems, with significant overlaps observed between microbial hosts and ARGs. These findings confirm that ARGs can be carried by microbes, transferring from soil to rhizosphere bacteria and subsequently to plant tissues[16].
-
In summary, BC effectively reduces ARG abundance in PMF-contaminated soils and inhibits ARG transfer from soil to soybeans. Although PE/BP residues promoted ARG proliferation, BC treatments (especially in-situ straw burning) reduced soil ARGs by up to 49.79%. Importantly, BC effectively inhibited the migration of ARGs from soil to plant leaves. The bioaccumulation factor (BAF) of ARGs in the phyllosphere decreased by 53.76% and 84.83% in the PEB and BPB treatments, respectively. Mechanistically, BC achieves this by altering PMF physicochemical properties and supplementing soil nutrients. Although BC caused short-term soil microbial disturbances, microbial communities recovered within three months without disrupting soil nutrient cycling. Given these findings, a one-size-fits-all straw management approach is inappropriate. Future strategies should account for crop type, burning intensity, and site conditions, with long-term studies needed to clarify ARG dynamics in diverse crops and rotation systems for comprehensive risk assessment.
-
It accompanies this paper at: https://doi.org/10.48130/newcontam-0025-0013.
-
Not applicable.
-
The authors confirm their contributions to the paper as follows: all authors contributed to the study conception and design, and commented on previous versions of the manuscript; material preparation, data collection, and analysis: Cao M; writing the first draft of the manuscript: Cao M. All authors reviewed the results and approved the final version of the manuscript.
-
The datasets used or analyzed during the current study are available from the corresponding author upon reasonable request.
-
This study was supported by the National Science Foundation for Distinguished Young Scholars (42125703), National Natural Science Foundation of China (42277371 and 41822706), and Fundamental Research Funds for the Central Universities (310432104).
-
The authors declare that they have no conflict of interest.
-
# Authors contributed equally: Manman Cao, Shuai Ma
Full list of author information is available at the end of the article. - Supplementary Text S1 Soil collection and preparation.
- Supplementary Text S2 Physico-chemical properties analysis.
- Text S2
- Supplementary Table S1 Characterization of the soil.
- Supplementary Table S2 Sequences data for 16S rRNA in soil samples.
- Supplementary Table S3 Sequences data for 16S rRNA in soybean phyllosphere and rhizoplane samples.
- Supplementary Table S4 Sequences data for 16S rRNA in soybean seed samples.
- Supplementary Table S5 Primers for target genes.
- Supplementary Fig. S1 Schematic of the experiment design.
- Supplementary Fig. S2 SEM images and EDS spectra of ash.
- Supplementary Fig. S3 Soil physical-chemical properties.
- Supplementary Fig. S4 Relative abundance of ARGs and MGEs in S_0m and S_1m under different treatments.
- Supplementary Fig. S5 Relative abundance of ARGs and MGEs in p_1m and r_1m under different treatments.
- Supplementary Fig. S6 Bioaccumulation factors of ARGs in the phyllosphere and rhizoplane of soybean.
- Supplementary Fig. S7 Heatmap shows the correlation between the ARGs and MGEs in soil.
- Supplementary Fig. S8 Heatmap shows the correlation between the ARGs and MGEs in soybean.
- Supplementary Fig. S9 PCA analysis of ARGs in soil different habitats and different growth periods.
- Supplementary Fig. S10 PCA analysis of ARGs in soil under different treatments.
- Supplementary Fig. S11 PCA analysis in soybean different habitats and different growth periods.
- Supplementary Fig. S12 NMDS analysis in different habitats and different growth periods.
- Supplementary Fig. S13 Variations in bacterial alpha diversity under different treatments in rhizosphere and non-rhizosphere soil samples.
- Supplementary Fig. S14 Variations in bacterial alpha diversity under different treatments in soybean phyllosphere and rhizoplane samples.
- Supplementary Fig. S15 Variations in bacterial alpha diversity under different treatments in soybean seed samples.
- Supplementary Fig. S16 PCoA analysis of soil bacterial communities.
- Supplementary Fig. S17 NMDS analysis of soil bacterial communities.
- Supplementary Fig. S18 Venn diagram of soil bacteria between different treatments.
- Supplementary Fig. S19 PCoA analysis of soybean bacterial communities.
- Supplementary Fig. S20 NMDS analysis of soybean bacterial communities.
- Supplementary Fig. S21 Venn diagram of soybean bacteria between different treatments.
- Supplementary Fig. S22 Bacterial communities at phylum levels in soybean phyllosphere and rhizoplane.
- Supplementary Fig. S23 Bacterial communities at phylum levels in soybean seed.
- Supplementary Fig. S24 Soil bacterial communities of different treatments at genus levels.
- Supplementary Fig. S25 Bacterial communities at genus levels in soybean phyllosphere and rhizoplane.
- Supplementary Fig. S26 Bacterial communities at genus levels in soybean seed.
- Supplementary Fig. S27 Heatmaps show the correlation between ARGs and environmental variables.
- Supplementary Fig. S28 Heatmap shows the correlation between bacterial genera and environmental variables.
- Copyright: © 2025 by the author(s). Published by Maximum Academic Press, Fayetteville, GA. This article is an open access article distributed under Creative Commons Attribution License (CC BY 4.0), visit https://creativecommons.org/licenses/by/4.0/.
-
About this article
Cite this article
Cao M, Ma S, Wang F, Yuan X, Bashir S, et al. 2025. Black carbon derived from wheat straw burning mitigates antibiotic resistance gene dissemination in soil-crop systems under polyethylene and biodegradable plastic mulch film residues. New Contaminants 1: e013 doi: 10.48130/newcontam-0025-0013 

Black carbon derived from wheat straw burning mitigates antibiotic resistance gene dissemination in soil-crop systems under polyethylene and biodegradable plastic mulch film residues
- Received: 28 September 2025
- Revised: 22 October 2025
- Accepted: 28 October 2025
- Published online: 18 November 2025
Abstract: Black carbon (BC) derived from straw burning coexists with plastic mulch film (PMF) residues in agricultural soils, but its role in modulating the dissemination of antibiotic resistance genes (ARGs) in soil-crop systems remains unclear. This study investigated ARG dynamics in soil-soybean systems under two PMF types [polyethylene (PE) and biodegradable (BP)] and two BC treatments [exogenous addition (A) and in-situ straw burning (B)]. After 15 d of incubation, PE and BP treatments increased soil ARG abundance by 38.22% and 15.10%, respectively. Conversely, BC-related treatments significantly reduced ARG abundance (PEA: 39.08%, BPA: 38.86%, PEB: 49.79%, BPB: 29.76%). During the soybean reproductive stage, BC-related treatments further decreased ARG abundance in non-rhizosphere soil (PEB: 56.24%, BPB: 56.22%), rhizosphere soil (BPB: 52.11%), rhizoplane (BPB: 37.03%), phyllosphere (PEB: 78.48%, BPB: 93.56%), and seeds (PEB: 56.08%, BPB: 79.77%). Network analysis confirmed that ARGs were associated with bacterial hosts (Proteobacteria, Firmicutes, Bacteroidota, Actinobacteriota) and their transfer from soil to plants. Microbial communities recovered within three months, indicating no long-term adverse effects of BC on soil health. These findings support the use of BC as a sustainable strategy to mitigate ARG dissemination in PMF-contaminated agroecosystems.