












-
Phlox is a genus within the family Polemoniaceae and consists of more than 60 species of perennial and annual plants. Native North American Phlox species are classified into Western and Eastern clusters in the United States[1,2], with differences in their habitat, growth habit, leaf morphology, flower color, and disease resistance[3]. On the basis of phylogeny, karyology, and phenotypic characteristics, Phlox is classified into three sections: Annuae, Occidentales, and Phlox[2]. As popular floriculture plants, numerous Phlox cultivars have been developed, displaying variations in flower color, shape, size, and inflorescence morphology[1,4]. According to the US Department of Agriculture (USDA) National Agricultural Statistics Service Census of Horticulture, the total wholesale value of Phlox sold in the US was around
${\$} $ ${\$} $ Flower color is one of the most important phenotypic features of ornamental plants, influencing their aesthetic quality and commercial value. In addition to developing cultivars with novel flower colors, researchers have established standardized systems to quantify floral traits numerically. The Munsell Color System was the first to describe color quantitatively, defining it in a three-dimensional space on the basis of hue, lightness, and chroma[18,19]. Although widely adopted in horticulture, it partially relies on human perception, which can limit precision[19]. To address this, the CIELab system introduced coordinates for lightness (L*), green/red (a*), and blue/yellow (b*), providing an objective and quantitative approach to color assessment[18,20]. Advances in high-throughput techniques and computational tools have further facilitated the digitalization of biological traits. By capturing and analyzing images using digital devices and software, digital imaging has been widely applied to assess disease severity[21−24]; evaluate fruit traits such as shape, color, and ripeness[20,25,26]; and characterize flowers' size, shape, color, and texture[27−29]. Numerous studies have examined floral color variation in ornamental and crop species, including Lisianthus[27], Begonia × tuberhybrida[28], Viola[29], Helianthus annuus[30], and Hibiscus[31]. However, systematic digital imaging studies of flower color variation in Phlox species remain limited.
In plants, pigments play critical roles, functioning as pollinator attractants and seed dispersal cues, protecting against ultraviolet (UV) radiation, and contributing to defense mechanisms[32]. Red, purple, and blue flower colors are primarily derived from anthocyanins, a class of flavonoids in the plant secondary metabolic pathway[33]. Anthocyanidins, the aglycone cores of anthocyanins, are characterized by the typical C6-C3-C6 ring structure lacking sugar or acyl group moieties[34]. The most common anthocyanidins include cyanidin, pelargonidin, and delphinidin, whereas methoxylation of hydroxyl groups produces peonidin, petunidin, and malvidin[34]. Each anthocyanidin is associated with specific colors, ranging from orange-red (pelargonidin), red (cyanidins, peonidin, and malvidin), and dark red-purple (petunidin) to violet-blue (delphinidin)[34]. Flower coloration is mainly determined by the combined presence of multiple anthocyanidins, although in rare cases the color can be attributed to a single anthocyanidin[18]. In Phlox, anthocyanidins contribute to a wide spectrum of flower colors (purple, lilac, pink, red, orange, and blue), reflecting variation in pigment concentrations and combinations across the genus. However, systematic studies of anthocyanidin profiles in Phlox, their quantification, and association with flower colors, remain limited.
Several studies in other ornamental species have combined quantitative color data with biochemical measurements to interpret pigment composition and its relationship to flower color. Wang et al. analyzed petal flavonoid profiles in 39 tree peony ((Paeonia spp.) cultivars to clarify chemotaxonomic relationships and infer evolutionary origin[35]. Using similar methodologies, Zhang et al. found that the accumulated cyanidin-based glycosides at the petal base cause blotch formation, and variation in anthocyanin composition among cultivars contributed to diverse flower colors in tree peony[36]. These studies demonstrate that combining quantitative color measurements with biochemical profiling assists the chemotaxonomic interpretation of flower color and clarifies how pigment composition determines color expression. However, such research in Phlox is still lacking, and the relationship between the anthocyanidin composition and quantitative flower color parameters remains largely unexplored. To address this gap, we applied digital imaging using Tomato Analyzer software to generate quantitative floral color data from a diverse Phlox collection. We also analyzed anthocyanidin profiles to assess variations in composition and investigate the correlations between colorimetric parameters and total or individual anthocyanidins. These approaches provide new insights into the biochemical basis of floral coloration in Phlox, enhance our understanding of pigment–phenotype associations, and establish a foundation for breeding cultivars with distinct and commercially valuable flower colors.
-
Phlox accessions used in this study were provided by the Ornamental Plant Germplasm Center (OPGC) in Columbus, OH, USA. The plants were cultivated at the OPGC greenhouse (40° N, 83° W, 238 m above sea level), under a 16-h photoperiod with daytime temperatures of 22–26 °C (12 h) and night-time temperatures of 18–24 °C (12 h). The collection consisted of 89 accessions from 17 species (Supplementary Table S1). Flowers were collected 2–3 d after opening, and five representative flowers from each plant were selected for digital imaging. Each scan consisted of five flowers and was considered to be a single sample. For some accessions, additional scans were performed when more flowers became available, resulting in multiple independent samples. After scanning, the corollas from each sample were pooled, lyophilized, and stored at −20 °C until anthocyanidin extraction.
Digital imaging
-
Flowers were placed in five holes of a black 18 cm × 18 cm polycarbonate plate for digital imaging. The plate was inverted and positioned at the same location on the flatbed scanner (CanoScan 5600F, Canon Inc., Tokyo, Japan). The plate gently pressed the flowers against the scanner's surface and provided a uniform black background. For each scan, the plate was placed in the same scanning area, and all scans were performed with the scanner's lid closed to minimize external light interference. The scanner's built-in light source provided stable and uniform illumination. Scans were performed at 100 dpi for 1–8-cm flowers and 200 dpi for 0.5–1-cm flowers, following the Tomato Analyzer's (ver. 3.0) instructions[37]. Images were edited using Tomato Analyzer's 'Boundary' function to delimit the analysis area, then petal color was analyzed by the 'Color Test' function within Tomato Analyzer[20,37]. Color was quantified using the CIELab color system, which is a three-dimensional sphere using three coordinates: lightness (L*) and both red–green (a*)_and blue–yellow (b*) chromaticity[18,20]. L* values range from 0 to 100, representing a color's lightness from black (L* = 0) to white (L* = 100)[20]. The value of a* ranges from green (negative value) to red (positive value); b* ranges from blue (negative value) to yellow (positive value)[20]. The color intensity chroma (C*) and identity hue (h°) values were calculated from the a* and b* values using the 'Color Test' module[37]. The h° value is measured in degrees (0°–360°), representing its position on the standard 360° color wheel[18−20].
Anthocyanidins extraction and quantification
-
Anthocyanidins were extracted using standard methods, in which corolla tissue was dissolved in hydrochloric acid (HCl) and subsequently subjected to isoamyl alcohol extraction[16,38]. Each pool of lyophilized flowers was prepared in two replicates, with 20 mg allocated per replicate. The anthocyanidin extractions were stored at –20°C before analysis by high-performance liquid chromatography (HPLC). Chromatographic separation was performed on a System Gold HPLC (Beckman Coulter, Inc., Fullerton, CA, USA), equipped with a Model 508 autosampler, a Model 126 binary pump, and a Model 168 diode array detector. A C-18 type Prodigy column (Phenomenex, Torrance, CA, USA) was maintained using a column heater (Alltech Associates, Deerfield, IL, USA). Samples were filtered through a 45-µm nylon syringe filter (Thermo Fisher Scientific, Rockwood, TN, USA) and transferred to a 150-µL poly-spring glass insert (Thermo Fisher Scientific, Rockwood, TN, USA) in a target vial (Thermo Fisher Scientific, Rockwood, TN). Injection volumes were 30 µL for most samples and 50 µL for pale white flower samples. Anthocyanidins were separated on the C18 column maintained at 25 °C, with detection performed at 520 nm. Aglycones were identified by retention time and UV–visible spectra compared with anthocyanidin standards, including delphinidin, cyanidin, petunidin, peonidin, and malvidin (ExtraSynthese, Genay, France), and pelargonidin (Sigma-Aldrich Co., St. Louis, MO, USA). Chromatographic peaks were considered to be absent when they were completely undetectable or present in trace amounts.
Statistical analysis
-
Colorimetric data were analyzed using the MultiBase add-in for Microsoft Excel. To generate the dendrogram, squared Euclidean distances were calculated using the centroid clustering method based on L*, a*, and b* coordinates. Pearson's correlation coefficients (r) and simple regressions were performed using the Microsoft Excel Add-ins Analysis ToolPak. To analyze the relationships between colorimetric parameters and anthocyanidin compositions, stepwise multiple regression was performed using Python (ver. 3.12.13) with the statsmodels (ver. 0.14.6), pandas, and NumPy libraries. The color parameters (L*, a*, b*, C*, and h°) served as dependent variables, whereas individual anthocyanidins (µg anthocyanidins/mg tissue) were defined as the independent variables. Pelargonidin and peonidin were excluded from the regression analyses because of excessive zero values. Stepwise multiple regression analyses were conducted, and the predictive pool included linear, squared (polynomial), and logarithmic terms for each anthocyanidin. A bidirectional stepwise selection algorithm was utilized, configured with a significance threshold of p < 0.15 for a variable to enter the model and p > 0.20 for removal. The model's performance and predictive power were evaluated using the adjusted R2 metric.
-
One hundred forty-two samples (710 flowers) were collected and scanned to characterize floral color variation across 89 Phlox accessions, representing 17 species from three sections: Annuae, Occidentales, and Phlox. The central portion of each flower was excluded from subsequent analyses because of its distinct coloration relative to the petals. Color parameter values spanned a broad range across samples. The median values of L*, a*, b*, and C* were 55.16, 28.00, –18.55, and 34.27, respectively (Fig. 1). The value of h°, which represents the hue angle on the 360° color wheel, varied from 16.63 to 356.82 in the studied Phlox accessions, with a median value at 326.04° (Fig. 1).
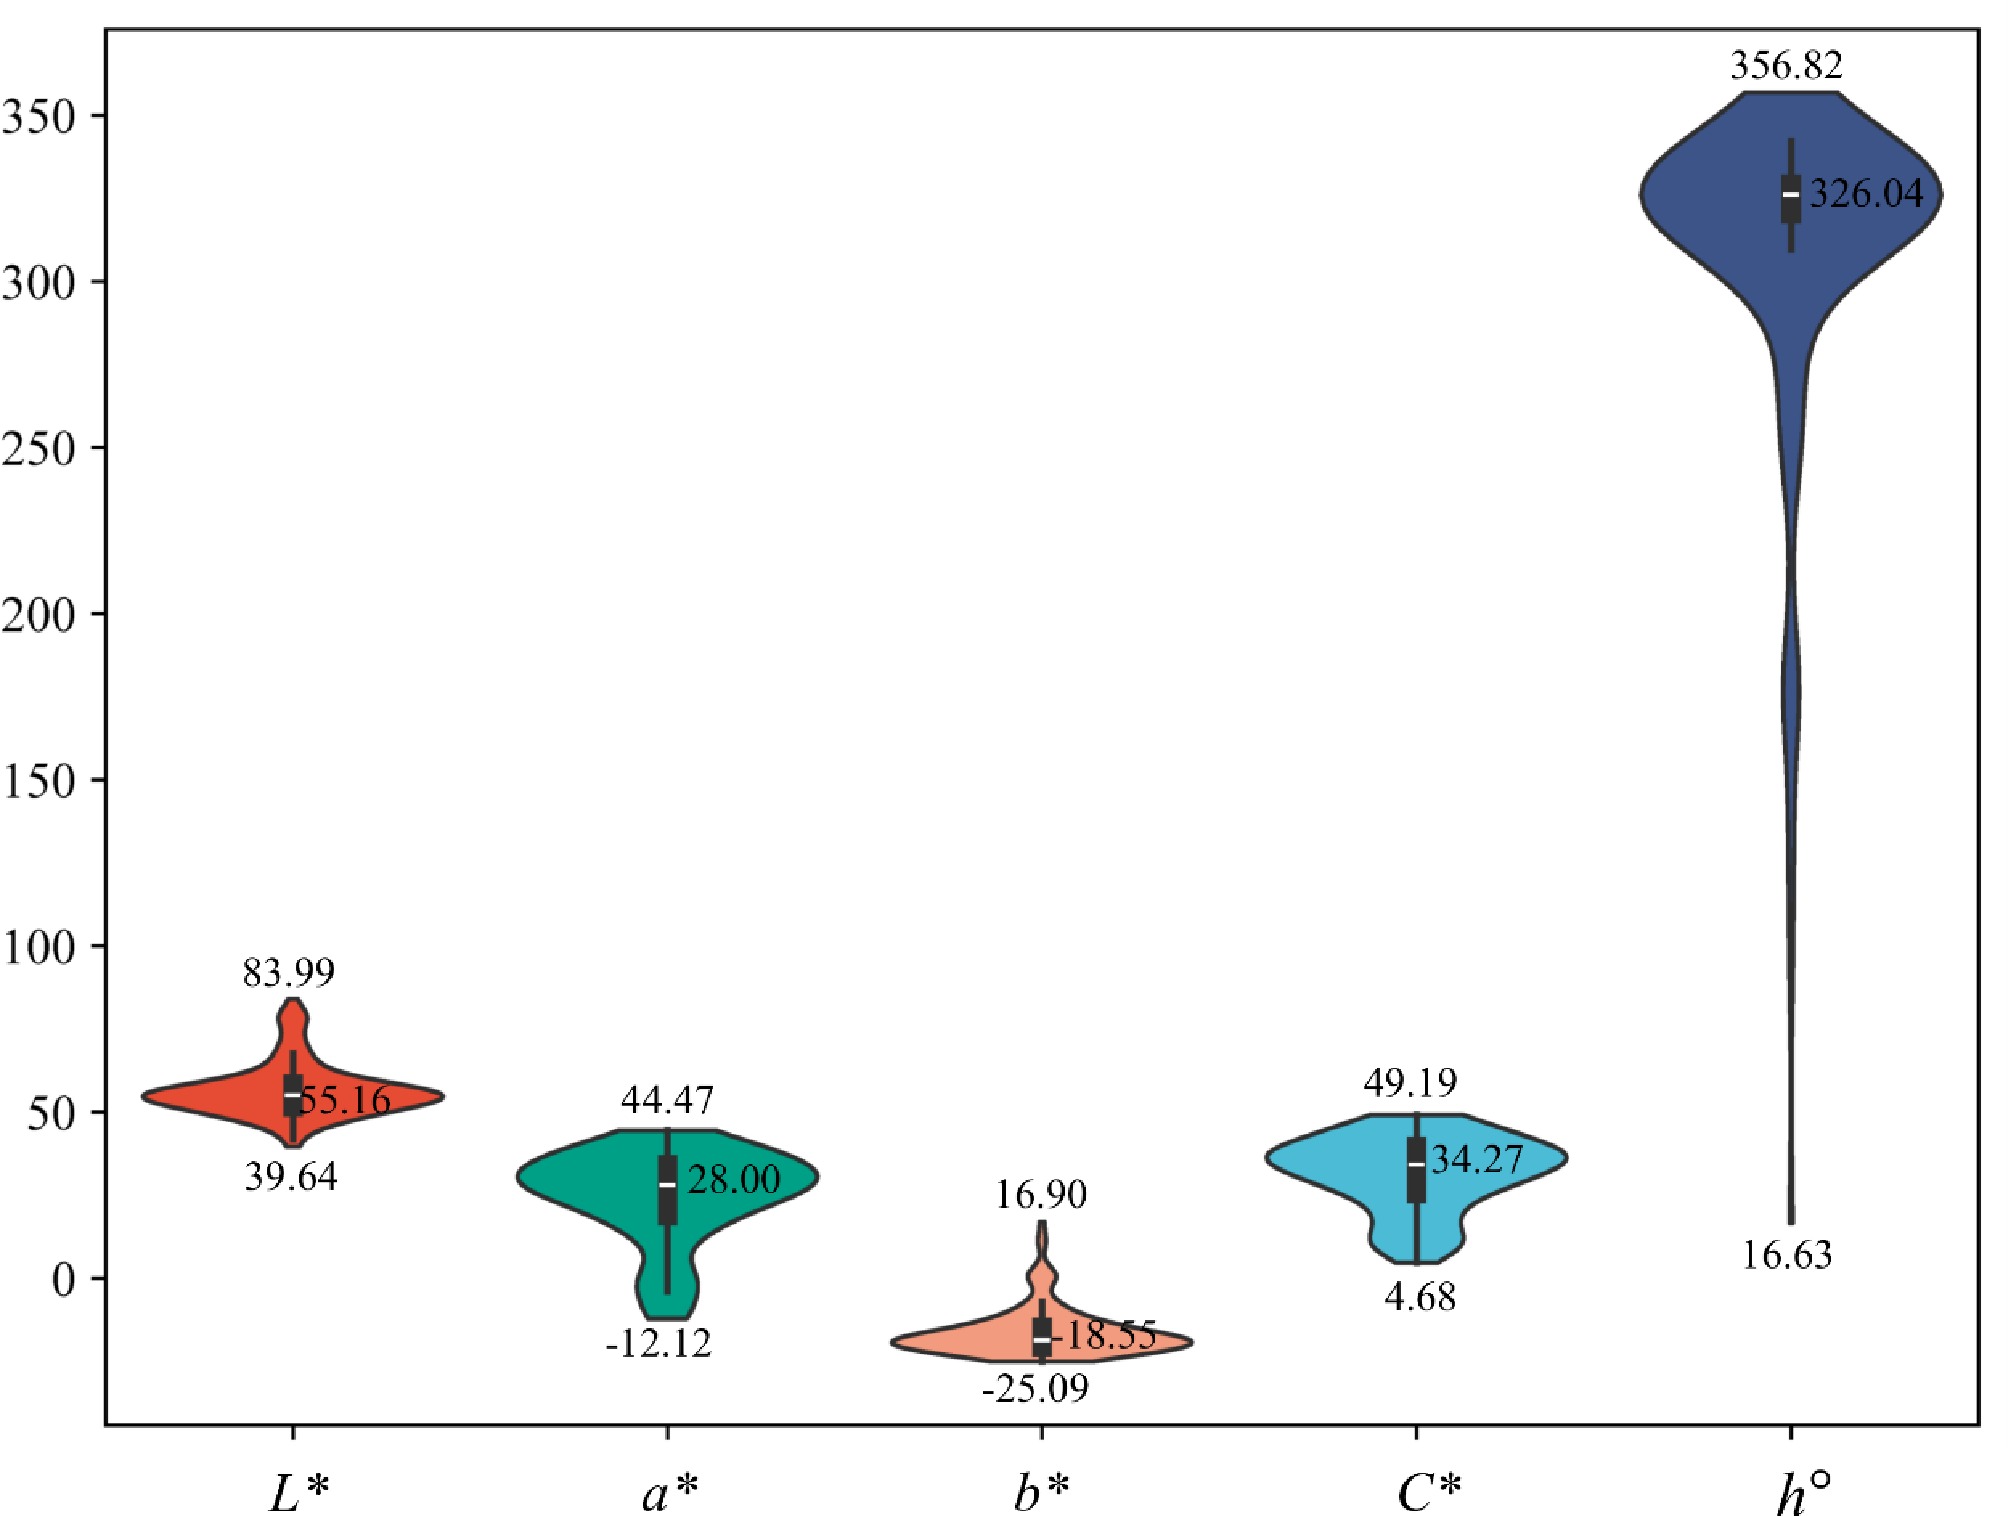
Figure 1.
Distribution of colorimetric parameters measured from 142 floral scans of Phlox, with each scan including five flowers. Violin plots depict the full distribution of L*, a*, b*, C*, and h° values. lightness (L*), green/red (a*), blue/yellow (b*), and chroma (C*) are unitless; hue (h°) is represented numerically in degrees (0°–360°) on chromaticity. Annotated numbers indicate the maximum, median, and minimum values across all samples.
Hierarchical clustering classified the OPGC Phlox collection into 10 clusters
-
Hierarchical analysis was performed using three coloration coordinates (L*, a*, and b*), clustering 89 accessions into 10 groups: Dark red-purple (DRP), lavender (L), light red (LR), light red-purple (LRP), purple-red (PR), red (R), reddish (RR), red-purple (RP), white (W), and yellow (Y) (Fig. 2). The groups were named according to the Munsell Color System[19]. The average of and variation in the colorimetric values for each color cluster are summarized in Table 1. Hierarchical clustering based on variation in a* separated the samples into two main clades. One with seven clusters (DRP, LR, LRP, PR, R, RP, and RR) was characterized by positive a* values, and the other group included three clusters (L, W, and Y) with negative a* values (Table 1, Fig. 2). The larger group was subdivided by b* into strong purple-hued clusters (DRP, LRP, RP, and RR), characterized by strongly negative b* values, and red-toned clusters (LR, PR, and R) with higher b* values (Table 1, Fig. 2). Differences in L* further refined the classification, distinguishing DRP, LRP, RP, and RR within the purple clusters, and LR, PR, and R within the red-toned clusters (Table 1, Fig. 2). The smaller clade was subdivided by b* and further refined by L*, separating the L, W, and Y clusters (Table 1, Fig. 2). Overall, red pigmentation (as reflected by a* value) was the primary factor structuring the color clusters; red and purple flowers grouped more closely with each other than with lavender, white, and yellow clusters.
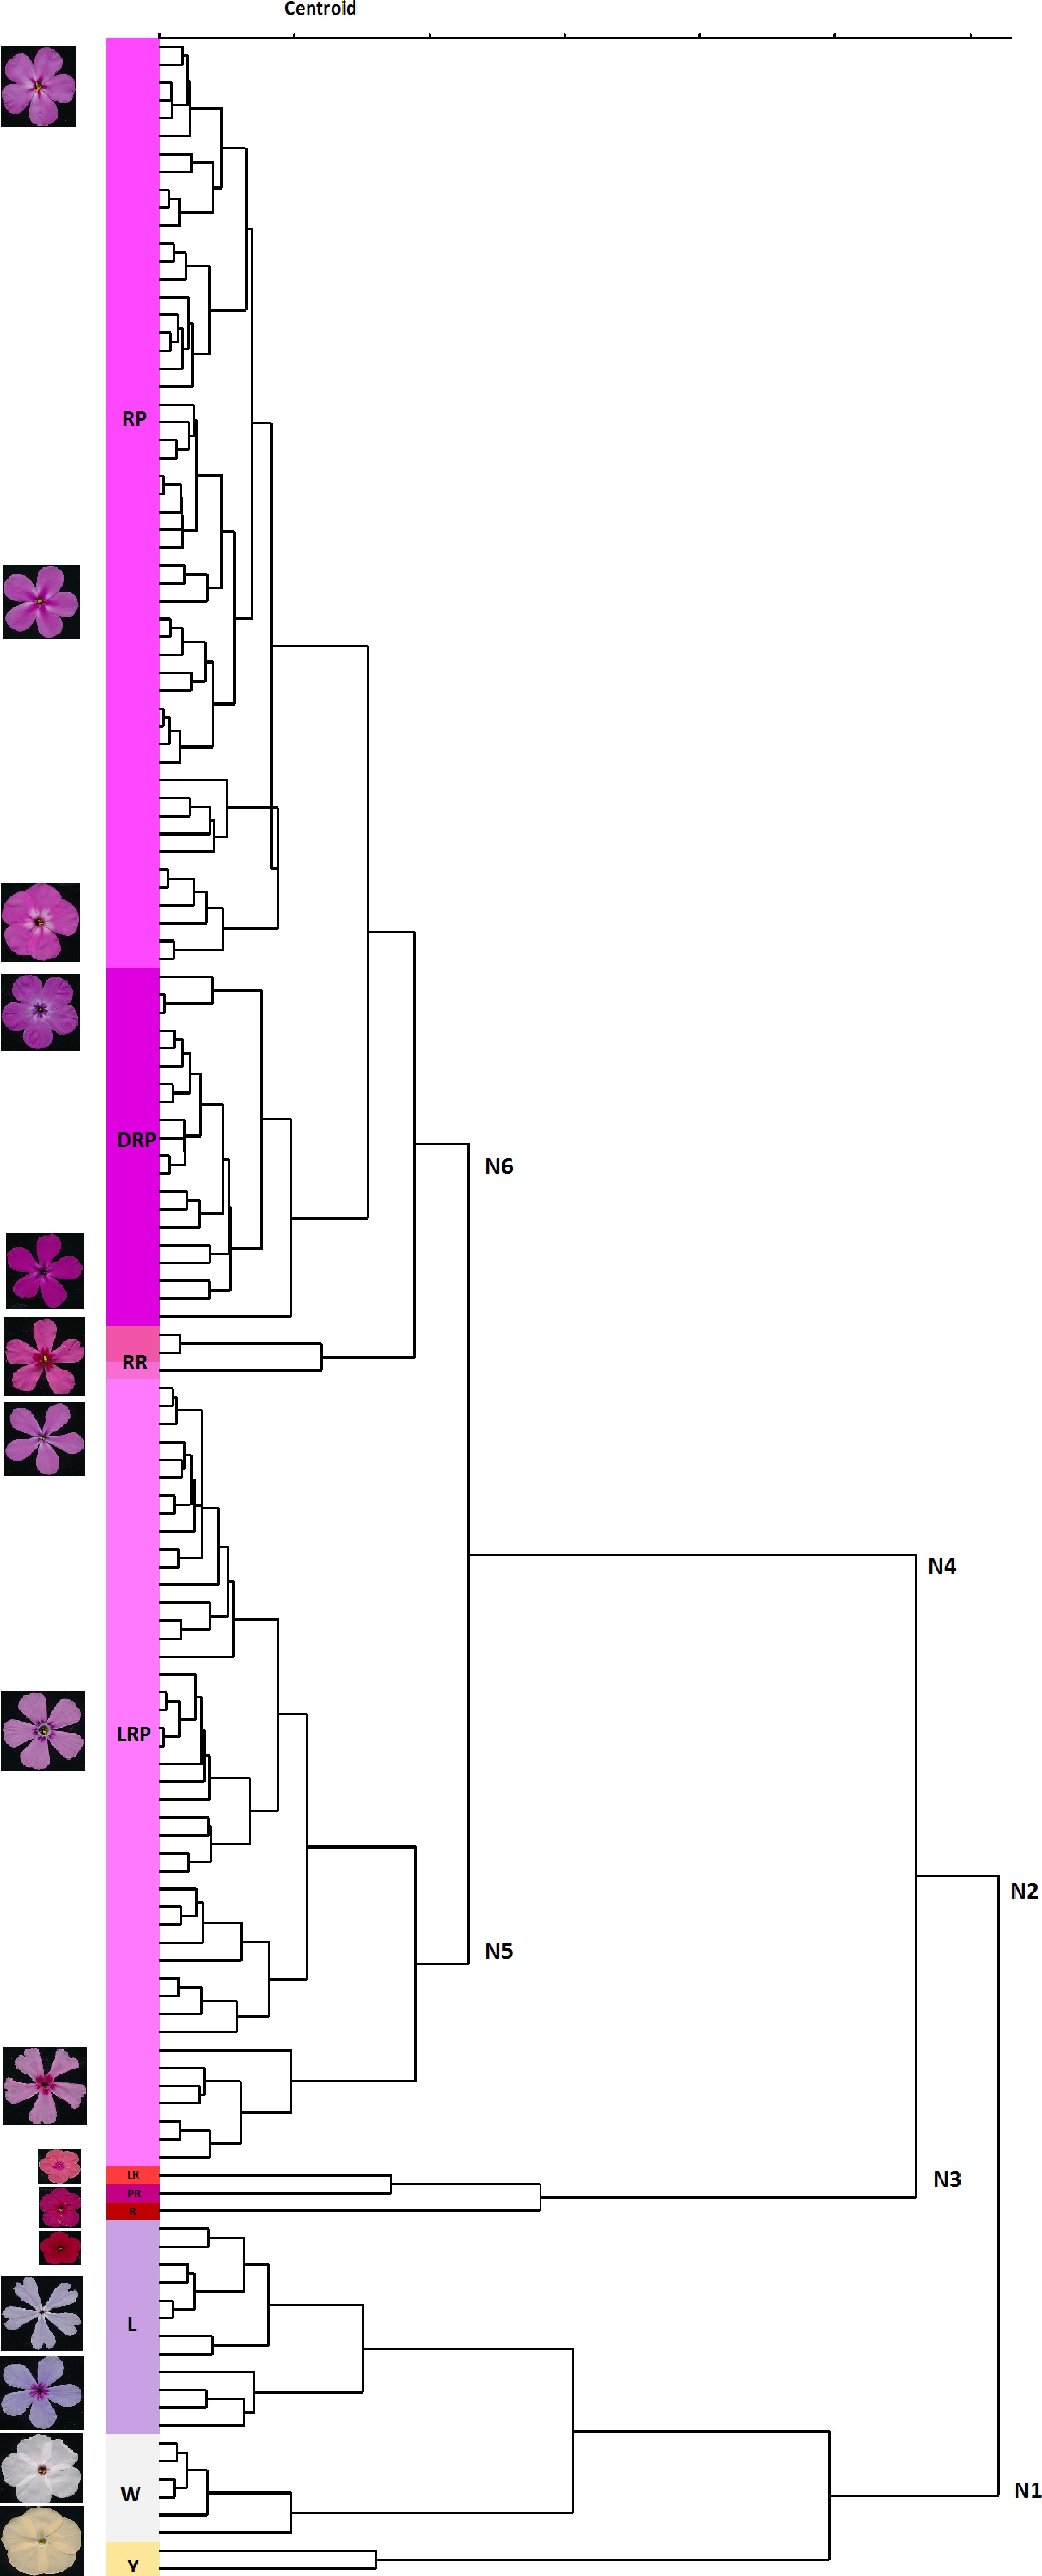
Figure 2.
Dendrogram of Phlox flowers using the L*, a*, and b* colorimetric parameters. Representative flower images illustrate the characteristic appearance of each cluster. Nodes indicate major hierarchical divisions. Color clusters include dark red-purple (DRP), lavender (L), light red (LR), light red-purple (LRP), purple-red (PR), red (R), reddish (RR), red-purple (RP), white (W), and yellow (Y).
Table 1. Summary of colorimetric parameters and corresponding sample size for each color cluster.
Dendrograma Color clusterb Number of samplesc L* a* b* C* h° 
RP 52 53.4 ± 0.3 31.6 ± 0.4 −19.7 ± 0.2 37.3 ± 0.4 327.9 ± 0.5 DRP 20 48.2 ± 0.5 40.0 ± 0.5 −22.9 ± 0.3 46.2 ± 0.4 330.1 ± 0.5 RR 3 53.2 ± 2.3 36.5 ± 2.4 −12.8 ± 0.2 38.7 ± 2.2 340.5 ± 1.4 LRP 44 57.8 ± 0.5 20.7 ± 0.7 −16.3 ± 0.4 26.5 ± 0.7 321.1 ± 0.9 LR 1 55.7 36.0 2.5 36.1 93.9 PR 1 41.9 41.5 −2.3 41.6 356.8 R 1 39.6 39.1 11.7 41.0 16.6 L 12 67.1 ± 1.1 −29.8 ± 0.8 −10.3 ± 0.9 9.2 ± 1.0 265.3 ± 4.5 W 6 79.6 ± 0.9 −9.5 ± 1.0 0.6 ± 0.3 9.5 ± 1.0 177.9 ± 2.2 Y 2 77.5 ± 1.7 −11.5 ± 0.6 13.6 ± 3.3 18.0 ± 2.2 131.5 ± 8.4 Values are presented as the mean ± standard deviation; for measurements based on a single sample, only the mean is reported. (a) Hierarchical clustering dendrogram of 10 color clusters. (b) Color clusters: Dark red-purple (DRP), lavender (L), light red (LR), light red-purple (LRP), purple-red (PR), red (R), reddish (RR), red-purple (RP), white (W), and yellow (Y). (c) A sample represents a single digital scan, which includes five flowers. A distribution plot of the a* and b* values was generated to evaluate the consistency and accuracy of the color clustering (Fig. 3a). Although the DRP, LRP, and RP clusters showed proximity, all clusters were clearly separated (Fig. 3a). Linear regression analyses revealed varying strengths of association between L* and C* across color clusters containing more than six samples (Fig. 3b). L* and C* were negatively correlated in all clusters except for the W cluster (Fig. 3b). The coefficient of determination (R2) represents the proportion of variation in C* explained by L*. The highest explanatory power was observed in the L cluster (R2 = 0.92), followed by the LRP cluster (R2 = 0.61) (Fig. 3b).
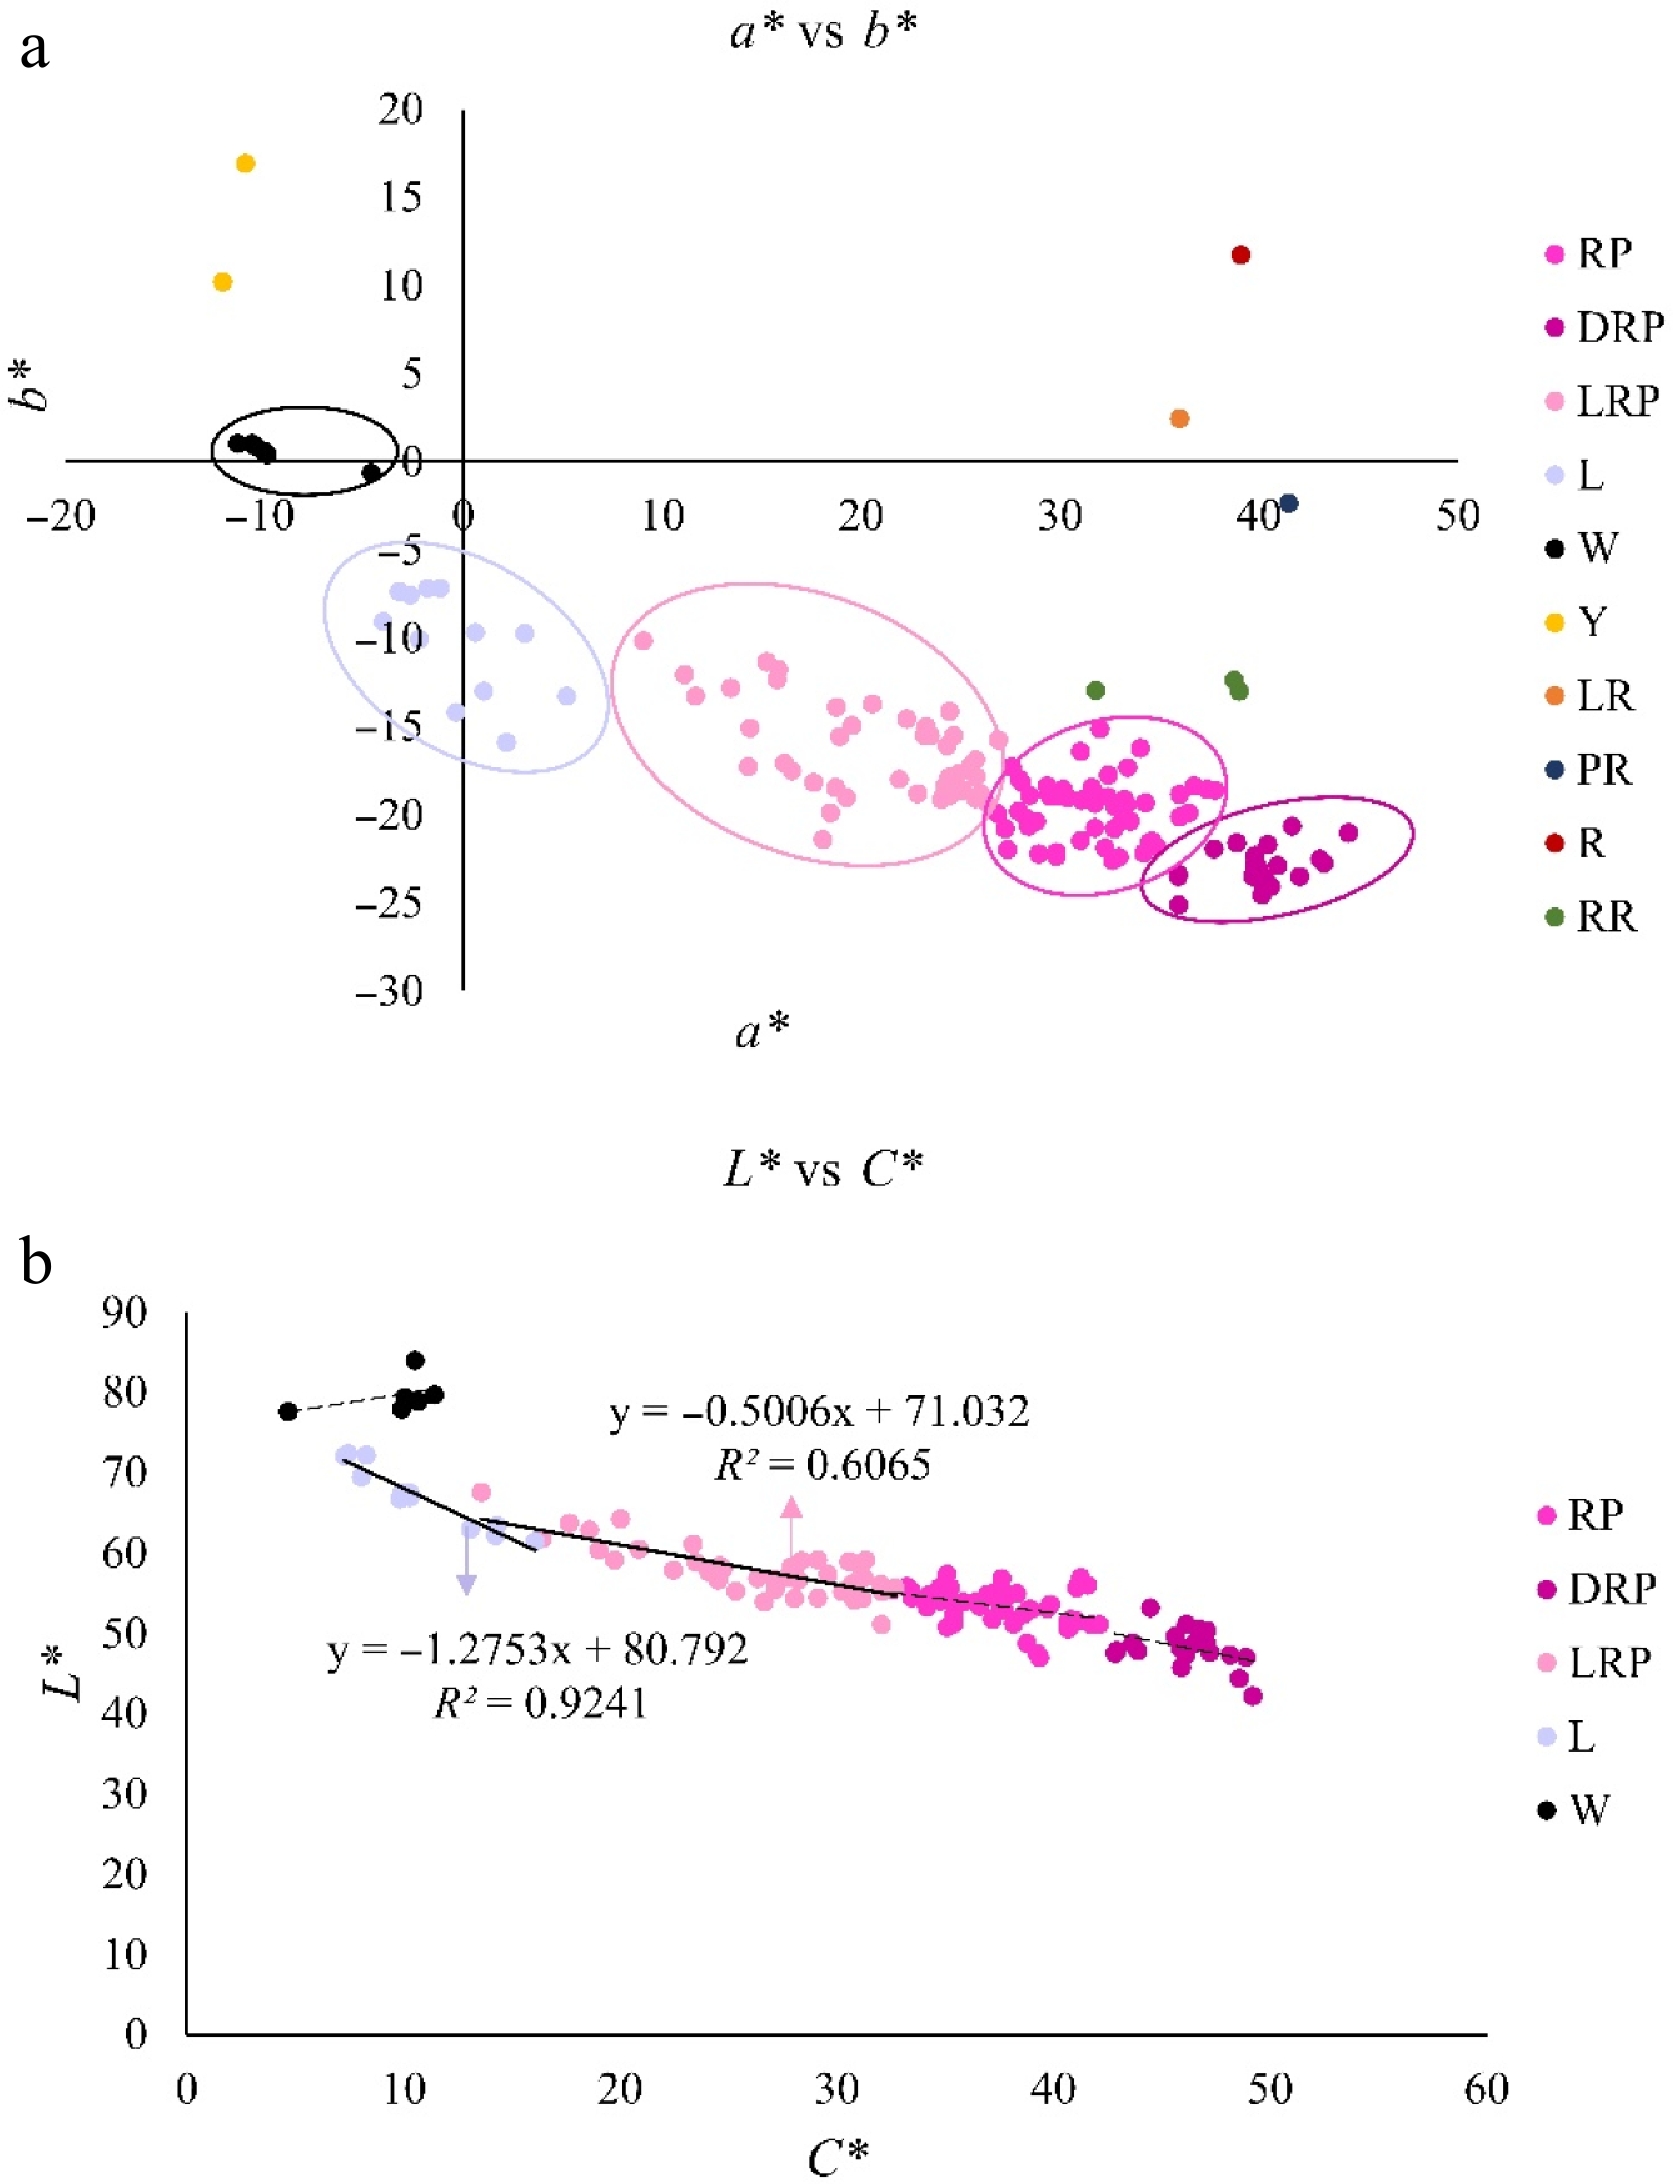
Figure 3.
Distribution and correlation of colorimetric parameters in Phlox flower clusters. (a) Distribution of color clusters based on a* and b* values. (b) Correlation between L* and C* for color clusters with a sample size greater than six. Linear regression lines, fitted equations, and the corresponding coefficient of determination (R2) values are provided. Color clusters include dark red-purple (DRP), lavender (L), light red (LR), light red-purple (LRP), purple-red (PR), red (R), reddish (RR), red-purple (RP), white (W), and yellow (Y).
Distribution of flower color clusters across Phlox sections and species
-
This Phlox collection spanned three sections and 17 species. Based on the current phylogenetic consensus, the distribution of color clusters across the Phlox collection is summarized in Fig. 4. Red-purple petal coloration (DRP, LRP, RP, and RR clusters) predominated in three sections, occurring in 15 of 17 species, except P. drummondii and P. bifida (Fig. 4). White flowers (W cluster) were widespread in the Occidentales and Phlox sections and were identified in P. bifida, P. carolina, P. glaberrima, P. maculata, and P. ovata. Lavender coloration (L cluster), distributed in the Annuae and Occidentales sections, was found mainly in P. divaricata, P. pilosa, P. bifida, and P. subulata. The R and Y clusters were observed only in P. drummondii, whereas LR and PR were only present in P. paniculata (Fig. 4). Most species contained flowers belonging to multiple color clusters, including P. carolina, P. ovata, P. paniculata, P. pilosa, and P. subulata (Fig. 4).
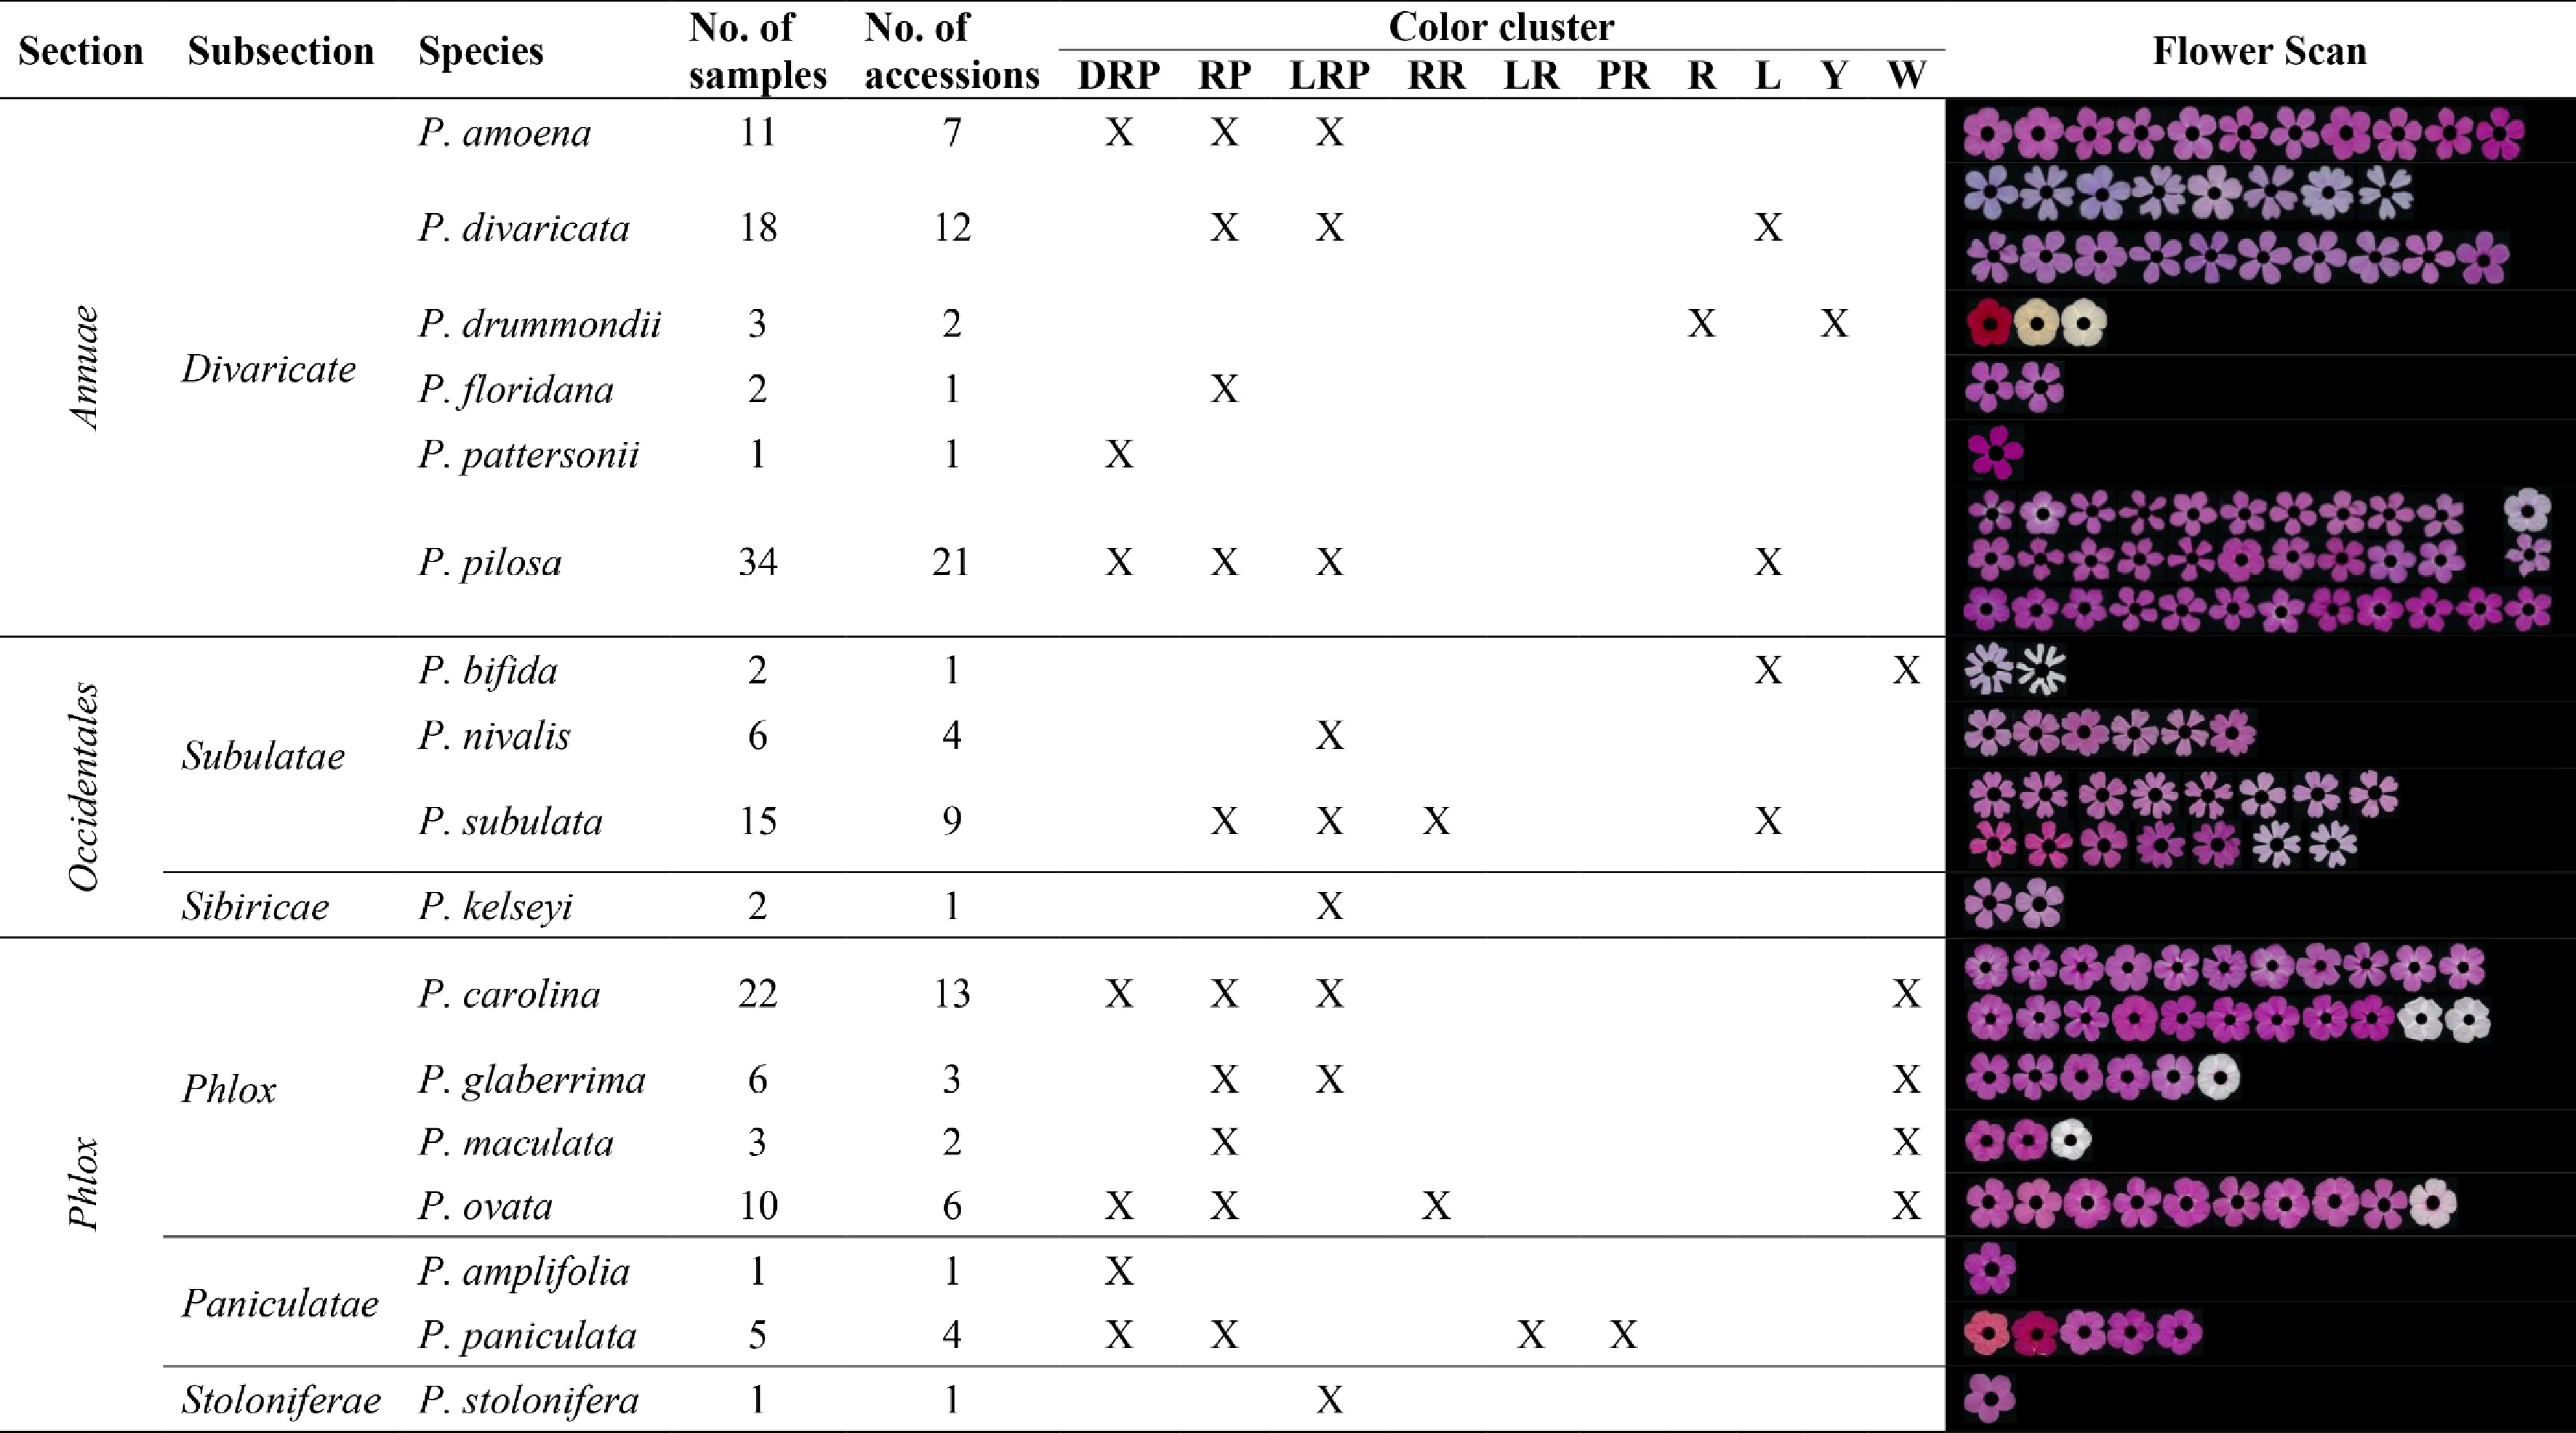
Figure 4.
Phlox species included in this study and their assigned color clusters, determined by hierarchical clustering of the colorimetric parameters. Representative flowers are shown, with the flower eye covered by a black dot to indicate the petal area analyzed. An 'X' indicates samples classified within the corresponding color clusters. Color clusters include dark red-purple (DRP), lavender (L), light red (LR), light red-purple (LRP), purple-red (PR), red (R), reddish (RR), red-purple (RP), white (W), and yellow (Y).
Anthocyanidin profiling
-
The Y cluster was excluded from anthocyanidin profiling because anthocyanidin extraction was unsuccessful. Analysis revealed that all six common anthocyanidins were detected in this Phlox collection (85 accessions). Anthocyanidins detected only at trace levels were considered to be absent in subsequent analyses. The concentrations and compositions of six anthocyanidins varied among accessions. Some accessions contained only a single pigment (delphinidin or cyanidin), whereas others contained different combinations of the six anthocyanidins (Fig. 5, Supplementary Table S2). Most examined flowers contained delphinidin and cyanidin, making them the most common anthocyanidins in the Phlox collection (Supplementary Table S2). Petunidin and malvidin were also frequently observed, with peonidin and pelargonidin occurring less commonly (Supplementary Table S2). In terms of total anthocyanidins, 100 samples (76%) contained less than 2 µg per mg of dry tissue, whereas only two samples exceeded 5 µg of anthocyanidins per mg of tissue (Supplementary Table S2). Comparisons among samples showed that flowers with similar anthocyanidin profiles and total anthocyanidins (TA) can exhibit different floral coloration (Fig. 5b, c). P. divaricata (PZ11-008 p1, TA = 1.55 µg/mg) and P. divaricata (PZ10-100 p1, TA = 1.57 µg/mg) exhibited highly similar anthocyanidin profiles but differed in flower color: Lavender and light red-purple, respectively (Fig. 5b, c). However, samples with comparable flower color may differ in both their anthocyanidin composition and total anthocyanidin concentration (Fig. 5d, e). P. amoena (PZ12-057 p2, TA = 2.50 µg/mg) and P. carolina (PZ12-047 p2, TA = 1.26 µg/mg) both had dark red-purple petals, although malvidin was undetectable in P. carolina (Fig. 5d, e).
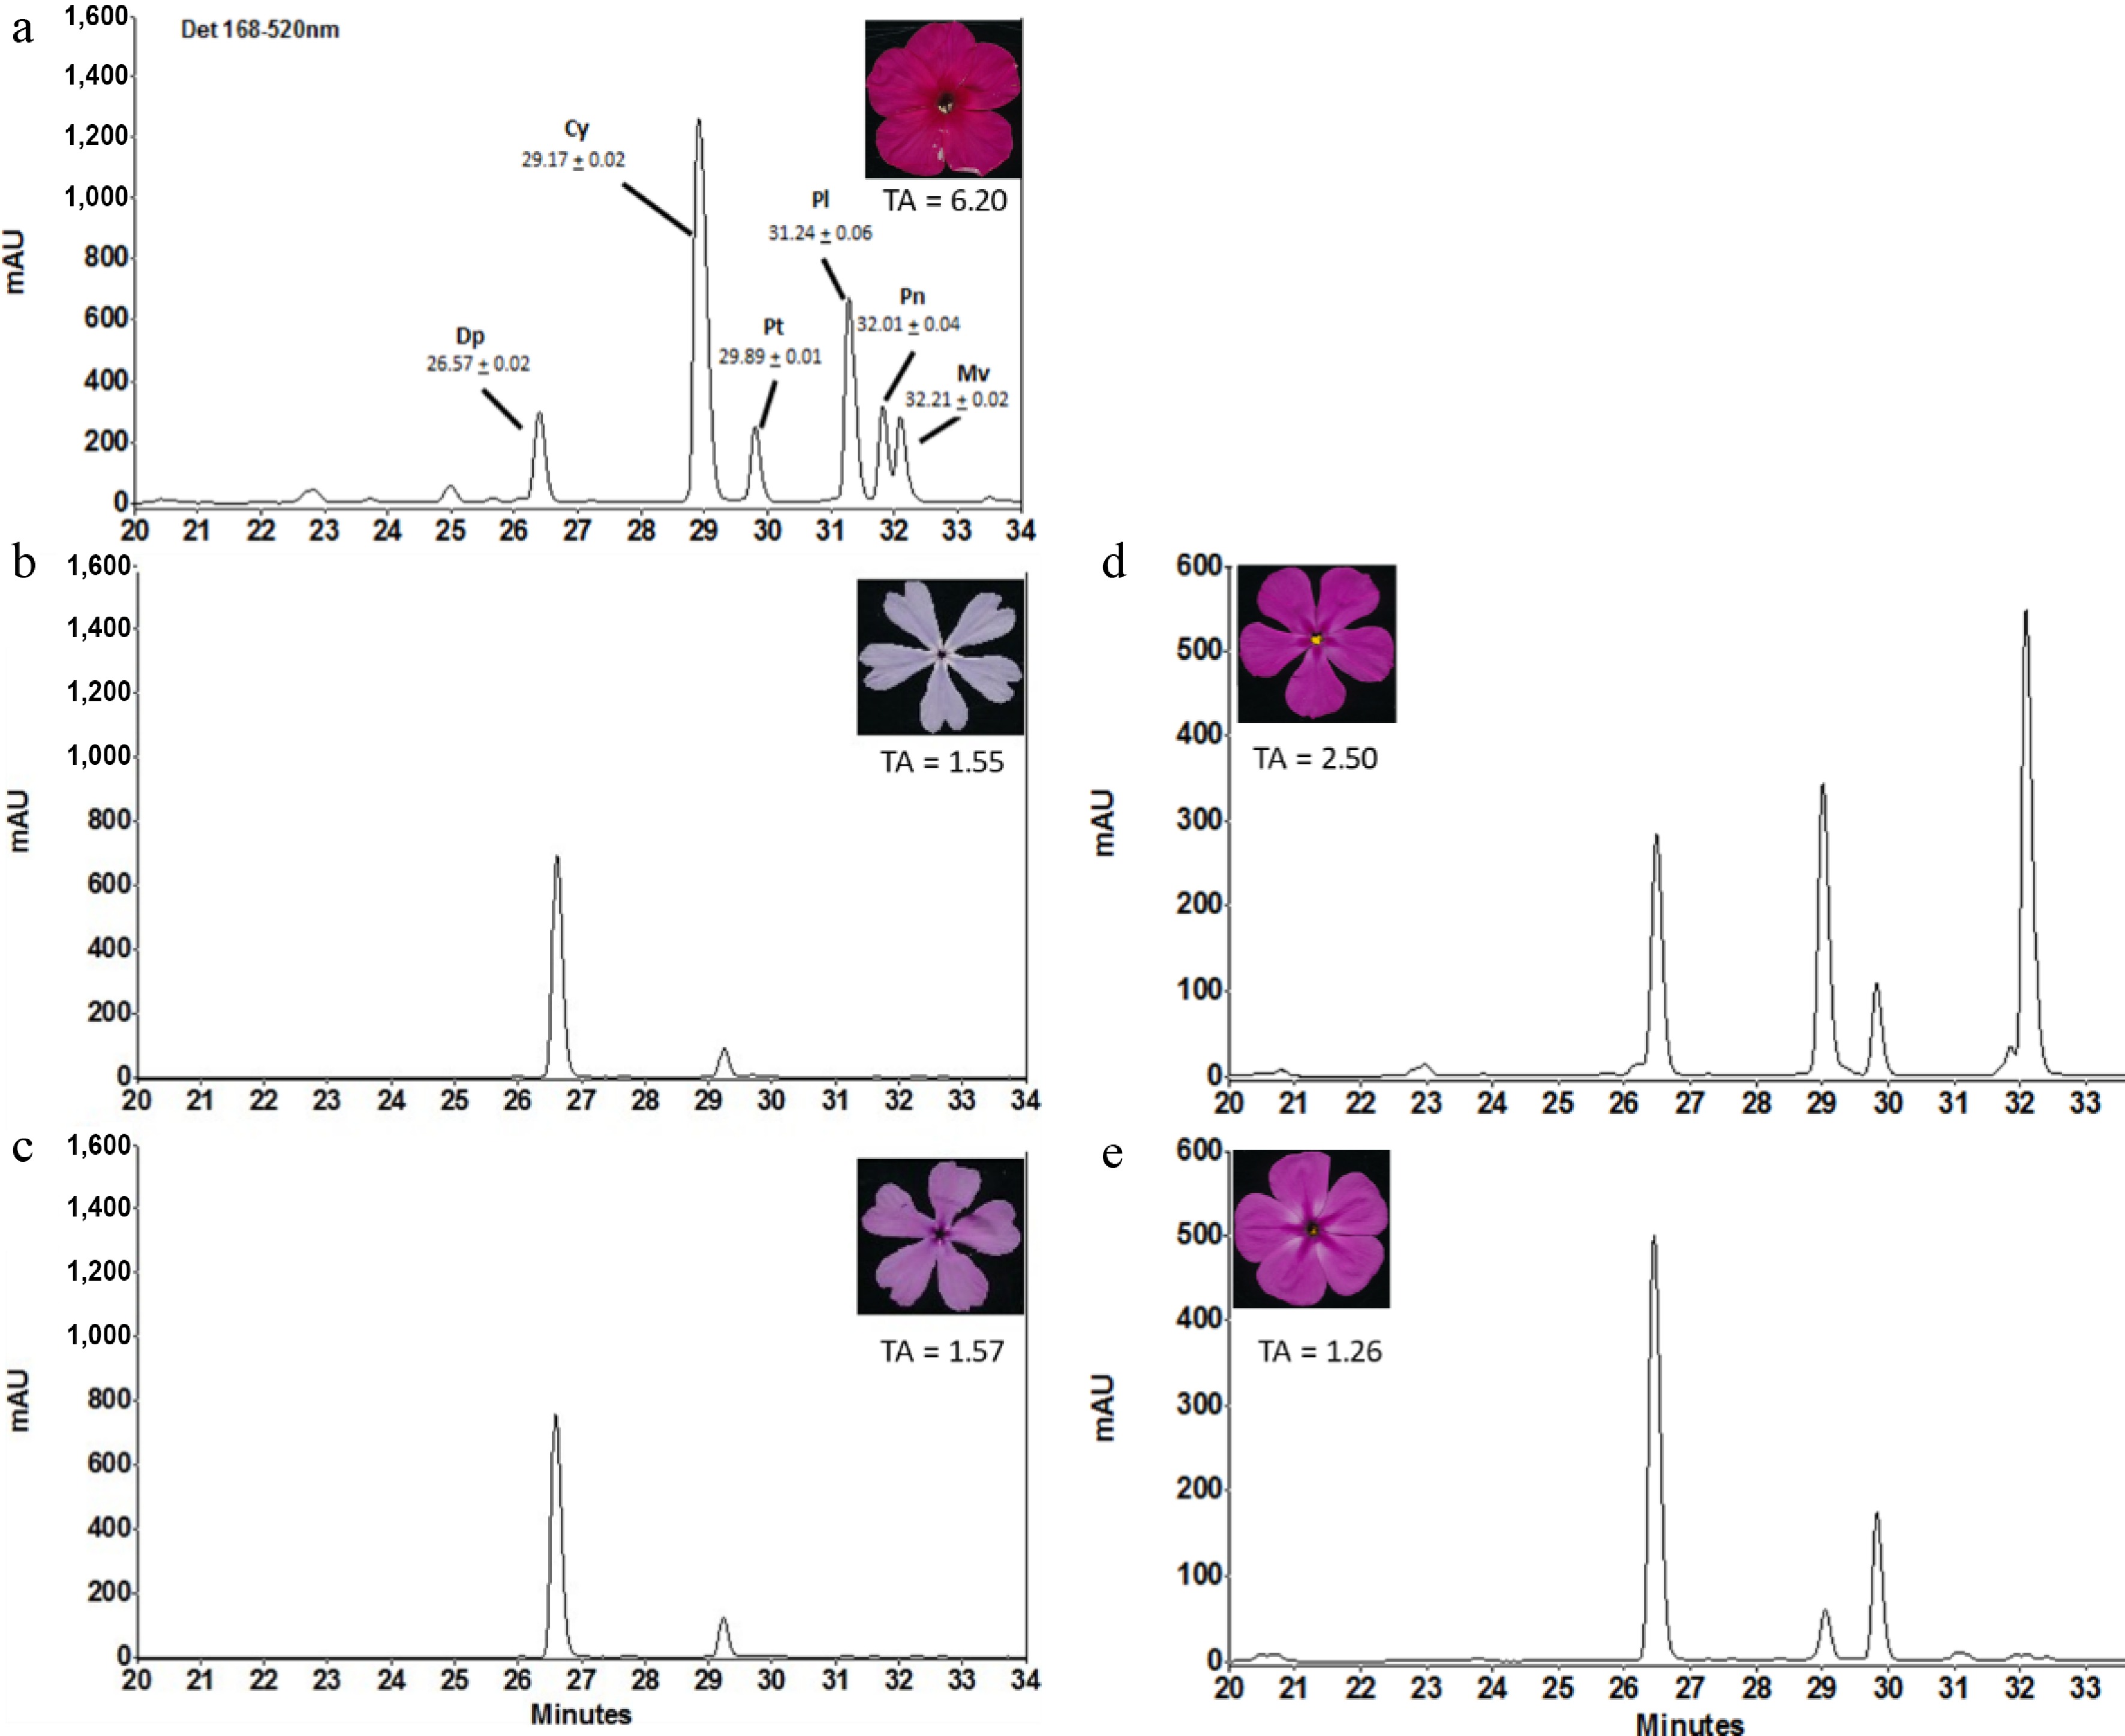
Figure 5.
High-performance liquid chromatography (HPLC) chromatograms illustrating variations in anthocyanidin composition and flower color in Phlox. (a) Representative HPLC chromatogram (P. paniculata, PZ12- 032 p1) showing the separation and identification of individual anthocyanidins detected at 520 nm, including delphinidin (Dp), cyanidin (Cy), petunidin (Pt), peonidin (Pn), pelargonidin (Pl), and malvidin (Mv). (b, c) Two accessions with highly similar anthocyanidin profiles and total anthocyanidins (TA, µg anthocyanidins/mg tissue) but distinct flower colors: (b) P. divaricata (PZ11-008 p1); (c) P. divaricata (PZ10-100 p1). (d, e) Two accessions with similar flower color but contrasting anthocyanidin profiles and total anthocyanidins: (d) P. amoena (PZ12-057 p2); (e) P. carolina (PZ12-047 p2). Images of representative flowers and total anthocyanidins are shown in each panel.
Anthocyanidin composition across color clusters
-
To compare anthocyanidin composition across color clusters, peak area percentages were used to normalize the data, indicating the relative abundance of each anthocyanidin in a sample. These relative abundances varied substantially among color clusters (Table 2). The DRP, LRP, and RP clusters were dominated by delphinidin, cyanidin, and malvidin derivatives, which together comprised the majority of total anthocyanidins, whereas pelargonidin was rare and detected only at low levels in these three clusters (Table 2). These three clusters showed the greatest similarity in their anthocyanidin profiles and contained the largest sample sizes. As delphinidin levels decreased, malvidin levels increased, a pattern that was also associated with darker coloration within these clusters. The clusters PR and RR shared a cyanidin-dominated anthocyanidin profile, with delphinidin as a secondary component in RR and pelargonidin as the second most abundant in PR (Table 2). RR only had cyanidin and pelargonidin detected, whereas PR contained all six common anthocyanidins, showing the most complex anthocyanidin profile across all color clusters (Table 2). DRP, LR, L, RP, and W also showed complex anthocyanidin profiles, with more than four individual anthocyanidins detected in each color cluster. LR contained overall low levels of total anthocyanidins, with pelargonidin as the predominant pigment (Table 2). The R and L clusters had delphinidin as the main anthocyanidin, with cyanidin as the secondary abundant component (Table 2). In the R cluster, these two anthocyanidins contributed to the darker coloration, whereas variation in the other anthocyanidins contributed to the lavender color of the L cluster. A high delphinidin-to-cyanidin ratio, with an increased concentration of both individual anthocyanidins, was associated with a more reddish rather than a bluish hue of delphinidin. The W cluster contained primarily cyanidin despite having a low total anthocyanidin content (Table 2). Total anthocyanidins varied among clusters, with higher values generally observed in red-toned and purple clusters. The W cluster had the lowest level at 0.2 µg/mg (Table 2), whereas the PR and R clusters showed significantly high concentrations of 6.2 µg/mg and 5.4 µg/mg, respectively (Table 2).
Table 2. Relative abundance of individual and total anthocyanidins across 10 clusters, quantified using HPLC.
Dendrograma Color clusterb Number of Samplesc Anthocyanidin relative abundance (peak area %)d TAf Dpe Cye Pte Ple Pne Mve 
RP 50 49.4 ± 31.3 20.0 ± 11.7 7.4 ± 7.0 0 1.0 ± 3.0 22.2 ± 20.9 1.2 ± 0.6 DRP 18 35.3 ± 24.0 19.8 ± 7.9 12.4 ± 6.7 0.2 ± 0.9 2.1 ± 4.3 30.1 ± 21.3 1.7 ± 0.9 RR 3 34.0 ± 56.4 65.1 ± 56.4 0 0 0 0 1.6 ± 1.1 LRP 39 63.1 ± 24.6 23.7 ± 13.7 − 0 0.3 ± 0.9 9.7 ± 19.2 1.8 ± 1.0 LR 1 4.3 32.2 4.0 46.3 7.9 5.4 1.0 PR 1 9.9 47.4 7.5 18.7 8.4 8.1 6.2 R 1 81.0 19.0 0 0 0 0 5.4 L 12 76.2 ± 10.3 22.8 ± 10.6 0.7 ± 1.7 0 0.2 ± 0.5 0.3 ± 1.0 1.6 ± 0.9 W 6 21.3 ± 29.0 54.2 ± 33.0 1.3 ± 3.2 0 8.7 ± 7.0 14.4 ± 13.5 0.2 ± 0.3 Y NA NA NA NA NA NA NA NA Values are represented as the mean ± standard deviation; for measurements based on a single sample, only the mean is reported. (a) Hierarchical clustering dendrogram of 10 color clusters. (b) Color clusters: Dark red-purple (DRP), lavender (L), light red (LR), light red-purple (LRP), purple-red (PR), red (R), reddish (RR), red-purple (RP), white (W), and yellow (Y). (c) A sample represents a single digital scan, which includes five flowers. (d) Peak area % is a normalized measure representing the relative abundance (percentage) of each anthocyanidin within a sample. (e) Six common anthocyanidins: Delphinidin (Dp), cyanidin (Cy), petunidin (Pt), pelargonidin (Pl), peonidin (Pn), and malvidin (Mv). (f) TA: total anthocyanidins (µg anthocyanidins/mg tissue). Distribution of anthocyanidins among studied Phlox species
-
The distribution of anthocyanidins among the studied Phlox species shows that delphinidin and cyanidin were the most prevalent anthocyanidins, detected in all analyzed species (Supplementary Fig. S1). Petunidin and malvidin showed a particularly strong association, co-occurring in nine species and being jointly absent in four species. Complementary patterns were also observed among anthocyanidins: Reduced delphinidin was often accompanied by lower petunidin and higher malvidin accumulation, as in P. pilosa, P. ovata, and P. carolina. Pelargonidin was the least common anthocyanidins, detected only in P. amplifolia and P. paniculata. Within the Annuae, species generally lacked pelargonidin; P. drummondii additionally lacked petunidin, malvidin, and peonidin; and P. floridana lacked pelargonidin and peonidin. In the section Occidentales, delphinidin and cyanidin were the dominant anthocyanidins, petunidin was detected in two species, and other anthocyanidins were undetectable. Species in the section Phlox showed the highest diversity in anthocyanidin profiles, and six common anthocyanidins were found in P. paniculata and P. amplifolia (Supplementary Fig. S1).
Relationship between anthocyanidins and colorimetric parameters
-
Pearson correlation coefficients (r) were calculated to evaluate the pairwise relationships among individual anthocyanidins, total anthocyanidins, and colorimetric parameters (L*, a*, b*, C*, and h°). The results showed that flower color lightness (L*) was negatively correlated with total anthocyanidin concentration (r = −0.43, p < 0.001), with petunidin and malvidin (r = −0.42 and −0.33, respectively; p < 0.001) exhibiting the strongest associations among individual anthocyanidins. Total anthocyanidin content was not significantly correlated with the other color parameters. Both redness (a*) and color intensity (C*) showed positive correlations with petunidin (a*: r = 0.45, C*: r = 0.49; p < 0.001) and malvidin (a*: r = 0.33, C*: r = 0.39; p < 0.001). In addition, petunidin and malvidin were negatively correlated with b* (r = –0.36 and r = −0.38, respectively; p < 0.001) (Fig. 6a). Correlation analyses were conducted in the DRP, L, LRP, RP, and W clusters to further investigate the relationships between total anthocyanidins and L* within different color clusters. Clusters with fewer than six samples were excluded to ensure an adequate sample size sufficient and statistical robustness for reliable estimation of the correlations. Total anthocyanidin content showed a significant negative correlation with L* in the DRP, L, LRP, and RP color clusters (p < 0.05) (Fig. 6b). The strength of these relationships was reflected by the corresponding coefficients of determination (R2). The highest R2 value was observed in the cluster L (R2 = 0.7087), followed by DRP (R2 = 0.4562).
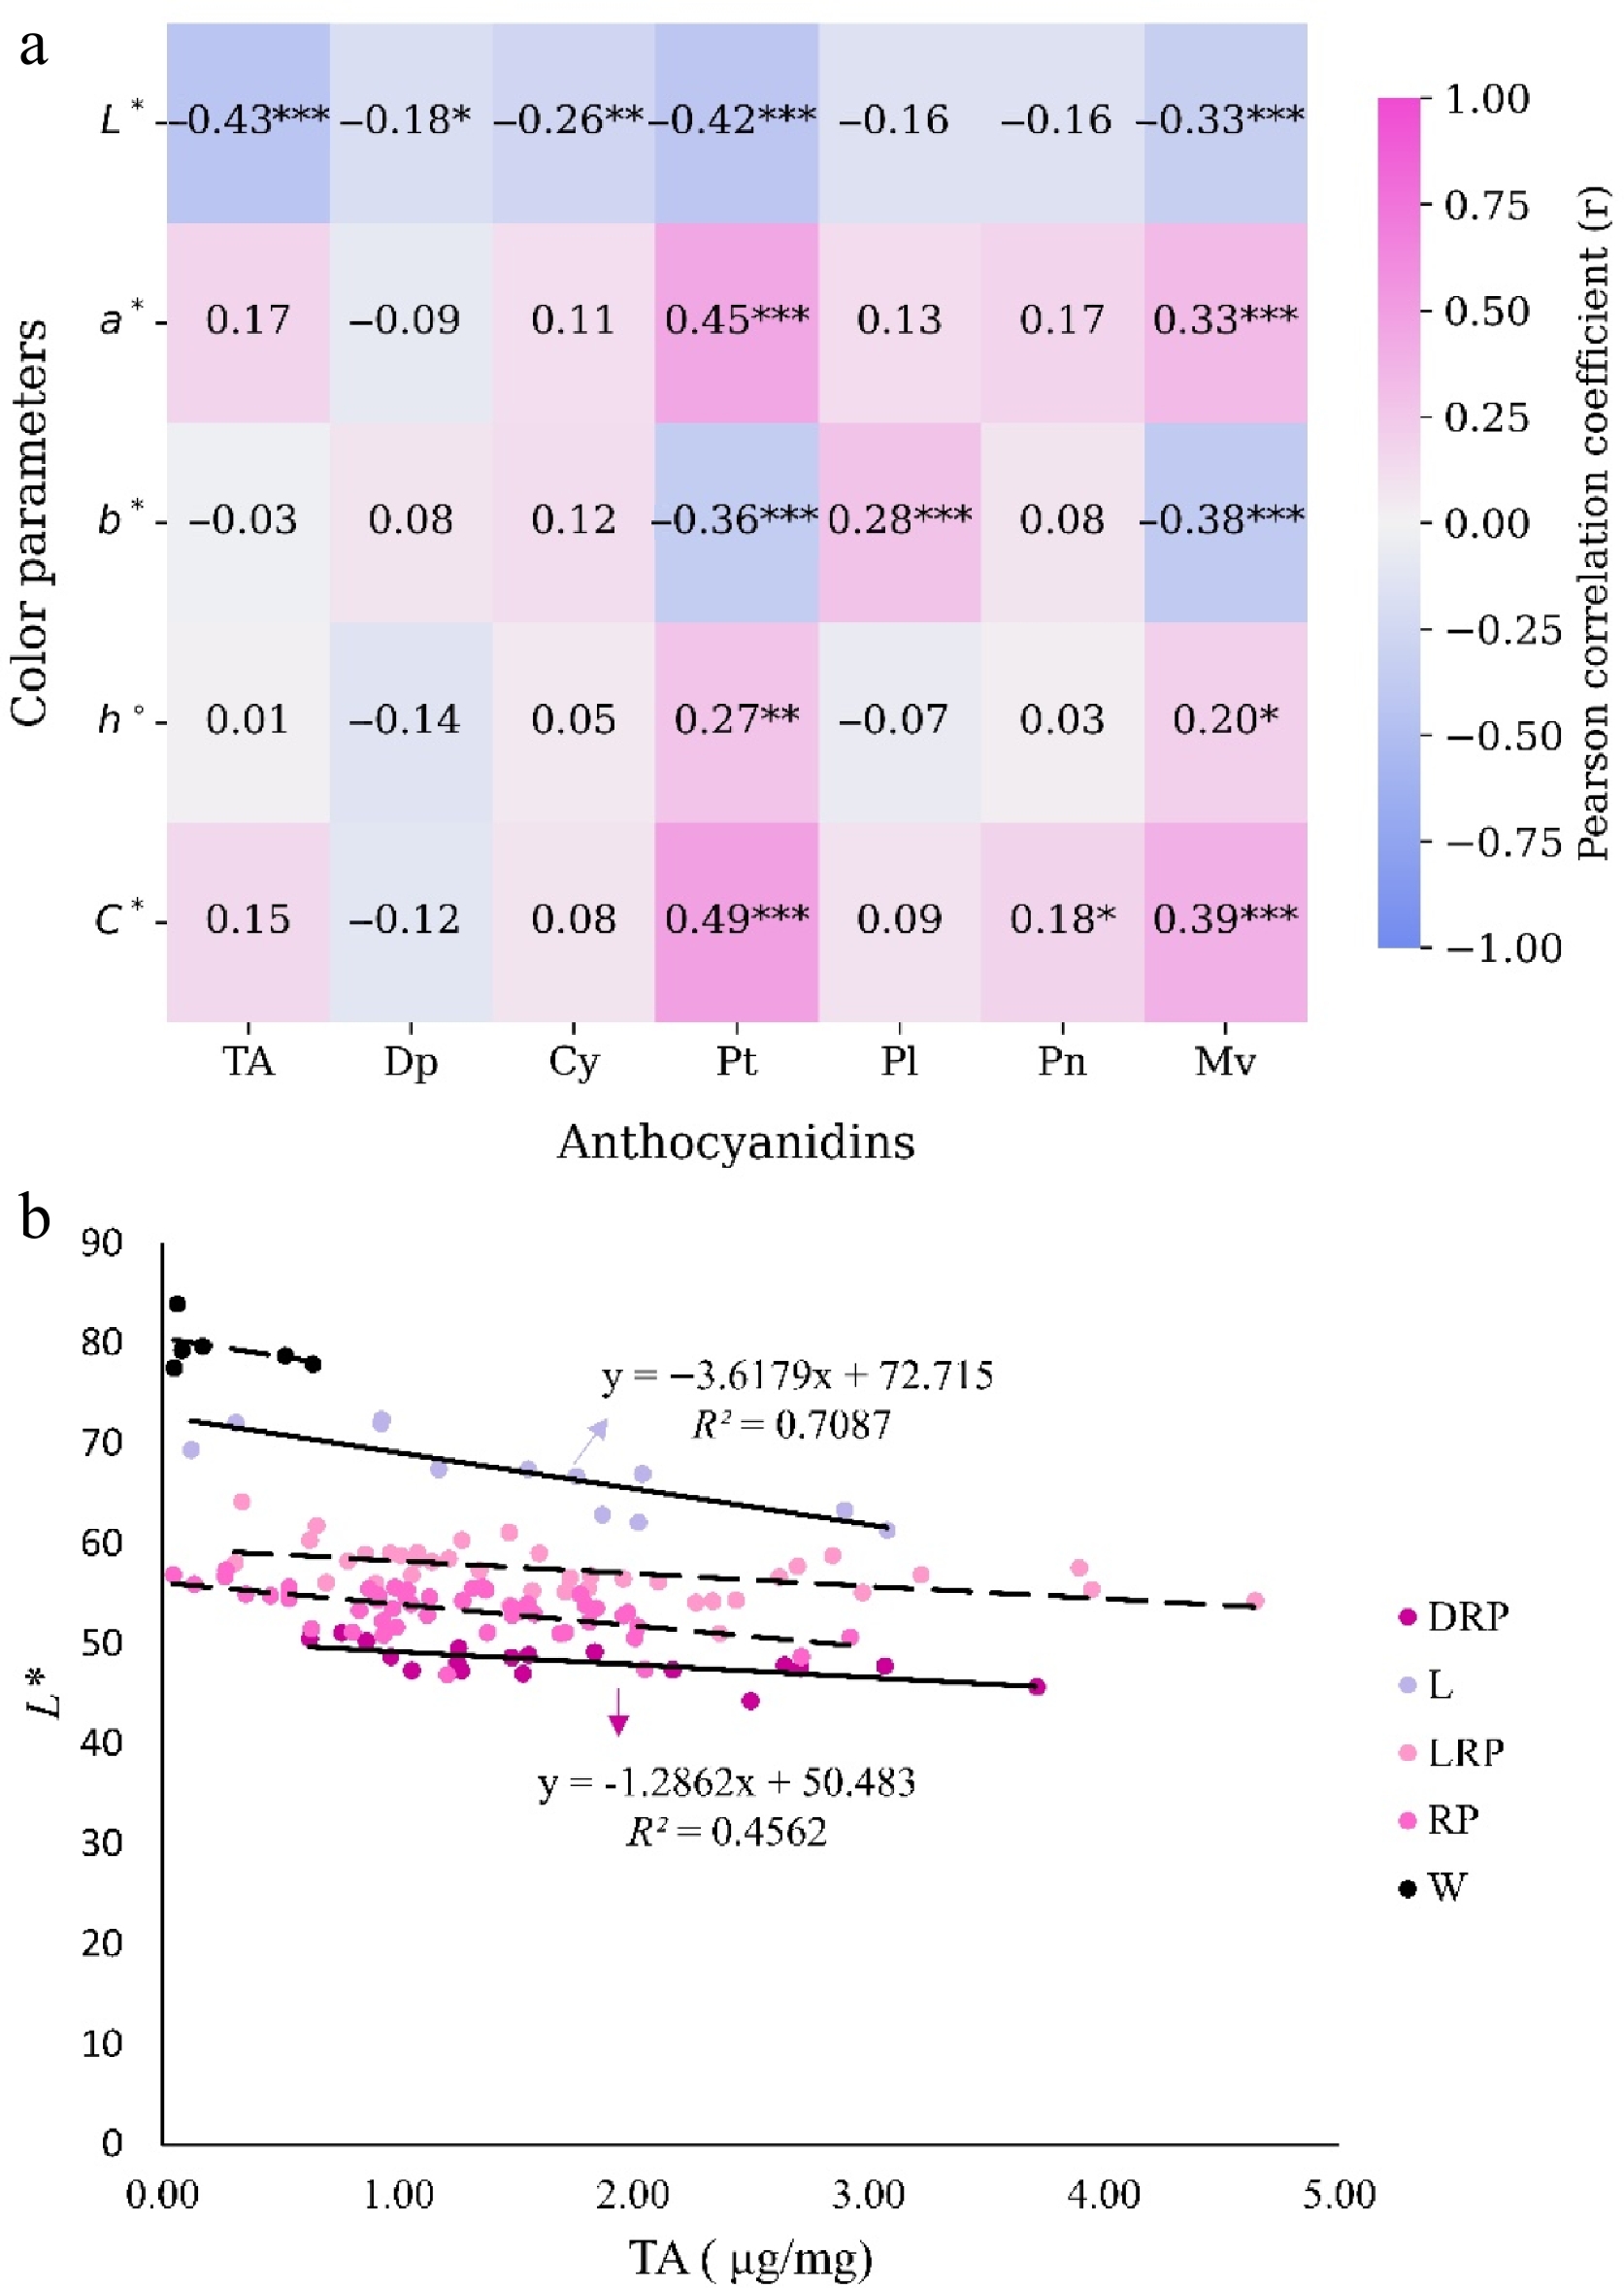
Figure 6.
Relationships between colorimetric parameters and anthocyanidin profiles in Phlox.(a) Heatmap of Pearson correlation coefficients (r) between color coordinates and both total and individual anthocyanidins. Statistical significance is denoted as follows: * p < 0.05, ** p < 0.01, *** p < 0.001. (b) The relationship between total anthocyanidins (TA; µg anthocyanidins/mg tissue) and lightness (L*) across five color clusters. Fitted regression lines and corresponding equations are displayed exclusively for clusters exhibiting a coefficient of determination (R2) > 0.35. Abbreviations: Delphinidin (Dp), cyanidin (Cy), petunidin (Pt), pelargonidin (Pl), peonidin (Pn), malvidin (Mv), dark red-purple (DRP), lavender (L), light red-purple (LRP), red-purple (RP), and white (W).
Stepwise multiple regression analyses were performed to model the relationships between colorimetric parameters and individual anthocyanidin contents. Pelargonidin and peonidin were excluded from this analysis because they were detected in only 2.29% and 16.79% of the samples, respectively. The results of the statistical analyses aree summarized in Table 3. All models were statistically significant and explained moderate proportions of the variance, with adjusted R2 values ranging from 0.2914 to 0.4347. Across all color coordinates, delphinidin and petunidin emerged as the primary predictors of phenotypic expression, consistently exhibiting logarithmic relationships with the color variables. L* was negatively associated with the logarithmic terms of both delphinidin and petunidin, along with a linear effect from malvidin (adjusted R2 = 0.3835). The a* and C* values were positively associated with the logarithmic accumulation of both delphinidin and petunidin. The models for b* and h° revealed more complex mathematical dynamics. A decrease in b* exhibited the highest predictive power (adjusted R2 = 0.4347), driven by the logarithmic terms of delphinidin and petunidin, coupled with a specific quadratic relationship with malvidin. The value of h° was predicted by the logarithmic accumulation of petunidin combined with both linear and logarithmic delphinidin effects.
Table 3. Stepwise multiple regression models using anthocyanidin content to explain variation in colorimetric parameters.
Colorimetric parameter Regression modela Adjusted R2 L* 51.9436 – 1.9546 ln(Dp) – 0.6396 ln(Pt) – 3.9944(Mv) 0.3835 a* 37.3184 + 1.9858 ln(Dp) + 1.9069 ln(Pt) 0.2914 b* –20.1089 – 0.4883 ln(Pt) – 1.3552 ln(Dp) – 8.8197(Mv) + 4.0881(Mv2) 0.4347 C* 42.3357 + 1.6979 ln(Pt) + 1.1835 ln(Dp) 0.3057 h° 348.2936 + 12.6019 ln(Dp) + 2.6938 ln(Pt) – 10.3791(Dp) 0.3637 (a) Delphinidin (Dp), petunidin (Pt), and malvidin (Mv). -
Phlox exhibits a distinct set of flower colors that contribute in large measure to the species' horticultural importance in gardening. In this study, Tomato Analyzer successfully quantified color traits by generating numerical L*, a*, and b* values for 89 Phlox accessions, which were used for cluster analysis and revealed ten different color clusters. Although ten clusters were unevenly represented by different sample sizes, they captured the major variation in lightness and chromaticity. The first hierarchical split (N1 and N2) was largely driven by a*, indicating that red-associated pigments are the primary factor contributing to the main color divergence in this Phlox collection. Negative a* and positive b* in white flowers likely result from background effects during scanning, as also reported in previous studies[36,37]. Flowers within the clade N2 were broadly categorized as 'pink' according to the visual assessment, although the quantitative colorimetric analyses identified several statistically distinct clusters varying in the contributions of red and purple. The discrepancies highlight the limitations of human-based color naming in floriculture, which can be challenging in describing specific colorimetric parameters, including L* and C*. In the correlation analysis across Phlox color clusters, L* and C* were positively correlated in the W cluster but negatively correlated in the RP, DRP, LRP, and L clusters. This pattern aligns with previous research showing negative L* and C* relationships in red, orange, and purple flowers[39], and positive correlations in white and yellow flowers[40]. Overall, the color clusters defined in this study provide a standardized framework for describing flower color variations in Phlox, offering greater precision and consistency than traditional visual classification systems such as the Royal Horticultural Society color chart.
Analysis of anthocyanidin profiles revealed that flower color in Phlox is determined by complex interactions among different anthocyanidins. The PR and R clusters had the highest total anthocyanidin levels. This aligns with previous findings that dark red and blue flowers have higher anthocyanidin levels compared with others[38]. Total anthocyanidin content was not the determinant for major color difference, as samples with similar total anthocyanidin levels and identical anthocyanidin profiles displayed different colors (Fig. 5). Total anthocyanins are commonly used to explain color intensity, which is closely linked to L* and C*[39,40]. The linear regression analysis revealed a significant negative relationship between L* and total anthocyanidin content, supporting the typical negative association between pigment accumulation and color lightness. In Phlox, this relationship was particularly strong in the L cluster, where total anthocyanidins accounted for 70.87% of the variation in L*. A similar negative correlation between L* and total anthocyanin content has been reported in nonblotched tree peony flowers[36]. Notably, the correlation between total anthocyanidins and L* was more pronounced in the L cluster than in other clusters. One possible explanation is that the lavender phlox flowers exhibit relatively uniform pigmentation in the whole flower, with minimal color variation between the central eye region and the petals. This may minimize the influence of localized pigment accumulation on total anthocyanidin measurements and improve the predictive value of anthocyanidin content for flower lightness. In contrast, the pronounced eye patterning observed in other color clusters may contribute to greater spatial variation in pigmentation, thereby weakening the relationship between total anthocyanidin content and color lightness.
Stepwise multiple regression analyses revealed that delphinidin and petunidin were the primary drivers of all colorimetric variation, whereas malvidin contributed specifically to variation in lightness and blueness. These three anthocyanidins share significant structural similarities and originate from the same flavonoid 3',5'-hydroxylase (F3'5'H) branch of the anthocyanin biosynthetic pathway[41], highlighting their coordinating role in regulating the expression of flower color. Logarithmic petunidin was positively correlated with a* and negatively correlated with b*, supporting its role in modulating hues along the red and blue axes. Therefore, variations in petunidin concentration are likely to affect purple coloration. This may be supported by a study of anthocyanin composition in Hibiscus syriacus, in which a petunidin derivative (petunidin-3-O-glucoside) showed a significant negative correlation with b* in purple-flowered H. syriacus accessions[42]. Besides petunidin, b* was also related to delphinidin and malvidin in Phlox, shifting the hue toward blue tones. This observation is partially aligned with previous studies in Rhododendron, where b* was influenced by derivatives of delphinidin and malvidin[43]. The predictive models also indicated that the relationship between individual anthocyanidins and visual color in Phlox is highly nonlinear. The consistent selection of logarithmic terms for delphinidin and petunidin across all color coordinates suggests a biological saturation effect, whereby initial increases in pigment concentration produce substantial changes in visual color, but additional pigment accumulation results in progressively smaller color shifts. Furthermore, the quadratic term selected for malvidin in the b* model suggests that its effect on flower color may vary across concentration ranges rather than remaining constant throughout pigment accumulation.
Despite the significant associations identified by the regression models, anthocyanidin composition only partially explained the variation in colorimetric parameters. This indicated that anthocyanidins play an important, but not exclusive, role in shaping petal color variation in Phlox. This conclusion was further supported by comparisons among accessions with contrasting pigment profiles and flower colors. For example, flowers from P. divaricata (PZ11-008 p1) and P. divaricata (PZ10-100 p1) exhibited similar chromatographic patterns but displayed markedly different flower hues, whereas flowers with visually similar colors had distinct anthocyanidin compositions, as seen in P. amoena (PZ12-057 p2) and P. carolina (PZ12-047 p2) (Fig. 5). These observations suggested that floral color expression in Phlox involves additional regulatory and biochemical factors beyond anthocyanidin composition alone. At the biochemical level, flower coloration is a multifactorial trait influenced by the pigment composition, pigment concentration, cellular environment, and optical properties of petal tissues. Anthocyanidins are synthesized in the endoplasmic reticulum and accumulate in the vacuoles, where acidic conditions produce visible coloration[44]. Vacuolar pH strongly influences hue by altering the chromophores' structure[45], whereas co-pigmentation with sugars, flavonoids, and metal ions stabilizes anthocyanins and contributes to shifts toward blue hues[45]. Compartmentalization of pigments into anthocyanoplasts or anthocyanic vacuolar inclusions further modulates the local intensity[46,47]. One limitation of the present study is that the analyses were primarily focused on the composition and concentration of anthocyanidin. In contrast, other biochemical and physiological factors associated with flower coloration were not evaluated. Carotenoids, vacuolar pH, copigmentation effects, and metal ion interactions may also contribute to variations in flower color and could partially explain the relatively weak correlations observed between anthocyanidins and certain colorimetric parameters. Therefore, anthocyanidin content alone may not fully account for the observed variation in flower color among Phlox accessions. Future studies integrating pigment profiling with physiological and biochemical analyses will be important for developing a more comprehensive understanding of the mechanisms underlying the variation in and regulation of flower color in Phlox.
The distribution of individual anthocyanidins among the 17 Phlox species followed a clear pattern. Cyanidin and delphinidin were predominant and were identified in all studied Phlox accessions. Petunidin and malvidin co-occurred in most accessions within the Phlox and Annuae sections. The strong correlation is consistent with their shared biosynthetic origin, with delphinidin as a common precursor[41]. Pelargonidin was detected only in P. paniculata. This is consistent with this species' breeding history for novel color[1,2]. These anthocyanidin profiles among Phlox species provided a snapshot of anthocyanidin's diversity in Phlox and supported broader trends reported for the Polemoniaceae family, where delphinidin and cyanidin predominate but pelargonidin is rare[48]. Six major anthocyanidins are found across Phlox species, generating diverse red, blue, and crimson hues, depending on their combinations, with pelargonidin rarely and largely restricted to tropical, hummingbird-pollinated species[16,49−51].
Most studied Phlox accessions fell within the red-purple color clusters, suggesting that this may represent the ancestral or wild-type color state for many eastern US species[1]. Yellow flowers were found only in P. drummondii, with rare reports in P. roemeriana and P. nana[1]. The most vivid red colors were also mostly restricted to P. drummondii, although some cultivated P. paniculata and P. subulata have been bred to produce similar colors[1]. Whether the red hues seen in P. paniculata arose through natural variation or hybridization with P. drummondii remains unclear. Lavender flowers spanned distinct taxonomic subsections, suggesting that this color trait may have evolved independently. However, additional sampling will be needed to confirm whether these color groups are associated with evolutionary lineages. Variation in flower color within Phlox has driven these flowers' long-standing popularity in ornamental horticulture and fueled extensive breeding over the past two centuries. The most intensively bred species, P. drummondii, P. paniculata, and P. subulata, display the greatest color diversity, reflecting their long-term selection and hybridization. Applying similar breeding efforts to underutilized species could generate novel flower colors and anthocyanidin profiles, expanding ornamental diversity.
-
Integrating standardized digital imaging with colorimetry and anthocyanidin profiling offers a robust framework for dissecting the diversity of flower color in Phlox. Through use of digital imaging and quantitative colorimetric cluster analysis, the studied Phlox accessions were assigned to 10 color clusters, with most accessions grouped within the red-purple hue groups. This confirmed that red-purple represents the most common color state among Phlox. Anthocyanidin profiling of the Phlox collection revealed extensive variation in floral pigmentation. The relationship between anthocyanidin composition and perceived color was nonlinear. Cyanidin and delphinidin combination generated diverse red-purple hues, with their relative abundance determining whether the colors were pale, vivid, or dark. Increased pelargonidin concentration shifted red-purple towards warmer tones, consistent with the association of pelargonidin with bright orange-red pigmentation, as observed in two P. paniculata accessions (in the LR and PR clusters). The relationships between multiple anthocyanidins and flower color were predominantly nonlinear, suggesting that the variation in flower color in Phlox is influenced more by the relative abundance of specific anthocyanidins than by total anthocyanidin concentration. Anthocyanidin profiling also uncovered species-level patterns with potential taxonomic and breeding significance. For example, pelargonidin is generally less abundant than other major anthocyanidins but is strongly associated with orange-red pigmentation. Therefore, P. paniculata accessions OPGC 3374 and OPGC 3997, which accumulated relatively high levels of pelargonidin, represent valuable germplasm for broadening the ornamental color palette of Phlox. In summary, this study establishes the latest comprehensive anthocyanidin profiles of the evaluated Phlox collection and provides a valuable foundation for breeding cultivars with distinct and commercially valuable floral traits.
This research was supported by the Department of Horticulture and Crop Science, The Ohio State University, and by the USDA – Agricultural Research Service Floriculture and Nursery Research Initiative in support of the Ornamental Plant Germplasm Center (OPGC). Additional support was provided by state and federal funds appropriated to the Ohio Agricultural Research and Development Center. We would like to acknowledge Drs. Ann Chanon, Lisa Dunlap, and Esther van der Knaap for their help with chromatographic analyses, anthocyanin extraction, and the use of Tomato Analyzer. We also would like to thank the OPGC staff for providing assistance with plant maintenance.
-
The authors confirm contributions to the paper as follows: study conception and design: Bohorquez-Restrepo A, Jourdan P, Jones ML, Scheerens J; data collection, analysis and interpretation of the results: Bohorquez-Restrepo A; draft manuscript preparation: Song J, Ma Y. All authors reviewed the results and approved the final version of the manuscript.
-
The data generated or analyzed during this study are included in this published article and its supplementary information files.
-
The authors declare that they have no conflict of interest.
-
This accompanies this paper online at: https://doi.org/10.48130/opr-0026-0020.
-
# Authors contributed equally: Andres Bohorquez-Restrepo, Jinjin Song
- Supplementary Table S1 Phlox accessions with assigned species according to the germplasm resources information network (GRIN).
- Supplementary Table S2 Concentration of individual and total anthocyanidins of 131 Phlox samples, measured by high-performance liquid chromatography (HPLC).
- Supplementary Fig. S1 Distribution of anthocyanidins in Phlox sections.
- Copyright: © 2026 by the author(s). Published by Maximum Academic Press, Fayetteville, GA. This article is an open access article distributed under Creative Commons Attribution License (CC BY 4.0), visit https://creativecommons.org/licenses/by/4.0/.
-
About this article
Cite this article
Bohorquez-Restrepo A, Song J, Jones ML, Jourdan P, Scheerens J, et al. 2026. Quantitative colorimetric and chemical characterization of flower color variation in 89 accessions across 17 Phlox species. Ornamental Plant Research 6: e031 doi: 10.48130/opr-0026-0020 

Quantitative colorimetric and chemical characterization of flower color variation in 89 accessions across 17 Phlox species
- Received: 25 March 2026
- Revised: 01 July 2026
- Accepted: 03 July 2026
- Published online: 10 September 2026
Abstract: Flower color is a key determinant of the aesthetic and commercial value of ornamental plants. However, the biological mechanisms underlying flower color are complex, and quantifying color variation remains challenging. Phlox is a horticulturally important genus with diverse floral colors, yet its color variation and underlying pigment composition remain poorly characterized. In this study, digital imaging coupled with Tomato Analyzer software was used to quantitatively characterize variation in corolla color, followed by hierarchical clustering to classify 89 Phlox accessions into 10 color groups. Red-purple was the most represented color, occurring across the Annuae, Occidentales, and Phlox sections. Anthocyanidin profiling identified six anthocyanidins across the collection, with delphinidin and cyanidin being the most prevalent. Petunidin and malvidin frequently co-occurred, whereas the presence of pelargonidin was associated with distinct shifts in flower color. Total anthocyanidin is a key but not the sole determinant of color lightness, and specific hues are partially determined by the anthocyanidin profiles. Correlation analyses of anthocyanidin and colorimetric parameters revealed that delphinidin and petunidin contribute to variations in green/red (a*), blue/yellow (b*), lightness (L*), chroma (C*), and identity hue (h°). This study presents an extensive digital and biochemical survey of flower color variation in 17 Phlox species, providing insights into the relationships between anthocyanidin profiles and color phenotypes, and offering a valuable resource for future Phlox breeding efforts.
-
Key words:
- Anthocyanidin /
- Colorimetric parameters /
- Digital imaging /
- Flower color /
- Phlox