


-
Plant hormones serve as core endogenous signalling molecules regulating plants' growth, development, and responses to environmental stresses throughout the entire plant life cycle[1]. With a deepening understanding of their mechanisms, the exogenous application of plant hormones has become a key technology in modern agricultural production[2]. Auxin and gibberellin are commonly used to promote fruit enlargement and increase yield[3], whereas abscisic acid (ABA) and ethylene are closely associated with drought resistance and fruit ripening, respectively[4]. Traditional hormone application methods, such as foliar spraying and root drenching, largely rely on farmers' experience and fixed schedules. They lack real-time, precise sensing of the crop's actual physiological state. This blind application approach easily leads to inaccuracies in the concentration, timing, and application sites, resulting in either excessive or insufficient hormone use[5]. Therefore, applying effective hormones at the appropriate time, dosage, and location represents a critical scientific challenge for sustainable agricultural development. Although traditional liquid chromatography–mass spectrometry (LC-MS) detection offers precision, it is time-consuming, labor-intensive, costly, and destructive, making it impractical for real-time diagnosis and decision-making in field conditions[6]. Similarly, conventional plant phenotyping tools (e.g., chlorophyll meters, leaf area meters) typically perform point measurements with limited information dimensions, making it difficult to capture complex, early-stage, hormone-induced systemic physiological changes[7]. To achieve precise management and efficient utilization of plant hormones, developing a technology system capable of rapid, nondestructive, and high-throughput analysis of the internal physiological state of plants is crucial. Currently, mainstream nondestructive detection technologies used in plant phenotyping and physiological monitoring primarily rely on interactions between light and matter. These techniques exhibit a clear developmental trajectory, progressing from surface morphology to internal chemistry, and from single-point measurements to spatial imaging. Among these, visible-light imaging excels at analyzing external phenotypic traits, such as color and shape, by capturing reflected light. However, it struggles to reveal internal physiological and biochemical changes[8]. Near-infrared (NIR) spectroscopy technology enables quantitative analyses of internal components such as moisture, sugars, and proteins by exploiting information on molecular vibrations, yet it sacrifices critical details on spatial distribution[9]. These two technologies represent the dimensions of visible morphology and measurable composition, respectively, but neither can simultaneously capture complete spatial and spectral information[10].
It is against this backdrop that hyperspectral imaging technology, with its unique integrated spectral-spatial data acquisition mode, offers a revolutionary tool for addressing these challenges[11,12]. The differences in the principles and system configurations of these three optical sensing technologies clearly reflect their technical characteristics (Fig. 1). Unlike visible-light imaging and NIR spectroscopy, hyperspectral imaging can simultaneously capture both two-dimensional (2D) spatial and one-dimensional (1D) continuous spectral information of a target, generating data cubes that contain vast amounts of information. Additionally, a detailed comparison of the core parameters, detection capabilities, and application characteristics of the three technologies, as shown in Table 1, clearly demonstrates the technical advantages of hyperspectral imaging. This capability enables the technology not only to assess traditional external phenotypes but also to nondestructively visualize and quantify the spatially heterogeneous distribution of key internal physiological and biochemical parameters in plants (e.g., pigments, moisture, nitrogen)[13,14].
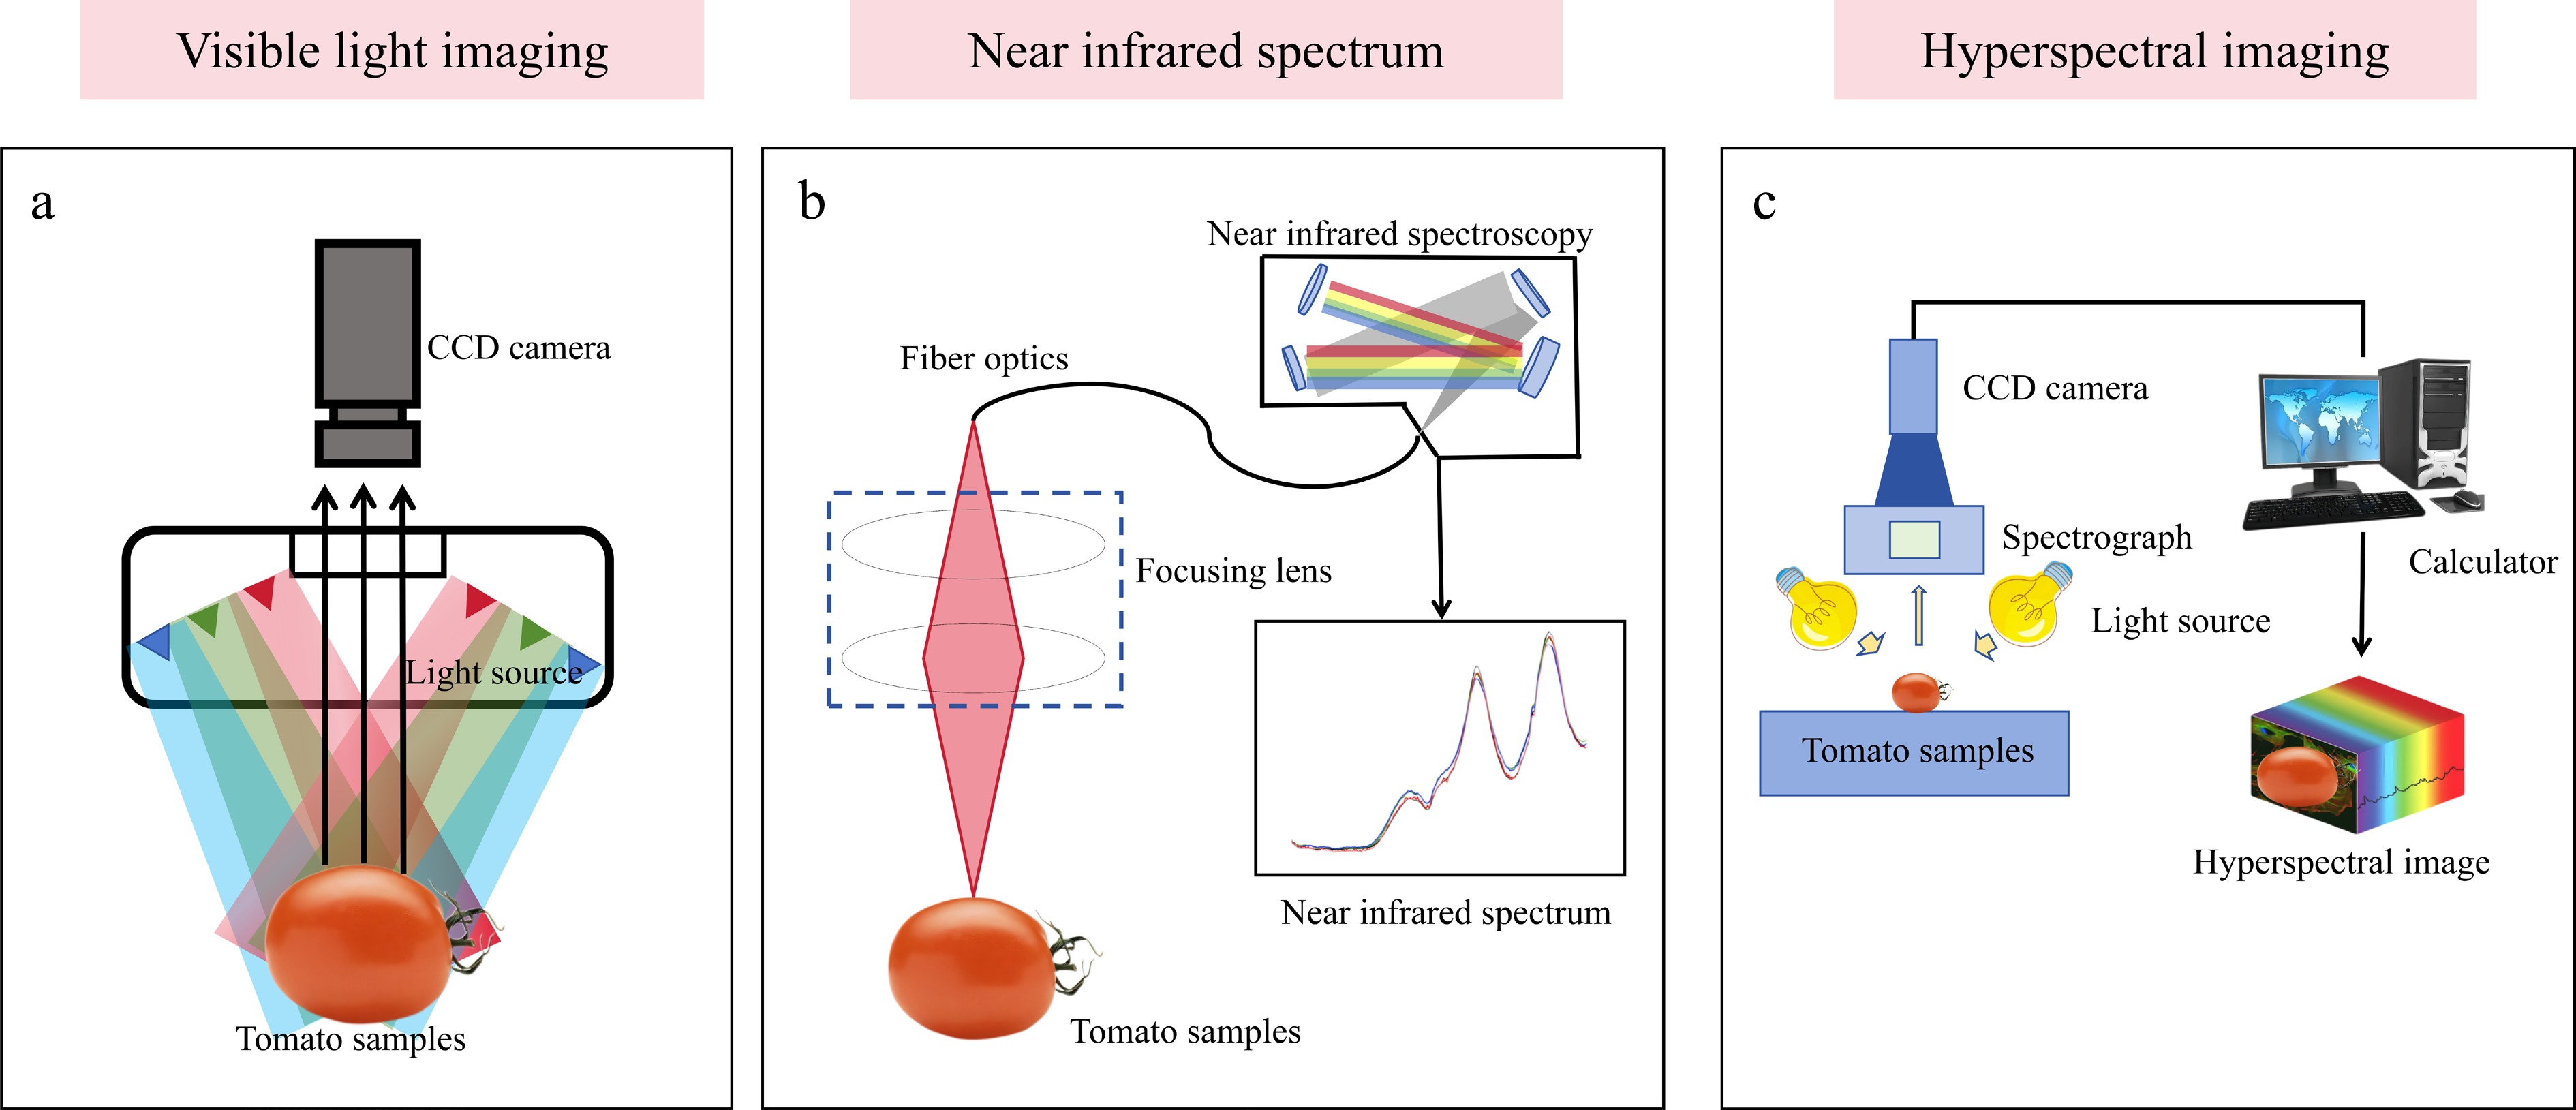
Figure 1.
Principle and system configuration of three optical sensing techniques: (a) Visible light imaging, (b) near-infrared spectroscopy, and (c) hyperspectral imaging.
Table 1. Comparative analysis of visible light imaging, near-infrared spectroscopy, and hyperspectral imaging technologies.
Technology type Visible light imaging Near-infrared spectroscopy Hyperspectral imaging Equipment composition Charge-coupled device (CCD) camera, light source, sample Optical fiber, focusing lens, near-infrared spectrometer, sample CCD camera, spectrometer, light source, sample, computer Working principle Collect visible light reflected by objects (400−700 nm) Collect spectral information of objects in the near-infrared wavelength range
(700−2,500 nm)Simultaneously acquire spatial imagery and continuous spectral information to form a data cube Testing content Color, shape, surface defects Chemical composition (such as moisture content, sugar content, acidity) Image information combining spatial distribution and chemical composition Spatial resolution High (spatial information only) None (single-point or small-area measurement) High (spatial + spectral information) Spectral resolution Low (red–green–blue, three channels) High (continuous spectrum) Extremely high (hundreds of contiguous spectral bands) Data dimension 2D (spatial information + color information) 1D (single-point spectral information + chemical information) 3D (spatial information + spectral information + chemical imaging information) Output results Color photographs depicting the sample's appearance, color, texture, defects, and other surface characteristics. Single spectral curve reflecting the internal chemical composition of the sample (moisture, protein, etc.) Hyperspectral images + spectral curves for each pixel, simultaneously revealing the spatial distribution of surface defects and internal composition Primary application scenarios Visual inspection, sorting, size grading Rapid component detection, qualitative and quantitative analysis Fine-grained classification, detection of internal defects, visualization of the material distribution Advantages Low cost, simple operation, and strong real-time capability Capable of detecting internal components, nondestructive, fast Comprehensive information, simultaneous analysis of spatial and chemical properties, high sensitivity Disadvantages Unable to detect internal or chemical composition No spatial distribution information; requires contact or close-range measurement High cost, complex data processing, and slow acquisition speed Ref. [15,16] [17−19] [20−22] -
A hyperspectral imaging system is a precision-integrated optoelectronic platform designed to simultaneously acquire both 2D spatial information and 1D spectral information from a target; the resulting output is referred to as a data cube[23,24]. The system is designed around the core process of high-fidelity acquisition, dispersion, and digitization of optical signals. The various functional modules coordinate along the optical path; their typical configurations and operating principles are shown in Fig. 2. The system's workflow begins with the illumination unit. This unit provides stable, uniform light radiation within the appropriate spectral range, serving as the physical foundation for ensuring the consistency of subsequent spectral data and the signal-to-noise ratio[25]. After interacting with the sample, the reflected or transmitted light, which carries information about the sample's chemical composition and physical structure, enters the optical acquisition module[26]. This module typically consists of an objective lens and an entrance slit: the objective lens collects light from the sample and focuses it onto the slit plane, whereas the slit acts as a spatial filter, allowing only light from a linear region to pass through, thereby defining the field of view for each image[27]. The light is then collimated by a collimating lens[28,29]. Subsequently, the parallel beam enters the system's core component, namely the beam splitter. This device utilizes the principle of dispersion to spatially spread the beam by wavelength, separating light of different wavelengths horizontally and achieving an optical encoding in which the 1D spatial position corresponds to 1D spectral information. The dispersed beam is projected onto a 2D detector[30], which simultaneously records information in two dimensions: one dimension corresponds to the spatial position along the sample line, and the other to the spectral band. This allows the complete spectral information of all pixels along a single line to be acquired in a single exposure. To obtain a complete data cube covering the entire sample area, the system must also be equipped with a scanning and control unit. This unit precisely controls the movement of the sample stage or the scanning of the camera itself, causing the imaging line to continuously traverse the sample's surface and collect data line by line; simultaneously, it synchronously triggers the detector for image acquisition and undertakes calibration, storage, and preprocessing of the raw data, ultimately synthesizing a three-dimensional (3D) data cube containing 2D spatial information and 1D spectral information[31]. Depending on the scanning method and spectroscopic components, hyperspectral imaging systems can be classified into various modes, including point scanning, pushbroom (line scanning), stencil (area scanning), and snapshot modes, each with distinct system configurations and application scenarios (Table 2). Among these, pushbroom systems, which combine high spatial and spectral resolution, are currently the most prevalent configuration in agricultural and plant phenotyping research.
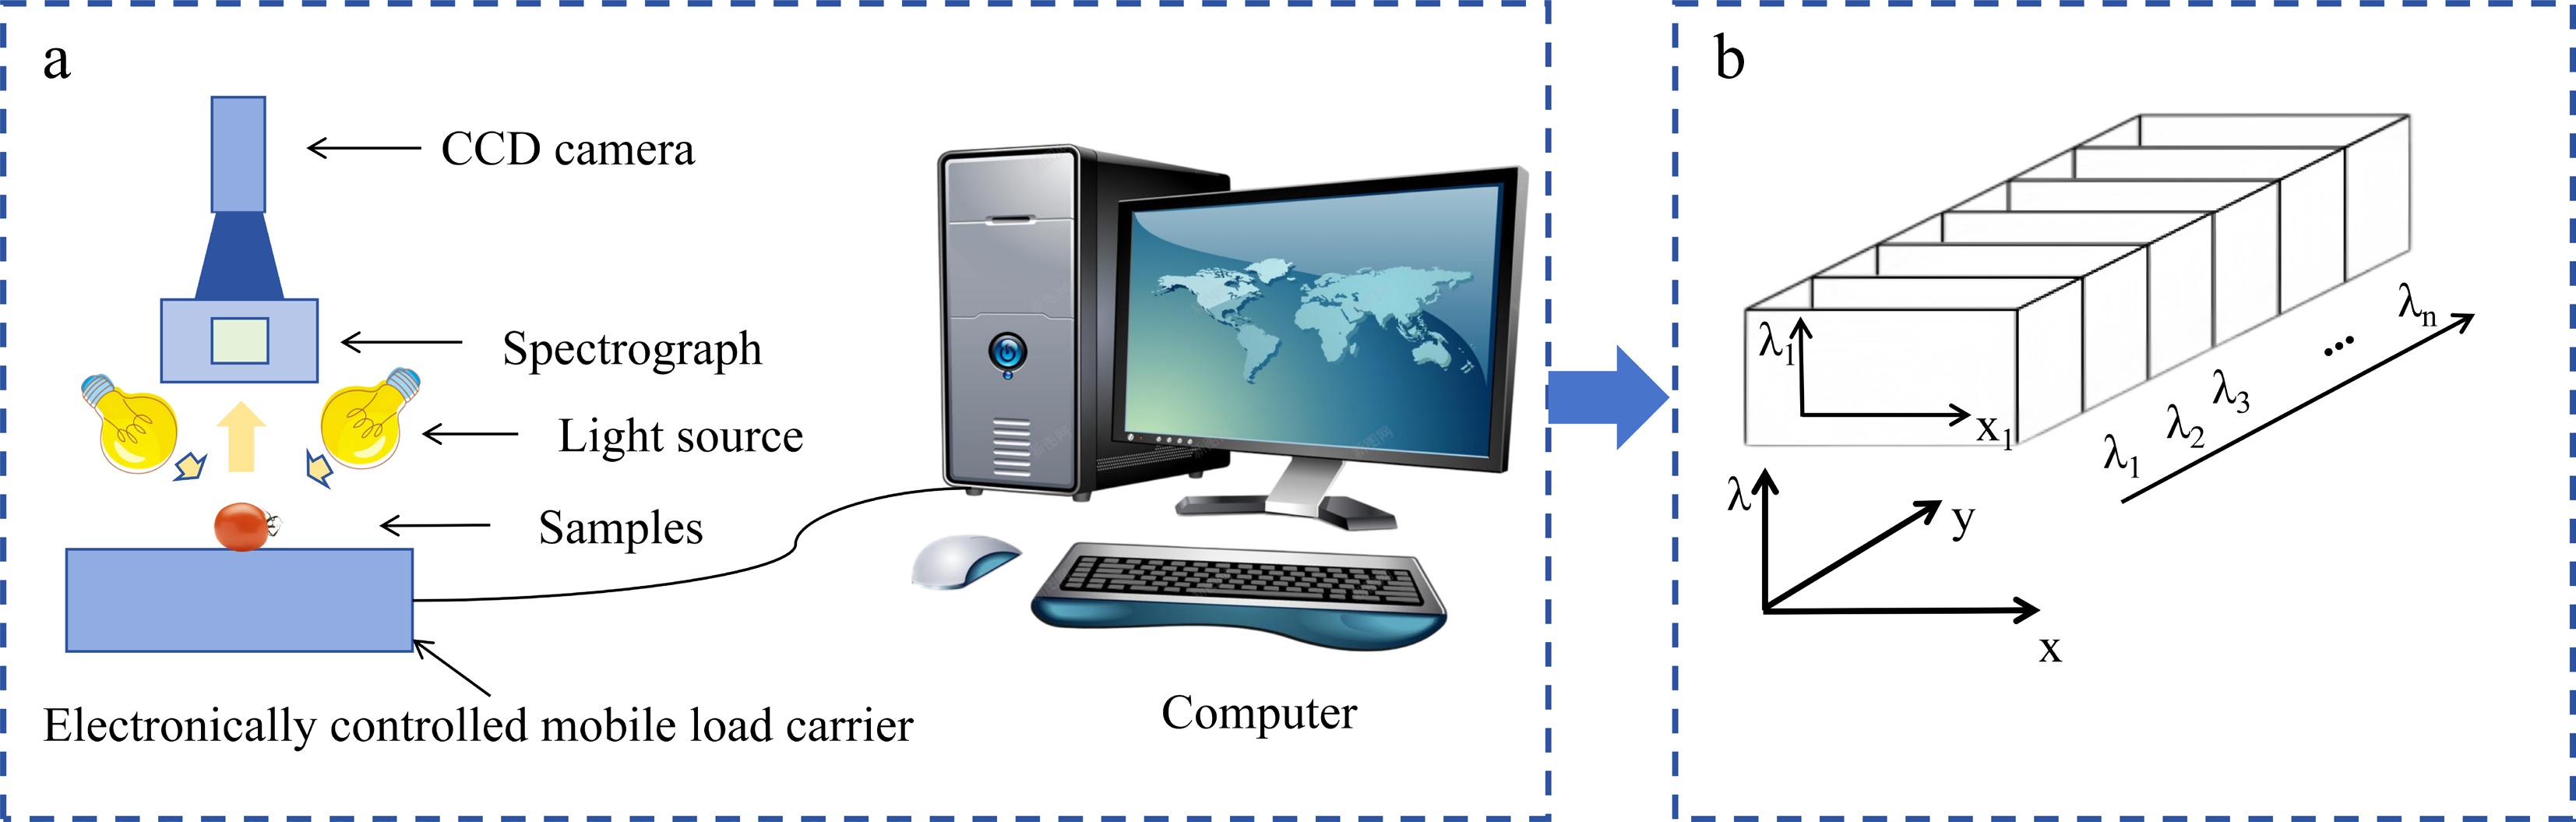
Figure 2.
Schematic diagram of the working principle of a hyperspectral imaging system. (a) Schematic diagram of system optical path and components. (b) Schematic diagram of hyperspectral data cube.
Table 2. Primary hyperspectral imaging modes and characteristics of their system's configuration.
Imaging mode Scanning method Core optical components System configuration and data acquisition characteristics Typical application scenarios Ref. Spot scanning Spot scanning Single-point spectrometer Spectra are measured point by point using a 2D translation stage, then synthesized into images. The system's structure is relatively simple, but data acquisition is extremely slow, with a high signal-to-noise ratio. Laboratory-based precision spectral analysis of stationary samples, microscopic hyperspectral imaging [32,33] Pushbroom Line scan Grating/prism Spectral data are acquired line by line through continuous movement of the sample or camera; featuring high spatial resolution and excellent spectral resolution, this is the most popular mode. Aerial remote sensing, laboratory precision testing, agricultural product sorting lines [34,35] Gazing Surface scanning (spectral scanning) Tunable filter The camera remains stationary, capturing full-frame images across different wavelengths by rapidly switching filters; no moving parts are required, but spectral continuity is limited. Real-time dynamic monitoring, medical diagnosis [36,37] Snapshot-like Instantaneous imaging Image slicer/coding aperture Capture the complete spectral cube of the entire scene in a single exposure; no moving parts; suitable for transient processes, but spatial or spectral resolution may require
trade-offs.Biomedical imaging, industrial process monitoring [38,39] The physical and bionic foundations of hyperspectral imaging
-
Hyperspectral imaging surpasses traditional red–green–blue (RGB) vision by continuously capturing and analyzing the spectral fingerprints of the materials. The human eye integrates responses to broadband RGB light through only three types of photoreceptor cells, forming macroscopic color perception while losing the rich, fine spectral characteristics within materials[40]. Hyperspectral technology fundamentally extends spectral vision: it divides the spectrum into hundreds of continuous narrow bands spanning visible light to NIR and even shortwave infrared. This enables dense sampling of reflected spectra, elevating each pixel's information from the three RGB dimensions to hundreds of spectral dimensions[41,42]. This not only preserves color information that is recognizable to the human eye but, more importantly, reveals the characteristic absorption and reflection spectral bands generated by molecular chemical bond vibrations and electronic transitions – phenomena that are invisible to the naked eye[43].
Hyperspectral imaging offers significant advantages for detecting opaque biological media, such as plants, by capturing the diffuse reflectance spectral signals generated by complex interactions between light and tissue[44]. As light traverses plant tissue, its propagation path is modulated by multiple optical properties, including absorption, scattering, and anisotropy[45]. Hyperspectral systems record not only simple color images but also continuous, high-dimensional spectral responses at each pixel. This spectral fingerprint comprehensively reflects information spanning multiple physiological structures and biochemical components, from the epidermal wax layer to mesophyll palisade tissue, and from photosynthetic pigment content to water distribution. Based on this physical foundation, hyperspectral imaging sensitively captures plants' multiscale responses to exogenous hormone treatments through spatially visualized representations. These responses encompass both systemic changes, such as photosynthetic efficiency and water metabolism, as well as localized accumulation and structural remodeling of secondary metabolites within different organs or tissues, exhibiting distinct organ specificity and spatial heterogeneity[26]. Because alterations in any physiological or biochemical parameter modulate the local optical properties, forming unique spectral signatures[18], hyperspectral technology transforms the averaged information of traditional point measurements into detailed biochemical maps. By integrating deep learning to mine high-dimensional data cubes, researchers can not only quantitatively reconstruct cross-organ physiological indicators but also dynamically decipher the spatial patterns of hormone action, such as identifying the initial stress sites, tracing metabolite transport pathways, or evaluating differences in tissue sensitivity[27]. This provides unprecedented multidimensional data support and analytical potential for precise diagnostics, from holistic to localized, and from phenomena to mechanisms, as well as for optimizing hormone application strategies tailored to specific growth stages and target organs.
Spectral manifestations of plant hormone responses
-
As core signalling molecules regulating physiological processes such as plants' growth and development, stress responses, and maturation and senescence, plant hormones exert their effects by altering key physiological and biochemical parameters within plants (e.g., pigment content, water status, cell structure), ultimately forming identifiable response patterns in the spectral characteristics[46]. The distinct physiological functions of different hormone types determine the significant specificity of the spectral changes they induce[47]. It should be noted that the plant hormone family comprises numerous members, each playing a vital role in plant life. However, this review focuses on how hyperspectral imaging technology assists in the precise management of exogenous hormone applications. Given the breadth of their applications, the technological maturity of agricultural practice, and the concentration of existing research on hyperspectral-related topics, auxin, gibberellin, ABA, and ethylene are the most representative classes of exogenous regulators. These agents are highly effective and widely applied, and constitute the primary targets in current chemical regulation of crops. Furthermore, the mechanisms linking their physiological effects to spectral responses have been relatively thoroughly studied. Therefore, this section systematically elaborates on the specific spectral response patterns induced by these regulators, revealing the physiological and physical basis for using hyperspectral technology in their monitoring and diagnosis.
Auxin: enhanced NIR scattering dominated by cell elongation and structural relaxation
-
The core function of auxin is to promote cell wall relaxation and cell elongation, rather than directly stimulating cell division or substantially increasing photosynthetic pigments[48]. This physiological process leads to enlarged cell volumes in organs such as leaves and stems, more developed intercellular spaces, and a relative decrease in tissues' structural density. From the perspective of light–matter interactions, these microscopic structural changes significantly alter the tissue's optical properties in the NIR (700−1,300 nm) band. Within this range, plant tissues exhibit weak light absorption, and light propagation is primarily governed by scattering effects. The enlargement of intercellular spaces and the development of aerenchyma structures enhance multiple light scattering at the cell-air interface, resulting in a significant increase in reflectance in the NIR band. Studies indicate that indole-3-acetic acid (IAA)-treated plant leaves exhibit a 10%−25% higher reflectance in the 750−900 nm range compared with controls[49]. Therefore, hyperspectral imaging can indirectly quantify auxin-induced cell elongation effects and teh vigor of organ growth by analyzing the spatial distribution and dynamic changes of reflectance in this band. This technique is particularly suitable for monitoring early responses in auxin-sensitive regions such as apical meristems and young leaves.
Gibberellic acid: visible light to red edge characteristics dominated by pigment synthesis and biomass accumulation
-
Unlike auxin, gibberellin not only promotes cell elongation but also increases biomass significantly by breaking dormancy, stimulating cell division, and enhancing internode elongation, while also upregulating the expression of genes related to chlorophyll synthesis[47,48]. This results in gibberellic acid (GA)-treated plants typically exhibiting an increased leaf area index (LAI) and elevated chlorophyll content, particularly chlorophyll a and b. These changes directly modulate the spectral characteristics of plants in the visible range (400−700 nm) and the red edge region (680−760 nm). Increased chlorophyll content enhances the absorption of blue light (450 nm) and red light (680 nm), leading to reduced reflectance in these bands. Concurrently, the red absorption edge shifts toward longer wavelengths as a result of an elevated chlorophyll concentration. The red shift in the red edge position (REP) and the increase in the red edge slope (i.e., the maximum of the first derivative) have become classic indicators for hyperspectral inversion of chlorophyll content and monitoring the vigor of plant growth[49]. Furthermore, because of the significant increase in biomass (LAI), GA treatment also enhances reflectance in the NIR bands. However, unlike IAA treatment, GA treatment is associated with more pronounced changes in visible light absorption and shifts in red edge parameters. Zhang[49] explicitly noted that the red edge position in rice (Oryza sativa) shifts toward longer wavelengths with increasing chlorophyll content, establishing a core correlation between red edge displacement and chlorophyll concentration[50]. This indirectly validates the logical chain in which elevated chlorophyll levels after GA treatment induce red edge redshifts. Prabhakar[51] also indicated that high reflectance in the NIR region correlates closely with LAI. Vegetation indices combining red edge, blue, and NIR bands are suitable for estimating LAI during the seedling and jointing stages, whereas indices combining the red and NIR bands are applicable during the tillering and heading stages. This provides technical support for large-scale, rapid, and precise monitoring of LAI in rice. Therefore, through the use of hyperspectral data cubes, pigment synthesis indices based on red edge parameters and structural scattering indices based on NIR bands can both be simultaneously extracted. By integrating their spatial distribution patterns, the dominant effects of gibberellin and auxin can be effectively distinguished, or the degree of their synergistic interaction can be evaluated.
Hyperspectral imaging can transcend the general phenomenon of growth promotion, revealing the distinct spectral fingerprints of auxin and gibberellin. In evaluations of auxin treatments to promote cell elongation and improve fruit shape, spatial variations in NIR reflectance should be prioritized. Conversely, when assessing gibberellin treatments targeting dormancy breaking, promotion of tillering, or leaf area expansion, comprehensive monitoring of multiple parameters, including the red edge position, chlorophyll index, and NIR reflectance, is required. By establishing quantitative relationship models linking these specific spectral features to hormone dosage and application timing, hyperspectral imaging provides a direct technical pathway for achieving differentiated, precise diagnosis and efficacy feedback for these two growth promoters.
Abscisic acid: the mechanism of spectral decoupling in stress responses
-
Hyperspectral imaging technology for monitoring ABA essentially involves spatially resolving the downstream physiological programs initiated by ABA that exhibit distinct spectral responses, rather than directly detecting trace ABA molecules[52]. As a core stress signal, ABA alters plants' optical properties through two primary pathways: first, by inducing stomatal closure and ultimately leading to leaf water deficit[53]; second, by inhibiting photosynthesis and potentially triggering photosynthetic pigment degradation. Regarding water status, ABA treatment reduces relative leaf water content, weakening the characteristic absorption of water molecules' O-H bonds in the NIR (970–1,200 nm) and short-wave infrared (1,450–1,940 nm) regions. This increases reflectance in these bands, allowing hyperspectral imaging to spatially map and quantify water status through constructed water indices[37]. Regarding photosystems, ABA's inhibition of Photosystem II (PSII) activity and chlorophyll degradation causes the red edge to shift toward shorter wavelengths, reduces the red edge's slope, and increases reflectance in the green band (550 nm)[54]. The core advantage of hyperspectral imaging lies in its ability to simultaneously extract moisture, red edge, and pigment indices from a single data cube. This enables multidimensional (moisture × photosynthesis) and dynamic (early warning × late damage) precision diagnostics of ABA-mediated stress responses, accurately identifying the initial stress sites and spatial heterogeneity[55]. This provides a foundation for precision stress management based on ABA signalling.
Ethylene: visualizing the spectral dynamics regulating aging and maturation
-
Ethylene drives an irreversible physiological program with spatiotemporal developmental patterns. Hyperspectral imaging allows the analysis of ethylene's effects by capturing the dynamics of spectral markers tightly coupled to this program[56]. Ethylene systematically alters organs' optical properties by activating chlorophyll degradation enzymes and promoting pigment synthesis (e.g., carotenoids). In leaf senescence, this directly causes elevated reflectance at the green peak (550 nm) and a flattening of the red absorption trough (680 nm), along with a blue shift of the most sensitive red edge position. Hyperspectral time-lapse imaging quantifies the rates and spatial patterns of these changes, mapping the aging process. During fruit ripening, chlorophyll degradation synchronizes with carotenoid accumulation, altering spectral profiles in the visible range (500−600 nm)[57]. Hyperspectral imaging enables the construction of specialized indices to nondestructively map the spatial distribution of pigment transformation and ripeness on the fruit's surfaces, assessing ripening uniformity[58]. Thus, hyperspectral technology translates ethylene's physiological effects into spectrally traceable spatiotemporal dynamics, achieving a leap from determining whether effects occur to deciphering how they occur. This provides unique insights for optimizing harvest windows and postharvest treatment strategies[59].
The complexity and dynamism of hormonal effects and enhanced strategies for spectral diagnosis
-
Hyperspectral imaging indirectly assesses hormones' effects by analyzing the spatial distribution of the downstream physiological parameters, yet faces a core challenge: the nonspecificity of spectral responses. Different hormones may induce similar macroscopic physiological phenotypes (e.g., ABA and simple drought both cause water loss and a red edge blue shift; IAA and GA treatments both enhance NIR reflectance), resulting in highly overlapping reflectance spectral signatures that cannot be uniquely correlated to specific hormone molecules[60]. This fundamentally defines hyperspectral technology primarily as a high-resolution diagnostic tool for physiological effects rather than a direct identifier of hormone molecules. To enhance the specificity and reliability of diagnoses, it is essential to move beyond the single dimension of spectral reflectance and adopt a multidimensional information fusion strategy[61]. The detection principles, core parameters, and complementary value of various multimodal sensing technologies that can be integrated with hyperspectral imaging, as shown in Table 3, can provide multidimensional support for the precise diagnosis of hormones' effects[62]. For example, thermal imaging can directly reveal changes in stomatal conductance and transpiration rates, aiding in distinguishing ABA signals from other abiotic stresses causing water deficiency[63]. Chlorophyll fluorescence imaging quantifies the actual photochemical efficiency of PSII, providing crucial evidence to determine whether photosynthetic inhibition stems from ABA or other stress factors. Light detection and ranging (LiDAR) captures detailed 3D canopy structures, quantifies the accumulation patterns of biomass, and assists in distinguishing subtle differences in structural effects between auxin and gibberellin[64]. Finally, all these interpretations must be grounded in rigorous experimental controls that explicitly include hormone treatments to establish reliable causal models of treatment and response[65].
Table 3. Multimodal sensing technologies for enhancing diagnostic specificity of hormonal effects in hyperspectral imaging.
Modal technology Detection principle Key physiological parameters obtained How to address the limitations of
hyperspectral imagingExample application scenarios Thermal imaging Detect infrared radiation (thermal radiation)
emitted from the
surface of objectsCanopy/leaf temperature, used for inversion of stomatal conductance and transpiration rate Directly reflects stomatal behavior. Helps distinguish between ABA-induced stomatal closure and water stress directly caused by soil drought, which may exhibit similar patterns in hyperspectral water indices Precision irrigation decision-making, evaluation of ABA's drought resistance effects[66] Chlorophyll fluorescence imaging Detect the fluorescence
re-emitted by PSIIPhotochemical efficiency (Fv/Fm) and nonphotochemical quenching (NPQ) reflect the real-time functional state of the photosynthetic apparatus Directly detect photosynthetic physiological states. This aids in distinguishing whether the causes of red edge blue shift and pigment changes in the stem from ABA inhibition, light stress, or senescence (ethylene), which may overlap with hyperspectral reflectance features Early warning of stress, mechanistic study of hormones' effects on photosynthesis[67] LiDAR Emit laser pulses and measure the reflection time to generate a
three-dimensional
point cloud.Canopy height, LAI, vertical structural distribution, biomass Provides precise 3D structural quantification. Assists in distinguishing the relative contributions of auxin (primarily altering cell structure) and gibberellin (significantly increasing biomass and LAI) to the effects on
NIR reflectanceCrop growth monitoring, biomass estimation, plant architecture analysis[68] Hyperspectral fluorescence Detection of chlorophyll fluorescence emission in the red to far infrared wavelength range Chlorophyll fluorescence yield under sunlight is closely related to the electron transport chain and carbon assimilation Provides an independent data dimension that is highly sensitive to photosynthetic metabolism and fundamentally different from reflectance spectra Monitor photosynthetic function on a large scale to evaluate the impact of hormones on crops' productivity[69] Gas exchange measurement Measurement of CO2 and H2O flux variations within
a sealed chamberNet photosynthetic rate, transpiration rate, stomatal conductance (direct measurements) Provide ground truth values serving as the gold standard for leaves' physiological functions. Used for calibrating and validating model parameters derived from hyperspectral, thermal imaging, and other inversion techniques Construction of a mechanism model and benchmark validation for cross-modal data fusion[70] -
To achieve precise diagnoses and quantification of plant hormones' effects, hyperspectral data processing must follow a standardized, goal-oriented workflow that is closely integrated with physiological mechanisms (Fig. 3). This workflow forms a complete closed-loop system from data acquisition to model deployment, with each step designed to directly extract reliable information related to specific hormone responses from complex spectral data.
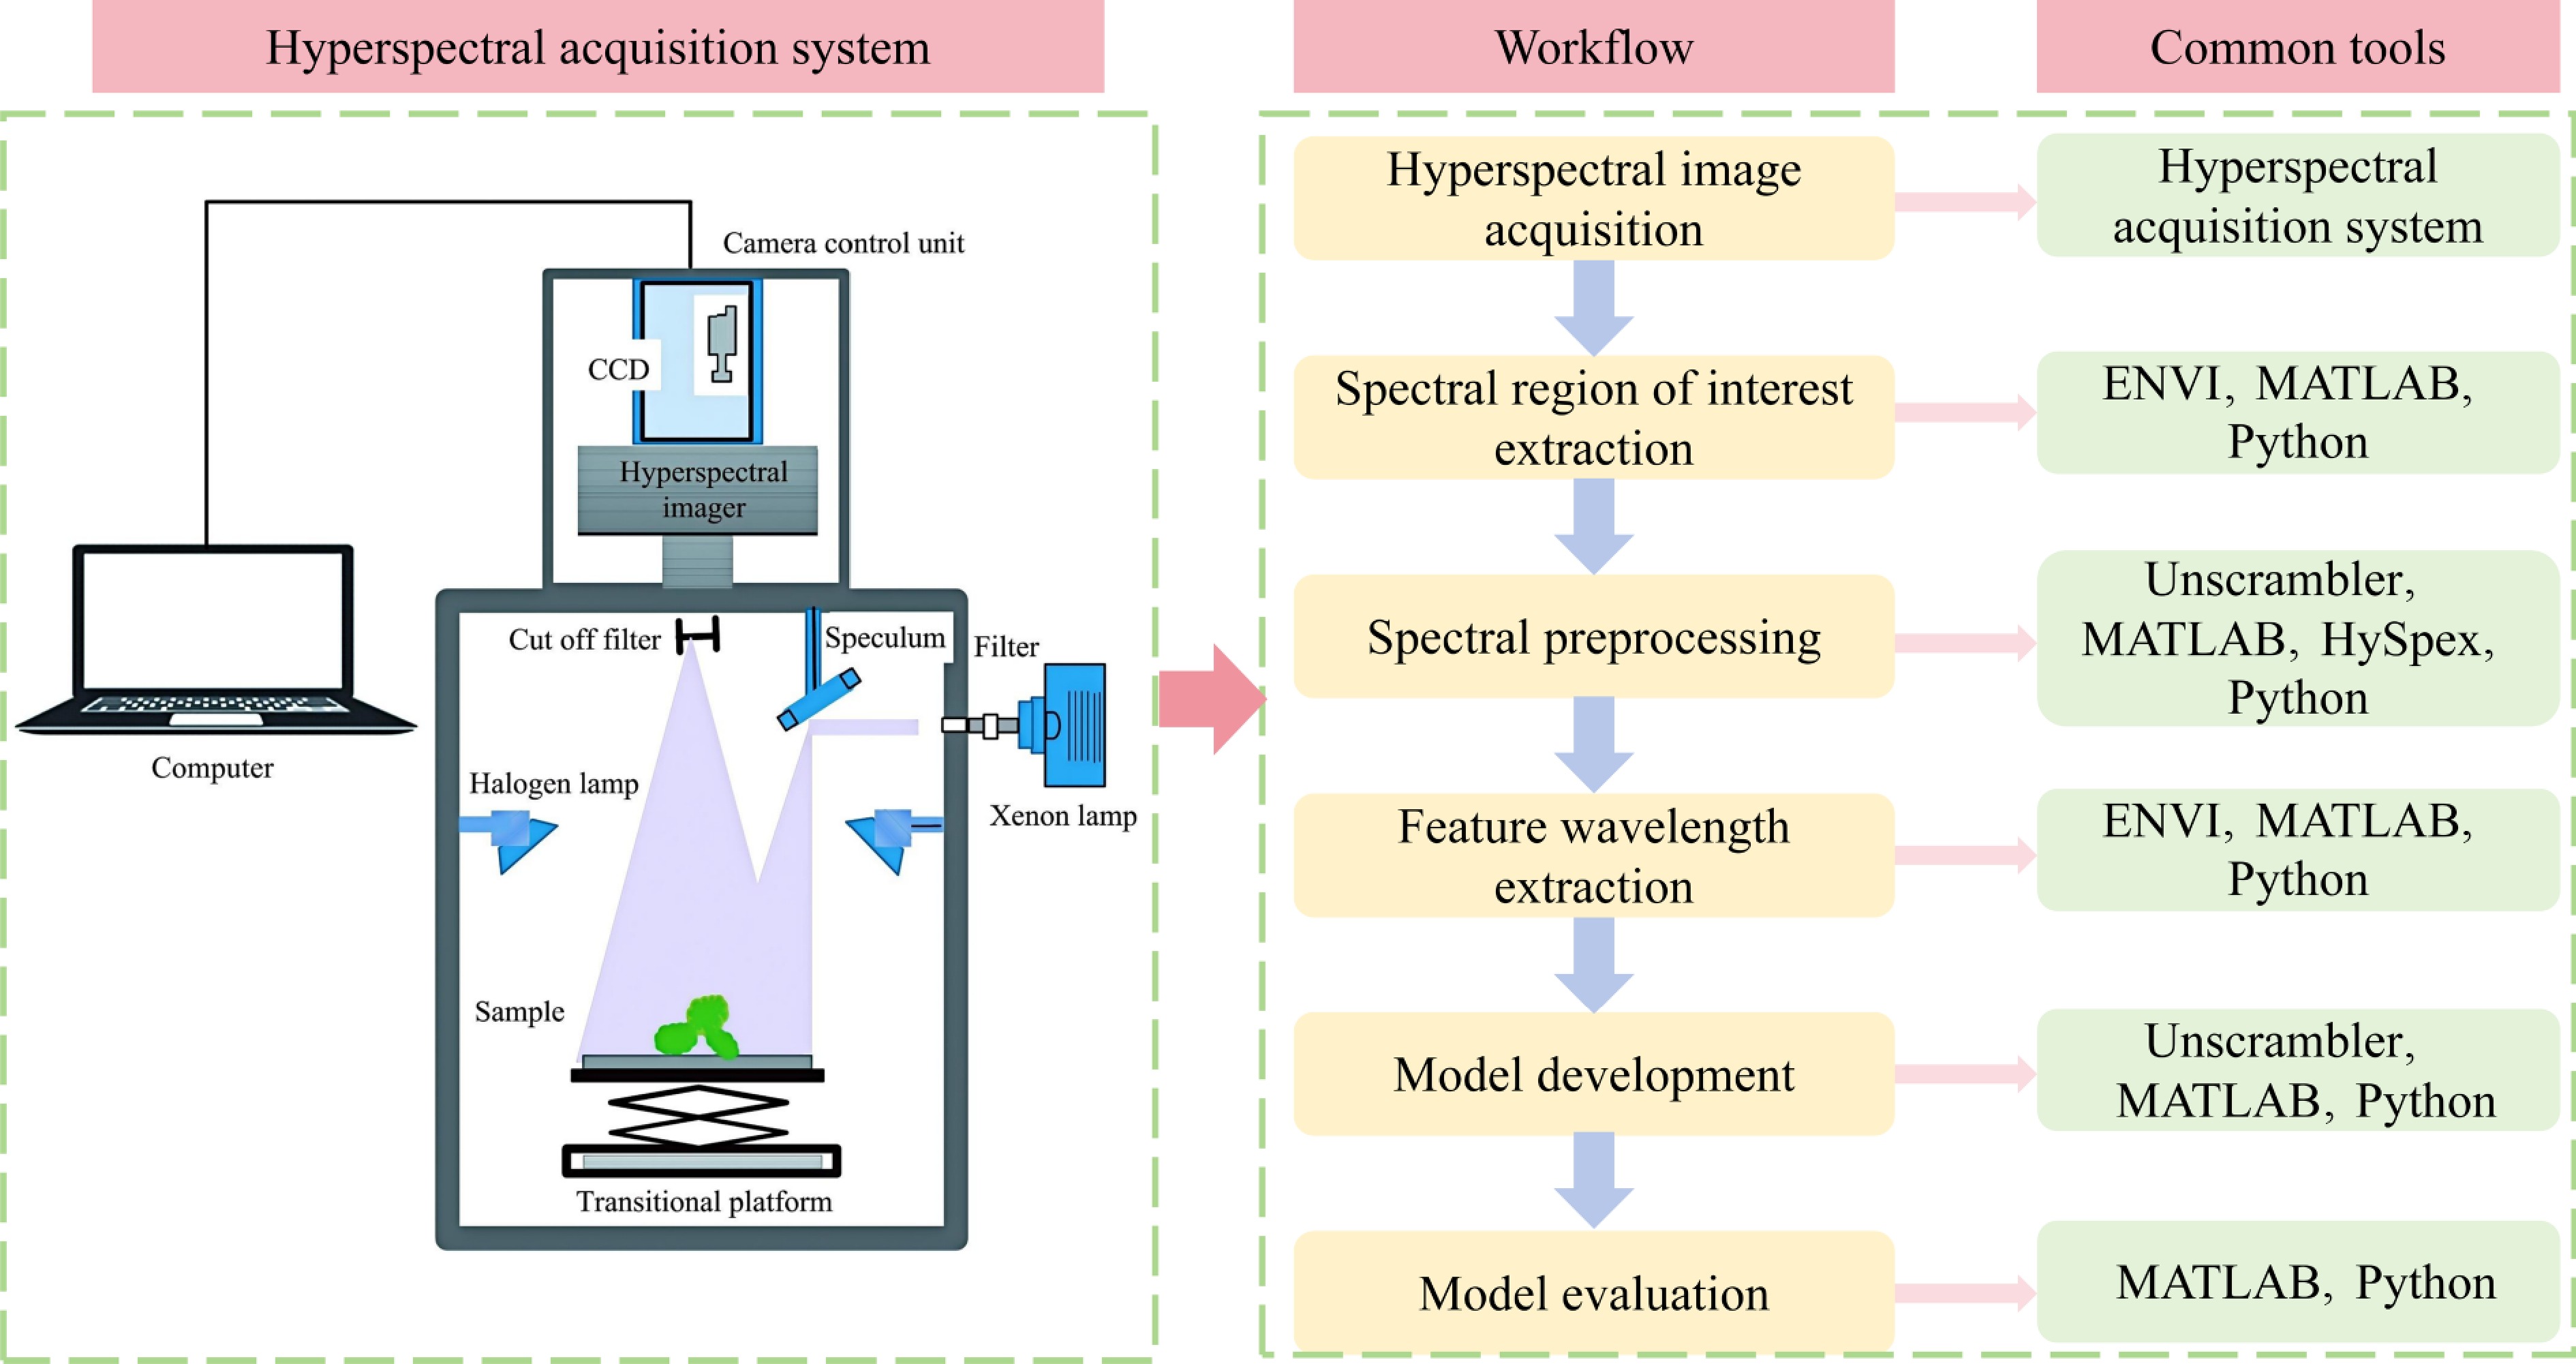
Figure 3.
Hyperspectral imaging technology workflow.
Data acquisition and calibration
-
Hyperspectral imaging systems simultaneously capture the spatial morphological information and spectral response characteristics of crops. The content and distribution of plant hormones, such as IAA, GA3(Gibberellic acid), and ABA, directly influence the spectral reflectance and absorption properties of crop organs, such as leaves and stems. For instance, ABA accumulation leads to chlorophyll degradation in leaves, resulting in decreased reflectance in the NIR band[71]. To eliminate systematic errors and environmental interference while ensuring the data's reliability, simultaneous geometric and radiometric calibration is required. Geometric calibration primarily corrects pixel shifts caused by canopy sway and camera displacement during pushbroom and snapshot imaging, preventing confusion between regions with differing hormone concentrations during extraction of the region of interest (ROI)[72]. Radiometric calibration eliminates effects from variations in light intensity, atmospheric scattering, and sensor response, converting raw grayscale values into true reflectance to ensure the comparability of spectral data across different batches and crop samples[73].
Extraction of the ROI
-
The effects of plant hormones exhibit organ- and tissue-specificity. This step aims to precisely segment target organs from images while excluding the background. This process directly targets regions where the hormones exert effects[74]. Leveraging spectral differences between crops and the background, techniques such as threshold segmentation, morphological processing, or semantic segmentation algorithms implemented via ENVI, Python, MATLAB, etc., are usedto extract target regions (e.g., leaves or ears) as ROIs. This focuses on plant hormone-related spectral signals, reducing data volumes and enhancing efficiency for subsequent processing[75].
Spectral preprocessing
-
The core objective of this stage is to enhance the spectral signals associated with hormone responses while suppressing irrelevant variations. Since early or subtle hormone-induced physiological changes yield weak spectral responses, these signals are easily masked by the leaf's surface texture, dust, or instrumental random noise. A series of preprocessing steps is required to eliminate interference and ensure the model's generalizability[76]. Baseline correction adjusts spectral baseline shifts caused by instrument drift and leaf scattering, restoring hormone-related characteristic peaks[77]. Noise reduction techniques (e.g., wavelet denoising, Savitzky–Golay smoothing) filter out random noise, thereby highlighting correlations between hormone levels and spectral reflectance. Normalization eliminates spectral-scale differences caused by differences in the growth state among crop samples (e.g., leaf thickness, leaf area), enabling the model to focus on spectral changes driven by hormone content[78].
Selection of spectral features
-
Hyperspectral data for crop monitoring is extremely high-dimensional, typically comprising hundreds of bands. The data contain redundant information, and some bands show no correlation with plant hormone levels, increasing modeling complexity and leading to overfitting. On the basis of known physiological mechanisms, selecting target-relevant spectral bands (e.g., monitoring ABA-related moisture changes using bands near 1,450 and 1,940 nm; monitoring GA- or ethylene-related pigment changes using the red edge region), and using specialized software for extracting the spectral features can reduce the data's dimensionality and enhance modeling efficiency. Through correlation analysis, sequential projection algorithm (SPA), principal component analysis (PCA), and other methods, bands significantly correlated with the target plant hormone levels are identified (e.g., strong correlations between IAA content and the 620−680-nm red absorption band, or between GA3 content and the 700−750-nm red edge band)[79]. Redundant bands are then eliminated, retaining the core spectral features to provide precise inputs for subsequent modeling.
Modeling and validation
-
This step establishes quantitative or qualitative mapping models linking spectral characteristics to hormonal effects. The models' selection and construction are closely aligned with agricultural applications. For preliminary screening, linear models such as partial least squares regression can establish quantitative relationships between hormone concentrations and spectral data[80]; for complex nonlinear responses involving interactions among multiple hormones, machine learning models such as support vector machines or random forests should be chosen. To visualize the spatial distribution of hormones (e.g., uneven ethylene-related ripening), deep learning models such as convolutional neural networks must be applied for pixel-level prediction[81]. The models must undergo rigorous validation using independent test sets to assess their accuracy, robustness, and generalization, ensuring reliable application to new plants or growth environments[82]. The core principles, advantages, and applicable scenarios of the different types of data analysis models, as shown in Table 4, provide a clear reference for selecting models to monitoring the effects of plant hormones.
Table 4. Comparison of hyperspectral data analysis models for monitoring the effects of plant hormones.
Model category Representative algorithm Core principles and features Key advantages Typical application scenarios Ref. Linear model Partial least squares regression (PLSR), principal component regression (PCR) Establish a mapping model based on the global linear assumption between the spectral features and target variables The model is simple, computationally efficient, and highly interpretable, making it suitable for analyzing small-sample data Preliminary quantitative analysis and trend assessment of single hormones' effects under controlled conditions [76,77] Nonlinear model Support vector regression (SVR), Gaussian process regression (GPR) Processing nonlinear relationships through kernel function mapping to find the optimal fitting hyperplane or probability distribution Suitable for nonlinear fitting with moderate sample sizes, offering superior generalization capabilities compared with simple linear models Scenarios where the hormone dose–response relationship is nonlinear or where moderate background interference is present [78,79] Machine learning model Random forest (RF), gradient boosting machine (GBM) Integrating multiple decision trees to make predictions through voting or weighting; excels at handling high-dimensional features Strong antioverfitting capability, insensitive to noise, capable of assessing features' importance, and excellent generalization performance Prediction of hormone levels or classification of stress states under complex field conditions involving multiple factors [80] Deep learning model Convolutional neural networks (CNNs), recurrent neural networks (RNNs) Deep abstract representations that automatically extract spectral-spatial features through multilayer network architectures Possesses strong feature learning capabilities, enabling it to capture complex spatial patterns and contextual information Precision inversion (e.g., mapping hormones' spatial distribution), dynamic monitoring of time series, and large-scale data processing [81,82] Model deployment and migration
-
The ultimate goal is to deploy the optimized model in real-world field- or facility-based agricultural scenarios[83]. This may involve integrating the model into portable hyperspectral devices or drone platforms to enable real-time diagnostics. Existing research on hyperspectral imaging for monitoring plants' hormone responses has primarily focused on leaf-scale measurements and controlled laboratory environments[84]. However, translating laboratory-based spectral models to large-scale applications on field drones or agricultural machinery faces critical bottlenecks. Challenges include dynamic field light conditions, canopy movement, and complex backgrounds such as soil and weeds, which introduce significant spectral noise that can easily mask the subtle spectral signatures induced by hormones[85]. This creates a stark contrast to the high signal-to-noise ratio spectral signals obtained under stable laboratory conditions[86]. Second, the precise spectral characteristics of isolated laboratory leaves exhibit spatial heterogeneity in canopy-scale field imaging becasue of leaf layer overlap and organ occlusion. Scale effects render leaf-scale spectral–physiological correlation models ineffective[87]. Third, laboratory models are often trained on single varieties and fixed growth stages, making them ill-suited to adapt to field crop variety differences, coupled environmental stresses, and the interactive effects of hormones and agronomic practices, resulting in the model's significantly reduced generalizability[88]. These issues fundamentally stem from the inherent disparity between idealized laboratory-derived spectral features and complex spectral signals in the field. Direct transfer significantly degrades the model's prediction accuracy[89]. Field adaptation of laboratory models requires optimization through field-based spectral preprocessing, multisource data fusion, and fine-tuning via transfer learning models[90].
Hyperspectral-driven precision application of plant hormones: an integrated framework based on existing technological modules
-
Currently, the application of hyperspectral imaging in plant hormone research primarily focuses on monitoring and analyzing physiological responses, whereas practical examples of a complete closed-loop perception–analysis–decision–execution–feedback system at the field scale remain largely prospective[91]. The core workflow of this closed-loop system is closely integrated with the hyperspectral data processing workflow shown in Fig. 3, serving as a crucial foundation for technological integration. This section proposes a theoretical integrated framework whose core logic is based on field-level, localized validation results from hyperspectral imaging for monitoring plants' physiological responses to hormones. In controlled environments, existing agricultural studies have used portable hyperspectral imagers to dynamically monitor crops' leaf spectra after auxin and gibberellin treatments. These studies successfully inverted physiological indicators such as cell elongation and chlorophyll synthesis, validating the technical feasibility of spectral sensing and physiological analysis[57]. At the field scale, unmanned aerial vehicle (UAV)-based hyperspectral imaging has been applied to monitor ABA-mediated drought stress responses in wheat (Triticum aestivum) and rice. By combining water indices with red edge parameters, regional identification of crops' stress hormone requirements has been achieved[58]. The aforementioned studies provide direct technical support for the perception–analysis segment within the closed-loop framework. The decision–execution–feedback segment relies on mature applications in precision agriculture, such as drone-based precision spraying and variable-rate sprayers, alongside closed-loop optimization experience from machine learning models in crop water and fertilizer management[92], enabling cross-scenario integration of technical modules.
-
Hyperspectral imaging technology, leveraging its advantages of noncontact, high-throughput, and multidimensional analysis, provides comprehensive technical support for the rational use of plant hormones[93]. It overcomes the limitations of traditional methods, such as reliance on experience, delayed effects, and blind regulation. In monitoring physiological responses, it achieves precise quantification and early warning of hormones' regulation effects by leveraging deep correlations between spectral features and physiological indicators, resolving the issues of high invasiveness and low efficiency in traditional monitoring. In the optimization of application schemes, it integrates multisource data to build coupled decision models, driving hormone regulation from uniform application to personalized precision control, thereby advancing green agricultural development.
Looking ahead, the large-scale application of hyperspectral imaging technology for the precision management of plant hormones still faces several challenges, including highly heterogeneous data, limited model generalizability, and difficulties with field deployment. To advance this field from laboratory research to practical application, we should establish a unified system of benchmark tasks and standardized guidelines[94]. We can define standardized benchmark tasks centred on three key aspects, namely spectral analysis of hormone responses, quantitative diagnosis, and protocol optimization, while clearly defining the objectives, evaluation metrics, and data requirements for each task, thereby laying the foundation for cross-study comparisons and model transferability. Second, we should establish comprehensive metadata standards and technical workflow specifications to enhance data's comparability and reusability[95]. By standardizing hyperspectral imaging acquisition parameters (such as spectral range, resolution, and lighting conditions), background information on the crop (such as the variety, growth stage, and management practices), and hormone application details (such as type, dose, and application method), we can establish unified data preprocessing, feature extraction, and modeling workflows to ensure the reproducibility and reliability of research results across different scenarios. Finally, we should construct a cross-scenario, multicrop spectral reference database, which is key to enhancing models' generalizability[96]. In the future, we can also integrate hyperspectral data and physiological response data from different crops, hormone types, and environmental conditions to form an open, shared reference dataset. This will support the training and validation of data-driven models, such as deep learning, thereby accelerating the practical implementation of hyperspectral technology for the precision management of plant hormones.
-
The authors confirm their contributions to the paper as follows: study conception, design, and writing – preparing the original draft: Pan W, Zhang Y; supervision and formal analysis: Wang S, Chen X, Zhang L, Zhu D; formal analysis: Zhang Y, Yang J, Tian X; investigation, managing the project, and obtaining funding: Wu L. All authors reviewed the results and approved the final version of the manuscript.
-
Data sharing not applicable to this article as no datasets were generated or analyzed during the current study.
-
The authors declare that they have no conflict of interest.
-
# Authors contributed equally: Wencheng Pan, Yao Zhang
- Copyright: © 2026 by the author(s). Published by Maximum Academic Press on behalf of Chongqing University. This article is an open access article distributed under Creative Commons Attribution License (CC BY 4.0), visit https://creativecommons.org/licenses/by/4.0/.
-
About this article
Cite this article
Pan W, Zhang Y, Yang J, Zhang L, Wang S, et al. 2026. Hyperspectral imaging technology can support the rational use of plant hormones: from physiological response monitoring to application scheme optimization. Plant Hormones 2: e010 doi: 10.48130/ph-0026-0008 

Hyperspectral imaging technology can support the rational use of plant hormones: from physiological response monitoring to application scheme optimization
- Received: 06 December 2025
- Revised: 26 March 2026
- Accepted: 30 March 2026
- Published online: 27 April 2026
Abstract: Plant hormones serve as key endogenous signalling molecules regulating plants' growth, development, and stress responses. Their exogenous application has become a vital strategy for enhancing agricultural quality and yield in modern farming. However, traditional application methods rely heavily on experience and lack real-time feedback, often leading to imbalanced dosages that result in resource wastage and environmental pollution. In recent years, hyperspectral imaging has emerged as a rapid, nondestructive phenotyping technology. Its ability to simultaneously capture both spatial information and continuous spectral characteristics of the targets has demonstrated immense potential in precision agriculture. This review systematically elucidates how hyperspectral imaging technology supports the rational application of key plant growth regulators, such as auxin, gibberellin, abscisic acid, and ethylene, establishing a closed-loop framework spanning perception, analysis, and decision-making. To this end, the paper first explains the technical principles of hyperspectral imaging and its mechanism for conveying the physiological and biochemical information of plants. It then reviews its specific applications in monitoring physiological responses induced by different hormones, demonstrating its capabilities at the level of phenomenon perception. Subsequently, it focuses on analyzing how advanced data analysis methods extract effective information from large spectral datasets and construct quantitative diagnostic models. Finally, it explores how to feed this information back into the dynamic optimization of hormone application protocols to develop precise, closed-loop management strategies, and also outlining the challenges and future directions in this field. This review provides a theoretical foundation for shifting plant hormone management from an experience-driven to a data-driven approach.