


-
Biomass is particularly attractive because of its renewability, wide availability, and potential carbon neutrality[1,2]. Among the various biomass resources, bamboo (BB) is particularly attractive because of its fast growth rate, high carbon sequestration capacity, wide distribution in tropical and subtropical regions, and non-competition with agricultural land[3,4]. These features not only highlight its renewability, but also reinforce its role in climate change mitigation and carbon-neutral strategies. In China, BB resources exceed 6.67 million ha, generating an annual economic value of nearly 320 billion yuan, highlighting its strategic importance as a sustainable feedstock for energy production[5].
Pyrolysis, a thermal decomposition process in an oxygen-free environment, is a promising method for converting biomass into valuable products[6]. It not only reduces waste and mitigates disposal issues, but also generates bio-oil, biochar, and syngas, thus providing marked techno-economic viability[7]. Despite these advantages, biomass pyrolysis faces inherent challenges. Bio-oil usually contains a high proportion of oxygenated compounds, exhibits high water content, low calorific value, high viscosity, and strong acidity, all of which limit its direct utilization as fuel[8,9]. Although BB is an abundant and rapidly renewable biomass, it shares these limitations when subjected to pyrolysis alone, which constrains its potential as a standalone energy feedstock[10].
Waste tires (WT) have gained attention as a potential feedstock for energy recovery, with a global generation of over 17 million tons in 2020, and a projection of 120 million tons by 2030[11]. Their high carbon content and rubber-based composition make them valuable sources of carbon-based energy[12]. However, improper disposal of WT, such as landfilling and open burning, poses severe environmental risks, including soil contamination, fire hazards, and toxic emissions[13,14]. Pyrolysis has been extensively studied as an environmentally sustainable route for WT recycling, generating value-added products such as carbon black, activated carbon, liquid fuels, and syngas[15,16], while simultaneously promoting waste reduction and pollution control[17,18]. However, WT has a relatively uniform composition, which limits the variety and upgrading potential of pyrolysis products[19,20].
According to the definition of the effective hydrogen-to-carbon ratio (H/Ceff)[21], biomass is generally characterized by low H/Ceff values (0–0.3), which are associated with the poor quality of its derived bio-oil[22]. In contrast, WT exhibits a much higher H/Ceff[23], and its co-pyrolysis with biomass has been recognized as an effective strategy to exploit synergistic effects, and improve both the product yield and quality[23,24]. For instance, Kumar et al.[25] reported that the co-pyrolysis of de-oiled microalgal residue with WT significantly modified the chemical composition of bio-oil, and increased its yield to 48.96% wt, indicating improvements in both bio-oil and biochar quality. Similarly, Farooq et al.[26] demonstrated that incorporating WT into wheat straw pyrolysis enhanced the calorific value of bio-oil, while reducing its oxygenated compound content. Notably, Niu et al.[19] compared the co-pyrolysis of WT with rice husks, wheat straw, and BB, and found that although synergistic effects were observed in all cases, the wheat straw-BB blends exhibited particularly strong synergy. This highlights the potential of BB as a promising feedstock for co-pyrolysis with WT.
Several studies have investigated the co-pyrolysis of BB and WT, focusing on their product characteristics and synergistic interactions. Guo et al.[27] analyzed the release characteristics of oxygen-containing compounds and aromatics during the co-pyrolysis of WT and BB by pyrolysis gas-chromatography/mass spectrometry(Py-GC/MS). The active oxygen-containing free radicals released from BB sawdust promoted the chain breaking of rubber components and the release of hydrogen-free radicals. Niu et al.[19] demonstrated that BB facilitated the pore structure development of biomass char, suppressed aromatic hydrocarbon formation, and promoted the production of alicyclic hydrocarbons, ethers, and furan. Wang et al.[22,28] conducted catalytic fast co-pyrolysis of BB and WT over CaO/HZSM-5 and MgO/HZSM-5. The results indicated that the dual catalysts effectively enhanced the bio-oil quality by promoting the formation of aromatics and olefins while suppressing undesirable oxygenates. Wang et al.[29] investigated microwave-assisted catalytic fast co-pyrolysis of BB and WT using HZSM-5, and reported that the process maximized bio-oil yield at 550 °C, while enhancing aromatic hydrocarbon production through the hydrogen-donating effect of WT. Regarding the solid residue, Deng et al.[30] highlighted the microstructural evolution during co-pyrolysis. It was observed that the process achieves an organic integration of the fibrous BB framework with the WT-derived carbon matrix. The diffusion of tire-derived radicals into biomass-derived pores facilitates crosslinking reactions, which effectively mitigates agglomeration, and enhances pore connectivity compared to the individual materials.
Although the co-pyrolysis of BB and WT has been investigated, the reported synergistic effects mainly focus on improvements in pyrolysis products, such as enhanced oil yield, modified composition, and catalytic upgrading of bio-oil. However, the fundamental understanding of the reaction kinetics, which is critical for reactor design, and the in situ volatile interaction mechanisms driving these synergies remain inadequately explored. For instance, although recent work has advanced the understanding of co-pyrolysis synergies[31], a comprehensive kinetic analysis coupled with real-time volatile product evolution for the BB-WT system is still lacking. Consequently, the fundamental understanding of BB-WT interactions remains limited, and the lack of reliable kinetic data continues to hinder process optimization and the potential scale-up of BB-WT co-pyrolysis.
To address these research gaps, this study characterizes the co-pyrolysis behavior and reaction kinetics of BB-WT blends, by integrating thermogravimetric analysis, fourier transform infrared spectroscopy, and gas chromatography-mass spectrometry (TG-FTIR-GC/MS). The key novelties and contributions are as follows:
(1) The co-pyrolysis behaviors of BB, WT, and their blends were studied using a TG-FTIR-GC/MS approach, which enabled the simultaneous evaluation of the thermal degradation behaviors, weight-loss patterns, and gaseous product evolution, offering a more holistic understanding of BB-WT interactions.
(2) The pyrolysis kinetics of the BB-WT blends were determined using the KAS, FWO, Friedman, and Coats-Redfern methods, establishing reliable reaction models and activation energies. These models provide critical parameters for understanding blend interactions and offer a theoretical basis for optimizing and scaling-up co-pyrolysis processes.
(3) By linking the thermal degradation behavior, chemical composition of volatile products, and kinetic parameters, this study provides a holistic view of the co-pyrolysis process, which can facilitate the optimization of the process for energy recovery and chemical production.
The findings not only fill a critical knowledge gap in BB-WT co-pyrolysis, but also establish a solid theoretical basis that can guide process optimization, improve energy recovery efficiency, and support future industrial applications of waste-to-energy technologies.
-
The BB samples used in this study were obtained from a chopstick manufacturing facility in Hunan Province, China. The samples were ground using a grinder and sieved through a 150 μm standard mesh to achieve a narrow particle size distribution. In the TG experiments, particles exceeding 0.25 mm in diameter were constrained during heating because of their lower thermal conductivity[32]. Consequently, the material must be ground into a powder with a particle size below 0.2 mm to ensure a more stable heat transfer rate[33]. WT particles were provided by Hunan Qiheng Environmental Protection Technology Co., Ltd, and were processed through a two-stage crushing line to remove steel wires before use. Owing to the small sample mass in the TG experiments and the differing densities of the biomass and polymer, each component was individually weighed using an analytical microbalance, and thoroughly blended using a mortar and pestle. The homogeneity of the BB-WT blends was verified through three repeated TG runs, which produced nearly overlapping TG/DTG curves (Supplementary Fig. S1), with a relative standard deviation (RSD) of key thermal parameters (e.g., peak temperature and mass loss at characteristic points) within 0.5%.
Proximate analysis of the samples was conducted following the Chinese standards GB/T 212-2008[34] and CJ/T 313-2009[35]. The elemental compositions of C, H, O, N, and S were determined using an elemental analyzer (5E-CHN2200) in accordance with CJ/T 96-2013[36]. Additionally, the higher heating value (HHV) of the feedstock was measured using an automatic calorimetric bomb (5E-AC). The results are presented in Table 1.
Table 1. Proximate and ultimate analyses of the samples.
Samples Proximate analysis (%) Ultimate analysis (%) Mad Vad Aad FCad HHV (MJ/kg) C H O N S BB 12.76 72.14 0.78 14.32 17.62 44.24 5.21 36.64 0.14 0.23 WT 1.23 61.94 13.04 23.79 36.62 76.08 7.15 1.75 0.53 1.75 M: moisture; V: volatile; A: ash; FC: fixed carbon. TG and TG-FTIR-GC/MS experiments
-
Thermogravimetric (TG) analyses were performed using an STA-8000 instrument (PerkinElmer, USA) under a constant flow of high-purity nitrogen gas (99.999%) at 20 mL/min. Approximately 17 mg of the sample was uniformly loaded into ceramic crucibles to minimize heat and mass transfer limitations. Two sets of TG experiments were designed following a controlled-variable approach: (i) to study the effect of the final pyrolysis temperature, the samples (BB, WT, and their 1:1 blend) were heated to 500, 600, 700, 800, and 900 °C, at a heating rate of 20 °C/min; (ii) to study the effect of the heating rate, the samples were heated from room temperature to 700 °C at rates of 10, 20, 30, and 40 °C/min. These TG experiments provided fundamental thermal degradation characteristics and were used to determine the appropriate heating conditions for subsequent coupled analysis.
Based on the TG results, TG-FTIR-GC/MS analyses were performed to investigate the co-pyrolysis behavior and volatile products of the samples. The coupled system consisted of a thermogravimetric analyzer (TGA), FTIR spectrometer (Spectrum 3, PerkinElmer), gas chromatograph (TRACE 1600, Thermo Fisher Scientific), and mass spectrometer (ISQ 7610, Thermo Fisher Scientific), which were connected through heated transfer lines to ensure efficient transport of volatile compounds (Fig. 1). To ensure stable operation and representative results, a constant heating rate of 20 °C/min was selected for the coupled experiment. BB and WT were blended at mass ratios of 0:10, 1:9, 3:7, 5:5, 7:3, 9:1, and 10:0, covering the full range from pure WT to pure BB, including low-percentage, intermediate, and high-percentage mixtures, to capture representative interaction patterns of the mixtures. The evolved gases were continuously monitored using FTIR to track the evolution of the functional groups. At the peak weight-loss temperature, the evolved gases were analyzed using GC/MS to elucidate the influence of the blending ratio on the co-pyrolysis product distribution. All experiments were conducted in triplicate to ensure data robustness and reproducibility.
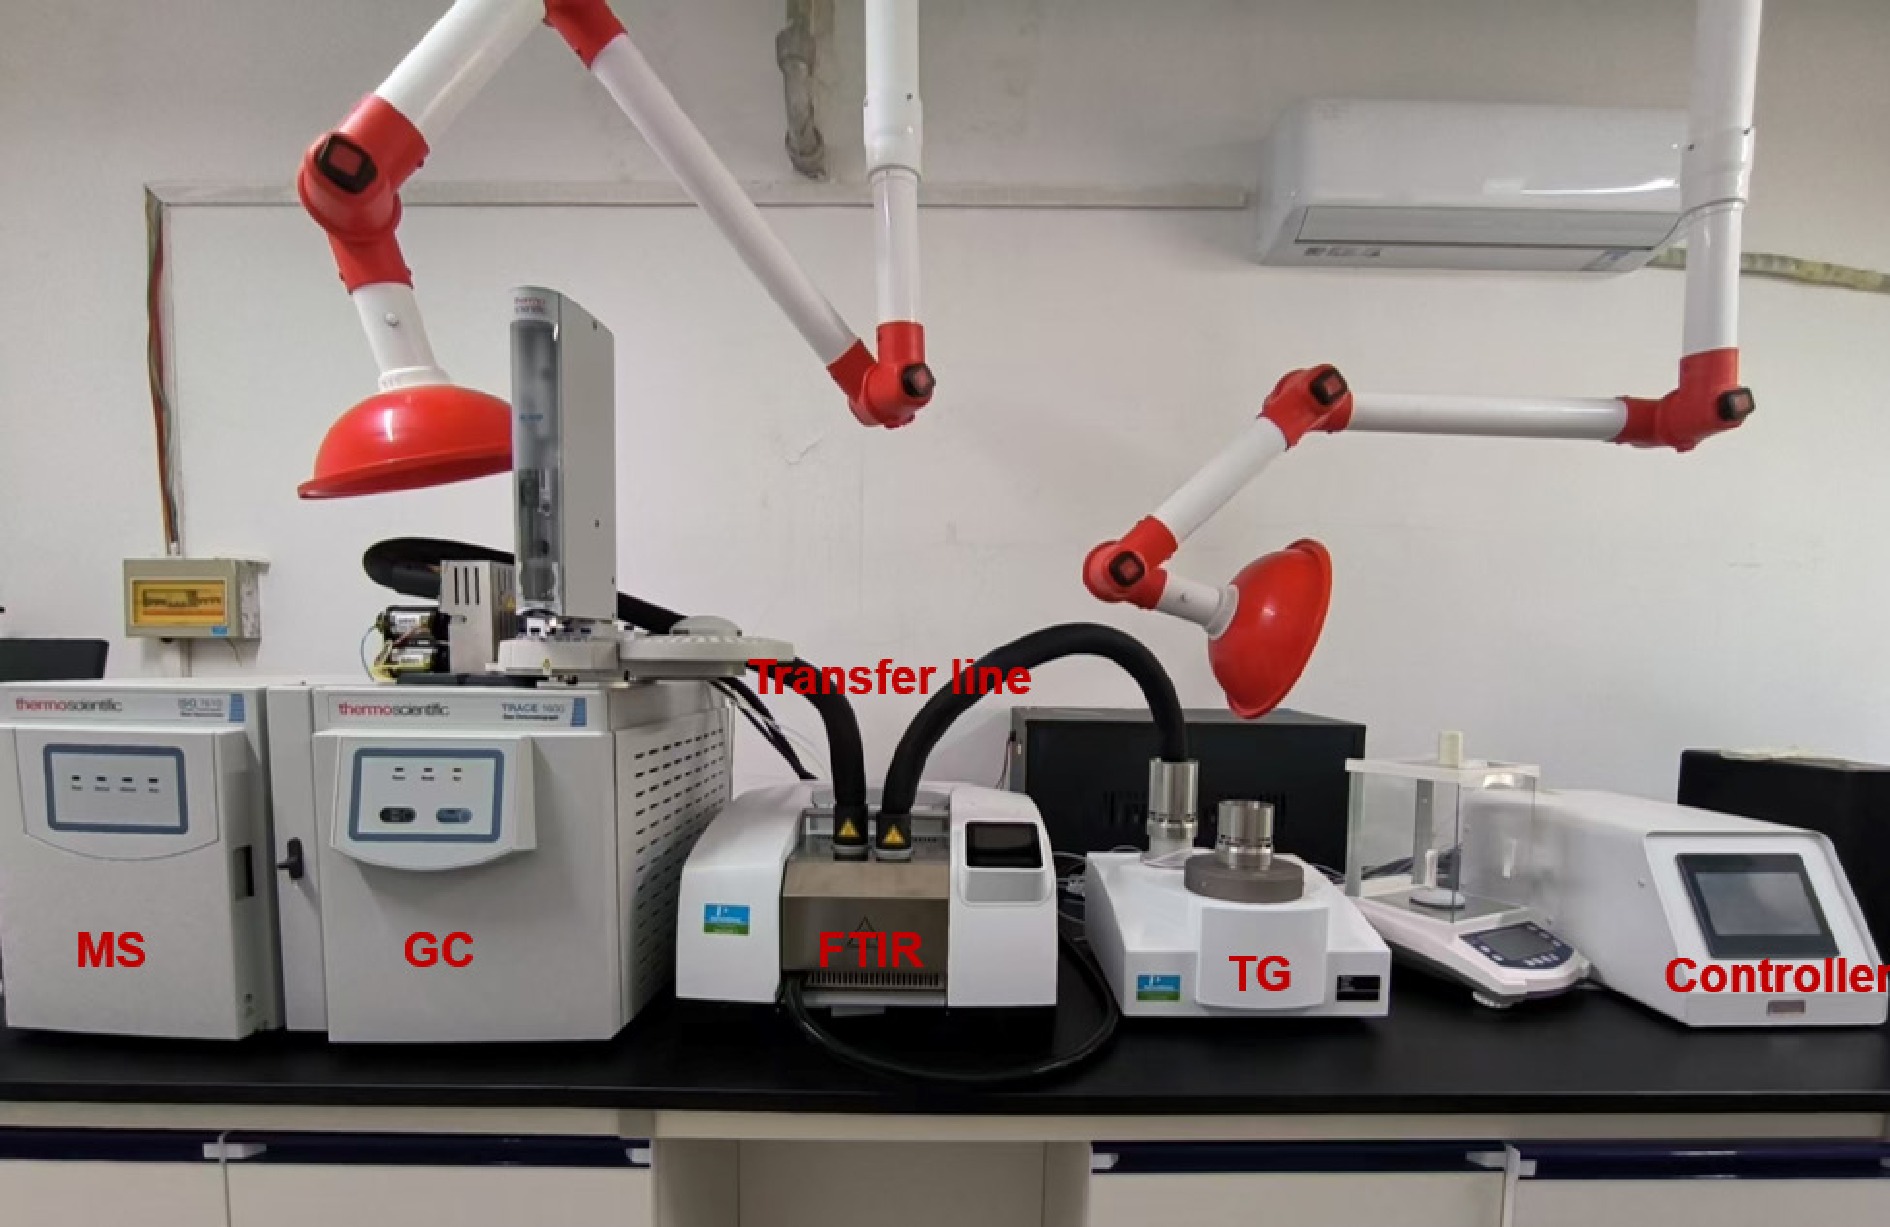
Figure 1.
Photograph of the TG-FTIR-GC/MS experimental setup.
The TG-FTIR transfer line was maintained at 270 °C to ensure the efficient transfer of volatile products. FTIR spectra were collected in the range of 4,000−600 cm−1 with a resolution of 8 cm−1, and each scan lasted 2.7 s without signal averaging. The GC/MS system was operated in an online configuration. A TG-1MS column (30 m × 0.32 mm × 0.25 μm) was used. The GC oven program was set as follows: initial temperature 50 °C held for 5 min, ramped up at 10 °C/min to 250 °C, then held for 5 min. High-purity helium served as the carrier gas at a flow rate of 5 mL/min. The GC injection port was maintained at 270 °C under a constant pressure of 100 kPa. The MS was operated with the ion source temperature set at 280 °C, and a scanning mass-to-charge ratio (m/z) range of 41−400.
Reaction kinetics
-
The rate of the solid heterogeneous reaction can be expressed as follows:
$ \dfrac{{{\mathrm{d}}\alpha}}{{{\mathrm{d}}t}}=k(T)f(\alpha)=A\exp \left(-\dfrac{{E}}{{{\mathrm{R}}T}}\right)f(\alpha) $ (1) where, α is the conversion of the sample, t is the reaction time, T is the thermodynamic temperature (K), f(α) represents the differential form of the kinetic model function, and k(T) is the temperature-dependent rate constant.
According to the Arrhenius equation, k(T) is defined as:
$ {k(T)=A}\exp \left(-\dfrac{{E}}{{{\mathrm{R}}T}}\right) $ (2) where, A, E, and R, are the pre-exponential factor (min−1), activation energy (kJ/mol), and gas constant (R = 8.314 J/(mol·K)), respectively.
The conversion α can be calculated using the following equation:
$ \alpha=\dfrac{m_0-m\mathrm{_t}}{m_0-m\mathrm{_f}} $ (3) where, m0, mt and mf are the initial, time t, and final masses of the sample, respectively.
Incorporating a constant linear heating rate
$ \beta =\dfrac{{{\mathrm{d}}T}}{{{\mathrm{d}}t}} $ $ \beta\dfrac{\mathrm{d}\alpha}{\mathrm{d}T}=A\exp\left(-\dfrac{E}{\mathrm{R}T}\right)f(\alpha) $ (4) By integrating this temperature, Eq. (1) can also be expressed as
$ G(\alpha)=\int\nolimits_{{0}}^{ \alpha }\dfrac{{d\alpha}}{{f(\alpha)}}=\dfrac{{A}}{\beta}\int\nolimits_{{0}}^{{T}}\exp \left(-\dfrac{{E}}{{{\rm R}T}}\right){\rm d}T $ (5) where, G(α) refers to the integral form of the kinetic model function.
Table 2 summarizes the expressions of f(α) and G(α) for common kinetic model functions.
Table 2. Common kinetic model functions.
Reaction mechanism model No. Code $ G(\alpha ) $ $ f(\alpha ) $ Reaction model Chemical reaction 1 F1 $ -\ln (1-\alpha ) $ $ 1-\alpha $ n = 1 reaction 2 F3/2 $ 2[{(1-\alpha )}^{-1/2}-1] $ $ {(1-\alpha )}^{3/2} $ n = 1.5 reaction 3 F2 $ {(1-\alpha )}^{-1}-1 $ $ {(1-\alpha )}^{2} $ n = 2 reaction 4 F3 $ 1/2[{(1-\alpha )}^{-2}-1] $ $ {(1-\alpha )}^{3} $ n = 3 reaction Diffusion controlled reaction 5 D1 $ {\alpha }^{2} $ $ 1/2{\alpha }^{{-}1} $ Parabolic law 6 D2 $ (1-\alpha )\ln (1-\alpha )+\alpha $ $ {[-\ln (1-\alpha )]}^{-1} $ Valensi equation 7 D3 $ {[1-{{(1-\alpha )}^{1/3}}]}^{2} $ $ 3/2{(1-\alpha )}^{2/3}{[1-{{\left(1-\alpha \right)}^{1/3}}]}^{-1} $ Jander equation 8 G-B $ (1-2/3\alpha )-{\left(1-\alpha \right)}^{2/3} $ $ 3/2{\left[{\left(1-\alpha \right)}^{1/3}-1\right]}^{-1} $ Ginstling-Broushtein equation 9 ZH $ {[{{(1-\alpha )}^{-1/3}}-1]}^{2} $ $ 3/2{(1-\alpha )}^{4/3}{[{{\left(1-\alpha \right)}^{-1/3}}-1]}^{-1} $ Zhuralev-Lesokin-Tempelman equation Phase boundary reaction 10 R1 $ \alpha $ 1 1D 11 R2 $ 1-{(1-\alpha )}^{1/2} $ $ 2{(1-\alpha )}^{1/2} $ 2D, shrinking cylinder 12 R3 $ 1-{(1-\alpha )}^{1/3} $ $ 3{(1-\alpha )}^{2/3} $ 3D, shrinking sphere Random nucleation and
subsequent13 A3/2 $ {[-\ln (1-\alpha )]}^{2/3} $ $ 3/2(1-\alpha ){[-\ln (1-\alpha )]}^{1/3} $ Aeveami-Erofeev equation 14 A2 $ {[-\ln (1-\alpha )]}^{1/2} $ $ 2(1-\alpha ){[-\ln (1-\alpha )]}^{1/2} $ Aeveami-Erofeev equation 15 A3 $ {[-\ln (1-\alpha )]}^{1/3} $ $ 3(1-\alpha ){[-\ln (1-\alpha )]}^{2/3} $ Aeveami-Erofeev equation 16 A4 $ {[-\ln (1-\alpha )]}^{1/4} $ $ 4(1-\alpha ){[-\ln (1-\alpha )]}^{3/4} $ Aeveami-Erofeev equation 17 A1 $ [-\ln (1-\alpha )] $ $ (1-\alpha ) $ Aeveami-Erofeev equation 18 A2/3 $ {[-\ln (1-\alpha )]}^{3/2} $ $ 2/3(1-\alpha ){[-\ln (1-\alpha )]}^{-1/2} $ Aeveami-Erofeev equation 19 A1/2 $ {[-\ln (1-\alpha )]}^{2} $ $ 1/2(1-\alpha ){[-\ln (1-\alpha )]}^{-1} $ Aeveami-Erofeev equation 20 A1/3 $ {[-\ln (1-\alpha )]}^{3} $ $ 1/3(1-\alpha ){[-\ln (1-\alpha )]}^{-2} $ Aeveami-Erofeev equation 21 A1/4 $ {[-\ln (1-\alpha )]}^{4} $ $ 1/4(1-\alpha ){[-\ln (1-\alpha )]}^{-3} $ Aeveami-Erofeev equation Mampel power law 22 P1 $ {\alpha }^{1/4} $ $ 4{\alpha }^{3/4} $ Power law 23 P2 $ {\alpha }^{1/3} $ $ 3{\alpha }^{2/3} $ Power law 24 P3 $ {\alpha }^{1/2} $ $ 2{\alpha }^{1/2} $ Power law The apparent activation energy at different conversions (Eα) was calculated using model-free methods, which could accurately estimate kinetic parameters without prior knowledge of reaction models[37], making them highly reliable for multi-step processes. KAS[38,39], FWO[40,41], and Friedman[42] methods are based on dynamic heating rates and are considered the most proficient for estimating kinetic restraints[37,43]. Among them, the KAS and FWO methods are integral methods that rely on approximations to integrate the rate equation, whereas Friedman is a differential method that uses the instantaneous reaction rate directly, granting it high sensitivity to changes in reaction rates and mechanisms at different conversions[44]. These methods are described by the following equations:
$ \ln\left(\dfrac{\beta}{T^2}\right)=\ln\left(\dfrac{A_{\alpha}\mathrm{R}}{E_{\alpha}G(\alpha)}\right)-\dfrac{E_{\alpha}}{\mathrm{R}}\dfrac{1}{T} $ (6) $ \log(\beta)=\log\left(\dfrac{A_{\alpha}E_{\alpha}}{\mathrm{R}G(\alpha)}\right)-2.315-0.457\dfrac{E_{\alpha}}{\mathrm{R}}\dfrac{1}{T} $ (7) $ \ln(\beta\dfrac{\mathrm{d}\alpha}{\mathrm{d}T})=\ln[A_{\alpha}f(\alpha)]-\dfrac{E_{\alpha}}{\mathrm{R}}\dfrac{1}{T} $ (8) The Eα is determined by the slope of the linear representations of
$ \ln {(}\dfrac{{\beta}}{{{T}}^{{2}}}{)} $ $ {\log(\beta)} $ $ {\ln(\beta}\dfrac{{{\mathrm{d}}\alpha}}{{{\mathrm{d}}t}}{)} $ $ \dfrac{{1}}{{T}} $ $ \ln\dfrac{G(\alpha)}{T_{\alpha}^2}=\ln\left[\dfrac{A\mathrm{R}}{\beta E_{\alpha}}\left(1-\dfrac{2\mathrm{R}T}{E_{\alpha}}\right)\right]-\dfrac{E_{\alpha}}{\mathrm{R}T} $ (9) By plotting in
$ \ln \dfrac{{G(\alpha)}}{{T}_{ \alpha }^{{2}}} $ $ \dfrac{{1}}{{T}} $ When Eα and reaction model f(α) or g(α) are determined, the pre-exponential factor (Aα) can also be estimated using Eqs (6), (7), and (8). The kinetic compensation effect (KCE) can be analyzed through the linear regression of Aα and Eα, by Eq. (10):
$ \ln A_{\alpha}=\mathrm{a}E_{\alpha}+\mathrm{b} $ (10) where, a and b are constants.
Interactions between materials
-
To evaluate the potential interactions during the co-pyrolysis of the BB-WT blend, the difference in weight loss (
$ {\Delta W)} $ $ \Delta W=W\mathrm{_{blend}}-(x_{\mathrm{BB}}W\mathrm{_{BB}}+x_{\mathrm{WT}}W_{\mathrm{WT}}) $ (11) where, Wblend represents the experimental weight loss of the blend, and xBB and xWT denote the mass fractions of BB and WT in the blend, respectively. WBB and WWT are the weight losses of the individual components under the same conditions.
Similarly, the difference in weight loss rate (Δr) between the experimental value of the blend and the weighted sum of the individual components is calculated using the following equation:
$ {\Delta r=}{{r}}_{{\mathrm{blend}}}{-(}{{x}}_{{\mathrm{BB}}}{{r}}_{{\mathrm{BB}}}+{{x}}_{\rm{WT}}{{r}}_{\rm{WT}}{)} $ (12) where, Δr is the weight loss rate difference, and rBB and rWT are the weight loss rates of BB and WT, respectively. For both ΔW and Δr, positive values indicated a synergistic effect, whereas negative values indicated an inhibitory effect.
The interactions during the co-pyrolysis of BB and WT were evaluated by examining the activation energies through kinetic analysis. The theoretical E for the blend is given by[47]:
$ {{E}}_{\rm{Calc}}={{x}}_{\rm{BB}}{{E}}_{\rm{BB}}+{{x}}_{\rm{WT}}{{E}}_{\rm{WT}} $ (13) where, ECalc represents the calculated E of the blend, and EBB and EWT are the experimental activation energies for BB and WT, respectively.
Comparing the ECalc with the experimental E (EExp) reveals potential interactions. A lower EExp compared to the ECalc indicates a synergistic effect, suggesting that the blend reacts more easily than expected. Conversely, a higher EExp suggests an inhibitory effect.
-
The TG and DTG curves of BB, WT, and their 1:1 blend at final pyrolysis temperatures (Tfinal) of 500, 600, 700, 800, and 900 °C are shown in Fig. 2. The key parameters extracted from the TG and DTG curves are listed in Supplementary Table S1. For BB, major weight loss occurred within 250−450 °C range, reflecting its highly volatile matter and oxygen content, which promoted early devolatilization and rapid degradation. In contrast, the WT displayed more pronounced weight loss in the 400−500 °C range, consistent with its lower volatile matter, higher fixed carbon, and greater elemental carbon content, which together confer higher thermal stability. The blend of BB and WT exhibited intermediate behavior, with the primary devolatilization occurring between 270−520 °C, indicating a combined degradation process. Moreover, the residual yields decreased with increasing Tfinal, from 24.7% to 18.3% for BB, 41.3% to 36.0% for WT, and 32.2% to 27.1% for the blend, respectively. At 700 °C, the residual mass of all feedstocks was sufficiently low, indicating near complete pyrolysis; thus, 700 °C was selected as the final pyrolysis temperature for subsequent analyses.
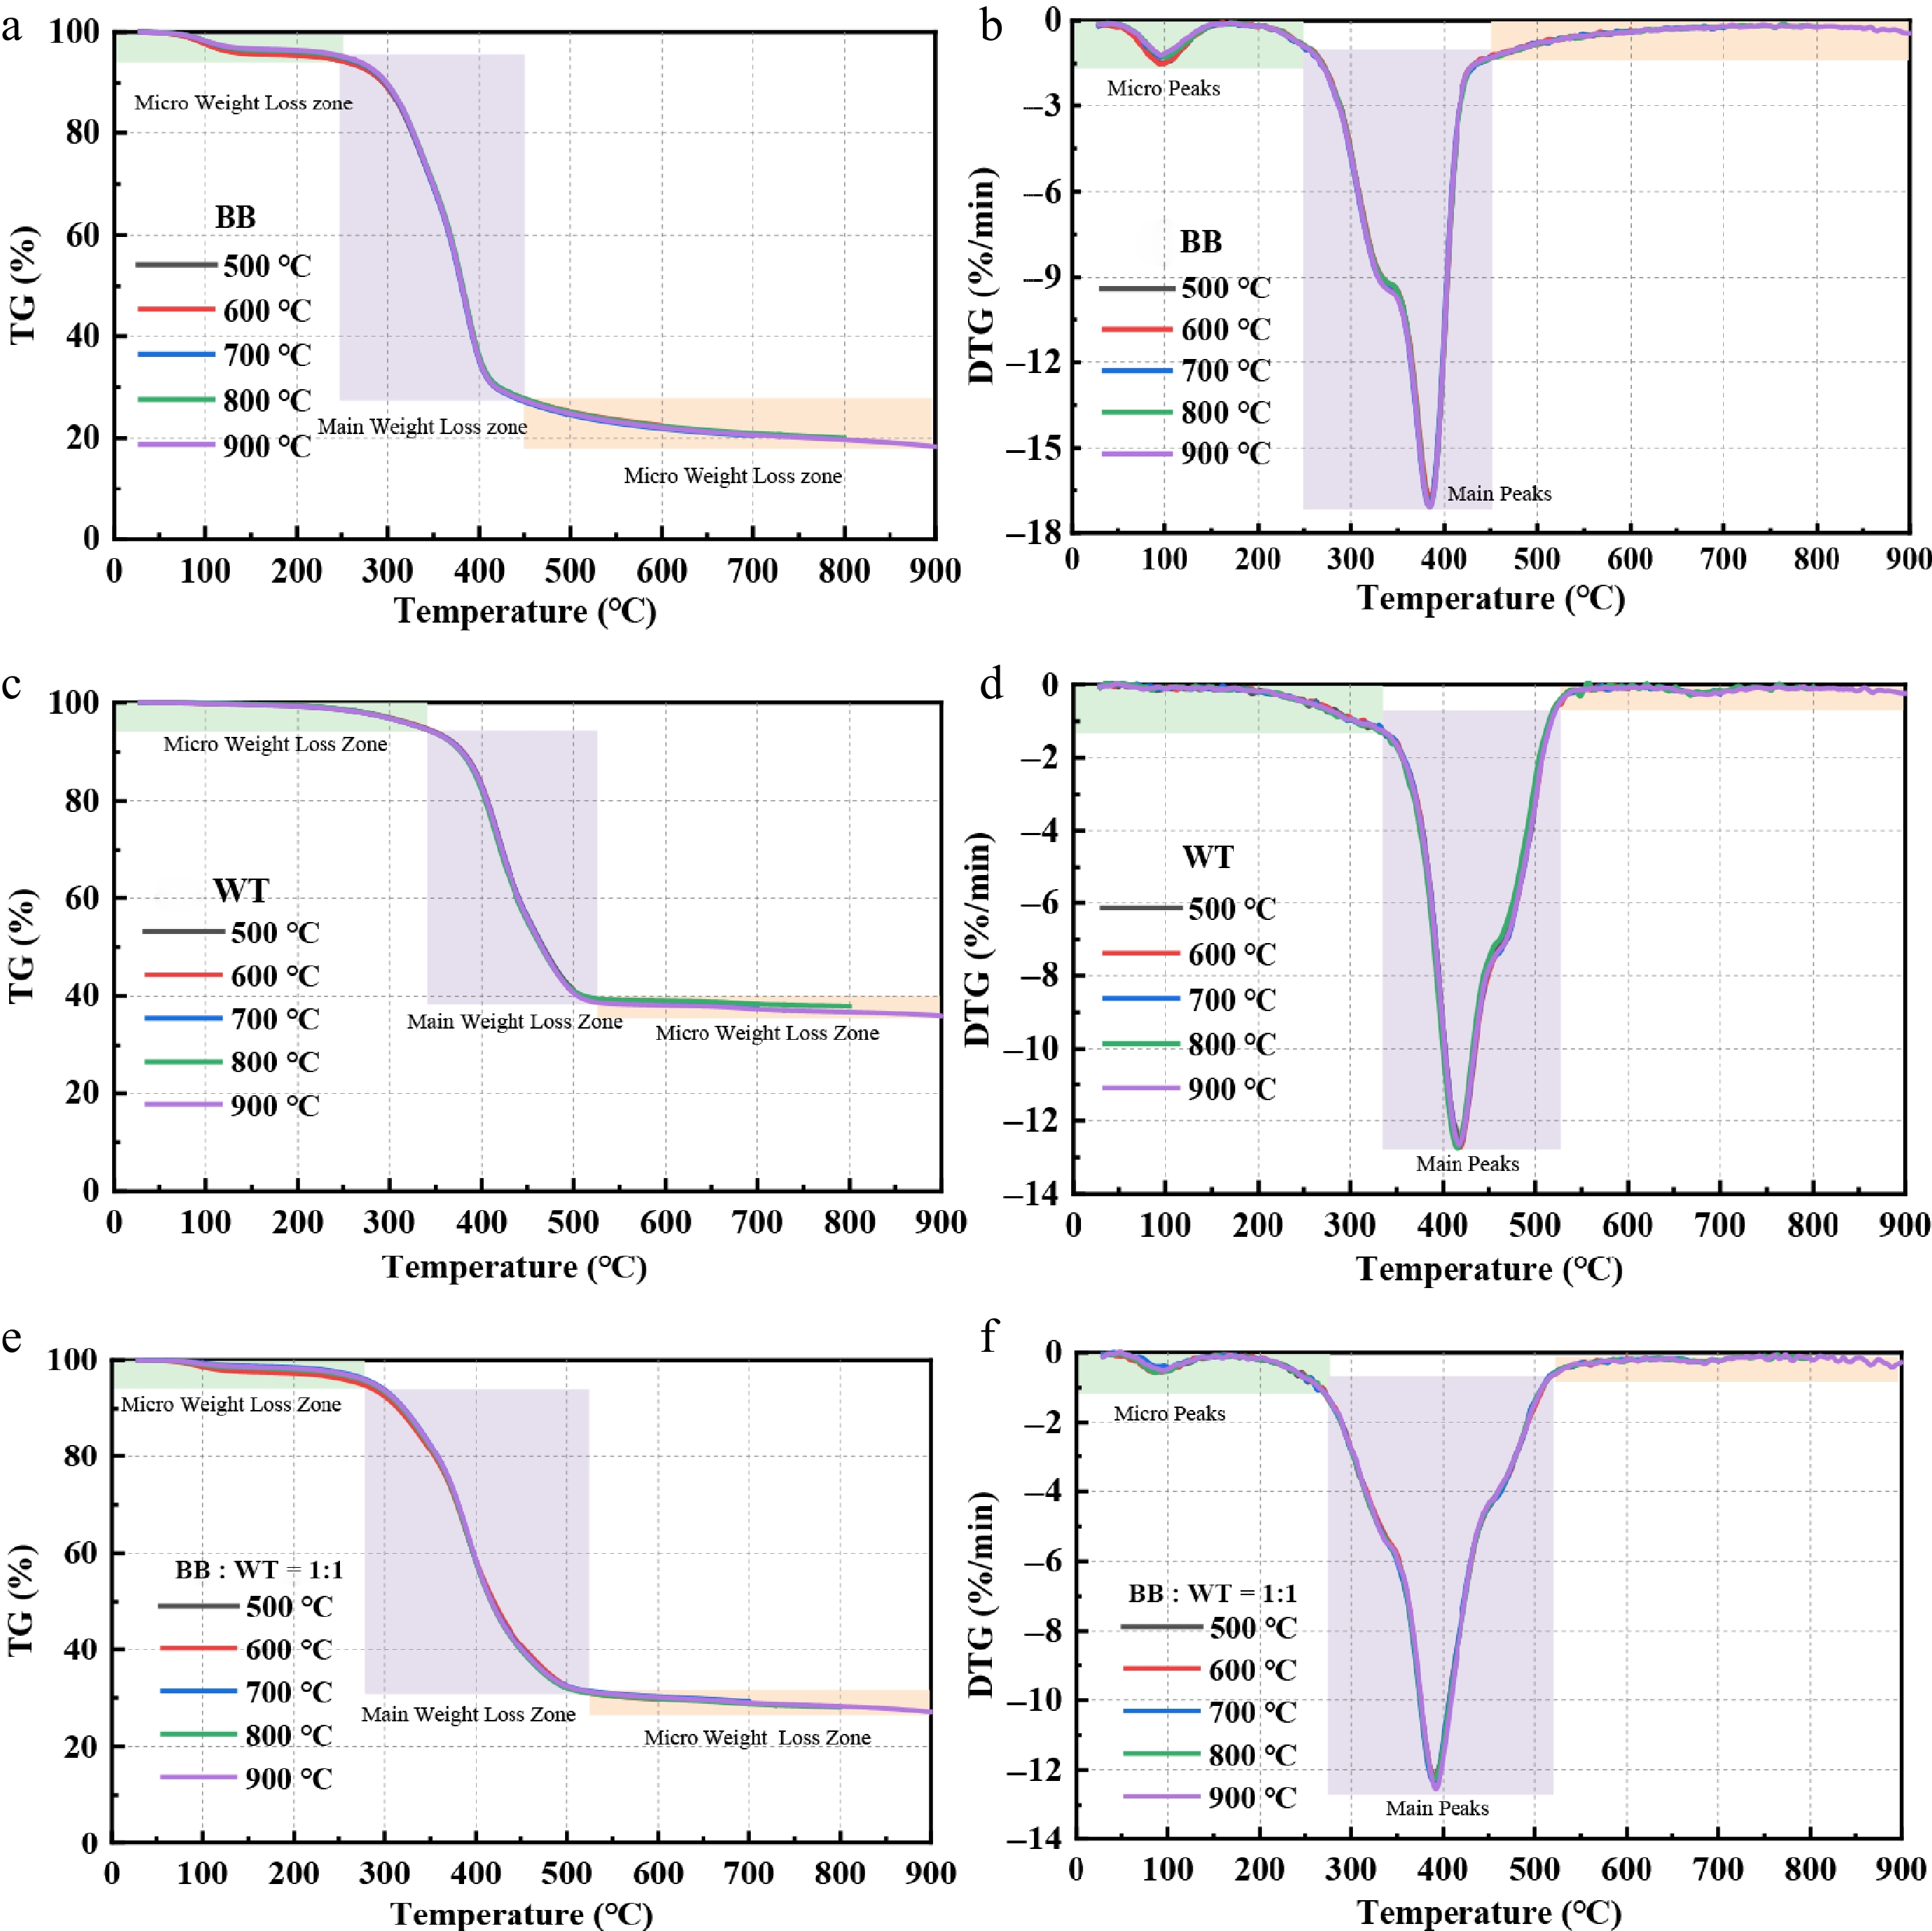
Figure 2.
TG and DTG curves of BB, WT, and their blends at different Tfinal.
The DTG curves provide further insights into the decomposition characteristics. For BB, two distinct peaks were observed: a minor peak at approximately 98 °C (Tp1), attributed to moisture volatilization, and a major peak at approximately 384 °C (the temperature for the maximum weight-loss rate, Tp2), corresponding to the main decomposition of organic materials. For WT, only a single dominant peak was detected at approximately 418 °C, indicating that the main degradation occurred at a slightly higher temperature range than that of BB. In contrast, the blend exhibited dual peaks, with a micro peak at approximately 94 °C, and a primary peak at approximately 390 °C, reflecting the combined effects of both components. The maximum weight-loss rates (MWLRs) for BB, WT, and the blend showed only minor variations with increasing Tfinal, indicating a consistent degradation behavior.
Effects of heating rates on TG characteristics
-
Figure 3 illustrates the TG and DTG curves for BB, WT, and their 1:1 blend at heating rates of 10, 20, 30, and 40 °C/min. As the heating rate increased, both the TG and DTG curves shifted towards higher temperature regions, accompanied by an increase in the MWLR's. For BB, the Tp2 increased from 362.5 °C at 10 °C/min to 409.67 °C at 40 °C/min (a shift of ~47 °C), whereas the MWLR increased from 8.66%/min to 32.86%/min. WT shows a slightly larger Tp2 shift, from 392.7 °C to 445.8 °C (~53 °C), with the MWLR increasing from 6.02%/min to 24.94%/min. The blend exhibited intermediate Tfinal behavior, with Tp2 shifting from 366.8 to 415.7 °C, and the MWLR increasing from 5.81% to 23.49%/min. Overall, higher heating rates delayed but intensified the decomposition across all samples, as reflected by the higher peak temperatures and increased weight loss rates. This behavior arises because faster heating reduces the time available for heat conduction within the sample and for volatile products to diffuse outward, thereby lowering the effective heat-transfer efficiency. Consequently, the interior of the particles experiences a thermal lag, requiring higher external temperatures to reach the same decomposition level. Once this threshold was exceeded, the accumulated energy release and volatile liberation occurred more abruptly, producing sharper DTG peaks and higher MWLR's.
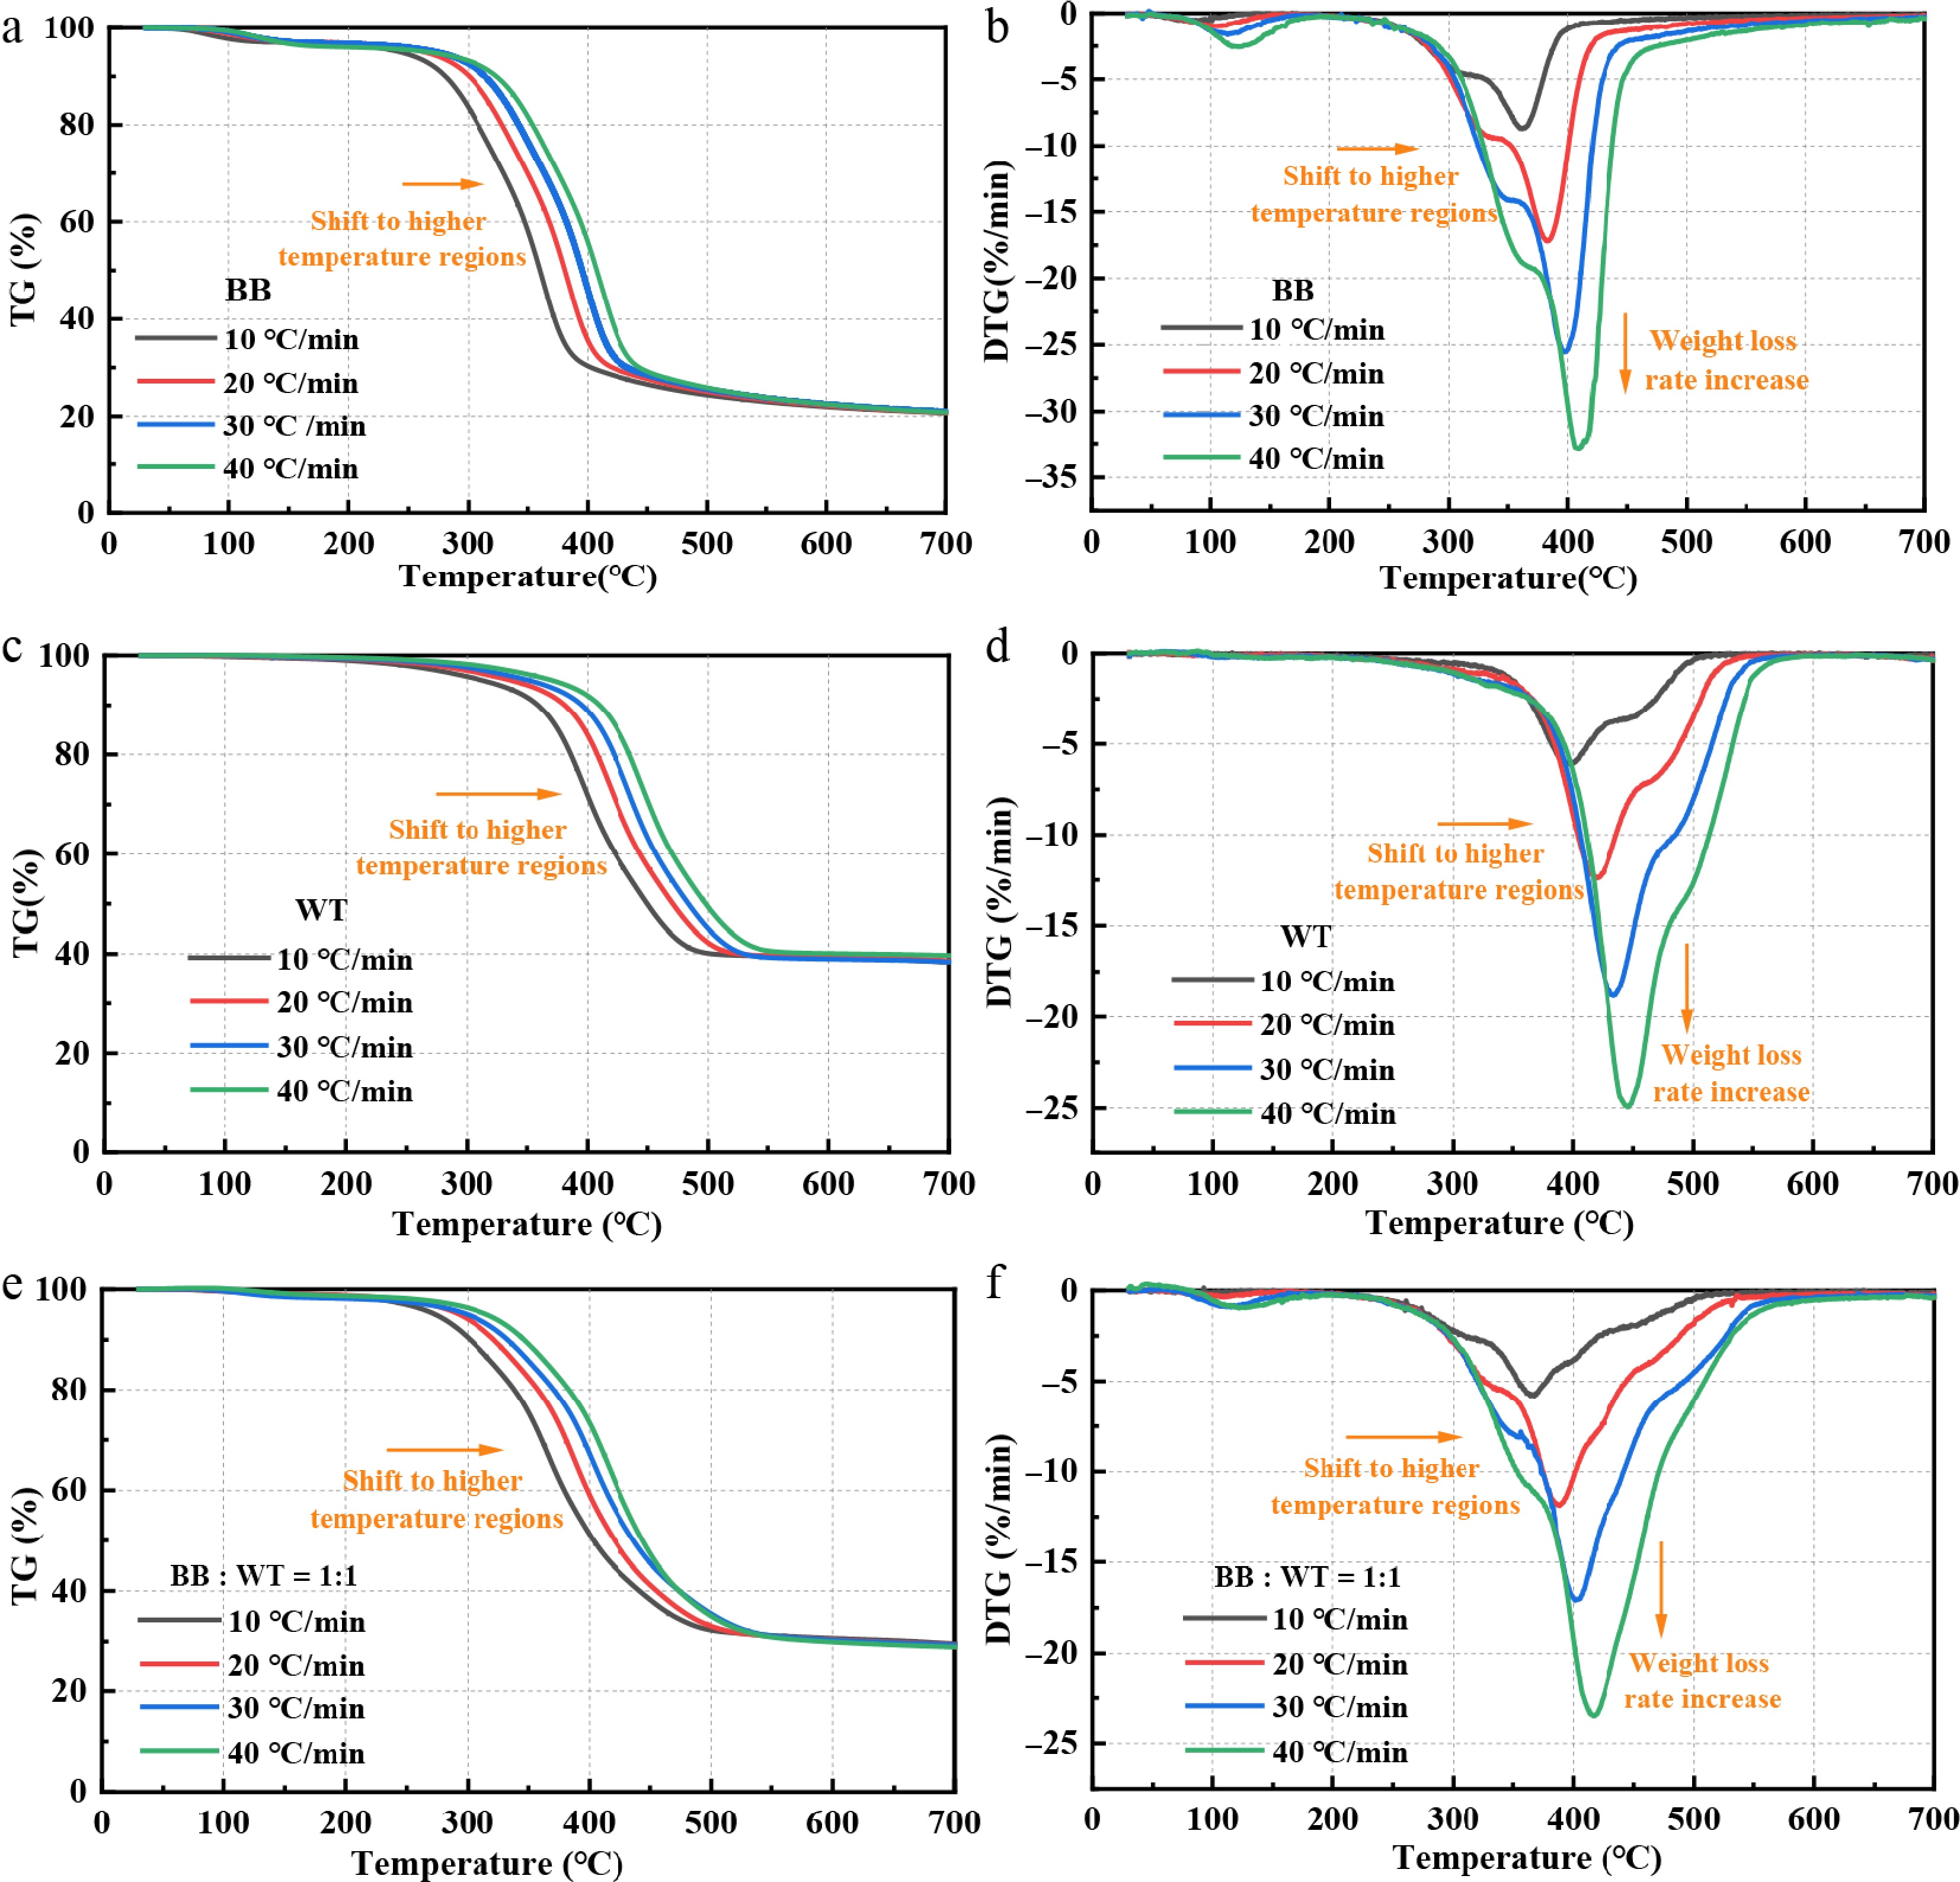
Figure 3.
TG and DTG curves of BB, WT, and their blends at different heating rates.
Effects of blending ratios on TG characteristics
-
Figure 4 shows the TG and DTG curves of the BB-WT blends at different blending ratios. These curves are crucial for understanding the influence of the blending ratio on the thermal degradation behavior of the samples. The key TG and DTG parameters are listed in Supplementary Table S1. The TG curves in Fig. 4a show that the thermal degradation profiles of the BB-WT blends varied significantly with different blending ratios. As the proportion of WT increased, the TG curves shifted towards higher temperatures, and the overall weight loss decreased gradually from 79.5% to 70.73%, reflecting the combined thermal behaviors of BB and WT. The DTG curves in Fig. 4b show that with increasing WT content, the DTG curves also shift towards higher temperatures, but the Tp2 remains largely unchanged, whereas the MWLR decreases. These findings suggest possible interactions between BB and WT during co-pyrolysis.
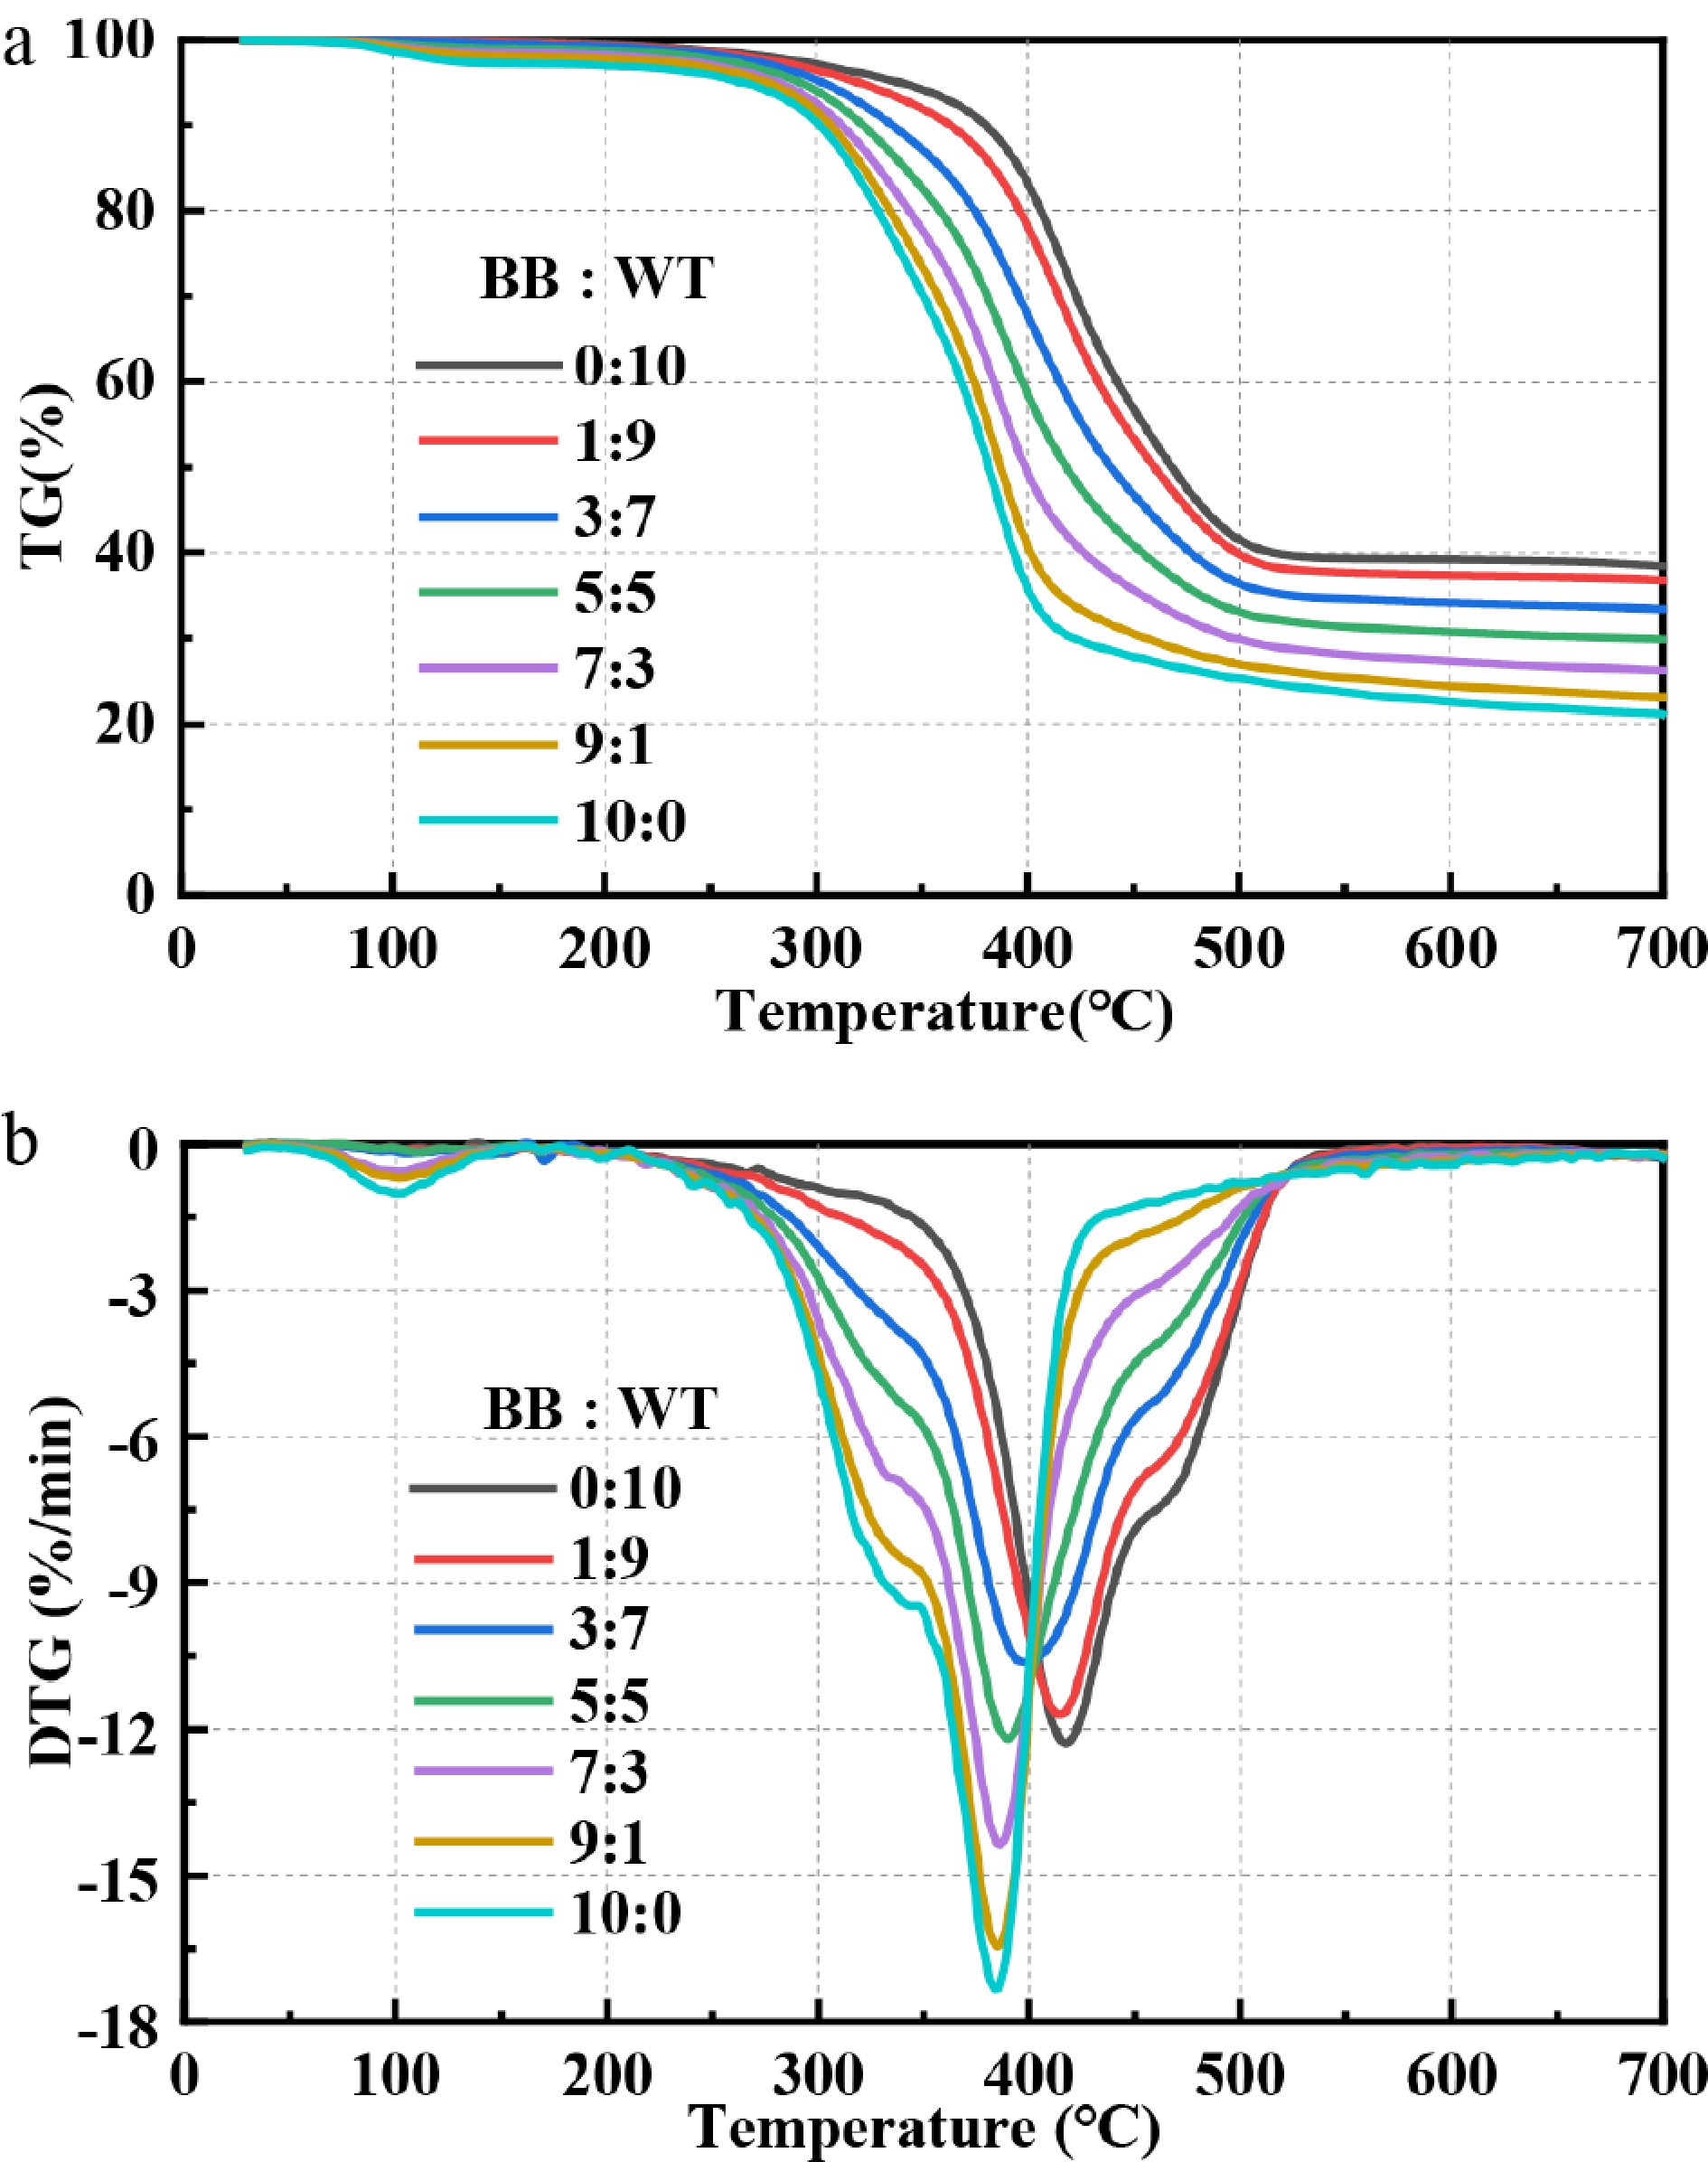
Figure 4.
TG and DTG curves of BB-WT blends at different blending ratios.
The interactions of co-pyrolysis
-
ΔW and Δr were employed to assess the potential synergistic or inhibitory effects during BB-WT co-pyrolysis. As shown in Fig. 5, the ΔW curves indicate the deviation of the actual weight loss from the predicted weight loss based on the individual components. At lower temperatures (below 300 °C), the ΔW values were negative and relatively stable for all blends, indicating negligible interactions in this temperature range. However, between 300 and 500 °C, ΔW fluctuated between negative and positive values, indicating pronounced synergistic effects[47]. The first peak reached its minimum at approximately 350 °C, whereas the second peak was generally positive, with the largest ΔW variations observed for the 3:7 and 5:5 blends, suggesting the highest degree of synergy. Above 500 °C, the ΔW values stabilized, implying that the interactions played a minor role at these higher temperatures. Similarly, the Δr values provide complementary insights. At temperatures below 300 °C, the Δr values remained close to zero, suggesting minimal interaction. With increasing temperature, the Δr values became more pronounced, fluctuating between negative and positive in the 300–500 °C range. Marked positive Δr peaks were observed for the 3:7 and 5:5 blends, reinforcing the synergistic effect inferred from the ΔW analysis. The synergy is attributed to radical interactions where hydrogen donors from WT quench BB-derived oxygenated radicals (e.g., phenoxy radicals)[48], facilitating the observed deoxygenation (reduced phenols/ketones) and enhanced olefin formation (TG-GC/MS analysis of evolved volatiles during co-pyrolysis).
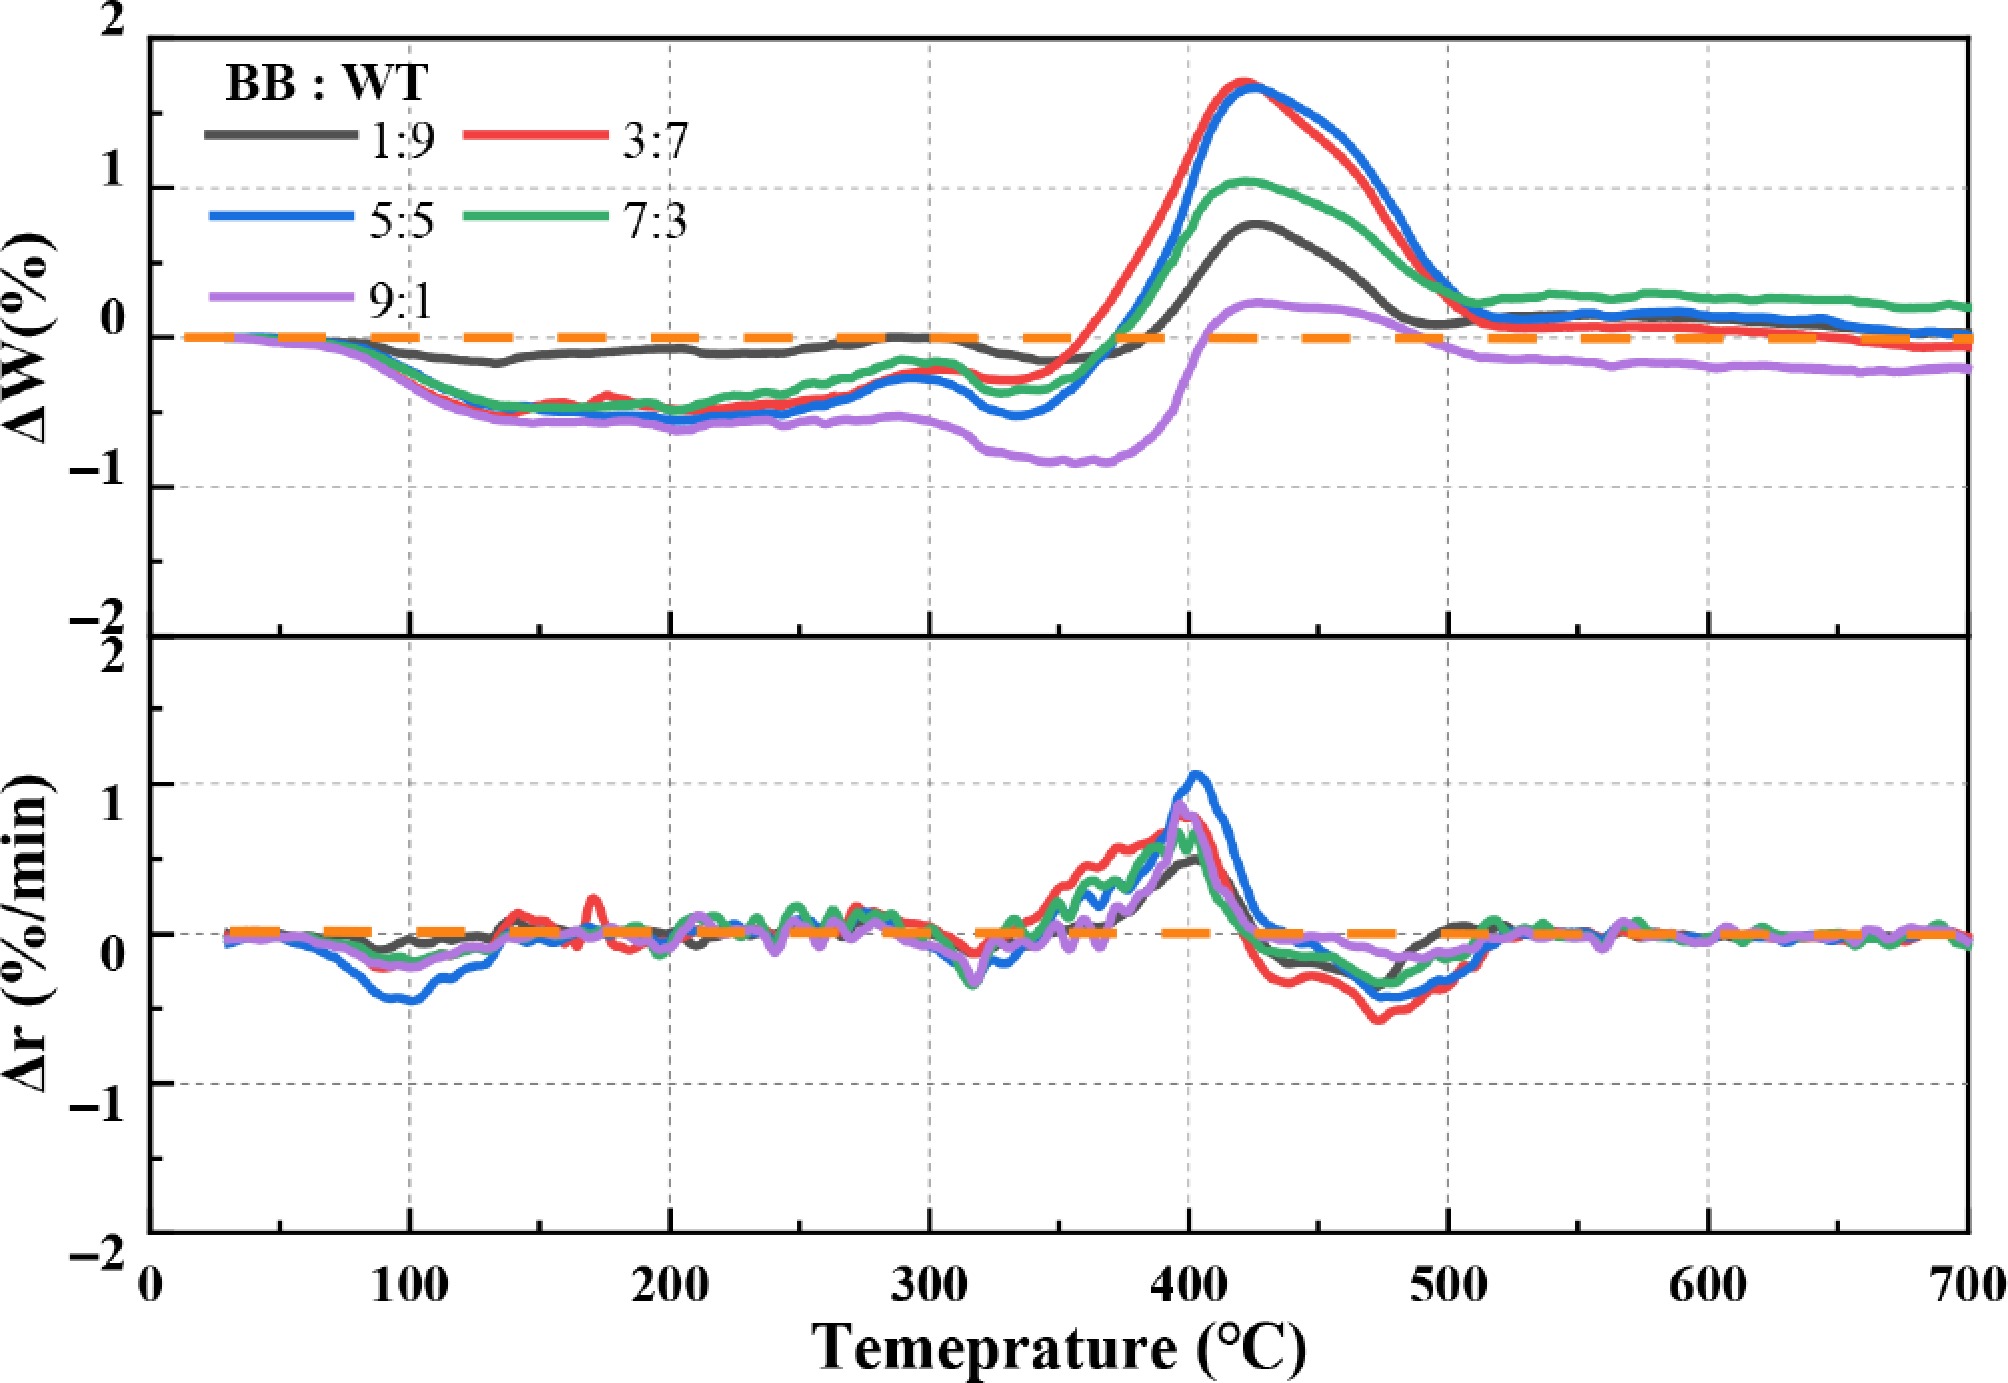
Figure 5.
Interactions during the co-pyrolysis of BB-WT blends.
The variations in ΔW and Δr between 300 and 500 °C can be attributed to several factors. First, the release and subsequent interactions of volatile compounds from BB and WT likely accelerated the overall degradation process, as reflected by negative ΔW and positive Δr values. This indicates that more volatile products were generated and decomposed than expected, highlighting the synergistic effects between the components. Second, the coexistence of BB and WT alters pyrolysis reaction pathways, further contributing to synergistic effects. Finally, the stability of the char structure plays a crucial role. At higher temperatures (above 400 °C), positive ΔW and negative Δr values suggest the formation of a more stable char. This stabilization can be linked to amorphous carbon deposition and hydrodeoxygenation reactions, which reduce the porosity and reactivity of the char[49]. Consequently, the char yield increased, whereas the degradation rate was suppressed, leading to an inhibitory effect. Collectively, these factors demonstrate the complex interplay between BB and WT during co-pyrolysis, where both synergistic and inhibitory effects emerge, depending on temperature.
TG-FTIR analysis of evolved volatiles during co-pyrolysis
-
Supplementary Fig. S2 presents the 3D FTIR spectra of gaseous products evolved during the co-pyrolysis of BB and WT at various blending ratios. The main absorption bands include -CH3 stretching/bending (2,932 and 1,456 cm−1), =C-H wagging (892 cm−1), aromatic ring vibration, and C-H out-of-plane bending (1,508 and 668 cm−1), carbonyl groups (1,750−1,796 cm−1), and CO2 (2,324/2,360 cm−1), as shown in Table 3. Figure 6 shows the FTIR spectra of the volatile products released during the co-pyrolysis of BB and WT at different blending ratios. Hydrocarbon peaks (2,932 and 1,456 cm−1) were most intense in pure WT, but became weaker as the BB content increased; nevertheless, their onset shifted to lower temperatures and broadened at BB : WT = 3:7 and 5:5, indicating that oxygenated radicals from BB facilitated the earlier scission of WT chains. The olefinic band (892 cm−1) similarly showed maximum intensity in the WT-rich blends, but was suppressed and shifted under intermediate ratios, suggesting further conversion to aromatics. The aromatic bands exhibited complementary behaviors: the 668 cm−1 signal was strongest in BB-rich blends, and weakened with WT addition, while the 1,508 cm−1 band remained dominant in BB and extended to higher temperatures. At BB : WT = 3:7 and 5:5, the 1,508 cm−1 peak broadened and the 668 cm−1 peak shifted, reflecting the accelerated aromatization of BB fragments by hydrogen/alkyl radicals from WT, and partial suppression of condensation at high temperatures.
Table 3. Characteristic wavenumber bands of functional groups and evolved gases.
Wavelength (cm−1) Functional group Species assignment Ref. 2,932 −CH3, stretching vibration Hydrocarbons [50] 2,324/2,360 C=O, stretching vibration CO2 [51] 1,796, 1,774,
and 1,750−C=O, stretching vibration Aldehydes and
ketones[50] 1,508 Aromatic ring vibration Aromatic [50] 1,456 −CH3, bending vibration Hydrocarbons [50] 892 =C–H, wagging vibration Alkene [52] 668 −C–H, out-of-plane bending Benzene [53] 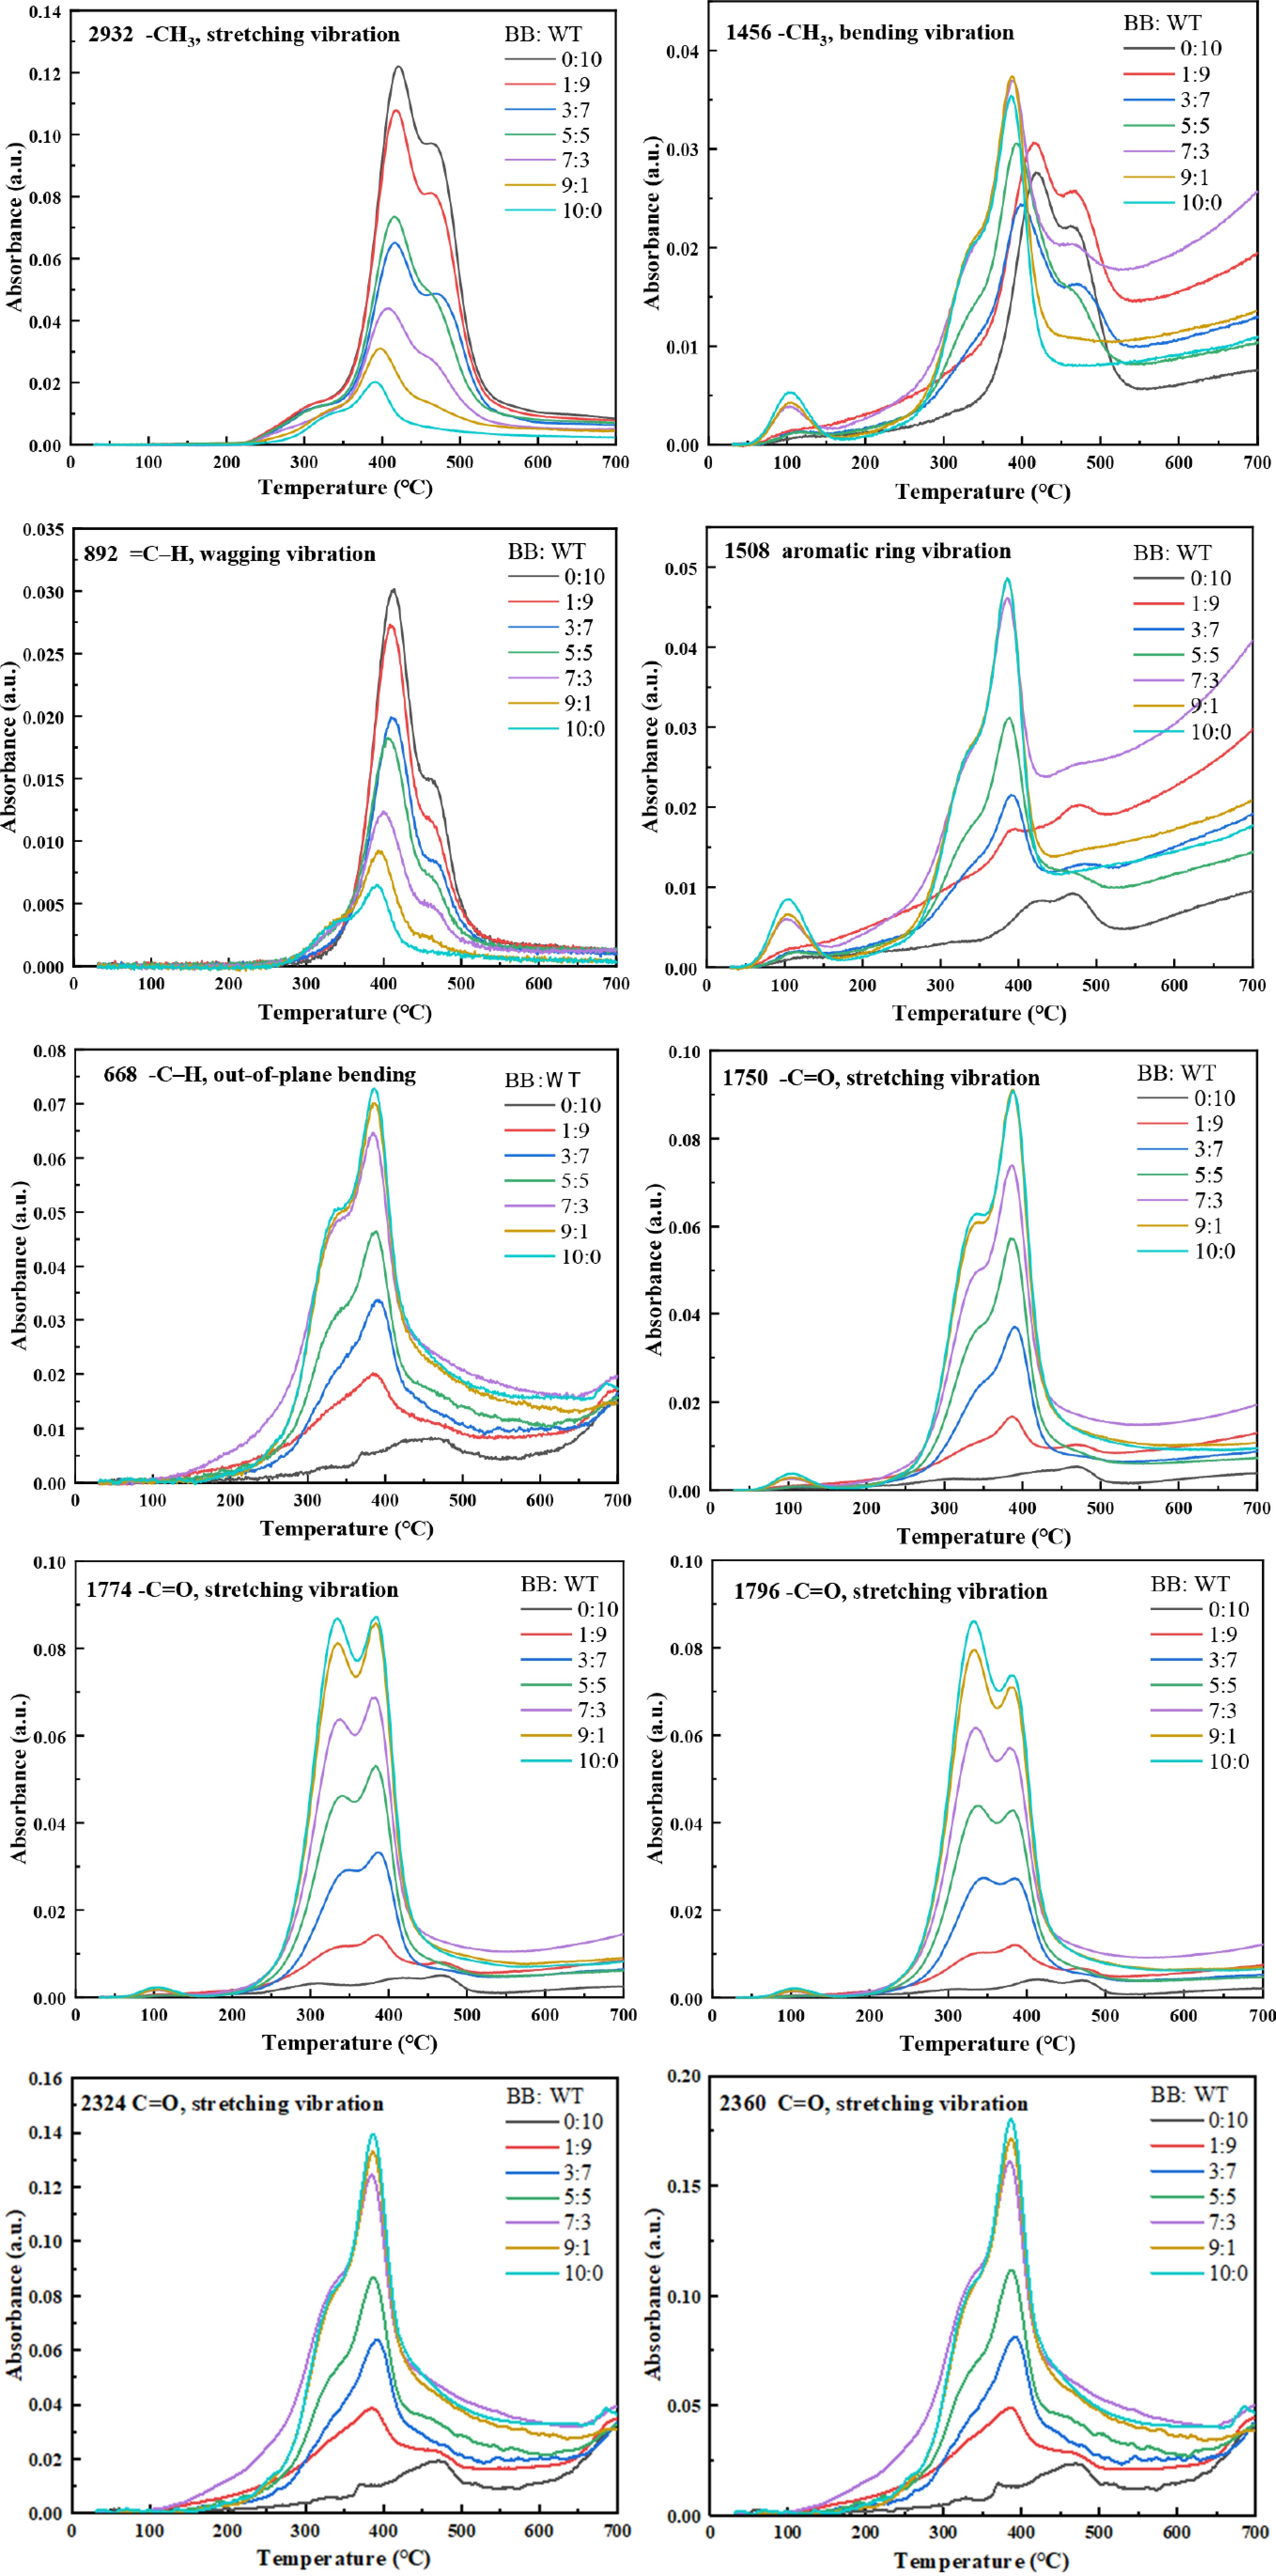
Figure 6.
FTIR evolution of characteristic functional groups with temperature during co-pyrolysis of BB-WT blends.
As shown in Fig. 6, for oxygen-containing volatiles, the carbonyl bands (1,750−1,796 cm−1) were the strongest and most persistent in BB-rich blends, consistent with the release of aldehydes and ketones from polysaccharides and lignin. At BB:WT ratios of 3:7 and 5:5, the carbonyl signals were clearly reduced compared to those in the BB-rich blends and displayed an earlier decline, suggesting that the hydrogen/alkyl radicals from WT facilitated the destabilization and conversion of these oxygenates. Correspondingly, the CO2 bands (2,324/2,360 cm−1) remained relatively strong at these intermediate ratios and exhibited a slight forward shift, whereas their intensity decreased significantly in the WT-rich blends. These results imply that the presence of WT promoted more efficient deoxygenation of BB intermediates, converting unstable oxygenates into CO2 and thereby suppressing secondary condensation and char formation. Overall, the co-pyrolysis of BB and WT demonstrated distinct synergistic effects: oxygenated radicals from BB lowered the activation barrier for WT degradation, whereas hydrogen donors from WT enhanced the deoxygenation of BB intermediates. Synergy was most pronounced at BB:WT ratios of 3:7 and 5:5, where earlier and broader hydrocarbon/aromatic release coincided with efficient deoxygenation, outperforming either the BB- or WT-rich extremes.
Figure 7 presents the FTIR spectra of the gaseous products evolved during the co-pyrolysis of BB and WT at Tp2. Hydrocarbon bands (-CH3 stretching at 2,932 cm−1 and -CH3 bending at 1,456 cm−1) were the strongest in WT-rich blends and decreased progressively with increasing BB, indicating less aliphatic fragment release at Tp2. The olefinic band at 892 cm−1 was likewise the most intense in the WT-rich samples and weakened as BB increased. In contrast, the aromatic bands at 1,508 cm−1and 668 cm−1 were more pronounced in the BB-rich blends, reflecting lignin-derived aromatics. The carbonyl bands (1,750−1,796 cm−1) were also enhanced with increasing BB content, and the CO2 signals at 2,324/2,360 cm−1 were relatively strong for the BB-rich and intermediate ratios. By integrating the FTIR peak areas of different mixtures at temperature Tp2, a semi-quantitative analysis was conducted on the variation in the ratio of carbonyl bands/hydrocarbon bands. For BB:WT ratios of 0:10, 1:9, 3:7, 5:5, 7:3, 9:1, and 10:0, the ratios were 0.012, 0.027, 0.076, 0.227, 0.344, 0.400, and 0.465, respectively. Overall, the spectra at BB:WT = 3:7 and 5:5 displayed coexisting features-appreciable hydrocarbons together with carbonyls and CO2, indicating concurrent WT chain scission and BB deoxygenation at Tp2. This compositional balance is consistent with the synergistic interactions inferred from Fig. 6. Oxygenated radicals from BB assist WT scission, whereas WT-derived hydrogen/alkyl radicals facilitate the deoxygenation of BB intermediates.
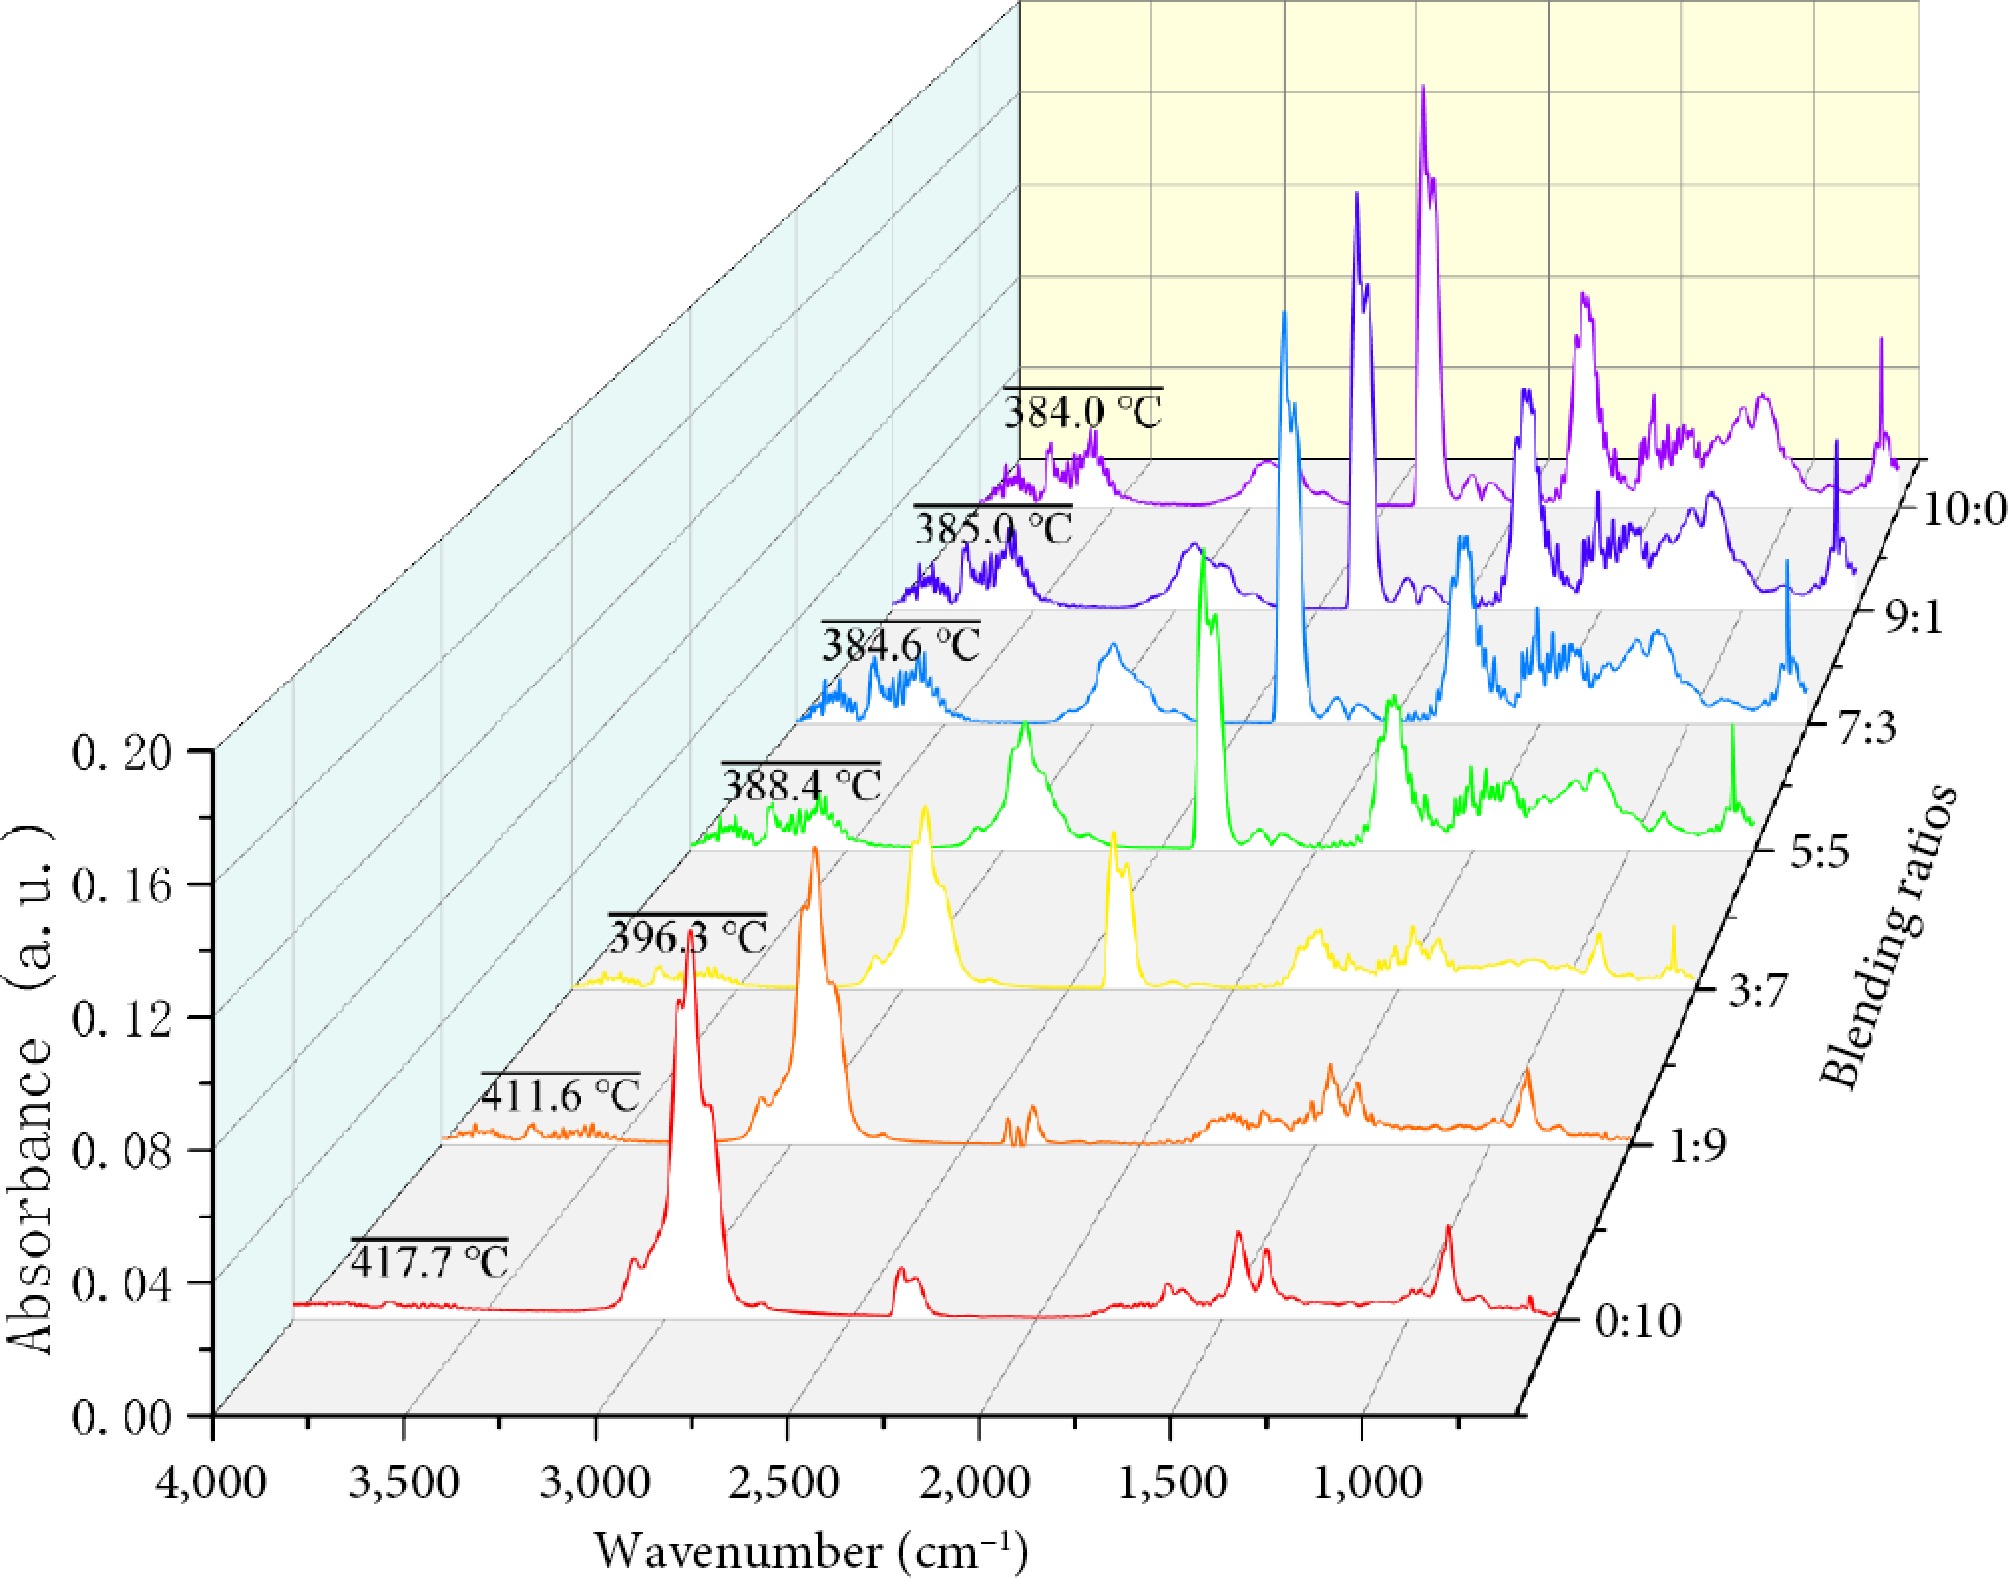
Figure 7.
FTIR spectra of Tp2 during co-pyrolysis.
TG-GC/MS analysis of evolved volatiles during co-pyrolysis
-
Figure 8 and Supplementary Table S2 show the GC/MS chromatograms of the volatile products at Tp2 for different BB:WT ratios. Clear compositional differences were observed among the blends. For pure WT, hydrocarbons dominated the spectrum, with styrene contributing 2.07%, and cyclohexene derivatives reaching 31.09%, originating mainly from the decomposition of polystyrene and styrene-butadiene rubber. In contrast, pure BB yielded predominantly oxygenated compounds, including 1,2-cyclopentanedione (11.52%), phenol (16.59%), and 2,6-dimethoxyphenol (9.66%), which reflect the degradation pathways of cellulose and lignin. At intermediate ratios, particularly 3:7 and 5:5, the composition shifted toward a more balanced volatile compound profile. For example, at 5:5, the relative content of 1,4-dimethyl-2-ethylbenzene reached 7.83%, whereas that of 2,6-dimethoxyphenol decreased to 2.63%. Similarly, at 3:7, cyclohexene derivatives remained abundant, whereas phenolic oxygenates were much less prominent than those in BB alone. These observations demonstrate that co-pyrolysis moderates the extremes of each feedstock, reducing the overproduction of phenolics from BB, while maintaining substantial amounts of hydrocarbons from WT.
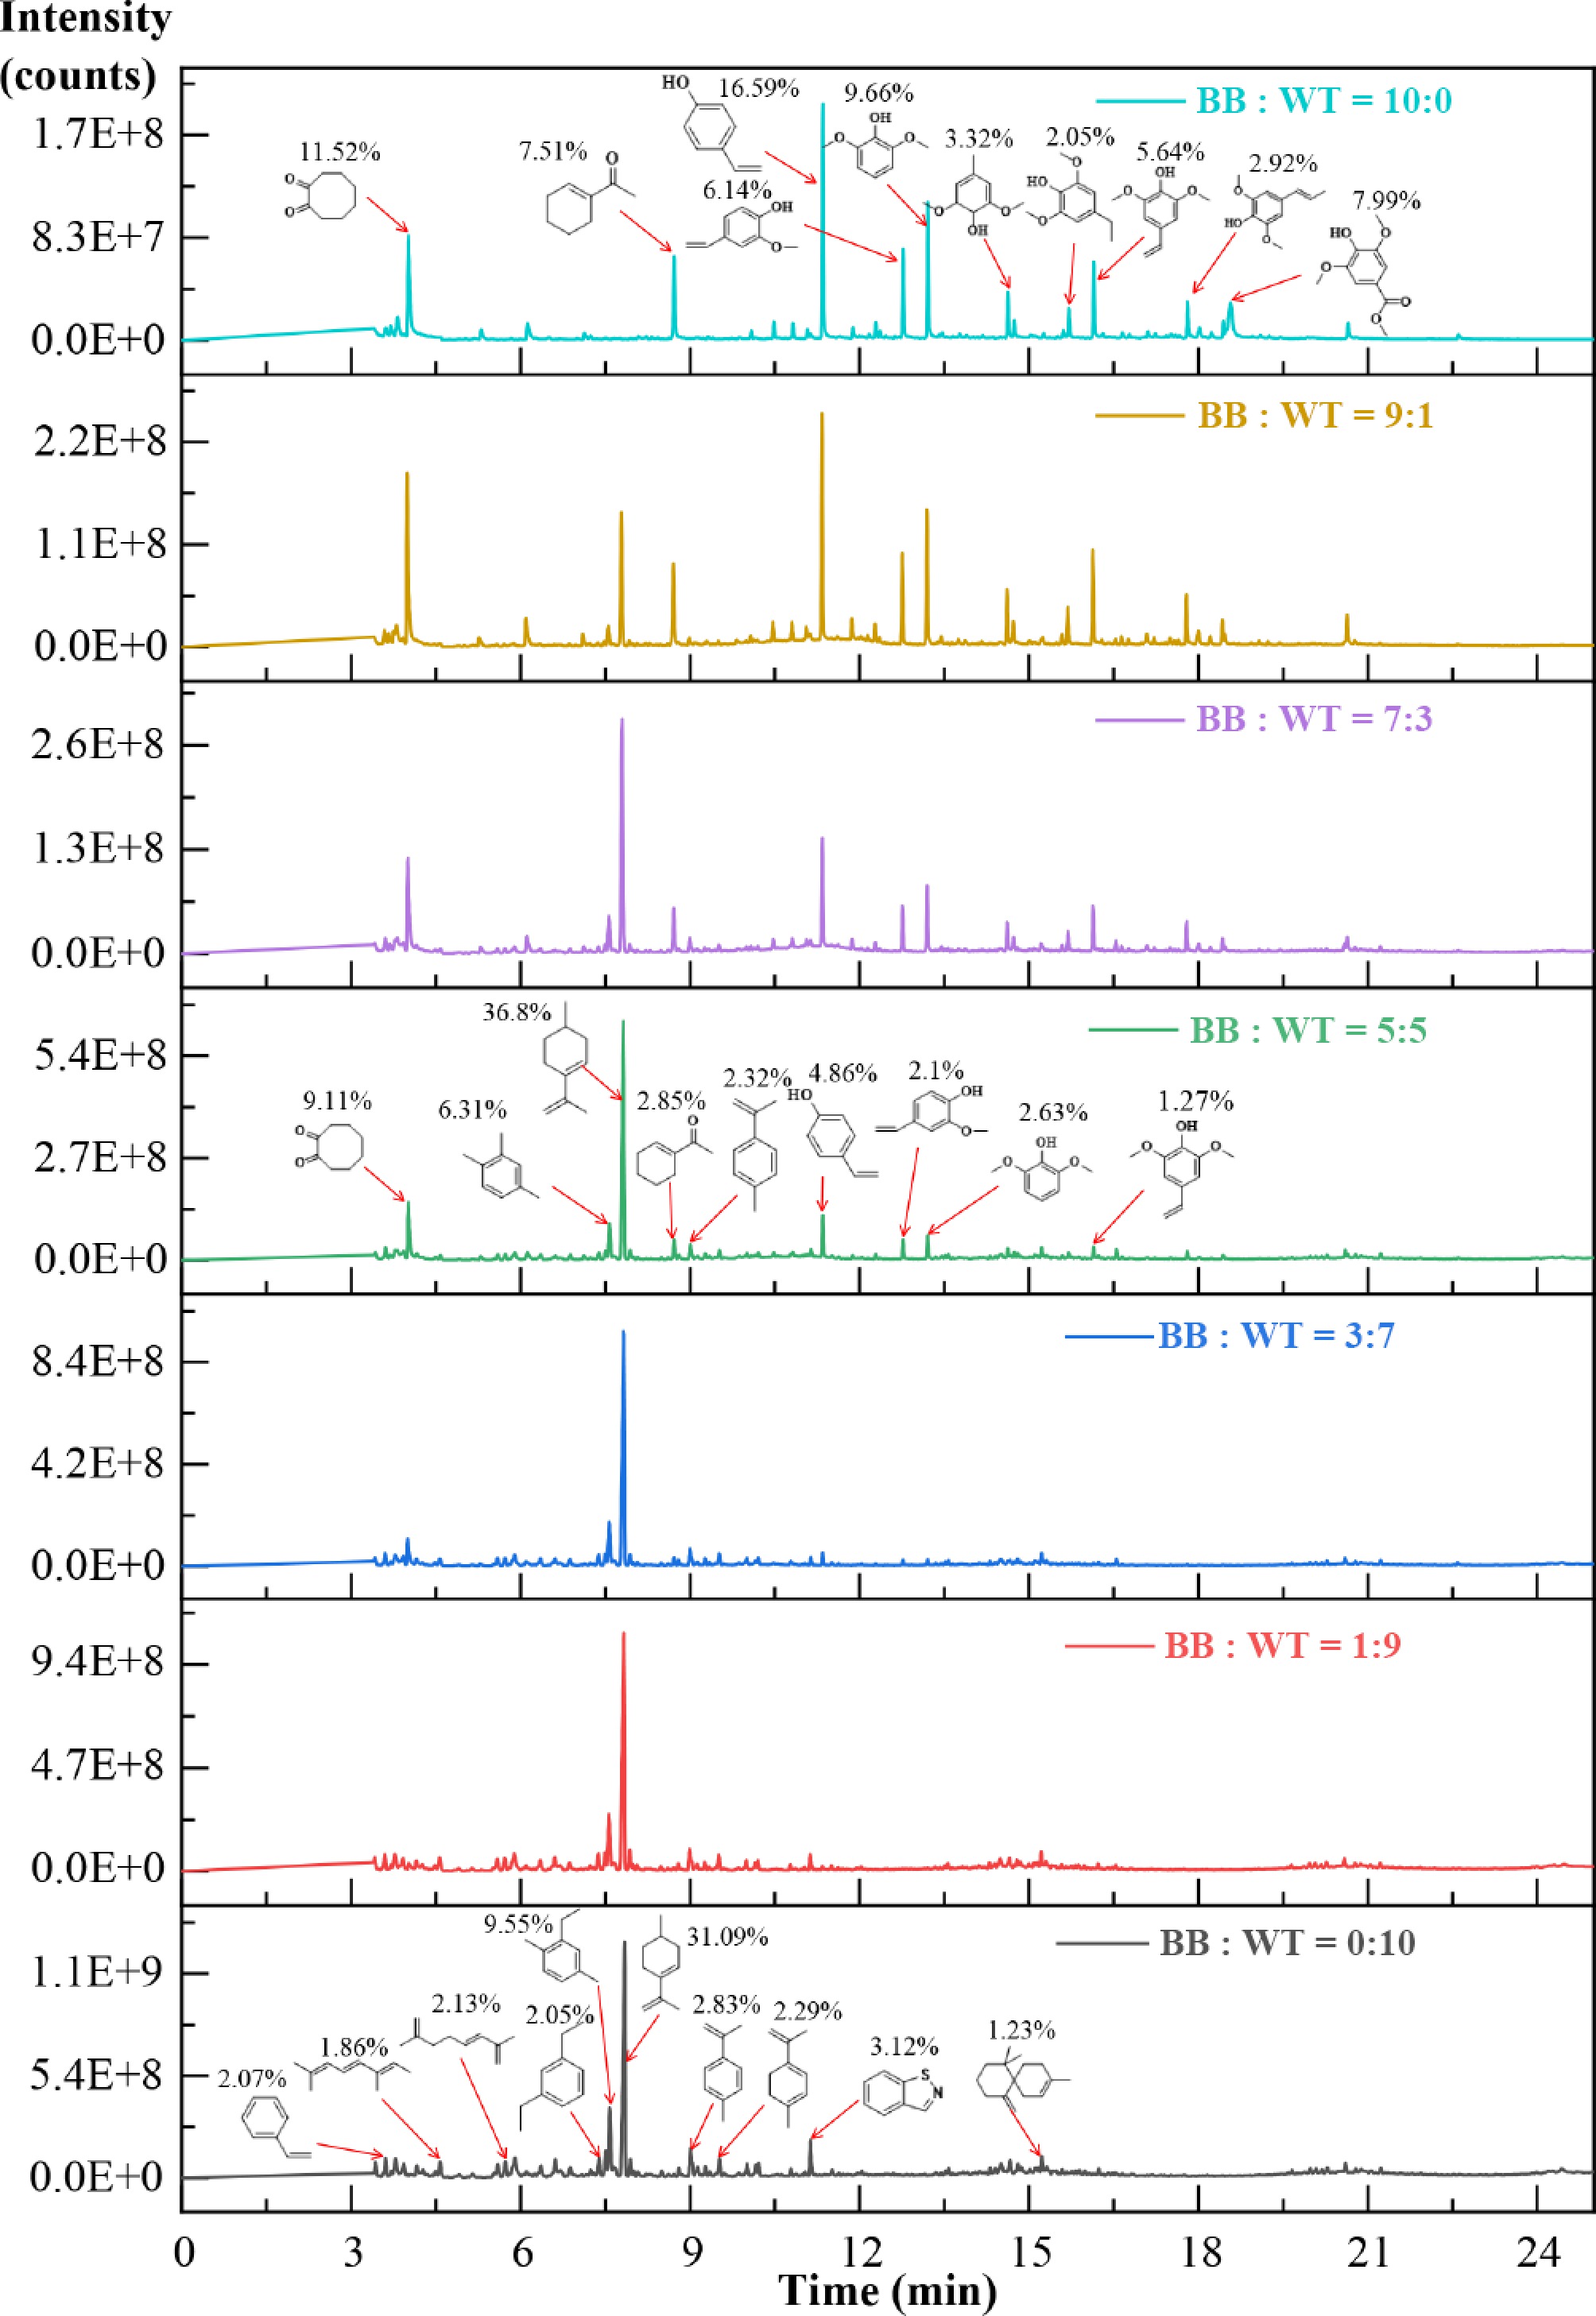
Figure 8.
GC/MS of Tp2 during co-pyrolysis.
Figure 9 illustrates the relative distribution of the major product groups at different BB:WT ratios. Pure WT produced mainly hydrocarbons, with alkenes and aromatic hydrocarbons accounting for 63.49% and 14.43%, respectively, together making up nearly 80% of the products, whereas oxygenates were negligible. In contrast, pure BB yielded mostly oxygenated compounds, with phenols reaching 52.37% and ketones 24.72%, with no alkenes detected. With increasing BB fraction, phenols, and ketones became more prominent, whereas hydrocarbons decreased, reflecting the distinct pyrolysis behaviors of biomass and plastics. A clear synergistic effect emerged at intermediate ratios, particularly at 3:7 and 5:5. Compared with pure BB (phenolics 52.37%, ketones 24.72%), both phenolics and ketones were markedly suppressed, whereas hydrocarbons remained substantial. At the 5:5 ratio, phenolics decreased to 12.42%, ketones to 13.37%, and alkenes contributed 51.91%. Similarly, at the 3:7 ratio, phenolics decreased to 2.65% and ketones to 5.96%, whereas alkenes accounted for 61.18%. This balanced distribution can be explained by radical interactions, where hydrogen-rich fragments from WT promote the deoxygenation of BB-derived intermediates, reducing unstable phenolics, whereas oxygen-centered radicals from BB facilitate chain scission in WT, enhancing the release of aromatics and alkenes. The 3:7 and 5:5 blends provided the most favorable outcomes, simultaneously improving fuel quality through lower oxygen content and higher hydrocarbon yield, while retaining moderate oxygenates of chemical value, underscoring the synergistic benefits of BB-WT co-pyrolysis.
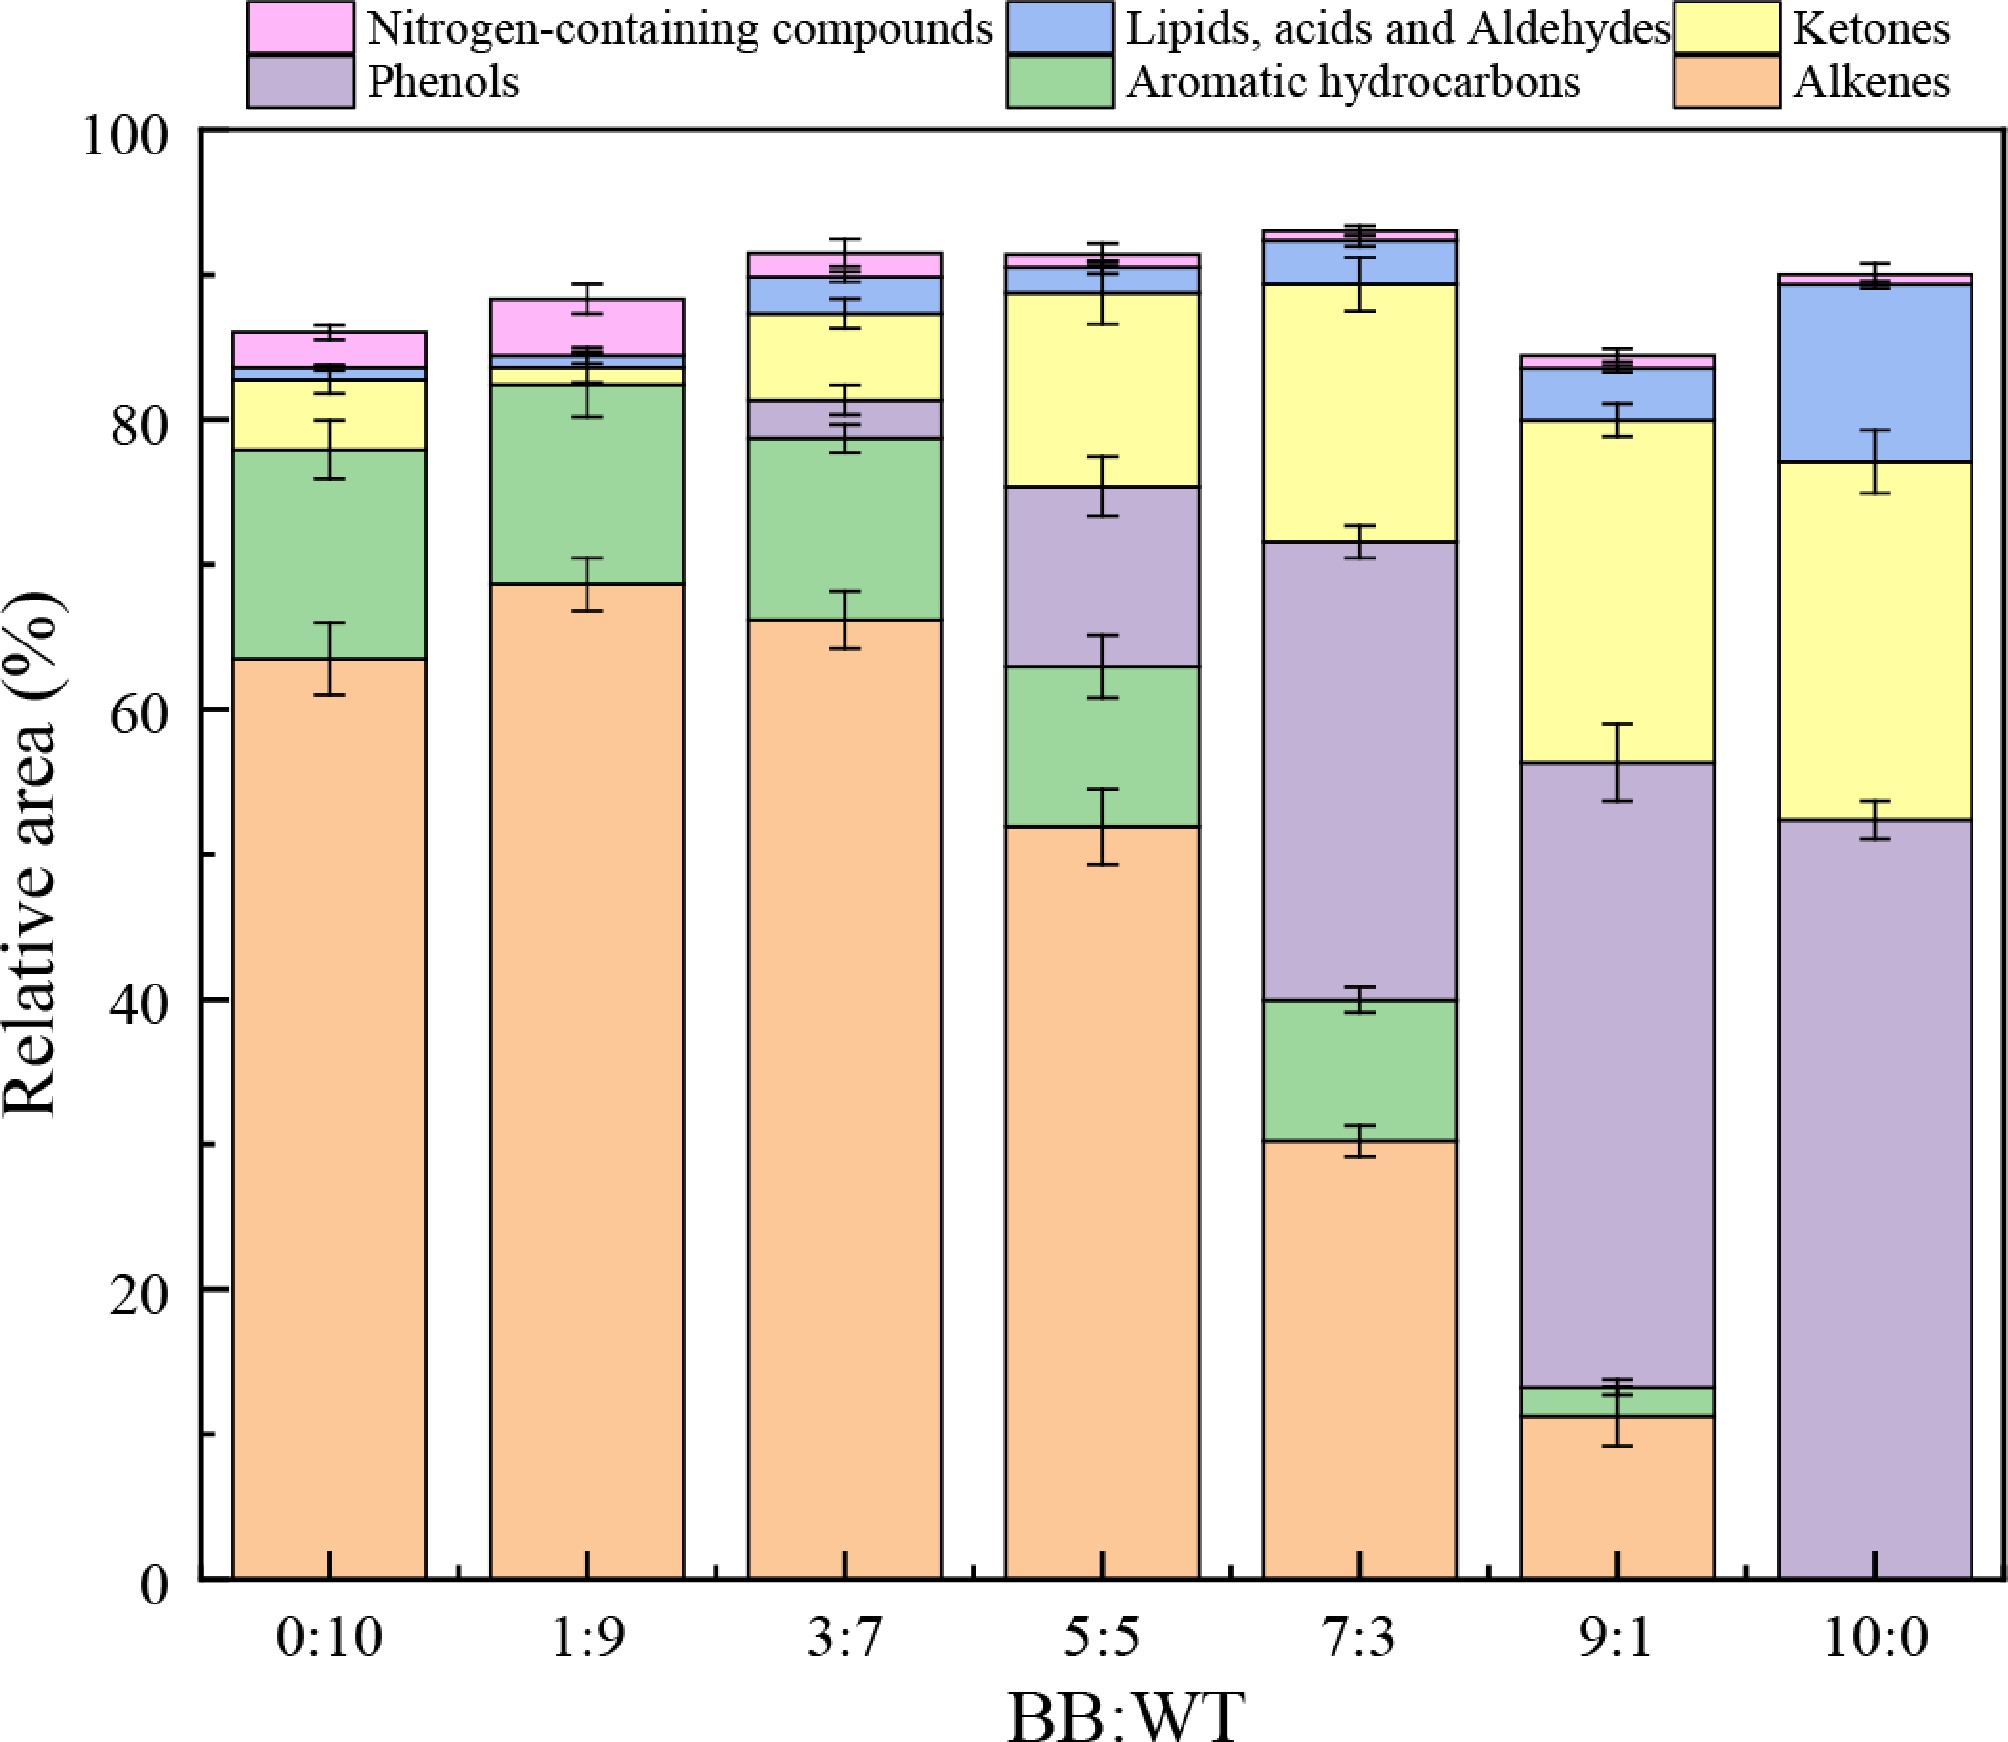
Figure 9.
Relative percentage of chemical compounds in co-pyrolysis of BB and WT.
Pyrolysis kinetics analysis
Estimation of activation energy
-
The
$ {\mathrm{E}}_{ \alpha } $ $ {{E}}_{ \alpha } $ Table 4. E of BB, WT, and their blend at different conversion.
α BB WT BB : WT = 1:1 KAS FWO Friedman KAS FWO Friedman KAS FWO Friedman 0.1 80.0 84.9 73.3 75.9 82.0 95.7 80.8 85.9 82.2 0.15 78.7 83.9 81.5 88.2 94.2 104.9 83.8 89.1 90.9 0.2 80.8 86.2 87.9 93.6 99.5 108.9 87.9 93.2 98.2 0.25 82.4 87.8 92.1 97.2 103.0 111.3 91.7 97.0 101.3 0.3 84.6 90.1 95.8 99.7 105.5 114.0 94.1 99.5 100.3 0.35 87.6 93.0 98.3 102.0 107.7 116.8 95.3 100.8 100.0 0.4 90.9 96.3 99.6 104.2 109.9 118.8 96.6 102.1 104.8 0.45 91.8 97.2 97.9 106.2 111.9 121.6 98.1 103.7 107.0 0.5 93.1 98.6 98.5 108.6 114.3 125.4 100.0 105.5 112.8 0.55 94.1 99.7 102.8 111.4 117.0 131.7 102.8 108.3 120.9 0.6 95.2 100.7 103.4 115.0 120.6 136.4 107.2 112.6 130.9 0.65 95.9 101.5 105.3 119.5 124.9 139.6 112.7 118.0 135.3 0.7 96.6 102.3 112.5 123.9 129.2 140.9 118.3 123.4 139.7 0.75 98.2 103.9 121.1 127.2 132.5 139.4 125.3 130.2 152.1 0.8 101.0 106.6 121.1 130.0 135.2 139.4 136.4 141.0 167.2 0.85 109.3 114.6 147.9 132.3 137.6 141.8 145.9 150.2 159.0 0.9 154.5 158.1 186.9 135.4 140.7 146.4 149.1 153.6 154.3 Average 95.0 100.3 107.4 110.0 115.6 125.5 107.4 112.6 121.0 As shown in Fig. 10, Eα for all three materials exhibited an upward trend with conversion, although with distinctly different growth rates. For BB (Fig. 10a), the Ea increases steadily as α rises from 0.1 to 0.8, followed by a sharp escalation at higher conversion. This behavior reflects the sequential decomposition of hemicellulose, cellulose, and finally lignin-rich aromatic structures, which require progressively higher energy barriers. In the case of WT (Fig. 10b), there was a consistent, nearly linear increase in Eα from 80 to 140 kJ/mol across the entire conversion range, consistent with the staged scission of natural rubber and styrene-butadiene rubber chains, sulfur crosslinks, and highly cross-linked aromatic residues. The behavior of the blend (Fig. 10c) shows two distinct regimes: below α = 0.4, Eα increases gradually, resembling the initial trend observed in BB, whereas above this threshold, the slope becomes significantly steeper, aligning with WT's characteristic progression. This indicates a transition from BB-dominated, to WT-influenced decomposition. As shown in Fig. 10d, the comparison of EExp and ECalc provides preliminary indications of potential interactions during BB-WT co-pyrolysis. The experimental values represent the average Eα determined using the KAS, FWO, and Friedman methods, respectively. Across most of the conversion range, especially at high conversions (0.7−0.9), the
$ {{E}}_{\rm{Exp}} $ 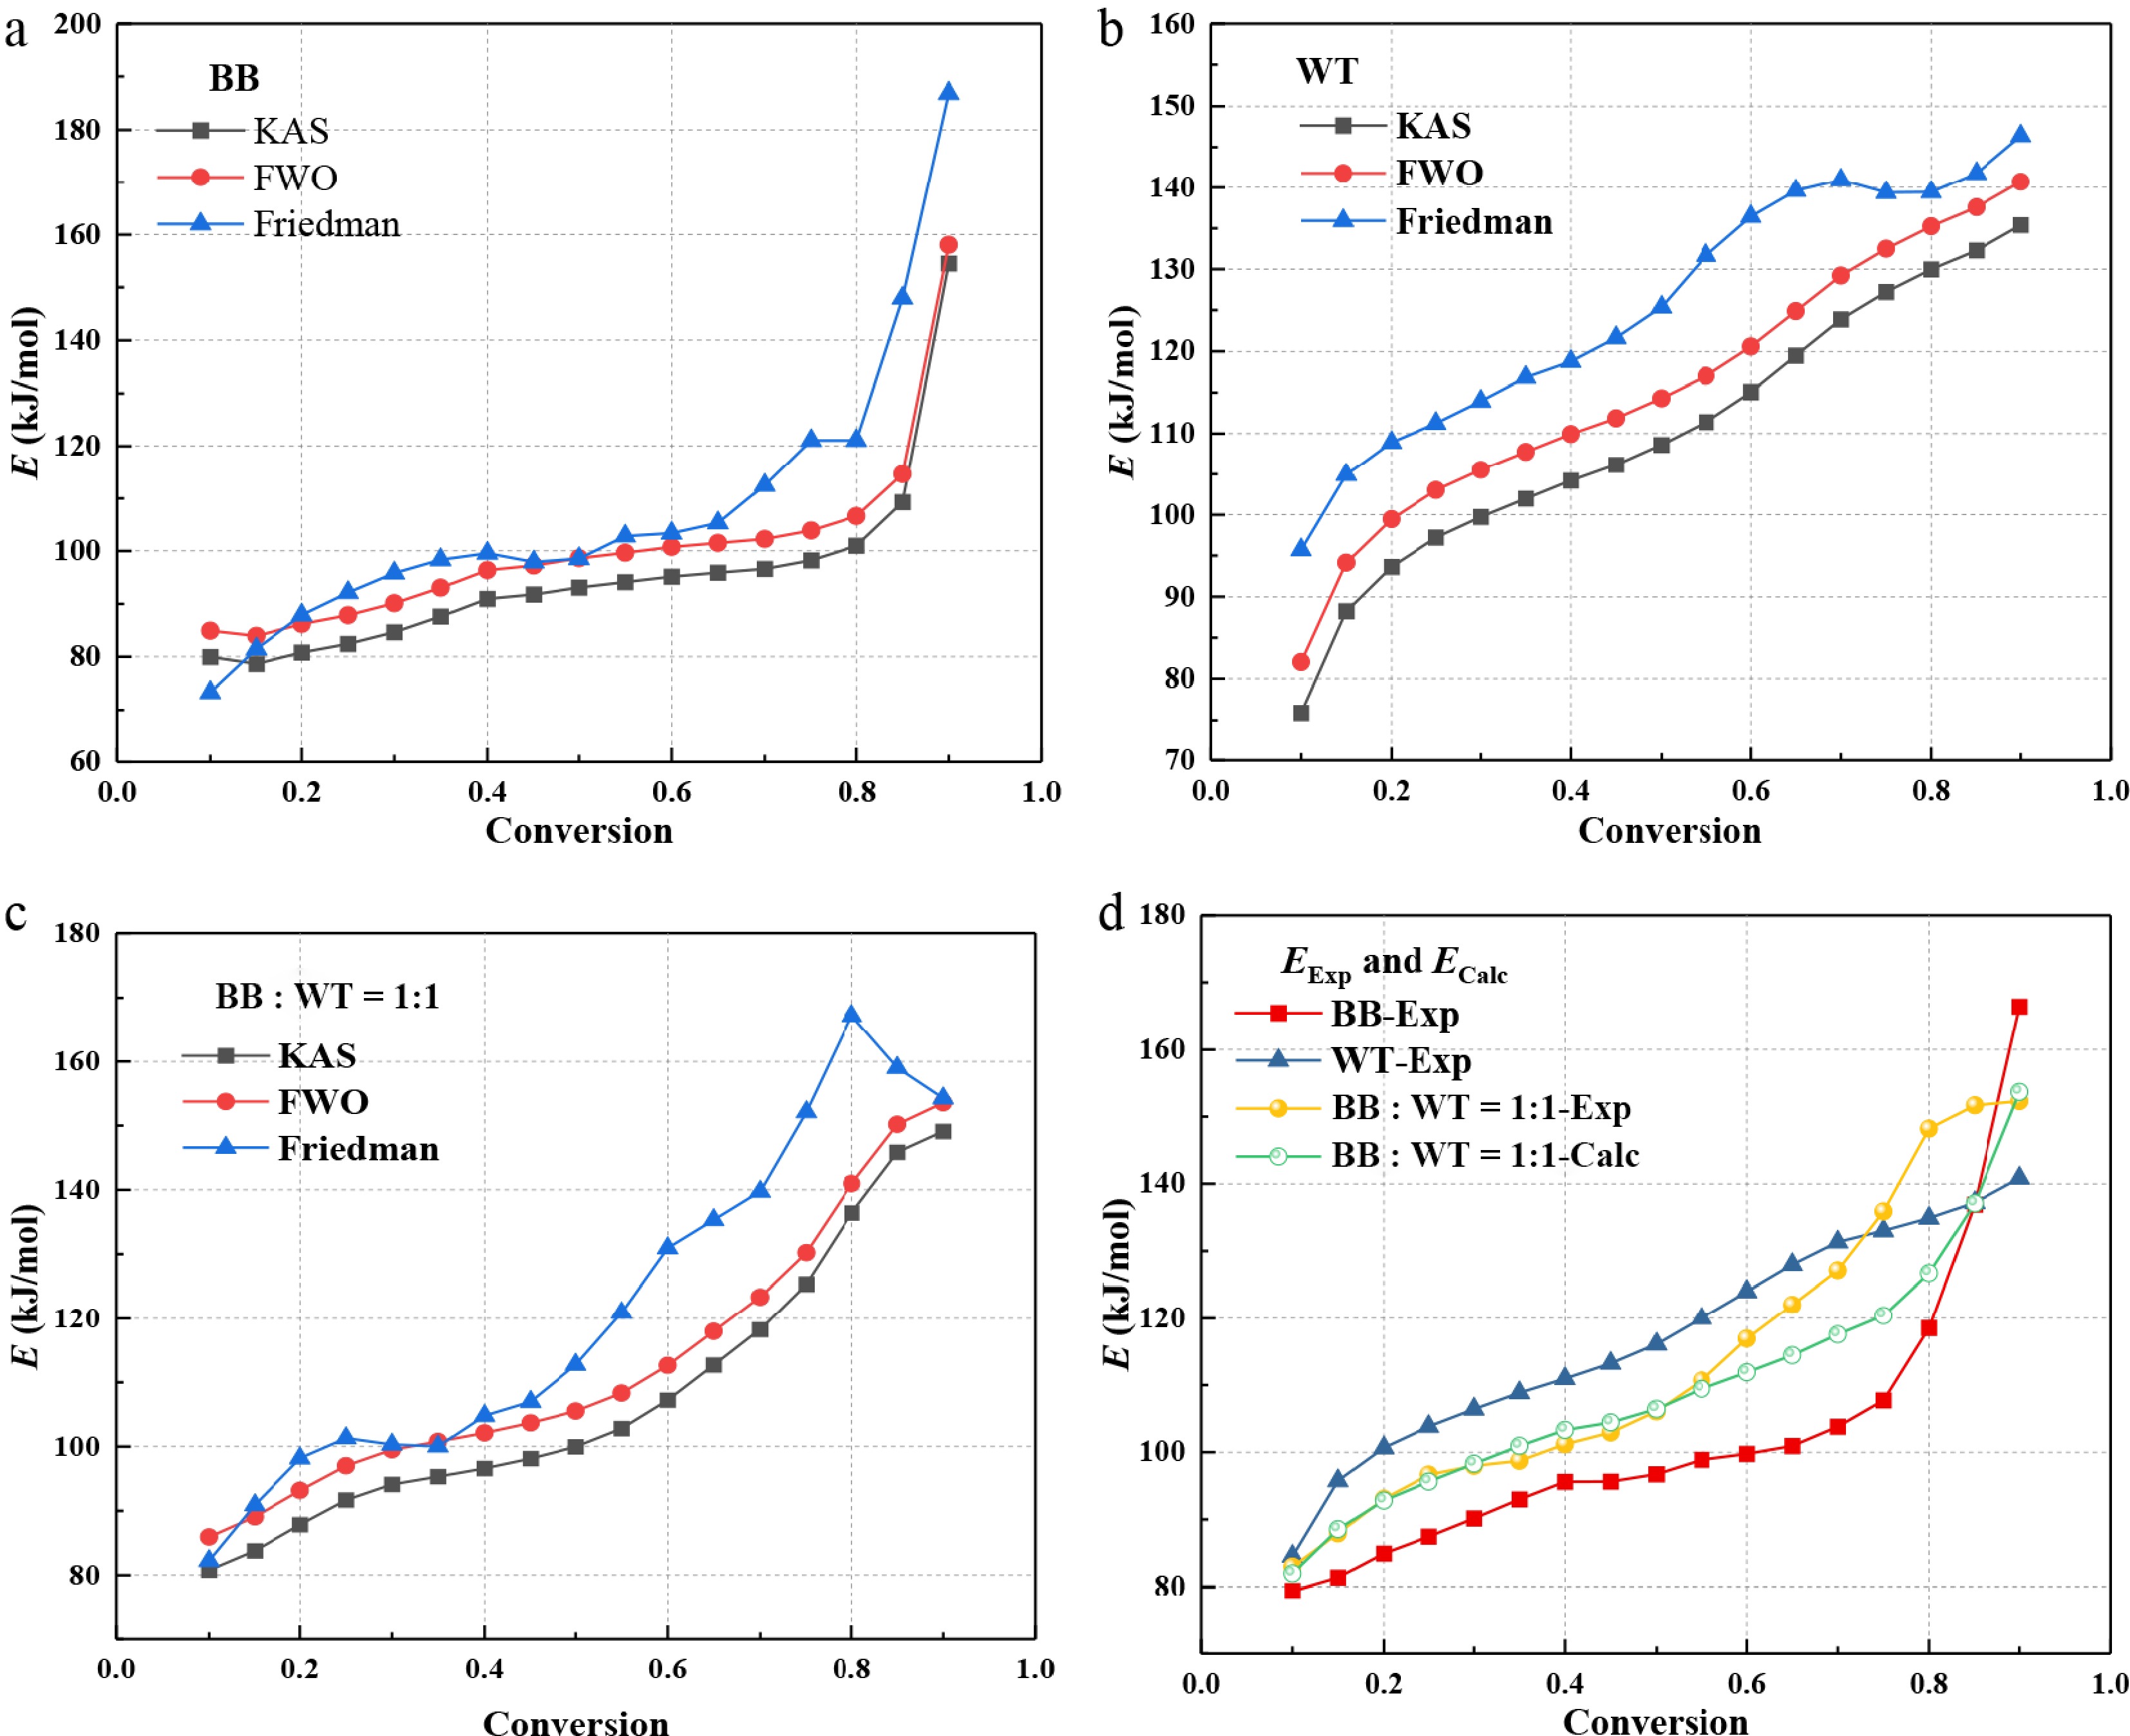
Figure 10.
$ {{E}}_{ \alpha } $of BB, WT and the 1:1 BB-WT blend.
Determination of the kinetic model function
-
The linear fitting results of
$ \ln( \dfrac{{g(\alpha)}}{{T}^{2}}) $ Table 5. The R2 of linear fitting of $ {\ln(} \dfrac{{g(\alpha)}}{{{T}}^{{2}}}{)} $ vs 1/T for BB.
No. Code 10 °C/min 20 °C/min 30 °C/min 40 °C/min Average R2 Average E R2 E R2 E R2 E R2 E 1 F1 0.982 61.24 0.987 66.01 0.991 69.58 0.992 70.85 0.988 66.92 2 F3/2 0.984 74.27 0.985 79.96 0.985 84.18 0.983 85.41 0.984 80.96 3 F2 0.975 89.23 0.974 95.95 0.969 100.92 0.965 102.08 0.971 97.05 4 F3 0.945 123.89 0.940 133.02 0.931 139.70 0.922 140.67 0.935 134.32 5 D1 0.950 92.37 0.958 99.37 0.970 104.62 0.977 107.33 0.964 100.92 6 D2 0.965 103.44 0.972 111.23 0.982 117.07 0.987 119.81 0.977 112.89 7 D3 0.980 117.47 0.984 126.26 0.990 132.83 0.993 135.56 0.987 128.03 8 G-B 0.970 108.05 0.977 116.18 0.985 122.26 0.990 124.99 0.981 117.87 9 ZH 0.987 149.54 0.989 160.59 0.989 168.79 0.988 171.44 0.988 162.59 10 R1 0.935 41.12 0.947 44.46 0.962 46.98 0.971 48.25 0.954 45.20 11 R2 0.967 50.22 0.974 54.21 0.984 57.21 0.989 58.50 0.979 55.04 12 R3 0.973 53.67 0.980 57.91 0.988 61.09 0.992 62.37 0.983 58.76 13 A3/2 0.979 37.45 0.984 40.52 0.989 42.83 0.991 43.63 0.986 41.11 14 A2 0.974 25.56 0.981 27.78 0.987 29.46 0.989 30.02 0.983 28.21 15 A3 0.958 13.66 0.970 15.04 0.981 16.09 0.985 16.40 0.974 15.30 16 A4 0.924 7.71 0.948 8.67 0.969 9.40 0.976 9.60 0.954 8.85 17 A1 0.982 61.24 0.987 66.01 0.991 69.58 0.992 70.85 0.988 66.92 18 A2/3 0.984 96.92 0.988 104.24 0.992 109.69 0.993 111.60 0.989 105.61 19 A1/2 0.985 132.61 0.989 142.47 0.992 149.81 0.993 152.51 0.990 144.35 20 A1/3 0.986 203.96 0.989 218.93 0.993 230.04 0.993 234.18 0.990 221.78 21 A1/4 0.986 275.34 0.990 295.39 0.993 310.27 0.994 315.85 0.991 299.21 22 P1 0.430 2.68 0.550 3.28 0.676 3.76 0.738 3.95 0.599 3.42 23 P2 0.763 6.95 0.813 7.85 0.869 8.56 0.897 8.87 0.836 8.06 24 P3 0.882 15.50 0.907 17.01 0.934 18.16 0.975 18.72 0.925 17.35 Values in boldface indicate the reaction mechanism models with better fitting results. As shown in Table 6, the mechanism functions, including F1, F3/2, D3, ZH, A1/2, A1/3, and A1/4, also show high R2 values for WT. Notably, the F3/2 model yielded an E of 106.22 kJ/mol, which is close to the average value of 117.04 kJ/mol derived from the isoconversional methods. This suggests that the F3/2 mechanism is the most suitable for accurately describing the kinetics of WT pyrolysis.
Table 6. The R2 of linear fitting of $ \ln( \dfrac{{g(\alpha)}}{{T}^{2}}) $ vs 1/T for WT.
No. Code 10 °C/min 20 °C/min 30 °C/min 40 °C/min Average R2 Average E R2 E R2 E R2 E R2 E 1 F1 0.986 78.64 0.986 85.50 0.985 85.50 0.987 97.78 0.986 86.86 2 F3/2 0.986 95.03 0.987 103.35 0.986 108.45 0.991 118.03 0.988 106.22 3 F2 0.977 113.82 0.979 123.83 0.977 130.02 0.985 141.27 0.980 127.24 4 F3 0.946 157.38 0.949 171.31 0.948 180.04 0.958 195.18 0.950 175.98 5 D1 0.953 117.76 0.951 127.43 0.952 133.13 0.947 145.08 0.951 130.85 6 D2 0.968 131.71 0.967 142.58 0.967 149.05 0.964 162.25 0.967 146.40 7 D3 0.981 149.38 0.981 161.80 0.980 169.27 0.980 184.04 0.981 166.12 8 G-B 0.973 137.53 0.972 148.90 0.972 155.70 0.970 169.41 0.972 152.89 9 ZH 0.989 189.73 0.989 205.71 0.988 215.49 0.992 233.85 0.990 211.20 10 R1 0.942 53.30 0.940 57.96 0.942 60.69 0.937 66.55 0.940 59.63 11 R2 0.971 64.77 0.971 70.42 0.971 73.79 0.969 80.67 0.971 72.41 12 R3 0.978 69.12 0.977 75.14 0.977 78.76 0.977 86.03 0.977 77.26 13 A3/2 0.983 48.71 0.984 53.16 0.983 55.86 0.985 61.20 0.984 54.73 14 A2 0.980 33.74 0.981 36.99 0.980 38.96 0.983 42.90 0.981 38.15 15 A3 0.972 18.78 0.973 20.82 0.973 22.05 0.976 24.61 0.974 21.57 16 A4 0.956 11.29 0.960 12.74 0.959 13.60 0.966 15.46 0.960 13.27 17 A1 0.986 78.64 0.986 85.50 0.985 89.66 0.987 97.78 0.986 87.90 18 A2/3 0.987 123.54 0.987 134.01 0.986 140.37 0.988 152.66 0.987 137.65 19 A1/2 0.987 168.43 0.988 182.53 0.987 191.08 0.989 207.54 0.988 187.40 20 A1/3 0.988 258.22 0.988 279.55 0.987 292.49 0.989 317.30 0.988 286.89 21 A1/4 0.988 348.02 0.988 376.57 0.988 393.91 0.989 427.07 0.988 386.39 22 P1 0.658 4.96 0.692 5.85 0.714 6.36 0.736 7.65 0.700 6.21 23 P2 0.833 10.33 0.841 11.64 0.849 12.40 0.849 14.20 0.843 12.14 24 P3 0.906 21.08 0.907 23.22 0.910 24.47 0.905 27.29 0.907 24.02 Values in boldface indicate the reaction mechanism models with better fitting results. As shown in Table 7, for the co-pyrolysis of BB and WT, several models, such as F1, F3/2, F2, D3, ZH, A1/3, and A1/4, achieved high R2 values, with averages ranging from 0.984 to 0.996. The D3 mechanism function, with an average R2 value of 0.984 and E of 116.49 kJ/mol, showed good agreement with the established E of 113.67 kJ/mol derived from the KAS, FWO, and Friedman methods. Thus, D3 is considered the most appropriate model for representing the co-pyrolysis kinetics of the BB-WT blend.
Table 7. The R2 of linear fitting of $ \ln( \dfrac{{g(\alpha)}}{{{T}}^{2}}) $ vs 1/T for the 1:1 BB-WT blend.
No. Code 10 °C/min 20 °C/min 30 °C/min 40 °C/min Average R2 Average E R2 E R2 E R2 E R2 E 1 F1 0.987 53.13 0.99 58.42 0.993 63.88 0.995 65.6 0.991 60.26 2 F3/2 0.996 64.99 0.997 71.29 0.994 77.97 0.995 79.64 0.996 73.47 3 F2 0.993 78.6 0.991 86.08 0.984 94.14 0.985 95.75 0.988 88.64 4 F3 0.97 110.18 0.965 120.37 0.951 131.65 0.952 133.09 0.960 123.82 5 D1 0.936 80.35 0.945 88.06 0.957 96.68 0.959 99.09 0.949 91.05 6 D2 0.957 90.39 0.964 98.96 0.974 108.65 0.975 111.04 0.968 102.26 7 D3 0.977 103.14 0.982 112.81 0.988 123.82 0.989 126.18 0.984 116.49 8 G-B 0.967 94.58 0.971 103.52 0.98 113.64 0.981 116.02 0.975 106.94 9 ZH 0.996 132.3 0.997 144.48 0.996 158.51 0.997 160.75 0.997 149.01 10 R1 0.913 34.86 0.926 38.57 0.94 42.12 0.947 43.9 0.932 39.86 11 R2 0.959 43.12 0.968 47.54 0.976 51.96 0.979 53.72 0.971 49.09 12 R3 0.971 46.26 0.977 50.94 0.984 55.69 0.986 57.44 0.980 52.58 13 A3/2 0.983 31.88 0.988 35.3 0.991 38.44 0.993 39.97 0.989 36.40 14 A2 0.977 21.25 0.984 23.75 0.987 25.72 0.992 27.15 0.985 24.47 15 A3 0.955 10.63 0.97 12.19 0.973 13 0.985 14.33 0.971 12.54 16 A4 0.894 5.31 0.935 6.41 0.932 6.64 0.971 7.93 0.933 6.57 17 A1 0.987 53.13 0.99 58.42 0.993 63.88 0.995 65.6 0.991 60.26 18 A2/3 0.989 85.01 0.992 93.09 0.994 102.06 0.995 104.05 0.993 96.05 19 A1/2 0.99 116.89 0.992 127.75 0.995 140.19 0.996 142.5 0.993 131.83 20 A1/3 0.99 180.65 0.993 197.09 0.995 216.51 0.996 219.4 0.994 203.41 21 A1/4 0.991 244.41 0.993 266.43 0.995 292.82 0.996 296.29 0.994 274.99 22 P1 0.062 0.75 0.143 1.45 0.065 1.2 0.405 2.5 0.169 1.48 23 P2 0.568 4.54 0.665 5.58 0.654 5.75 0.78 7.1 0.667 5.74 24 P3 0.823 12.12 0.856 13.82 0.869 14.84 0.9 16.3 0.862 14.27 Values in boldface indicate the reaction mechanism models with better fitting results. The kinetic analysis revealed a distinct mechanistic shift: BB followed random nucleation and subsequent growth (A2/3), WT followed a chemical reaction (F3/2), while their blend followed three-dimensional diffusion (D3). This shift provides direct evidence of synergistic interactions, where cross-linking reactions between the feedstocks form a denser char residue, thereby altering the rate-limiting step to mass transport of volatiles[55]. The prolonged residence time of volatile components within the dense coke matrix promotes secondary reactions, such as the hydrogenation-deoxygenation of phenolic compounds by WT-derived hydrogen, and the stabilisation of olefinic fragments. These processes collectively account for the significant reduction in oxygen-containing compounds identified by GC/MS, and the enrichment of hydrocarbons.
Kinetic compensation effect
-
Figure 11 illustrates the linear regression results for the different samples in the KCE analysis. Figure 11a presents the regression analysis for the BB, with a regression equation of
$ \ln \left({{A}}_{ \alpha }\right){=0.129}{{E}}_{ \alpha }{+3.485} $ $ \ln \left({{A}}_{ \alpha }\right){=0.168}{{E}}_{ \alpha }-{2.461} $ $ \ln \left({{A}}_{ \alpha }\right){=0.175}{{E}}_{ \alpha }-{5.038} $ 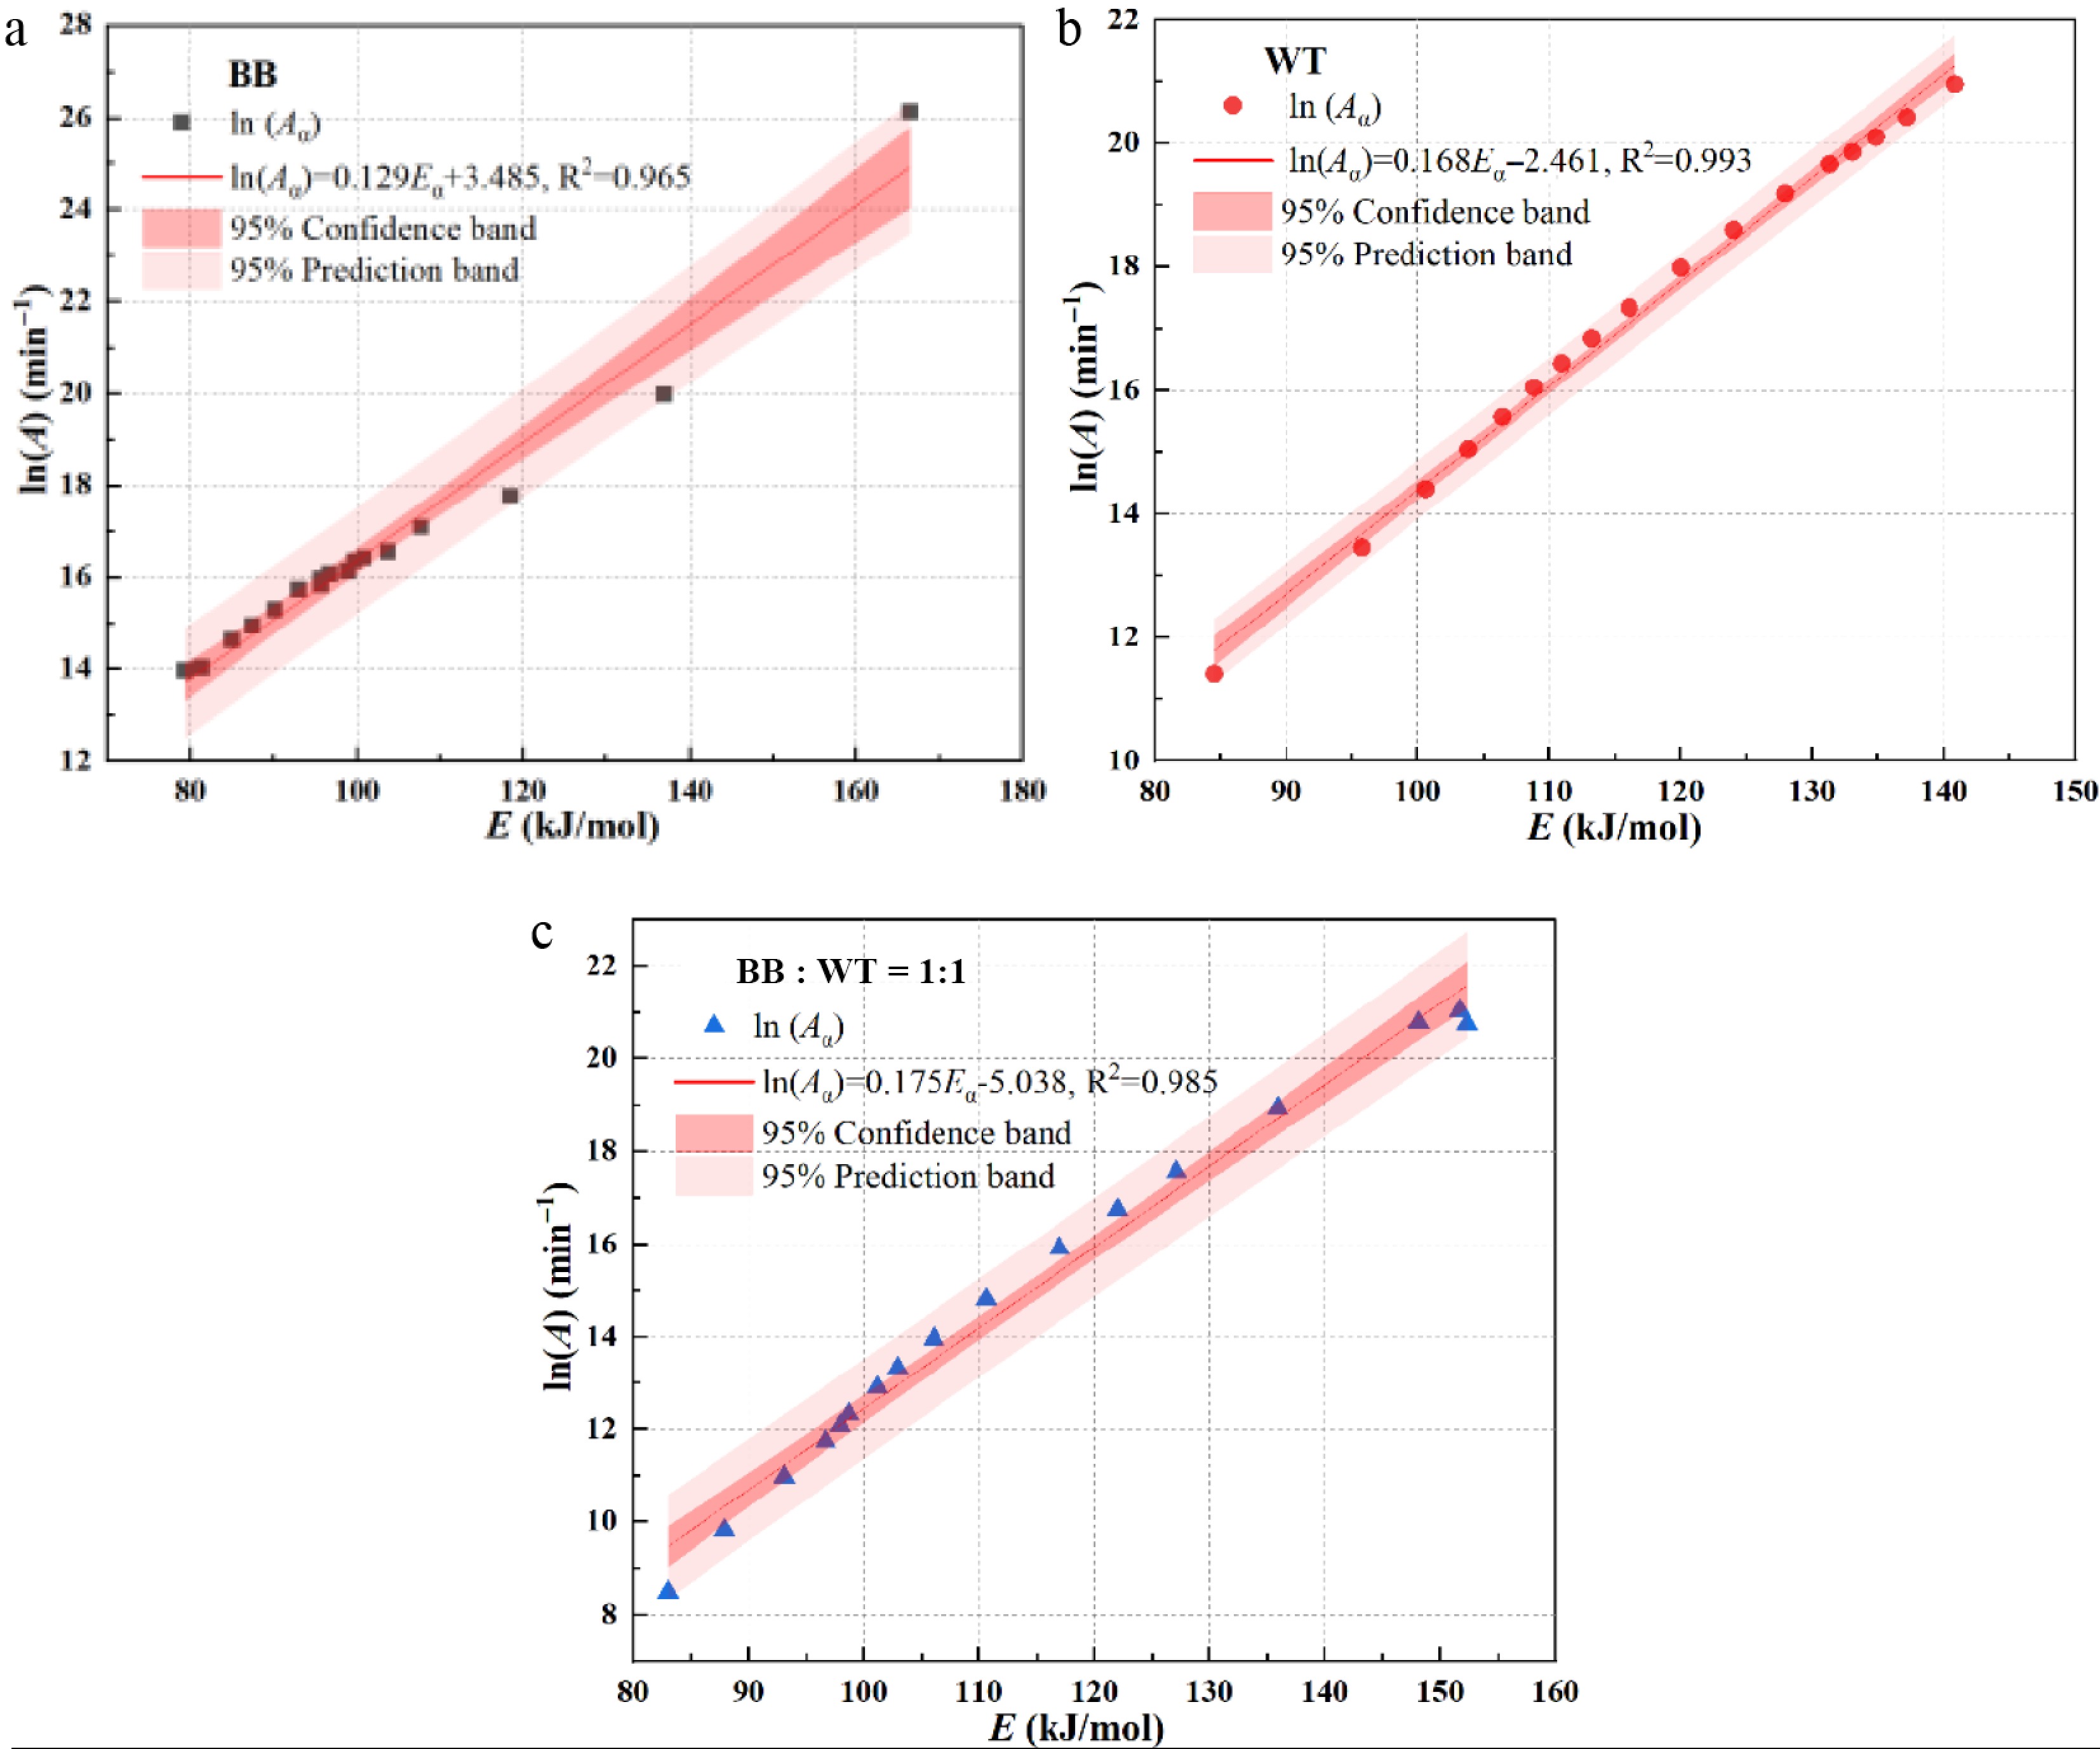
Figure 11.
Linear regression of the compensation effect.
These regression plots confirm the presence of the KCE, a well-established phenomenon in thermal kinetics, which manifests as a linear correlation between Eα and
$ \ln \left({{A}}_{ \alpha }\right) $ -
This study comprehensively evaluated the co-pyrolysis behavior and kinetic characteristics of BB, WT, and their blends. The main conclusions are summarized as follows:
(1) BB and WT exhibit different thermal degradation characteristics, and co-pyrolysis significantly alters the thermal stability and decomposition behavior. The presence of WT in the blend enhances overall thermal stability and reduces weight loss, making the pyrolysis process more gradual and stable, which is advantageous for process control and operational stability in continuous reactors.
(2) The chemical composition of the pyrolysis products is strongly influenced by the BB-WT ratio. Proper blending ratios can effectively suppress oxygenated compounds (such as phenolics and ketones), while maintaining a high proportion of hydrocarbons, thereby improving fuel quality and enhancing the potential for valuable chemical production. This provides a practical strategy for optimizing energy recovery and chemical production in waste-to-energy systems.
(3) The average values of
$ {{E}}_{ \alpha } $ $ \ln \left({{A}}_{ \alpha }\right) $ (4) The ΔW and Δr, FTIR analysis, and GC/MS analysis suggest that synergistic effects occur between 300−500 °C, particularly for BB : WT = 5:5 and 3:7. The hydrogen-rich fragments from WT promote the deoxygenation of BB-derived intermediates, reducing phenolics, while oxygen radicals from BB enhance WT chain scission, increasing aromatics and alkenes. These interactions reveal optimal blending strategies for improving co-pyrolysis efficiency and product quality.
Overall, this study provides crucial insights into the design, modeling, and optimization of waste-to-energy pyrolysis systems handling mixed biomass and polymeric wastes. This work defines optimal co-pyrolysis parameters for industrial application: using a 3:7 or 5:5 bamboo-to-tire blend within a 300−500 °C window maximizes hydrocarbon production by exploiting synergistic radical interactions. The provided kinetic data and reaction model enable direct scaling for efficient bio-oil production from waste.
However, as a lab-scale study, limitations exist regarding heat/mass transfer effects and continuous operation for industrial application. Future work should therefore focus on: (1) Pilot-scale validation to verify the synergies and kinetic models in continuous-fed reactors; (2) Comprehensive char characterization to understand the impact of interactions on biochar yield, surface properties, and stability[31]; (3) Catalytic upgrading of the synergistic, hydrocarbon-rich bio-oil to produce high-value fuels or chemicals.
This work was supported by the China National Key R&D Program (Grant No. 2022YFC3902302), the Natural Science Foundation of Hebei Province (Grant No. E2023203166), and Department of Education of Hebei Province (QN2025058).
-
The authors confirm their contributions to the paper as follows: investigation, methodology, data curation, original draft preparation: Bai Y; conceptualization, formal analysis, visualization, writing review and editing, funding acquisition: Du N; investigation, data curation, validation: Zhou Z; resources, supervision, writing review and editing, project administration, funding acquisition: Ma H. All authors reviewed the results and approved the final version of the manuscript.
-
The datasets generated during and/or analyzed in the current study are available from the corresponding author on reasonable request.
-
The authors declare that they have no known competing financial interests or personal relationships that could have appeared to influence the work reported in this paper.
- Supplementary Table S1 Thermal decomposition characteristics of BB, WT, and their blend.
- Supplementary Table S2 The relative percentages of major components of the co-pyrolysis of BB and WT.
- Supplementary Fig. S1 TG and DTG curves of the 1:1 BB-WT blend obtained from three repeated runs.
- Supplementary Fig. S2 The FTIR spectra during the co-pyrolysis of BB-WT blends.
- Supplementary Fig. S3 Linear fitting plots to calculate the Eα of the BB, WT and 1:1 BB-WT blend using KAS, FWO and Friedman models.
- Copyright: © 2026 by the author(s). Published by Maximum Academic Press, Fayetteville, GA. This article is an open access article distributed under Creative Commons Attribution License (CC BY 4.0), visit https://creativecommons.org/licenses/by/4.0/.
-
About this article
Cite this article
Bai Y, Du N, Zhou Z, Ma H. 2026. Experimental study of the co-pyrolysis of bamboo and waste tires by TG-FTIR-GC/MS. Progress in Reaction Kinetics and Mechanism 51: e011 doi: 10.48130/prkm-0026-0002 

Experimental study of the co-pyrolysis of bamboo and waste tires by TG-FTIR-GC/MS
- Received: 26 June 2025
- Revised: 12 November 2025
- Accepted: 14 January 2026
- Published online: 09 May 2026
Abstract: The co-pyrolysis of bamboo (BB) and waste tires (WT) is a promising waste-to-energy strategy; however, a fundamental understanding of its reaction kinetics and real-time volatile interactions remains limited. This study addresses this gap by employing an integrated TG-FTIR-GC/MS approach to elucidate the synergistic mechanisms, kinetics, and product evolution of BB/WT co-pyrolysis. Marked synergy was observed between 300–500 °C for blends of 5:5, and 3:7 (BB : WT). At the 5:5 ratio, the phenolic, ketone, and alkene contents decreased to 12.42%, 13.37%, and 51.91%, respectively. At the 3:7 ratio, the phenolic and ketone contents further decreased to 2.65% and 5.96%, respectively, with alkenes accounting for 61.18%. The activation energies for BB, WT, and their 1:1 blend, determined using the KAS, FWO, and Friedman methods, were 101.91, 117.04, and 113.67 kJ/mol, respectively. The Coats-Redfern method identified A2/3 for BB, F3/2 for WT, and D3 for the 1:1 blend as the most suitable reaction models. These findings provide crucial insights for optimizing the co-pyrolysis process, and enhancing the efficient utilization of biomass and WT.
-
Key words:
- Co-pyrolysis /
- TG-FTIR-GC/MS /
- Activation energy /
- Reaction model /
- Interactions.