


-
In recent decades, the global community has confronted the issue of climate warming caused by excessive CO2 emissions from fossil fuels. Therefore, production of clean energy and fuels from renewable biomass via thermochemical conversion methods holds significant importance for China in achieving 'carbon neutrality' and 'carbon peaking'[1]. China has vast reserves of agricultural straw resources. The theoretical resource quantity is approximately 829 million tons per year, while the collectible resource quantity is around 694 million tons per year[2]. Currently, the high-value utilization of straw is mainly focused on the following five pathways: fertilizer, feed, fuel, substrate, and industrial raw material. Among these pathways, the biomass gasification technology, which converts agricultural straw into bio-gas, is recognized as an important approach to fulfill the goal of carbon reduction and carbon sequestration[3].
During biomass gasification, solid materials are transformed into gaseous fuels (CO, H2, CH4) via a series of thermochemical reactions, including pyrolysis, oxidation, and reduction, driven by gasifying media under elevated temperatures and limited oxygen availability. In addition, gasification also generates two byproducts, namely the biochar and tar[4,5]. The bio-gas can serve as a substitute for the traditional coal and natural gas, which can be applied in the centralized gas supply, the power generation using the internal combustion engine, and the heat supply using boilers[3,6]. The bio-char can be further processed into the activated carbon for the removal of pollutants used in the environmental field, or the bio-char-based fertilizer to improve the yield of crops used in the agricultural field[4,6]. The gasified liquid product is composed of the aqueous part (named as vinegar) and the tar. The vinegar could be used as a disinfectant and a sterilizing agent[7,8].
Biomass gasifiers are typically divided into updraft fixed-bed, downdraft fixed-bed, and fluidized-bed types[3,9]. The downdraft configuration is widely used owing to its low tar output, simple structure, cost advantage, and operational stability[10,11]. In this type of gasifier, pyrolysis volatiles from the upper pyrolysis zone move through the high-temperature oxidation and reduction zones at the bottom. Under elevated temperatures, tar species are further decomposed into lighter combustible gases through secondary cracking reactions, thereby lowering tar content and improving the heating value of the produced gas. Extensive studies have examined how feedstock characteristics, gasification temperature (GT) and equivalence ratio (ER), influence overall gasification performance. Hoque et al.[12] examined how various biomass feedstocks affect gasification performance. Their findings revealed that coconut shell, compared to sawdust and rice husk, produced higher levels of CO, CH4, and H2 in the bio-gas, owing to its higher carbon and hydrogen content. Yahaya et al.[13] investigated the influence of GT (700–900 °C) and particle size (1–11 mm) on coconut shell gasification, reporting that smaller particles and higher temperatures enhanced gas production rate and calorific value. Zhu et al.[14] showed that higher ER (0.07–0.16) lowers both gas lower heating value (LHV) and biochar yield. However, the coupled evolution of gas, char, and tar has received comparatively little attention.
In this study, a custom-designed micro-scale fixed-bed reactor was employed to examine how ER and GT influence the gaseous, solid, and liquid products derived from corn stover (CS) (as shown in Fig. 1).
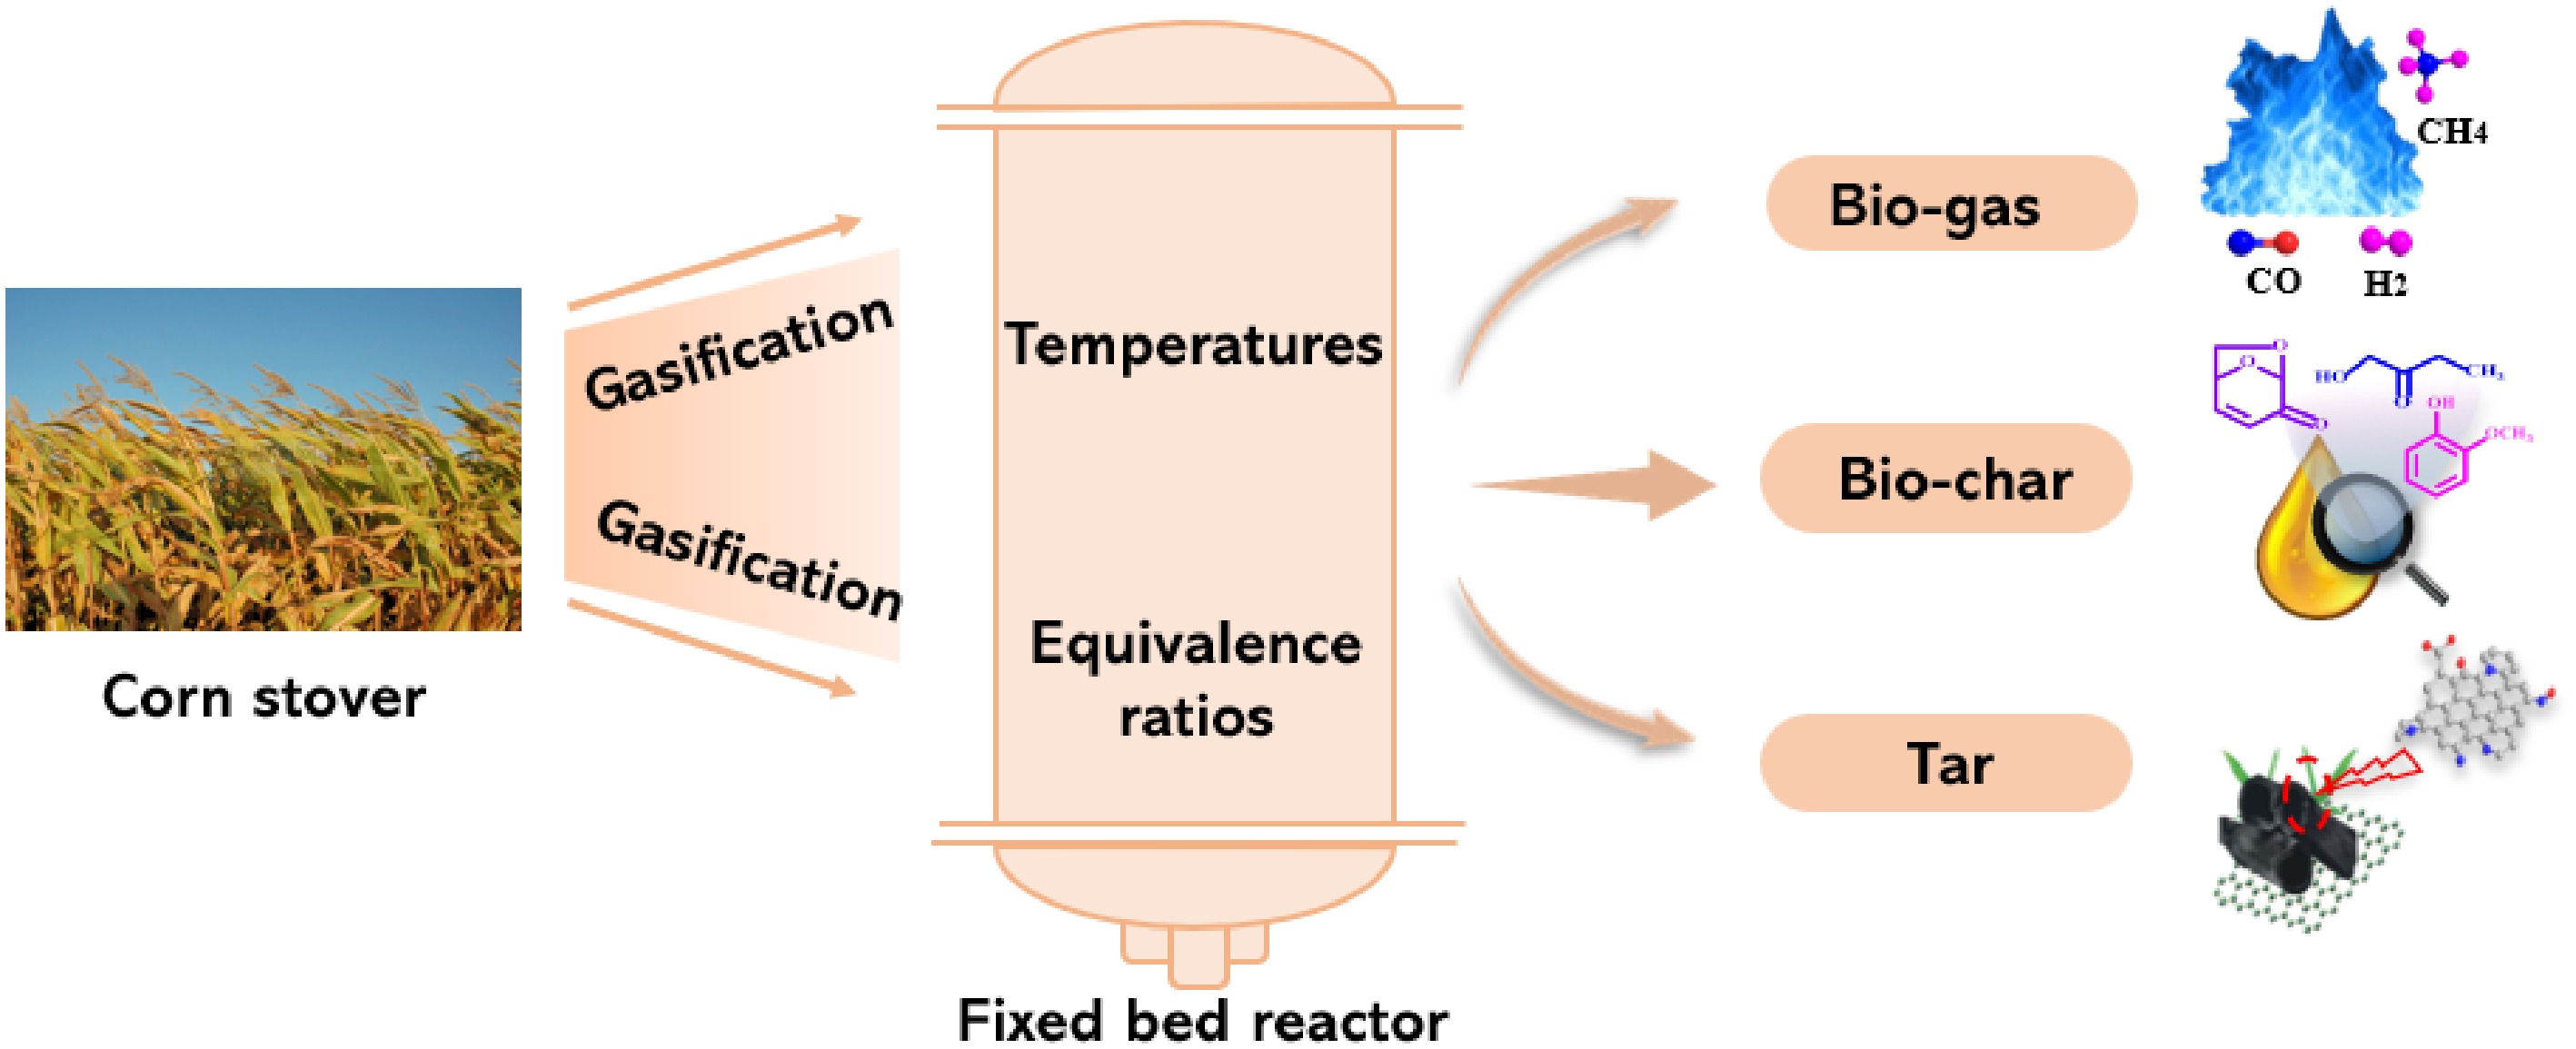
Figure 1.
Schematic illustration of the experimental system employed in this work.
-
CS was sourced from Huining County (Baiyin, Gansu, China) and air-dried under ambient conditions. The dried stalks were chopped into 1–3 cm segments and then milled into powder. The resulting material was sieved to obtain particles in the range of 0.075–0.15 mm, followed by oven drying at 105 °C to a constant mass prior to gasification experiments. Analytical methods and product characterization are described in the Supplementary Text 1.
Gasification apparatus and experimental procedure
-
As illustrated in Fig. 2, gasification experiments were conducted in a self-built micro-scale fixed-bed reactor. The system integrates a gasifier, gas supply unit, feeding module, temperature control unit, cooling circulation system, tar condensation section, and gas collection module. The reactor has an overall height of 800 mm and a width of 300 mm, with a 200 mm heating zone. A quartz reaction tube (40 mm outer diameter, 550 mm length) was employed and electrically heated up to 1,200 °C. The gas supply system includes gas cylinders, mass flow controllers, a flow integrator, and a premixing chamber. The required volumes of N2 and O2 were calculated based on different ERs, and their flow rates were regulated by the mass flow controllers. The N2 and O2 were premixed before entering the reactor for gasification.
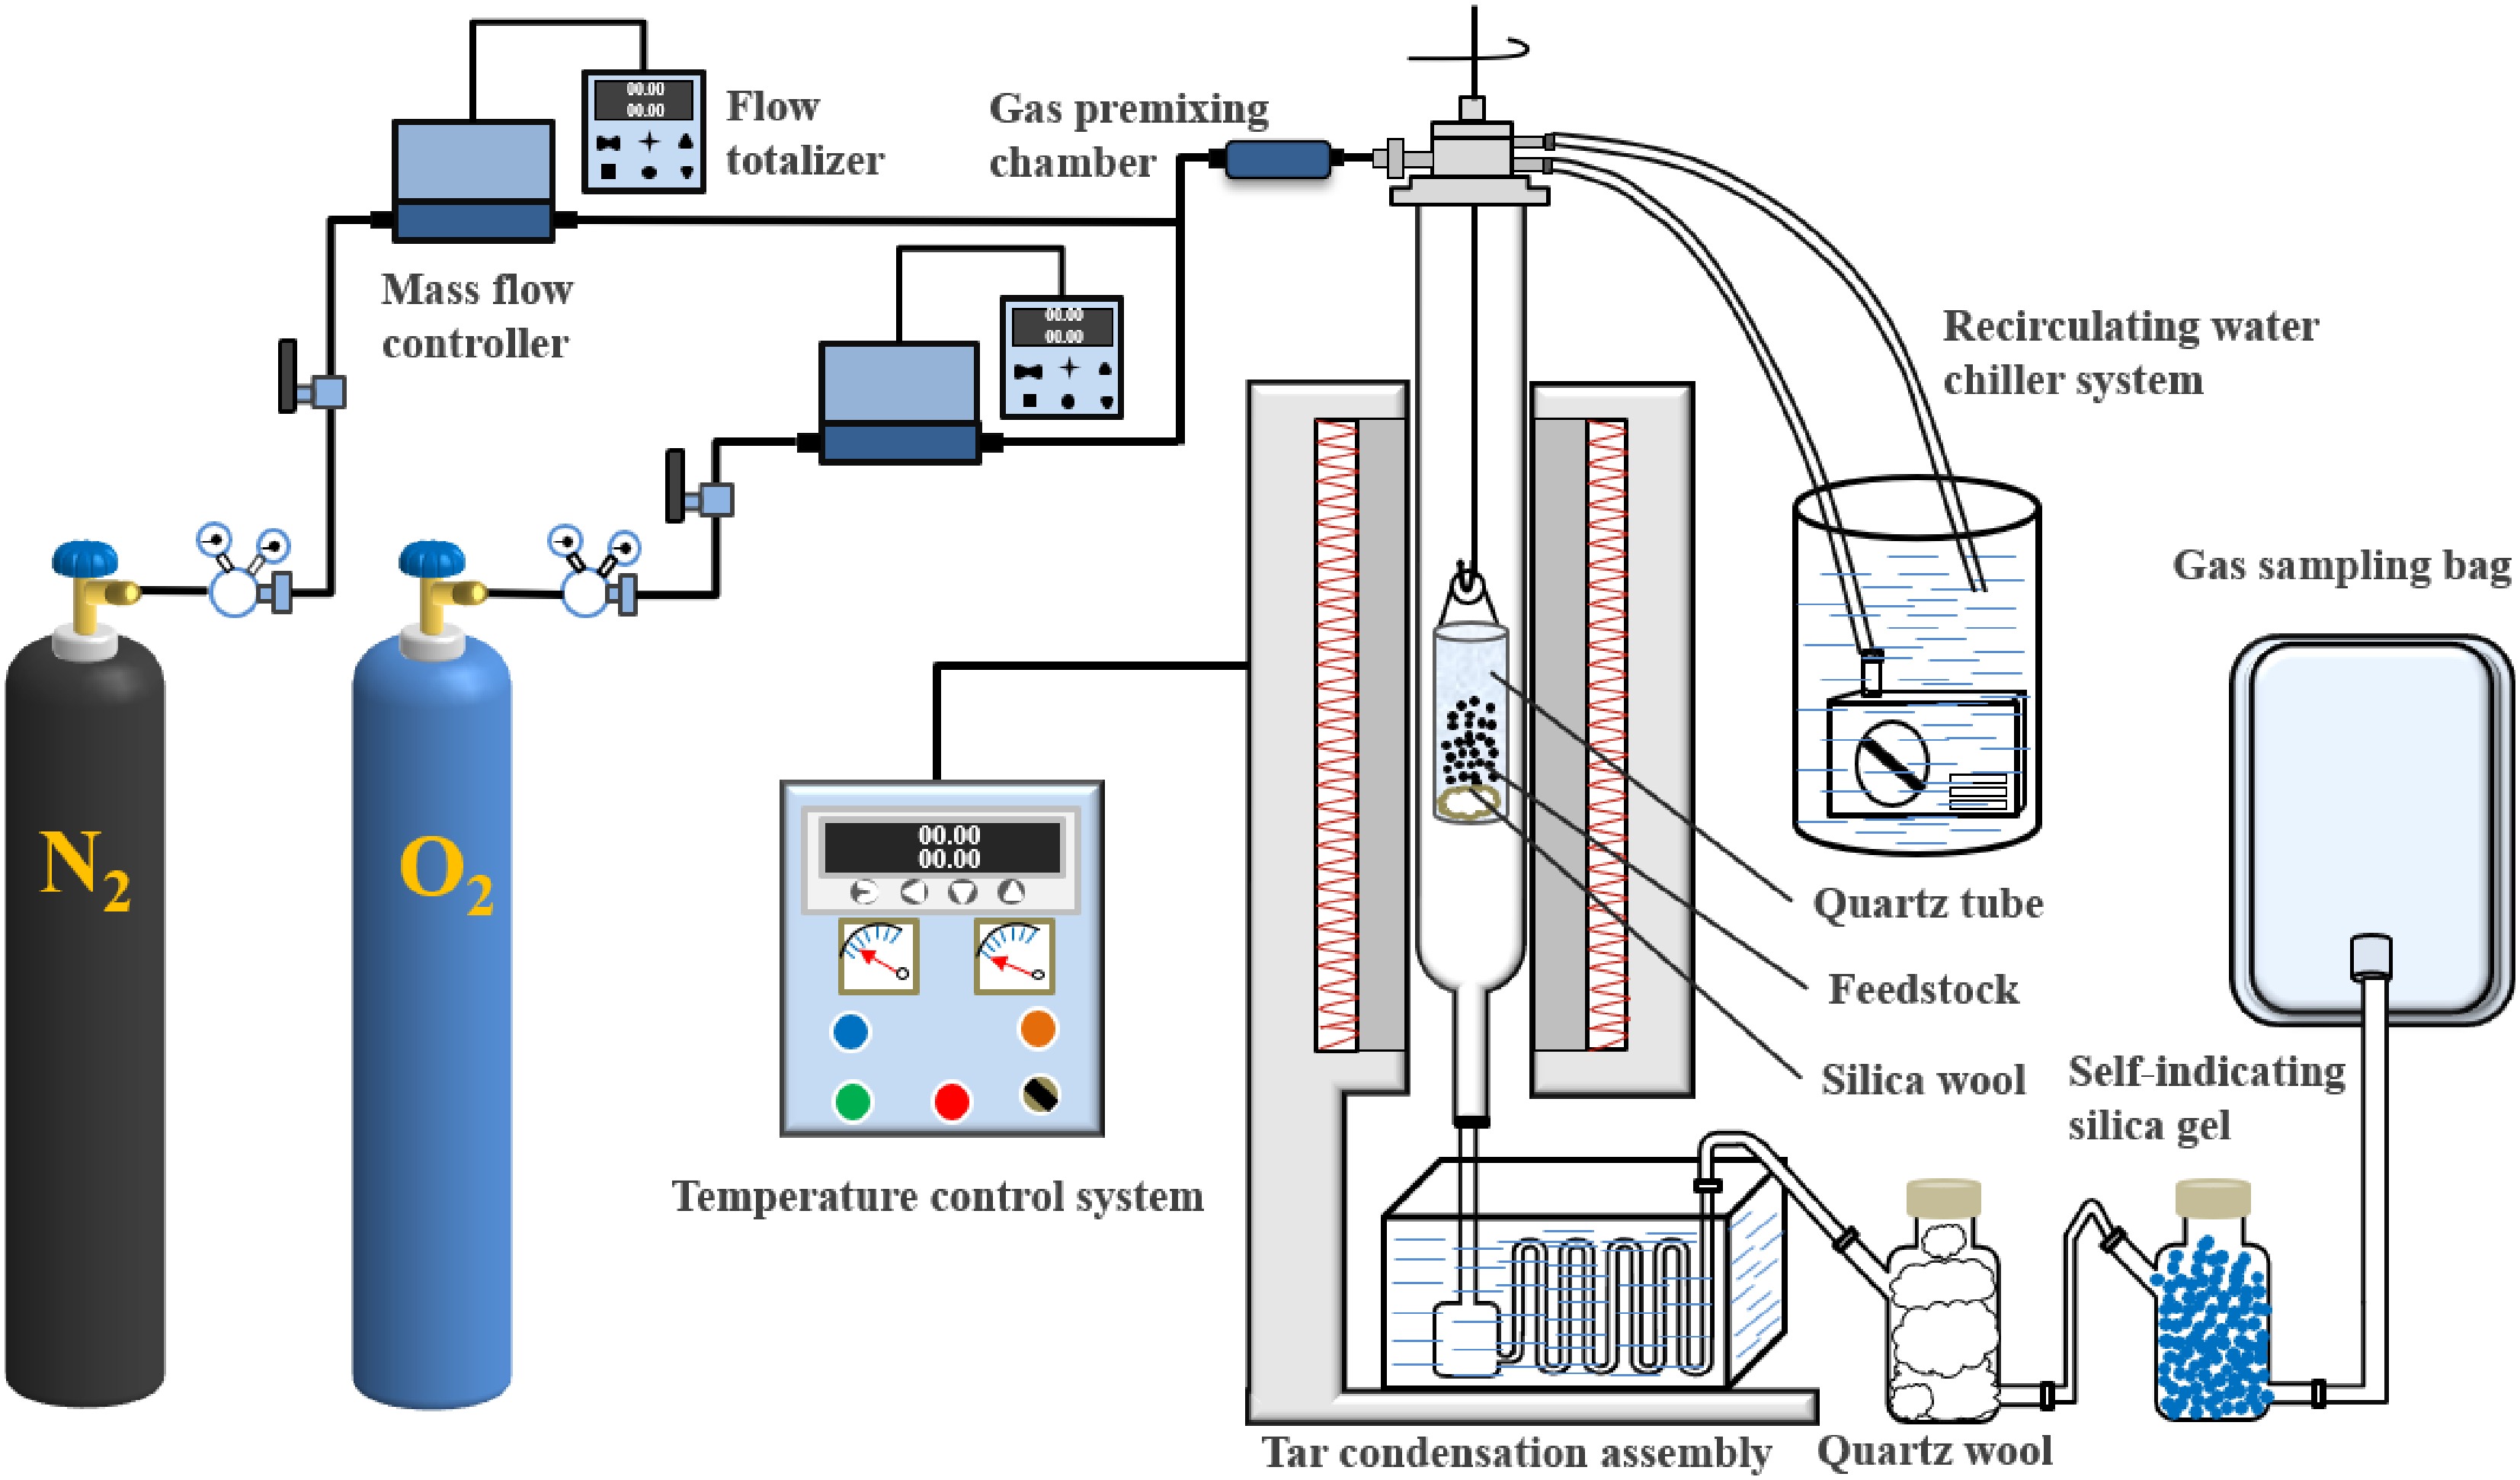
Figure 2.
Configuration of the fixed-bed gasification reactor.
The CS powder was put in a crucible, which was fabricated using the stainless steel plain-weave mesh with a pore size of 0.05 mm. The cooling water circulation system was applied to reduce the temperature of the sealing ring at the top of the quartz tube. A home-made quartz U-tube was placed in a −5 °C ice–salt bath for the tar collection. The gas collection unit consisted of two gas-washing bottles and an aluminum gas bag. The first and second gas-washing bottle were filled with quartz wool and color-changing silica gel, respectively.
Prior to each run, 5 g of CS powder was loaded into the crucible and suspended in the cooling zone of the quartz reactor using a hook. The reactor and pipelines were purged with premixed gasifying agents for 10 min prior to each experiment. The air volume per unit mass of feedstock was calculated using Eq. (1), with ER values of 0.05–0.30. The system was then heated to the target temperature (700, 800, or 900 °C) at 20 °C/min. Once the set temperature was reached, the crucible was rapidly placed into the reaction zone to start gasification, and gas products were collected in a gas bag. After the reaction, the crucible was transferred to the cooling zone and cooled to room temperature. Solid biochar was recovered, gas was collected in the bag, and liquid products were condensed in a U-tube. Bio-char samples obtained under different GT and ER conditions were labeled as CSC-XX-YYY, where CSC denotes CS-derived char, and XX and YYY correspond to ER and GT, respectively. Solid and liquid yields were evaluated using Eqs (2) and (3), while gas yield was obtained by mass balance. Experimental reproducibility was verified through triplicate runs with randomized sampling, and the associated uncertainties are presented as standard deviations.
$ {V}_{\text{air}}=\lambda \dfrac{22.41}{0.21}\left(\dfrac{{W}_{\mathrm{C}}}{12}+\dfrac{{W}_{\mathrm{H}}}{4}-\dfrac{{W}_{\mathrm{O}}}{32}\right) $ (1) where, Vair represents the air volume (L) required per unit mass of biomass, while WC, WH, and WO correspond to the mass fractions (%) of carbon, hydrogen, and oxygen, respectively.
$ Y\mathrm{_{solid}}=\dfrac{W_{\mathrm{solid}}}{W_{\mathrm{D}}}\times100\text{%} $ (2) $ Y\mathrm{_{liquid}}=\dfrac{W_{\mathrm{l\mathrm{iquid}}}}{W_{\mathrm{D}}}\times100\text{%} $ (3) $ Y\mathrm{_{gas}}=100\text{%}-Y_{\mathrm{solid}}-Y\mathrm{_{liquid}} $ (4) where, Ysolid and Yliquid represent the yields of the solid and liquid product (%), Wsolid and Wliquid denote the mass (mg) of the bio-char and tar, and WD is the dry feedstock mass (mg). The yield of gaseous products was calculated by difference, following Eq. (4).
-
Figure 3a shows that as GT increased at an ER of 0.05, gas production rose to 59.00% from 48.49%, whereas the liquid and solid fractions declined to 21.12% and 19.89%, respectively. This trend can be attributed to the intensification of devolatilization and oxidation processes at elevated temperatures, which facilitate the conversion of biomass into gaseous products while suppressing char formation[15]. In addition, higher temperatures enhance tar cracking reactions, leading to a reduction in liquid yield[16]. Similar observations have been reported in previous studies; for instance, increasing temperature significantly improved gas yield while reducing char and tar fractions during empty fruit bunch gasification[17]. Moreover, elevated temperatures have been shown to strengthen gas–solid interactions and promote tar reforming reactions, thereby increasing gas yield and reducing tar content[18].
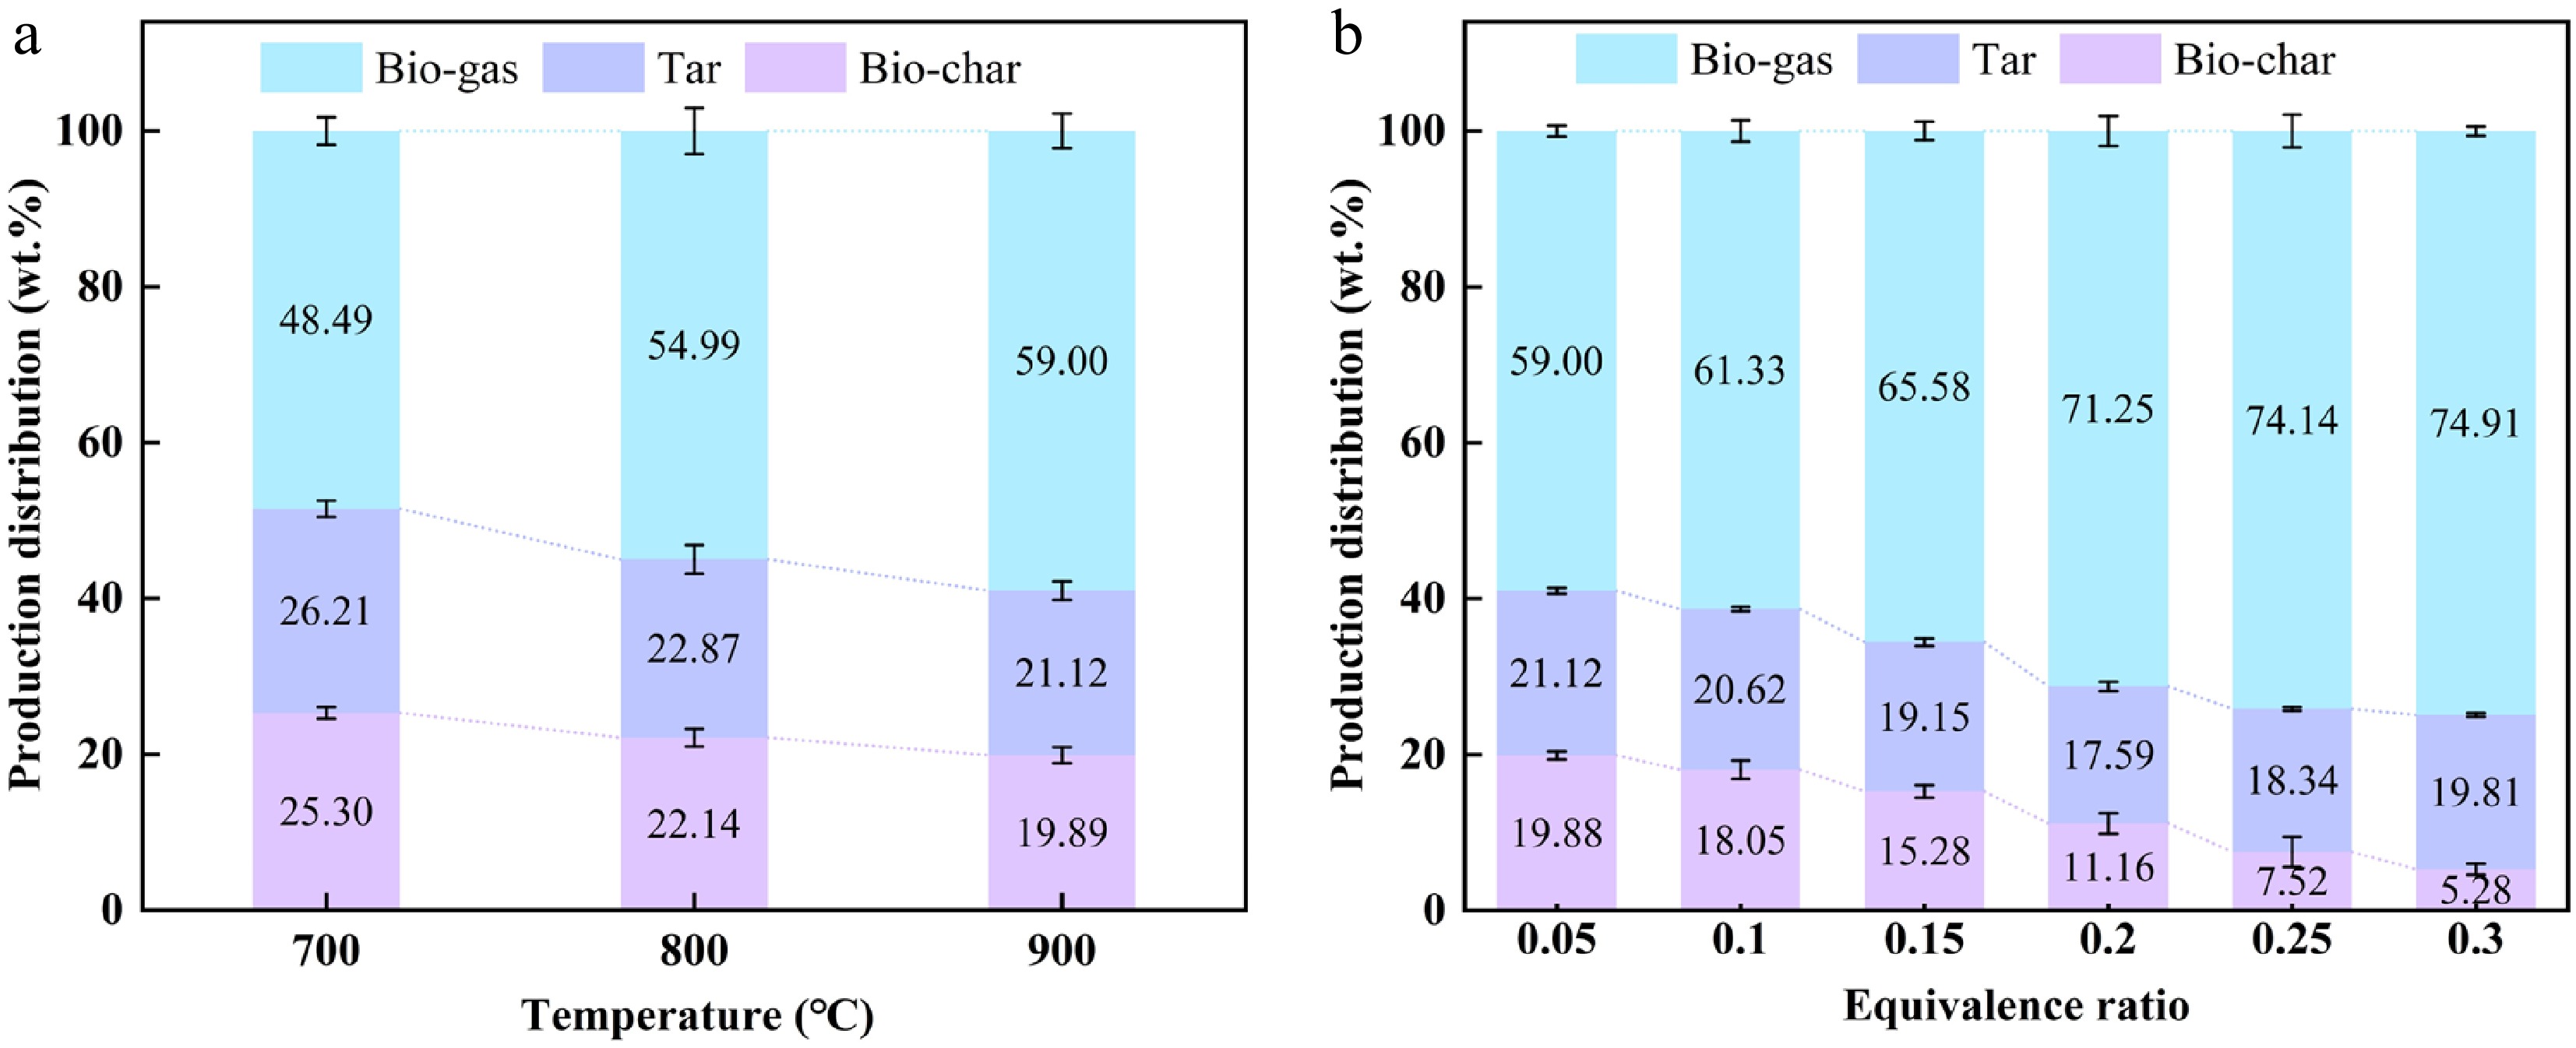
Figure 3.
Effect of (a) GT and (b) ER on the mass yields of gasified products.
Figure 3b shows that as the ER increased at 900 °C, increasing ER from 0.05 to 0.30 led to a rise in gas yield to 74.91%, accompanied by a sharp reduction in char yield to 5.28%. The tar fraction initially decreased before exhibiting a slight increase at higher ER. This behavior is associated with enhanced oxidation reactions under higher oxygen availability, which accelerate biomass conversion and reduce char formation[19]. Previous studies have reported comparable trends, indicating that elevated ER can promote the formation of tar and oxygenated compounds under certain conditions[20].
Effect of GT and ER on the component distribution and LHV of bio-gas
-
Figure 4a shows that with increasing GT, the concentrations of H2, CO, and CH4 rose to 22.00%, 25.91%, and 13.59% from initial values of 12.08%, 17.46%, and 10.22%, respectively. In contrast, CO2 and CnHm decreased to 6.01% and 1.12% from 12.45% and 1.72%. Correspondingly, the LHV increased to 11.26 from 8.30 MJ/Nm3. These trends are associated with temperature-dependent reaction pathways. Elevated temperatures enhance devolatilization and oxidation processes, facilitating the formation of permanent gases such as CO, CO2, CH4, and H2. Meanwhile, reduction reactions, including the water–gas shift and Boudouard reactions, are promoted, resulting in increased CO and H2 and reduced CO2 concentrations[21−23]. The relatively moderate increase in CH4 is mainly related to secondary tar cracking and hydrogenation reactions. In addition, the decline in CnHm species is attributed to the thermal decomposition of larger hydrocarbons via C–C and C–H bond cleavage, producing lighter gaseous products. Higher temperatures favor CO and H2 production while inhibiting CO2 and light hydrocarbons, leading to an improved gas heating value[24].
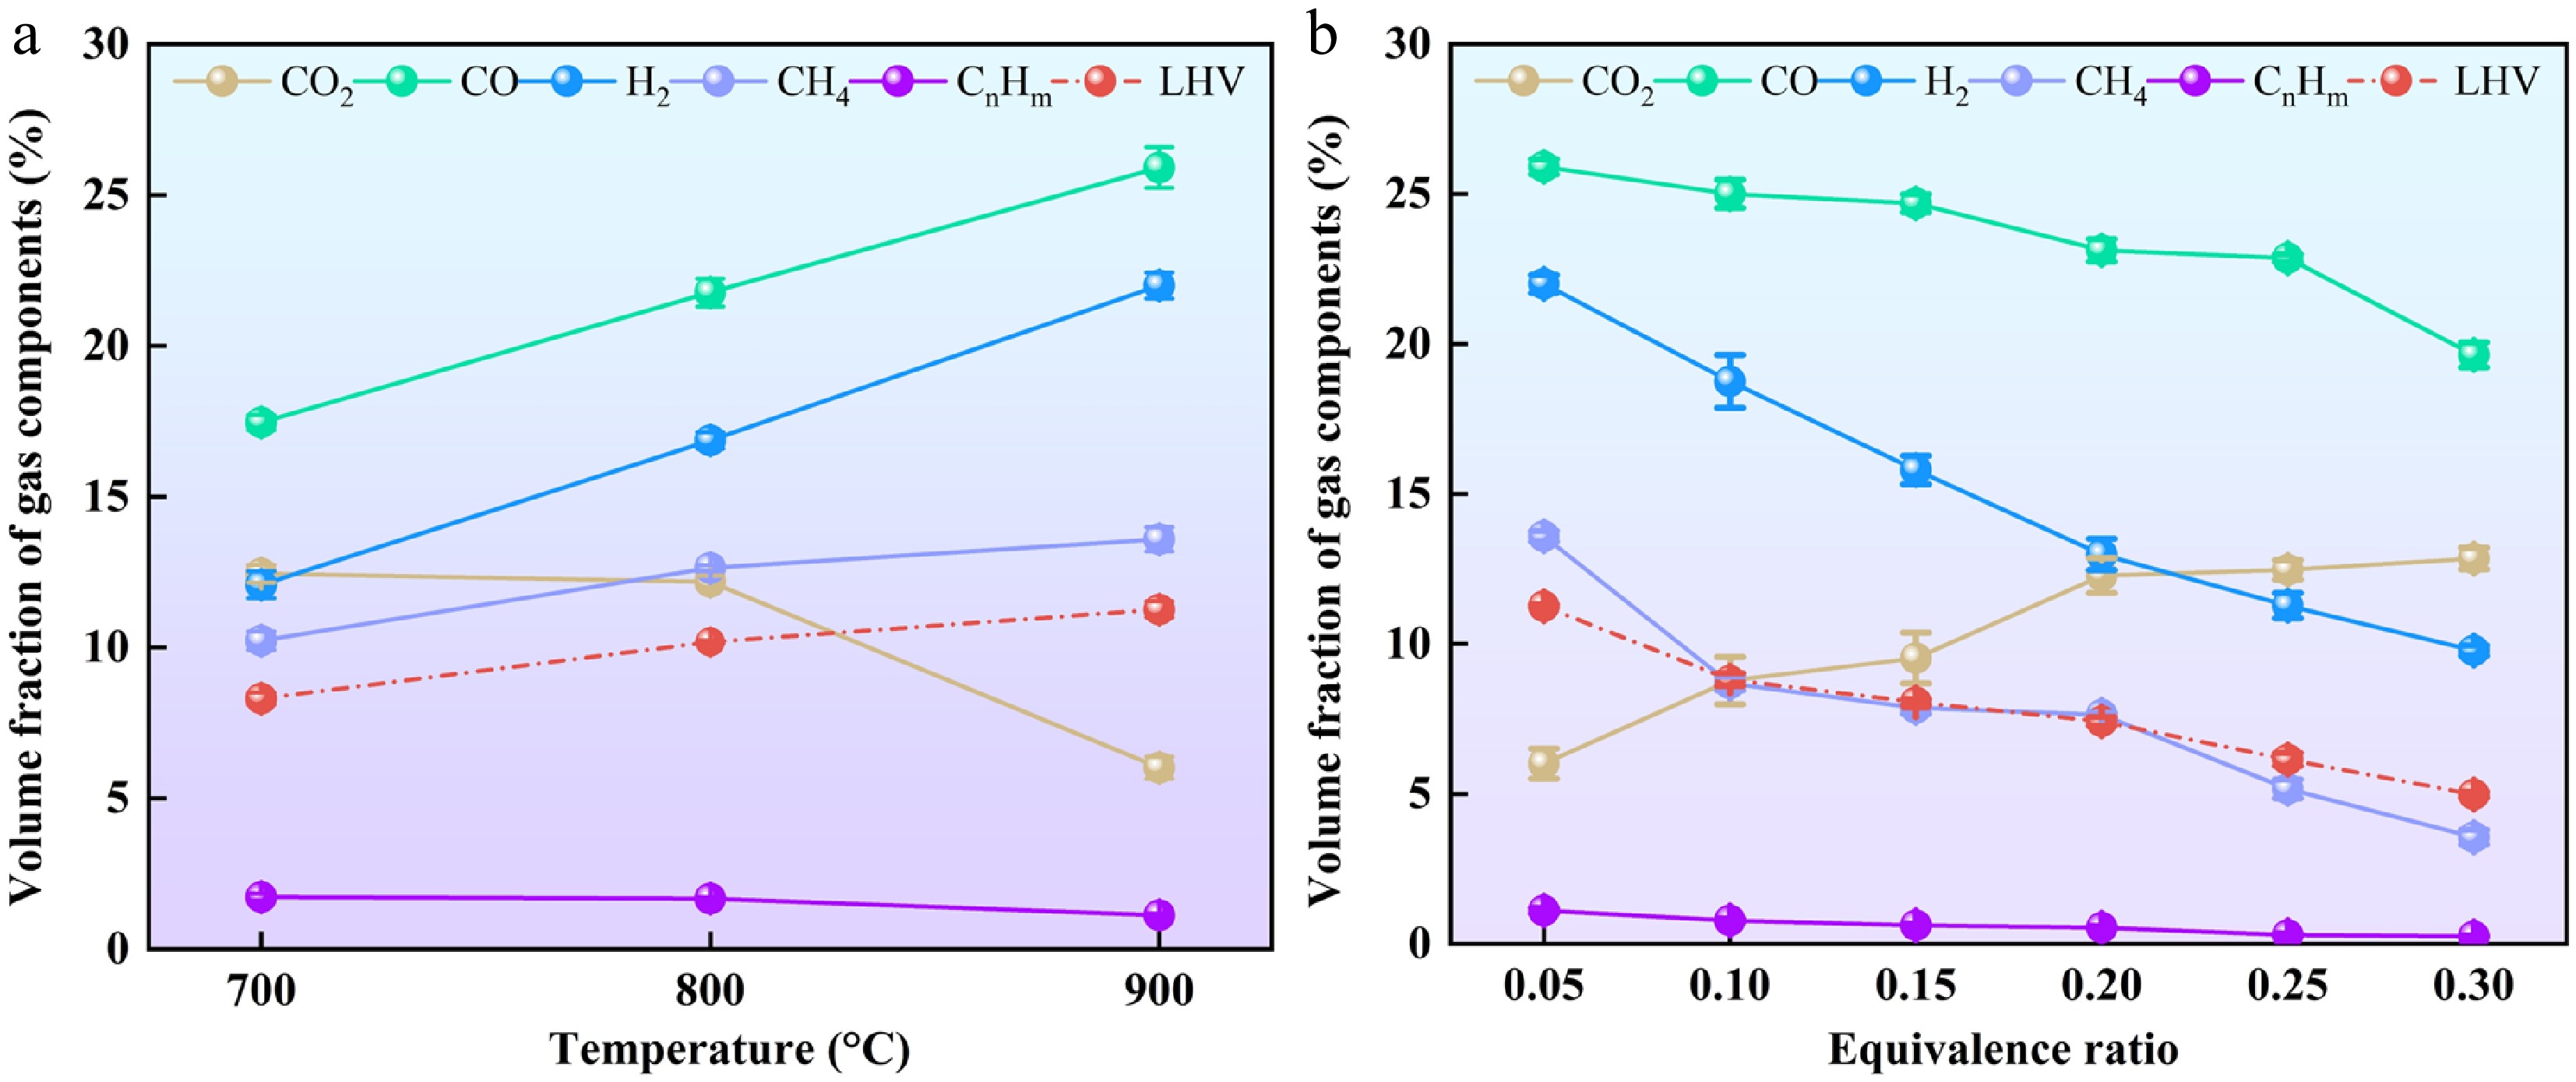
Figure 4.
Effect of (a) GT and (b) ER on the component distribution and LHV of bio-gas.
$ {\mathrm{H}}_{2}\mathrm{O}+\mathrm{C}\leftrightarrow \mathrm{CO}+{\mathrm{H}}_{2}-131.72\;\mathrm{kJ}/\text{mol} $ (5) $ \mathrm{C}+\mathrm{C}{\mathrm{O}}_{2}\leftrightarrow 2\mathrm{CO}-172.43\;\mathrm{kJ}/\text{mol} $ (6) $ \mathrm{C}+2{\mathrm{H}}_{2}\leftrightarrow \mathrm{C}{\mathrm{H}}_{4}-74.8\;\mathrm{kJ}/\text{mol} $ (7) Figure 4b shows that with increasing ER from 0.05 to 0.30, the concentrations of H2, CO, CH4, and CnHm decreased to 9.78%, 19.63%, 3.56%, and 0.25% from initial values of 22.00%, 25.91%, 13.59%, and 1.11%, respectively. In contrast, CO2 increased to 12.85% from 6.01%, while the LHV decreased to 4.98 from 11.26 MJ/Nm3.
These variations are closely related to the enhanced oxidation environment at higher ER. Increasing ER introduces more oxygen into the reactor, promoting combustion reactions of both bio-char and gaseous species, thereby converting more carbon into CO2 and H2O via reactions (8)−(10). In addition, the fraction of N2 in the product gas increases significantly at higher ER, reaching 63.79% at ER = 0.30, which dilutes the combustible components and leads to a pronounced reduction in LHV. Higher ER suppresses CO, CH4, and H2 formation, whereas CO2 shows a slight increase as oxidation reactions are strengthened[25].
$ \mathrm{C}+{\mathrm{O}}_{2}\leftrightarrow \mathrm{C}{\mathrm{O}}_{2}+393.51\;\mathrm{kJ}/\text{mol} $ (8) $ 2\mathrm{CO}+{\mathrm{O}}_{2}\leftrightarrow 2\mathrm{C}{\mathrm{O}}_{2}+565.94\;\mathrm{kJ}/\text{mol} $ (9) $ \mathrm{C}{\mathrm{H}}_{4}+2{\mathrm{O}}_{2}\leftrightarrow \mathrm{C}{\mathrm{O}}_{2}+2{\mathrm{H}}_{2}\mathrm{O}+890.36\;\mathrm{kJ}/\text{mol} $ (10) Effect of GT and ER on the properties of bio-char
-
As illustrated in Fig. 5a, increasing temperature from 700 to 900 °C led to an increase in carbon content from 63.74% to 66.25%, while hydrogen and oxygen contents declined to 1.06% and 13.81% from 1.65% and 22.24%, respectively. In addition, volatile matter showed a decreasing trend, whereas ash content increased, accompanied by a slight reduction in fixed carbon. A marginal decline in higher heating value (HHV) was also observed under higher temperature conditions.
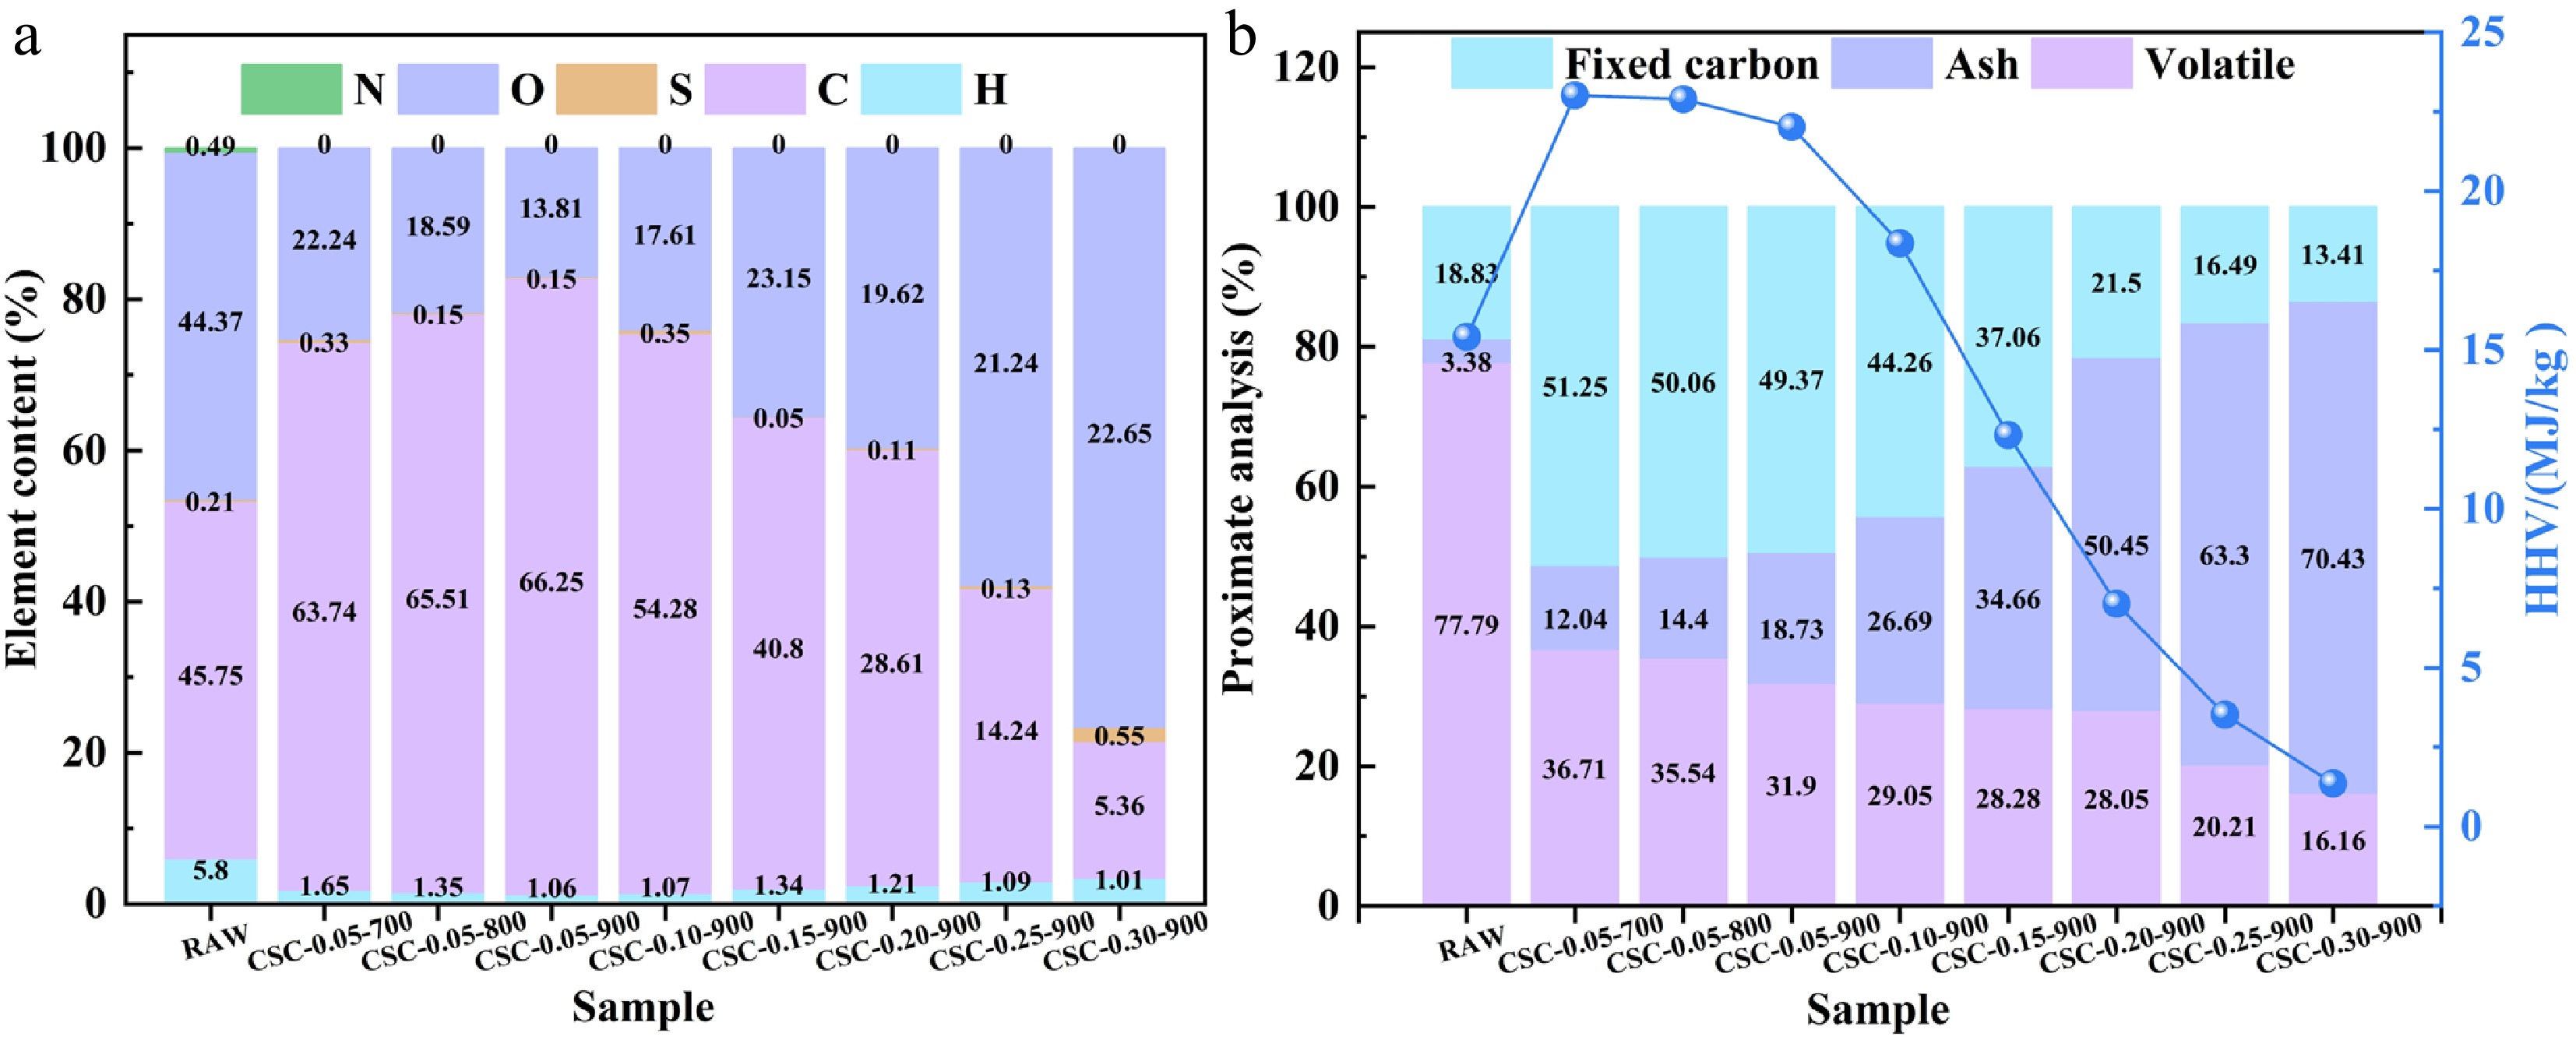
Figure 5.
Effect of (a) GT and (b) ER on the basic properties of biochar.
As illustrated in Fig. 5b, increasing ER from 0.05 to 0.30 resulted in a pronounced decline in carbon and hydrogen contents. At ER = 0.30, the C and H fractions decreased to 5.36% and 1.01%, respectively. Meanwhile, volatile matter and fixed carbon were substantially reduced, whereas ash content increased markedly, reaching 70.43%. These results indicate that under severe gasification conditions (ER = 0.30, GT = 900 °C), bio-char is extensively converted into ash. When ER exceeds 0.25, the ash content surpasses 70%, leading to a significant deterioration in HHV.
Effect of GT and ER on the composition of gasified liquid product
-
Figure 6 presents the total ion chromatography of the gasified liquid product obtained at different GTs and ERs. The detailed component of the gasified liquid product is presented in Supplementary Tables S1 and S2. The organic components of the liquid products can be classified into nine groups, including the acids, esters, aromatic hydrocarbons, aldehydes, ketones, alcohols, phenols, furans, and other aliphatic hydrocarbons.
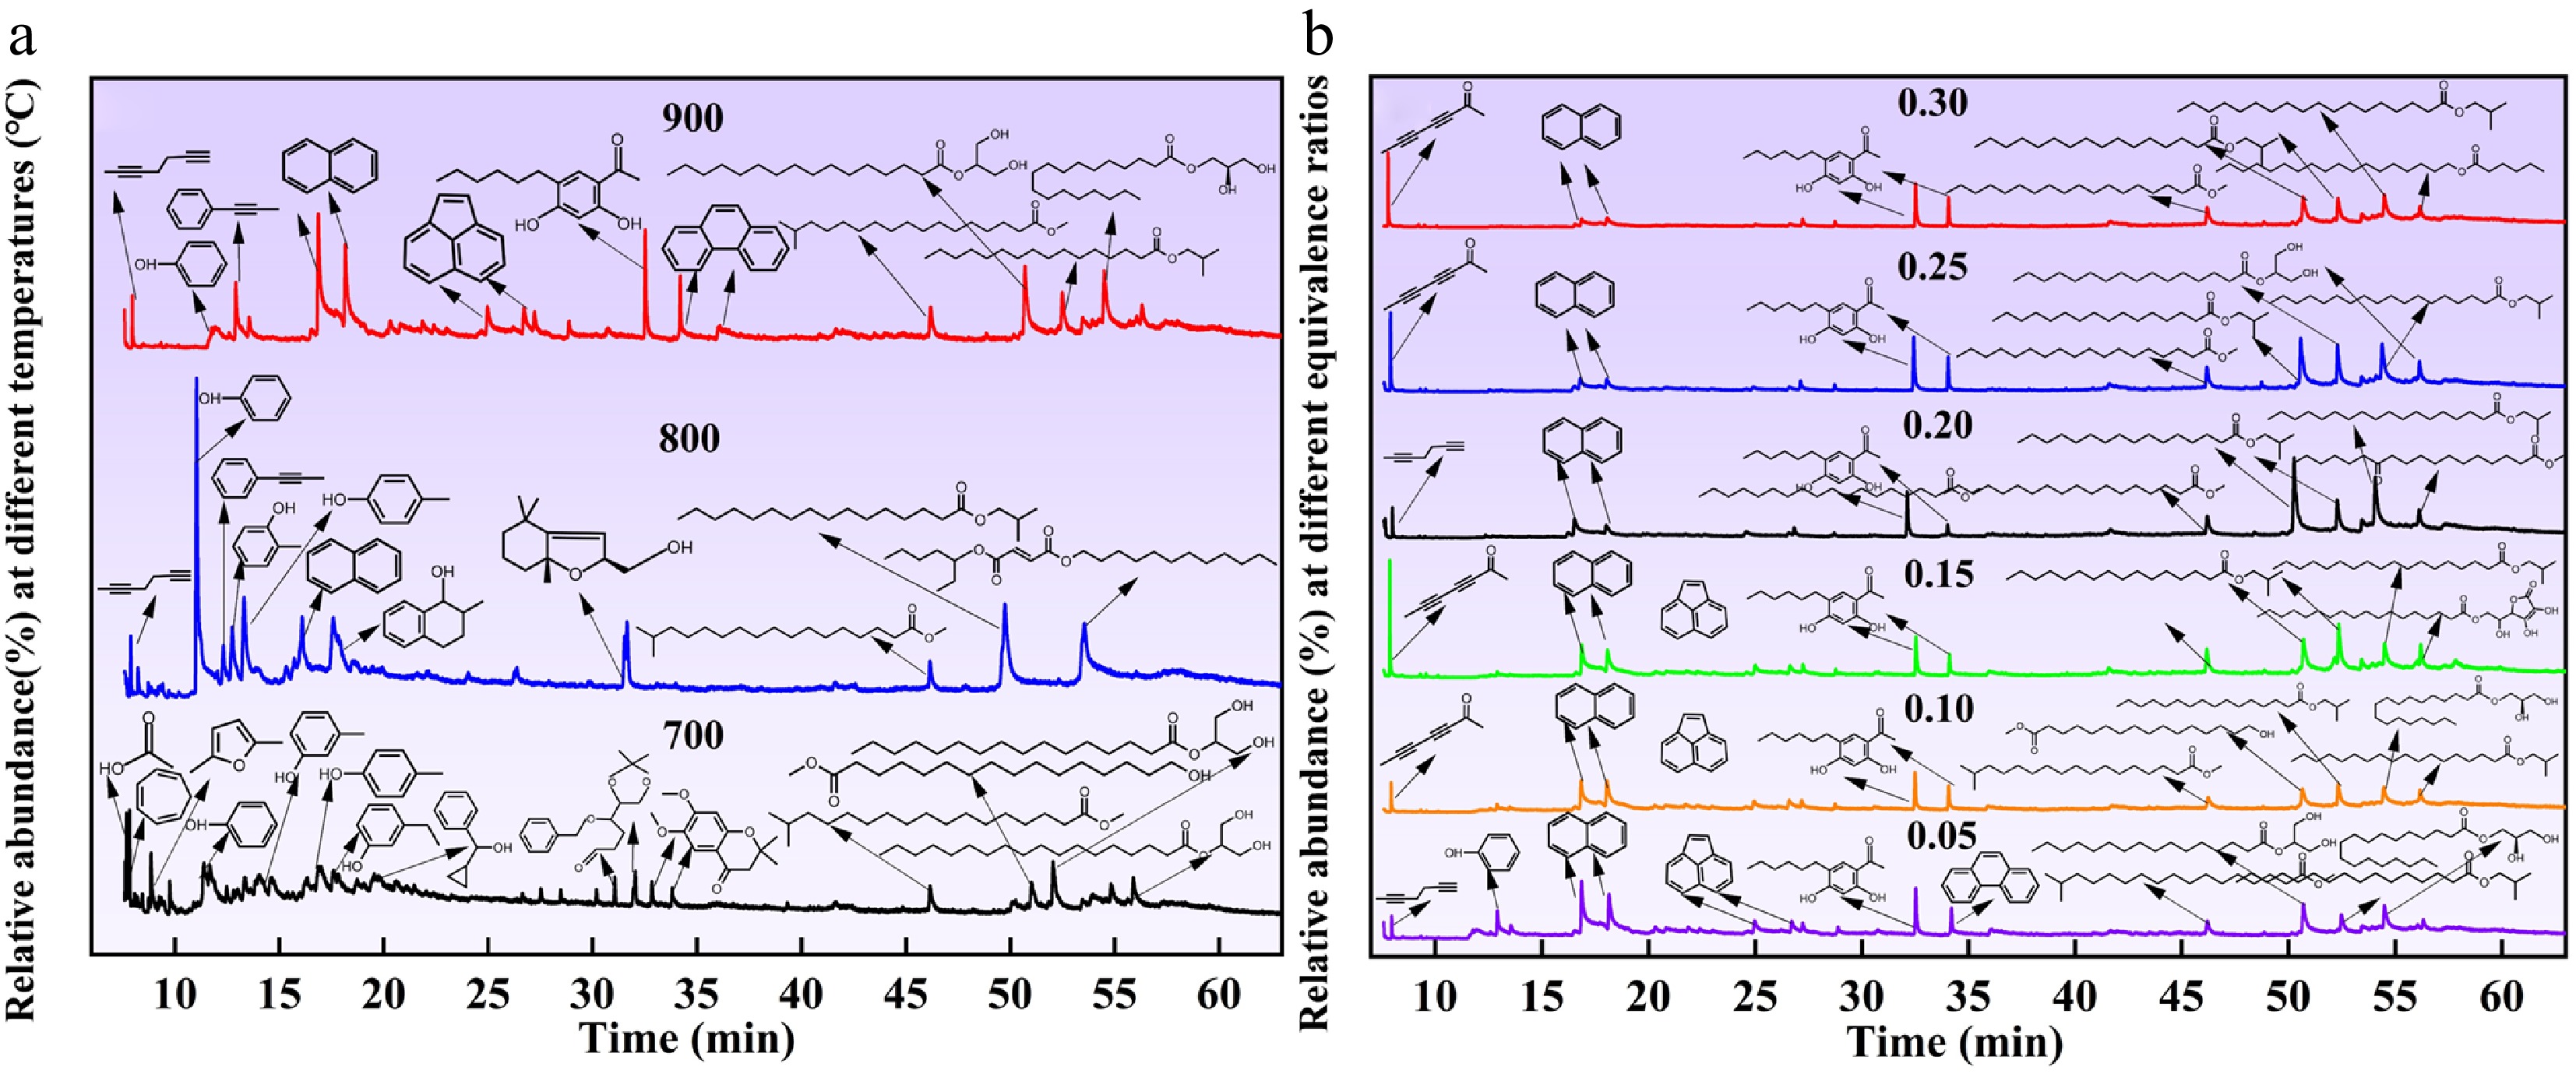
Figure 6.
The total ion chromatography of the gasified liquid product obtained at different (a) GTs and (b) ERs.
As shown in Fig. 7a, with increasing GT from 700 to 900 °C, the acid fraction decreased from 4.8% to nearly zero, which is attributed to enhanced secondary cracking reactions that convert acids into other organic species[26]. In contrast, esters and ketones increased to 30.2% and 8.87% from initial values of 20.45% and 2.29%, respectively. Meanwhile, alcohols, aldehydes, and furans decreased to 3.4%, 0%, and 0.77% from 14.82%, 9.60%, and 4.07%, respectively.
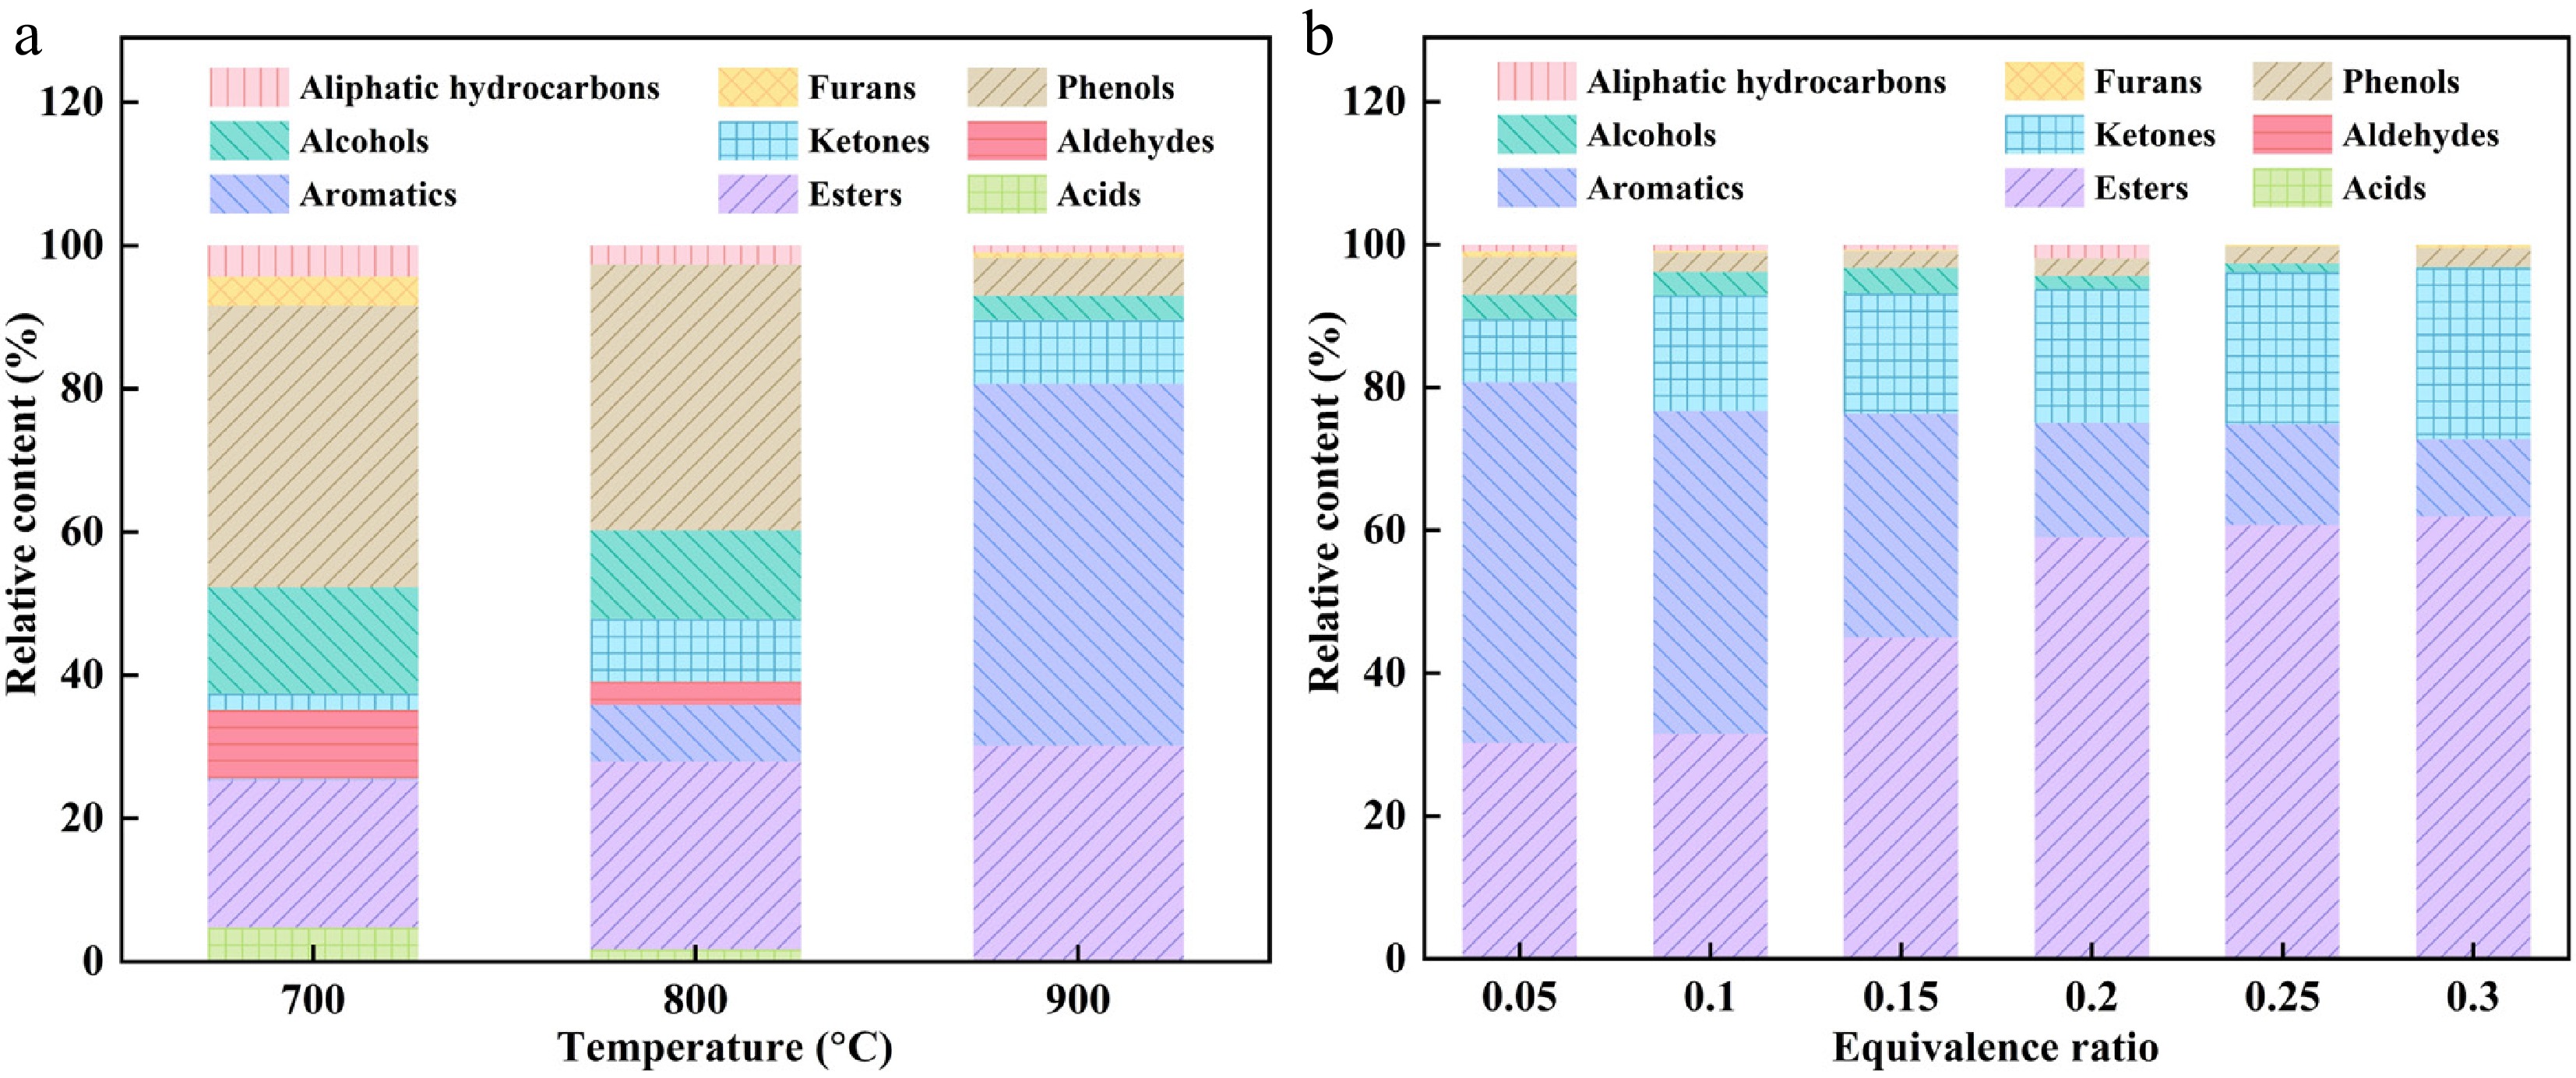
Figure 7.
Effect of (a) GT and (b) ER on the compound distribution of the gasified liquid product.
These variations are closely associated with the thermal decomposition behavior of biomass components. The formation of ketones and the decline of furans and aldehydes are mainly governed by ring-opening and depolymerization reactions of hemicellulose and cellulose, which are intensified at elevated temperatures[27]. In addition, phenols decreased markedly from 39.29% to 5.26% due to enhanced deoxygenation and aromatization reactions[28]. Conversely, aromatic hydrocarbons exhibited a substantial increase, reaching 50.5% from 0.32%, as a result of the progressive deoxygenation of oxygenated intermediates in tar[23,28]. Similar observations have been reported in previous studies, where increasing temperature promotes the conversion of tar components into aromatic hydrocarbons such as indene and naphthalene[29].
As shown in Fig. 7b, with increasing ER from 0.05 to 0.30, the ester fraction rose to 61.9% from 30.2%, whereas alcohols declined markedly to 0.12% from 3.4%, which is associated with the suppression of alcohol formation under higher oxygen availability. Previous studies have demonstrated that operating parameters such as ER play a critical role in tar formation and the distribution of oxygenated compounds during biomass gasification[30−32].
In addition, ketones exhibited an overall increase, reaching 24% from 8.87%, while furans showed a decreasing tendency, remaining at low levels (0.77% to 0.46%). The phenol content decreased from 5.26% and stabilized at approximately 2% with further increases in ER. In contrast, aromatic hydrocarbons declined significantly, dropping to 10.83% from 50.5%, which can be attributed to enhanced oxidation reactions between aromatic species and oxygen under higher ER conditions[33,34].
-
This study examines the gasification behavior of CS in a lab-scale fixed-bed reactor, with particular emphasis on the effects of GT and ER on the distribution and properties of gaseous, solid, and liquid products. The main conclusions are summarized as follows:
(1) Both GT and ER exert a strong influence on product distribution. Increasing these parameters promotes gas formation while suppressing biochar yield.
(2) GT and ER play a critical role in determining gas quality. Raising the temperature from 700 to 900 °C increases the LHV from 8.30 to 11.26 MJ/Nm3, whereas increasing ER from 0.05 to 0.30 leads to a significant decline in LHV from 11.26 to 4.98 MJ/Nm3.
(3) Elevated GT and ER adversely affect bio-char quality, resulting in reduced carbon, hydrogen, and volatile contents, accompanied by a substantial increase in ash content.
(4) Higher temperatures favor the formation of aromatic compounds in liquid products, whereas increasing ER suppresses aromatic formation, leading to a gradual decline in their abundance.
-
The authors confirm contribution to the paper as follows: study conception and design: Zhang W, Lu W, Zhang Y, Zhang T, Wang K, Ma Z; investigation: Shi Y; software: Zhu L, Cai W, Xia S; visualization: Zhu L, Cai W, Xia S; resources: Zhang W, Lu W, Zhang Y, Zhang T; draft manuscript preparation: Shi Y; writing – review & editing: Wang K, Ma Z; supervision: Zhang W, Lu W, Zhang Y, Zhang T, Wang K, Ma Z. All authors reviewed the results and approved the final version of the manuscript.
-
All data generated or analyzed during this study are included in this published article and its supplementary information files.
-
This research was supported by the 'Pioneer' and 'Leading Goose' R&D Program of Zhejiang Province (Grant Nos 2025C01173, 2024C03225), the National Natural Science Foundation of China (Grant No. 52376214).
-
The authors declare that they have no known competing financial interests or personal relationships that could have appeared to influence the work reported in this paper.
-
accompanies this paper online at: https://doi.org/10.48130/prkm-0026-0011.
- Supplementary Table S1 Effect of gasification temperature (GT) on tar composition at an equivalence ratio of 0.05.
- Supplementary Table S2 Effect of equivalence ratio (ER) on tar composition at a gasification temperature of 900 °C.
- Supplementary Text 1 Materials and methods.
- Copyright: © 2026 by the author(s). Published by Maximum Academic Press, Fayetteville, GA. This article is an open access article distributed under Creative Commons Attribution License (CC BY 4.0), visit https://creativecommons.org/licenses/by/4.0/.
-
About this article
Cite this article
Shi Y, Zhu L, Cai W, Xia S, Zhang W, et al. 2026. Optimizing the gasification performance of corn stover: regulation of the gasification temperature and the equivalence ratio in the lab-scale fixed-bed system. Progress in Reaction Kinetics and Mechanism 51: e017 doi: 10.48130/prkm-0026-0011 

Optimizing the gasification performance of corn stover: regulation of the gasification temperature and the equivalence ratio in the lab-scale fixed-bed system
- Received: 04 November 2025
- Revised: 15 February 2026
- Accepted: 24 March 2026
- Published online: 09 June 2026
Abstract: China has vast reserves of agricultural straw resources. The high-value utilization of agricultural straw through biomass gasification technology holds significant importance for China to achieve 'carbon neutrality' and 'carbon peaking'. This work systematically investigated the effects of equivalence ratio (ER) and gasification temperature (GT) on the properties of the gasified gaseous, solid, and liquid products of corn stover (CS), which was conducted in a home-made and lab-scale fixed-bed gasifier. Results showed that with the increase in GT and ER, the mass yield of bio-gas gradually increased, while the mass yield of bio-char gradually decreased. Higher GT and lower ER were beneficial for improving the lower heating value (LHV) of bio-gas. Specifically, the LHV of bio-gas reached its maximum value of 11.26 MJ/Nm3 at the GT of 900 °C and the ER of 0.05, along with the contents of H2, CO, CH4, and CnHm being 22%, 25.91%, 13.59%, and 1.12%, respectively. Furthermore, the contents of H and volatiles in bio-char significantly decreased, while the ash content significantly increased at higher GT and ER. Regarding the tar product, the contents of phenols, alcohols, acids, and aldehydes decreased at higher GT, while the contents of aromatics and ethers increased. In addition, the contents of aromatics and phenols in tar decreased at higher ER, while that of ethers increased.
-
Key words:
- Biomass /
- Corn stover /
- Fixed bed gasification /
- Producer gas /
- Bio-char /
- Tar