














-
Proton exchange membrane fuel cells (PEMFCs) electrochemically convert hydrogen and oxygen into water, generating electricity and heat while offering high efficiency, rapid response, and zero-emission operation[1−4]. PEMFC performance critically depends on effective water and heat management. On the one hand, insufficient water reduces proton conductivity in the membrane, whereas excess water condenses and accumulates in the catalytic layer (CL), gas diffusion layer (GDL), and gas channel (GC), thereby hindering oxygen transport[3−5]. On the other hand, low temperatures slow electrochemical kinetics, whereas high temperatures accelerate membrane drying and material degradation[6,7]. Therefore, stable water and heat conditions are essential for sustaining efficient dynamic electrochemical performance in PEMFCs.
Because the oxygen reduction reaction (ORR) occurs at the cathode and its kinetics are slower than those at the anode, the cathode is more prone to non-uniform water transport, which can induce oxygen transport limitations and heat accumulation. As a result, coupled water, oxygen, and heat transport in the cathode GDL often imposes a dominant constraint on performance improvement[8,9]. Prior studies indicate that optimizing the cathode GDL structure enhances water and heat transport performance[9−14]. For example, it has been reported by Chu et al.[9] that variations in GDL porosity strongly affect polarization behavior at high current densities and that higher GDL porosity enhances mass transport. An increase in effective thermal conductivity with decreasing GDL porosity has also been demonstrated by Zamel et al.[10] through computational fluid dynamics (CFD) simulations. Meanwhile, variations in liquid water content in GDLs also affect overall heat transfer performance[11]. GDL multilayering with gradient structures has gained increasing attention as a strategy to further optimize local transport relative to single-layer GDLs[12−14]. Water distribution in multilayer GDLs with a through-plane (TP) pore gradient was analyzed by Ko et al.[12] using X-ray visualization, and it was found that water content decreases as the pore gradient increases. A multilayer GDL with tapered porosity was proposed by Hao et al.[13] to enhance the overall heat transfer capacity of PEMFCs. Multilayer GDLs with gradient pores were fabricated by Balakrishnan et al.[14] using electrospinning, which improved water removal and heat dissipation efficiency, thereby enhancing high current density performance. Although numerous experiments and CFD simulations have shown that multilayer GDL structures enhance overall PEMFC performance, the microscopic mechanisms governing water and heat transport and their effects on the reaction rate remain poorly understood. Accordingly, the effects of non-uniform GDL structural characteristics on multicomponent reactive transport require further investigation.
As a carbon-based porous medium, the GDL exhibits microstructural heterogeneity that significantly influences reactive transport in PEMFCs. The lattice Boltzmann method (LBM) is a mesoscale approach well suited to handling the non-uniform structural characteristics of the GDL and to elucidating the microscopic mechanisms that govern multicomponent reactive transport in PEMFCs[15−20]. For example, LBM was coupled with deep learning by Wang et al.[15] to enable large-scale simulations and revealed multiscale water clustering and transport mechanisms across extensive dry and flooded regions in GDLs. A mesoscale model was employed by Lai & Qu[16] to analyze the effects of GDL porosity, fiber diameter, thickness, wettability, and pressure drop on water dynamics, showing that GDL porosity exerts the greatest influence on water transport. LBM-based models were employed by Habiballahi et al.[17] and Lai & Qu[18] to quantify the local TP water distribution and content in multilayer GDLs with gradient porosity, thereby further elucidating the microscopic mechanisms that enhance water removal. However, most mesoscale models simulate water generation assuming either constant-pressure or constant-velocity boundary conditions and often neglect the effects of temperature and oxygen concentration variations on dynamic reaction rates. A LBM model was recently developed by Chen et al.[19] to relate the dynamic reaction rate to oxygen concentration in PEMFCs. Similarly, a LBM with reactive boundary conditions was used by Guo et al.[20] to model water and oxygen transport and investigate how gradient porosity affects the reaction rate. However, these studies focused primarily on reactant mass transport and imposed a simplified thermal condition in the computational domain by assigning temperature as either a constant value or a constant temperature difference, without considering reaction heat generation and the associated heat transport during the dynamic reaction process. Non-uniform GDL structural variations modulate water flow, oxygen transport, and heat transfer, which are interrelated and collectively govern dynamic reaction rates. However, prior studies have not clarified the microscopic mechanisms underlying these variations when comparing single-layer and multilayer GDLs, and the combined effects on dynamic reaction rates remain poorly understood. Therefore, it is essential to develop a mesoscale model that captures the microscopic coupling of water and heat transport in single-layer and multilayer GDLs and enables a decoupling analysis to identify the determinants of dynamic reaction rates in PEMFCs. Despite its importance, such analyses remain relatively limited, motivating the present study.
To address these challenges, this study develops an LBM-based mesoscale model in which the electrochemical reaction rate is jointly governed by the oxygen concentration and a temperature-dependent rate constant in PEMFCs and investigates the microscopic mechanisms of water removal and heat accumulation in single-layer and multilayer GDLs across different porosities. Particular attention is paid to elucidating how the coupled processes of water removal and heat accumulation within the GDL affect the dynamic reaction rate, and a decoupled analysis is conducted to quantitatively identify the corresponding determinants. By means of theoretical analyses and numerical testing, this work rigorously confirms the accuracy and reliability of the proposed model. Through detailed examination, this work comprehensively provides a decoupling analysis of the microscopic mechanisms governing water removal and heat accumulation in single-layer and multilayer GDLs and quantifies the impact on the dynamic reaction rate, thereby offering targeted guidance for GDL structural design in PEMFCs.
-
In this model, the coupling between flow and heat/mass transfer is assumed to be unidirectional, with the numerically computed flow field directly incorporated into the heat and mass transfer models[21]. In addition, given that the temperature range considered in this work is relatively low and the maximum ratio of the latent heat of water vaporization to the overall reaction enthalpy is about 15% according to the NIST Chemistry WebBook[22], evaporation and latent heat are considered to have limited effects and are neglected, while water is assumed to remain in the liquid state, consistent with the assumptions adopted in previous studies[15−20,23]. The multicomponent flow in the PEMFC is described by the Navier–Stokes equations[8,21]:
$ \nabla \cdot \boldsymbol{u}=0 $ (1) $ \rho \dfrac{\partial \boldsymbol{u}}{\partial t}+\rho \left(\boldsymbol{u}\cdot \nabla \right)\boldsymbol{u}=-\nabla p+\nabla \cdot \left[\mu \left(\nabla \boldsymbol{u}+{\nabla \boldsymbol{u}}^{T}\right)\right]+{F}_{S} $ (2) where,
$ \boldsymbol{u} $ $ \rho $ $ p $ $ \mu $ $ \cdot $ $ {F}_{S} $ The corresponding equation for heat transfer is expressed as follows[21]:
$ \nabla \cdot \left(\boldsymbol{u}T\right)=\nabla \cdot \left(\dfrac{\lambda }{\rho {c}_{p}}\nabla T\right)+{S}_{T} $ (3) where,
$ \lambda $ $ {c}_{p} $ $ T $ $ {S}_{T} $ $ {S}_{T}=\Delta {H}_{T}\dfrac{{S}^{\alpha }}{\rho {c}_{p}} $ (4) where,
$ \Delta {H}_{T} $ $ \Delta H $ $ \Delta {H}_{T} $ $ {S}^{\alpha } $ $ \alpha $ Owing to the significantly slower diffusion of water relative to oxygen in PEMFCs, the mass transfer model accounts only for oxygen transport[19,20]. The corresponding governing equation is expressed as follows[20,21]:
$ \nabla \cdot \left(\boldsymbol{u}C\right)=\nabla \left(D\nabla C\right)+{S}^{\alpha } $ (5) where,
$ C $ $ D $ Electrochemical reaction model
-
In the PEMFC, the electrochemical reaction considered in this work involves the reaction of hydrogen and oxygen to produce water, electricity, and heat, with Pt/C serving as the catalyst. This reaction is expressed as follows[2]:
$ {\text{H}}_{2}+0.5{\text{O}}_{2}\rightarrow {\text{H}}_{2}\text{O}+\text{electricity}+\text{heat} $ (6) The cathodic ORR exhibits slower kinetics than the anodic reaction and is more strongly affected by non-uniform water distribution, oxygen transport, and heat transfer limitations. Therefore, this work focuses on the cathode process and specifically resolves mesoscale multicomponent mass and heat transport in the GDL; therefore, an overall electrochemical reaction expression is adopted as follows[2,19−21]:
$ {\text{2H}}^++0.5{\text{O}}_{2}+{2\text{e}}^-\rightarrow {\text{H}}_{2}\text{O} $ (7) Accordingly, the dynamic electrochemical reaction is modeled as a function of both oxygen concentration and temperature in this work. This treatment provides a more comprehensive description than previous approaches that either employed constant-pressure or constant-velocity boundary conditions[15−18] or considered reaction rate variations driven solely by oxygen concentration while neglecting temperature effects[19,20]. The dynamic oxygen reaction rate
$ {J}^{oxygen} $ $ {k}_{elec} $ $ {C}^{oxygen} $ $ {J}^{oxygen}={k}_{elec}\left(T\right){C}^{oxygen} $ (8) $ {k}_{elec}\left(T\right)=\dfrac{{i}_{0}}{4F{C}^{ref}}\left({e}^{\dfrac{-{a}_{e}F}{RT}\eta }-{e}^{\dfrac{\left(1-{a}_{e}\right)F}{RT}\eta }\right) $ (9) $ {i}_{0}=i_{0}^{ref}\exp \left(-7900\left(\dfrac{1}{T}-\dfrac{1}{353.15}\right)\right) $ (10) where,
$ {k}_{elec}\left(T\right) $ $ {i}_{0} $ $ F $ $ {C}^{ref} $ $ {a}_{e} $ $ R $ $ \eta $ $ {J}^{water} $ $ {J}^{oxygen} $ $ {J}^{water}={2J}^{oxygen} $ (11) Accordingly, the expression for
$ {S}^{\alpha }\left(x,t\right) $ $ {S}^{oxygen}\left(x,t\right)=-\dfrac{1}{V}\sum{M}^{oxygen}{J}^{oxygen}A $ (12) $ {S}^{water}\left(x,t\right)=\dfrac{1}{V}\sum{M}^{water}{J}^{water}A $ (13) where,
$ V $ $ A $ $ M $ LBM solving model
LBM solving for multicomponent flow
-
Due to the superior capability of the LBM in handling complex fluid-solid interfaces and multicomponent flow interactions[22,27−30], this study integrates the LBM with the Shan–Chen model to simulate multicomponent flow in PEMFCs. The evolution equation applies the multiple-relaxation-time (MRT) LBM model to enhance computational stability[29,30], and is expressed as follows:
$ \begin{array}{c} f_{k}^{a}\left(x+{\overrightarrow{e}}_{k}{\Delta }t,t+{\Delta }t\right)-f_{k}^{a}\left(x,t\right)=-\left[{\left({M}^{a}\right)}^{-1}{\mathit{\Lambda }}^{a}{M}^{a}\right]\left(f_{k}^{a}\left(x,t\right)-f_{k}^{a,eq}\left(x,t\right)\right)+\\ \left[{\left({M}^{a}\right)}^{-1}\left(I-{\mathit{\Lambda }}^{a}/2\right){M}^{a}\right]\left(F_{k}^{a}\left(x,t\right)+S_{k}^{a}\left(x,t\right)\right) \end{array} $ (14) where,
$ f_{k}^{a}\left(x,t\right) $ $ x $ $ t $ $ a $ $ eq $ The D2Q9 model is employed in this work, where
$ {\overrightarrow{e}}_{k} $ $ {M}^{a} $ 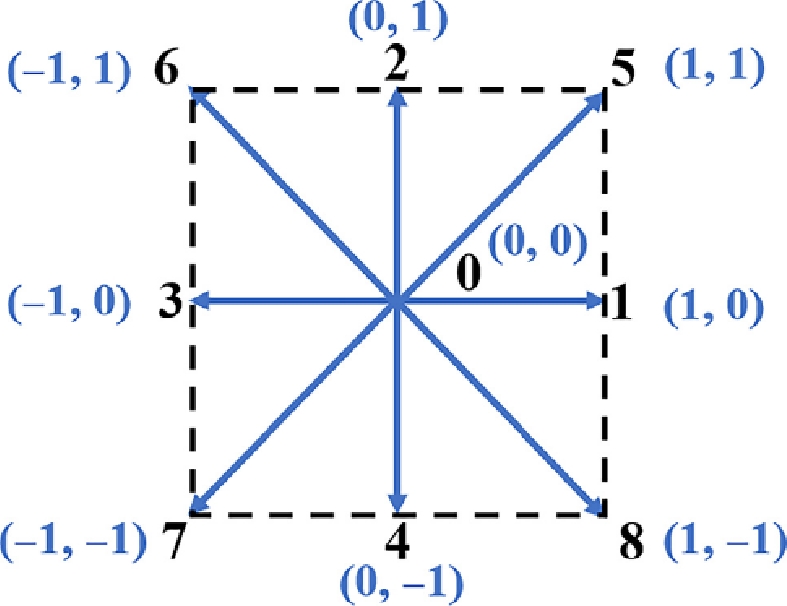
Figure 1.
Discrete velocity vectors of the D2Q9 model.
$ {\overrightarrow{e}}_{k}=\left\{\begin{aligned} &\left(0{,}0\right),&&k=0&\\ &\left(\pm 1{,}0\right)c,\left(0,\pm 1\right)c,&&k=1\sim 4&\\ &\left(\pm 1,\pm 1\right)c,&&k=5\sim 8&\end{aligned}\right. $ (15) $ {M}^{a}=\left(\begin{array}{ccccccccc} 1 & 1 & 1 & 1 & 1 & 1 & 1 & 1 & 1\\ -4 & -1 & -1 & -1 & -1 & 2 & 2 & 2 & 2\\ 4 & -2 & -2 & -2 & -2 & 1 & 1 & 1 & 1\\ 0 & 1 & 0 & -1 & 0 & 1 & -1 & -1 & 1\\ 0 & -2 & 0 & 2 & 0 & 1 & -1 & -1 & 1\\ 0 & 0 & 1 & 0 & -1 & 1 & 1 & -1 & -1\\ 0 & 0 & -2 & 0 & 2 & 1 & 1 & -1 & -1\\ 0 & 1 & -1 & 1 & -1 & 0 & 0 & 0 & 0\\ 0 & 0 & 0 & 0 & 0 & 1 & -1 & 1 & -1 \end{array}\right) $ (16) where,
$ c $ $ {\mathit{\Lambda }}^{a} $ $ {\mathit{\Lambda }}^{a}=diag\left(\lambda _{0}^{a},\;\lambda _{1}^{a},\;\lambda _{2}^{a},\;\lambda _{3}^{a},\;\lambda _{4}^{a},\;\lambda _{5}^{a},\;\lambda _{6}^{a},\;\lambda _{7}^{a},\;\lambda _{8}^{a}\right) $ (17) where,
$ \lambda _{0}^{a}=1.0 $ $ \lambda _{1}^{a}=1.4 $ $ \lambda _{2}^{a}=1.4 $ $ \lambda _{3}^{a}=1.0 $ $ \lambda _{4}^{a}=1.2 $ $ \lambda _{5}^{a}=1.0 $ $ \lambda _{6}^{a}=1.2 $ $ \lambda _{7}^{a}=\lambda _{8}^{a}=\lambda _{\rho }^{a} $ $ \lambda _{\rho }^{a} $ $ {\upsilon }^{a} $ $ {v}^{a}=c_{s}^{2}\left(1/\lambda _{\rho }^{a}-1/2\right){\Delta }t $ (18) where,
$ {c}_{s} $ $ {c}_{s}=c/\sqrt{3} $ $ c={\Delta }x/{\Delta }t $ $ {\Delta }x $ $ {\Delta }t $ $ {c}_{s} $ $ 1/\sqrt{3} $ In Eq. (12),
$ f_{k}^{a,eq}\left(x,t\right) $ $ f_{k}^{a,eq}\left(x,t\right)={w}_{k}{\rho }^{a}\left(1+\dfrac{{\overrightarrow{e}}_{k}\cdot {\overrightarrow{u}}^{eq}\left(x,t\right)}{c_{s}^{2}}+\dfrac{{\left({\overrightarrow{e}}_{k}\cdot {\overrightarrow{u}}^{eq}\left(x,t\right)\right)}^{2}}{2c_{s}^{4}}-\dfrac{{\left| {\overrightarrow{u}}^{eq}\left(x,t\right)\right| }^{2}}{2c_{s}^{2}}\right) $ (19) $ {w}_{k}=\left\{\begin{aligned} & 4/9&&k=0&\\ &1/9&&k=1\sim 4&\\ &1/36&&k=5\sim 8& \end{aligned}\right. $ (20) where,
$ {w}_{k} $ $ {\rho }^{a} $ $ {\overrightarrow{u}}^{eq}\left(x,t\right) $ $ {\overrightarrow{u}}^{eq}(x,t)=\dfrac{{\displaystyle\sum}_{a}\lambda _{0}^{a}{\rho }^{a}\left(x,t\right){\overrightarrow{u}}^{a}\left(x,t\right)}{{\displaystyle\sum}_{a}\lambda _{0}^{a}{\rho }^{a}\left(x,t\right)} $ (21) $ {\rho }^{a}\left(x,t\right){\overrightarrow{u}}^{a}\left(x,t\right)={\sum}_{k}f_{k}^{a}\left(x,t\right){\overrightarrow{e}}_{k}+\dfrac{\delta t}{2}{\overrightarrow{F}}^{a}\left(x,t\right) $ (22) $ {\rho }^{a}\left(x,t\right)={\sum}_{k}f_{k}^{a}(x,t) $ (23) The force term
$ F_{k}^{a} $ $ F_{k}^{a}\left(x,t\right)=\dfrac{{\overrightarrow{F}}^{a}\left(x,t\right)\cdot \left({\overrightarrow{e}}_{k}-{\overrightarrow{u}}^{eq}\left(x,t\right)\right)}{{\rho }^{a}\left(x,t\right)c_{s}^{2}}f_{k}^{a,eq}\left(x,t\right) $ (24) where,
$ {\overrightarrow{F}}^{a}\left(x,t\right) $ $ {\overrightarrow{F}}^{a}\left(x,t\right)=\overrightarrow{F}_{ff}^{a}\left(x,t\right)+\overrightarrow{F}_{fw}^{a}\left(x,t\right) $ (25) where,
$ \overrightarrow{F}_{ff}^{a}\left(x,t\right) $ $ \overrightarrow{F}_{fw}^{a}\left(x,t\right) $ $ \overrightarrow{F}_{ff}^{a}\left(x,t\right)=-{\psi }_{a}\left(x,t\right)\sum\limits_{0}^{k}{G}^{a\beta }{w}_{k}{\psi }_{\beta }\left(x+{\overrightarrow{e}}_{k}{\Delta }t,t\right){\overrightarrow{e}}_{k} $ (26) $ \overrightarrow{F}_{fw}^{a}\left(x,t\right)=-{\psi }_{a}\left(x,t\right)\sum\limits_{0}^{k}G_{a}^{as}{w}_{k}s\left(x+{\overrightarrow{e}}_{k}{\Delta }t\right){\overrightarrow{e}}_{k} $ (27) where,
$ {G}^{a\beta } $ $ G_{a}^{as} $ $ s\left(x\right) $ $ {\psi }_{a}\left(x,t\right) $ $ {\psi }_{a}\left(x,t\right)=1-exp\left(-{\rho }^{a}\left(x,t\right)\right) $ (28) In Eq. (14),
$ S_{k}^{a}\left(x,t\right) $ $ S_{k}^{a}\left(x,t\right)={w}_{k}{S}^{a}\left(x,t\right)\left(1+\dfrac{{\overrightarrow{e}}_{k}\cdot {\overrightarrow{u}}^{eq}\left(x,t\right)}{c_{s}^{2}}+\dfrac{{\left({\overrightarrow{e}}_{k}\cdot {\overrightarrow{u}}^{eq}\left(x,t\right)\right)}^{2}}{2c_{s}^{4}}-\dfrac{{\left| {\overrightarrow{u}}^{eq}\left(x,t\right)\right| }^{2}}{2c_{s}^{2}}\right) $ (29) LBM solving for heat transport
-
In the heat transport simulation, the D2Q9 model is simplified to the D2Q5 model because previous studies have shown that reducing the number of discrete velocity directions does not compromise numerical accuracy[21]. The temperature evolution equation is then given by[21]:
$ {h}_{k}\left(x+{\overrightarrow{e}}_{k}{\Delta }t,t+{\Delta }t\right)-{h}_{k}\left(x,t\right)=-1/{\tau }_{h}\left({h}_{k}\left(x,t\right)-h_{k}^{eq}\left(x,t\right)\right)+J_{k}^{T}{\Delta }t{S}_{T}\left(x,t\right) $ (30) where,
$ {h}_{k}\left(x,t\right) $ $ k $ $ h_{k}^{eq}\left(x,t\right) $ $ h_{k}^{eq}\left(x,t\right)=T\left(J_{k}^{T}+{K}^{T}{\overrightarrow{e}}_{k}\left(x,t\right)\cdot {\overrightarrow{u}}^{eq}\left(x,t\right)\right) $ (31) where,
$ {K}^{T} $ $ {\alpha }^{a} $ $ T $ $ J_{k}^{T} $ $ J_{k}^{T}=\left\{\begin{aligned} & J_{0}^{T}&&k=0&\\ &\left(1-J_{0}^{T}\right)/4&&k=1{,}2,3{,}4& \end{aligned}\right. $ (32) where,
$ J_{0}^{T} $ $ T $ $ T={\sum}_{k}{h}_{k}\left(x,t\right) $ (33) In Eq. (30),
$ {\tau }_{h} $ $ {\alpha }^{a} $ $ {\alpha }^{a}=\dfrac{1}{2}\left(1-{K}^{T}\right)\left({\tau }_{h}-0.5\right)\dfrac{{\Delta }{x}^{2}}{{\Delta }t} $ (34) LBM solving for mass transfer
-
In the mass transfer simulations, the D2Q5 model is likewise employed as described in Eq. (30), and the concentration evolution equation is given by[33]:
$ g_{k}^{a}\left(x+{\overrightarrow{e}}_{k}{\Delta }t,t+{\Delta }t\right)-g_{k}^{a}\left(x,t\right)=-1/\tau _{g}^{a}\left(g_{k}^{a}\left(x,t\right)-g_{k}^{a,eq}\left(x,t\right)\right)+J_{k}^{c}{\Delta }t{S}^{\alpha }\left(x,t\right) $ (35) where,
$ g_{k}^{a}\left(x,t\right) $ $ k $ $ g_{k}^{a,eq}\left(x,t\right) $ $ g_{k}^{a,eq}\left(x,t\right)={C}^{a}\left(J_{k}^{c}+{K}^{c}{\overrightarrow{e}}_{k}\left(x,t\right)\cdot {\overrightarrow{u}}^{eq}\left(x,t\right)\right) $ (36) where,
$ {K}^{c} $ $ {C}^{a} $ $ J_{k}^{c} $ $ {C}^{a} $ $ {C}^{a}={\sum}_{k}g_{k}^{a}\left(x,t\right) $ (37) In Eq. (35),
$ \tau _{g}^{a} $ $ {D}^{a} $ $ {D}^{a}={C}_{Q}\left(1-J_{0}^{c}\right)\left(\tau _{g}^{a}-0.5\right)\dfrac{{\Delta }{x}^{2}}{{\Delta }t} $ (38) where,
$ {C}_{Q} $ $ {C}^{oxygen,top} $ $ {C}^{oxygen,top}=\dfrac{0.21{p}_{0}}{RT} $ (39) Model validation
-
A computer simulation code was implemented in C++ on a GPU-based parallel computing framework, following Eqs. (1)−(39). Accordingly, numerical simulations were performed to validate the model, including diffusion and reactive transport, heat transport, spurious velocity, a Laplace law bubble test, and fluid-solid contact angle variation, with the detailed results shown in Supplementary File 1 (Figs. S1−S5).
Model parameters, initial and boundary conditions
-
Figure 2a presents a schematic of PEMFC operation and highlights the mechanisms underlying reaction-generated water and heat. As water is generated and oxygen is consumed at the cathode, the model exclusively focuses on this side. The dynamic reaction rate in the CL is determined by both oxygen concentration and temperature, as defined in Eq. (6), while oxygen diffusing from the GC to the CL is progressively consumed there. Simultaneously, water and heat generated in the CL migrate through the GDL toward the GC. Therefore, the two-dimensional TP GDL effectively captures the dominant relative variation trends in the coupled transport of water, oxygen, and heat, which have also been validated in many experimental studies[34,35]. Accordingly, the computational domain (Fig. 2b) in this work is defined as a two-dimensional TP slice aligned with the gas flow direction beneath the GC centerline and mainly focuses on the relative variations in the coupled transport of water, oxygen, and heat within the GDL. The domain measures 2,002 μm × 411 μm and is discretized into a uniform grid of 2,002 × 411 lattice cells, comprising a GC (2,002 μm × 252 μm), a GDL (2,002 μm × 150 μm), an MPL (2,002 μm × 8 μm), and a simplified CL (2,002 μm × 1 μm). The electrode contact angle is set to 120°, indicating hydrophobicity. Given that MPL micropores (tens of nanometers) are significantly smaller than crack widths (micrometer scale)[36], the microporous structure is simplified, whereas crack structures are explicitly represented. The MPL crack depth and width are uniformly set to 4 and 10 μm, respectively[20], and the CL is modeled as a simplified layer beneath the MPL. Since the conversion between the physical time and the lattice time step is given by
$ {\Delta }{t}_{phys}={v}_{LBM}\dfrac{{\Delta }x_{phys}^{2}}{{v}_{phys}} $ $ {\Delta }{t}_{phys} $ $ {C}^{oxygen,top} $ $ {T}^{top} $ 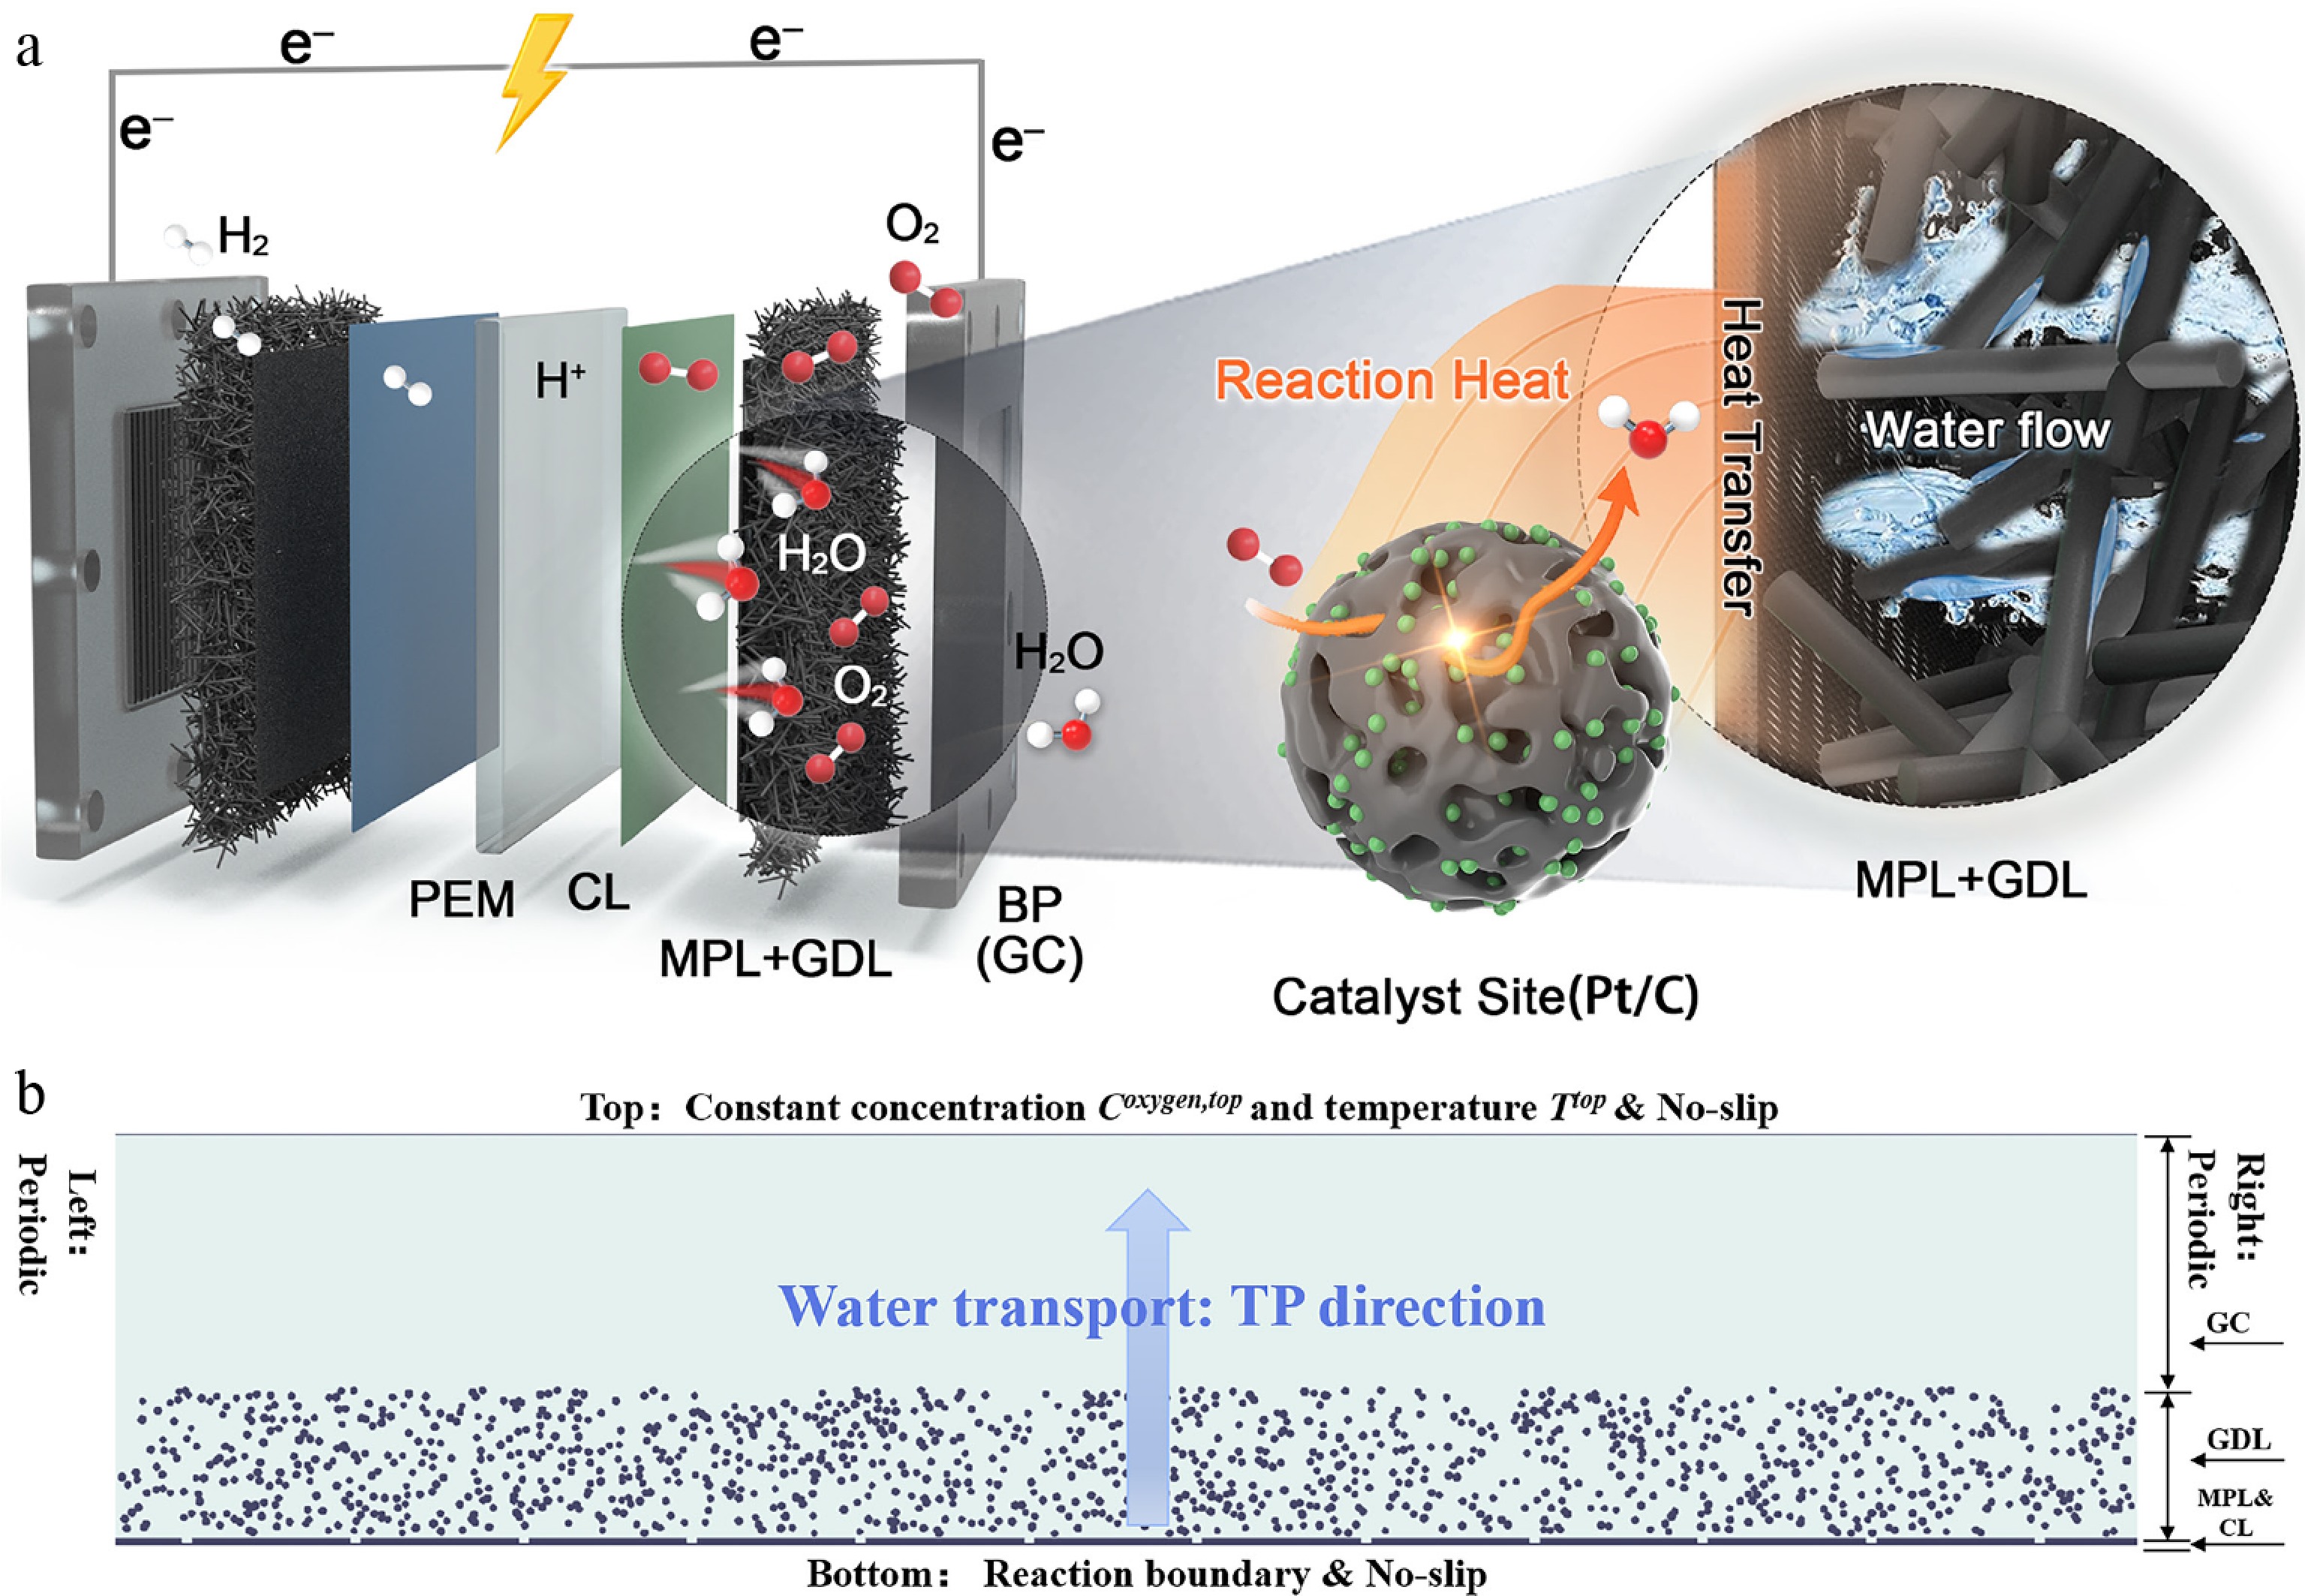
Figure 2.
(a) Schematic of PEMFC operation; (b) structure of the computational domain.
Table 1. The values of some basic parameters for LBM simulations.
Parameter Symbol Value and unit Oxygen concentration at GC top $ {C}^{oxygen,top} $ 7.25 mol m−3 Temperature at GC top $ {T}^{top} $ 303 K Atmospheric pressure $ {p}_{0} $ 101,325.0 Pa Faraday constant $ F $ 96,487.0 C mol−1 Universal gas constant $ R $ 8.314 J mol−1 K−1 Transfer coefficient $ {a}_{e} $ 0.61 Reference oxygen concentration $ {C}^{ref} $ 40.96 mol m−3 Thermal diffusivity of water $ {\alpha }^{water} $ 1.65 × 10⁻⁷ m2 s−1 Thermal diffusivity of air $ {\alpha }^{air} $ 3.03 × 10⁻⁵ m2 s−1 Thermal diffusivity of solid $ {\alpha }^{solid} $ 1.56 × 10⁻⁵ m2 s−1 Enthalpy of reaction $ \Delta H $ −1.78 × 10⁷ J kg−1 Density of water $ {\rho }^{water} $ 995.65 kg m−3 Density of air $ {\rho }^{air} $ 1.15 kg m−3 Viscosity of water $ {\mu }^{water} $ 7.98 × 10⁻⁴ Pa s Viscosity of air $ {\mu }^{air} $ 1.86 × 10⁻⁵ Pa s Overpotential $ \eta $ −1.0 V Reference current density $ i_{0}^{ref} $ 0.01 A m−2 Oxygen diffusion coefficient in GDL pore $ {D}_{GDL} $ 3.0 × 10⁻⁵ m2 s−1 Oxygen diffusion coefficient in water $ {D}_{W} $ 6.7 × 10⁻⁹ m2 s−1 Oxygen diffusion coefficient in MPL $ {D}_{MPL} $ 1.5 × 10⁻⁶ m2 s−1 Oxygen diffusion coefficient in CL $ {D}_{CL} $ 6.0 × 10⁻⁷ m2 s−1 Physical length of one lattice $ {\Delta }{x}_{phys} $ 1.0 × 10⁻⁶ m Physical time of one LBM time step $ {\Delta }{t}_{phys} $ 4.7 × 10⁻⁸ s The values of some basic parameters come from http://webbook.nist.gov/chemistry/fluid and several works[19,20,40,41].A stochastic reconstruction algorithm is employed to generate the GDL pore structure, in which an initial random seed is specified, and carbon fibers are randomly and progressively deposited until the prescribed global porosity is reached. The reconstructed geometry is then converted into a binary structure consisting of solid and pore phases for mesoscale simulations[42]. Table 2 summarizes the structural parameters used across all simulation cases. These parameters include a single-layer GDL with varying porosity (0.600−0.900, Cases 1−7). Using the porosity of Case 5 as the baseline, multilayer GDLs are then examined by dividing the GDL along the TP direction into three layers of uniform thickness, each with a thickness of 50 μm, denoted as the bottom, middle, and top layers from the GDL-MPL interface to the GDL-CL interface. The TP porosity gradients across the bottom, middle, and top layers are then varied in Cases 8–15, with interlayer porosity differences of −0.100, −0.075, −0.050, −0.025, 0.025, 0.050, 0.075, and 0.100. In all cases, the fiber diameter is sampled from the same normal distribution and constrained to 7–10 μm, consistent with values reported in the literature[5]. This work further quantifies the pore size distribution (Fig. 3a) and tortuosity (Fig. 3b) for all considered cases. Consistent with extensive experimental evidence[43], increasing GDL porosity leads to larger overall pore sizes and reduced tortuosity. Figure 3c and d further illustrate the TP porosity distributions corresponding to the different GDL configurations. Meanwhile, a representative two-dimensional GDL simulation yields an effective thermal conductivity of 1.57 W m−1 K−1, compared with 1.8 W m−1 K−1 obtained from three-dimensional experiments with the same porosity and thickness[35]. The discrepancy is mainly attributed to fewer fiber contacts in two-dimensional representations than in real three-dimensional microstructures, and the deviation remains acceptable. For cross-case comparison, the transient results are evaluated using the same steady-state criteria as those used in prior studies[20,38], with steady-state reached when water reaches the GC top boundary or when the temporal variation in GDL water saturation becomes sufficiently small.
Table 2. Structural parameters of the single-layer and the multilayer GDL.
Single-layer GDL Multilayer GDL Case PTP DP (µm) Case PTP (bottom-middle-top) DP (µm) Case 1 0.600 7−10 Case 8 0.900−0.800−0.700 7−10 Case 2 0.650 7−10 Case 9 0.875−0.800−0.725 7−10 Case 3 0.700 7−10 Case 10 0.850−0.800−0.750 7−10 Case 4 0.750 7−10 Case 11 0.825−0.800−0.775 7−10 Case 5 0.800 7−10 Case 12 0.775−0.800−0.825 7−10 Case 6 0.850 7−10 Case 13 0.750−0.800−0.850 7−10 Case 7 0.900 7−10 Case 14 0.725−0.800−0.875 7−10 Case 15 0.700−0.800−0.900 7−10 PTP represents the GDL porosity along the TP direction; DP refers to the GDL fiber diameter. 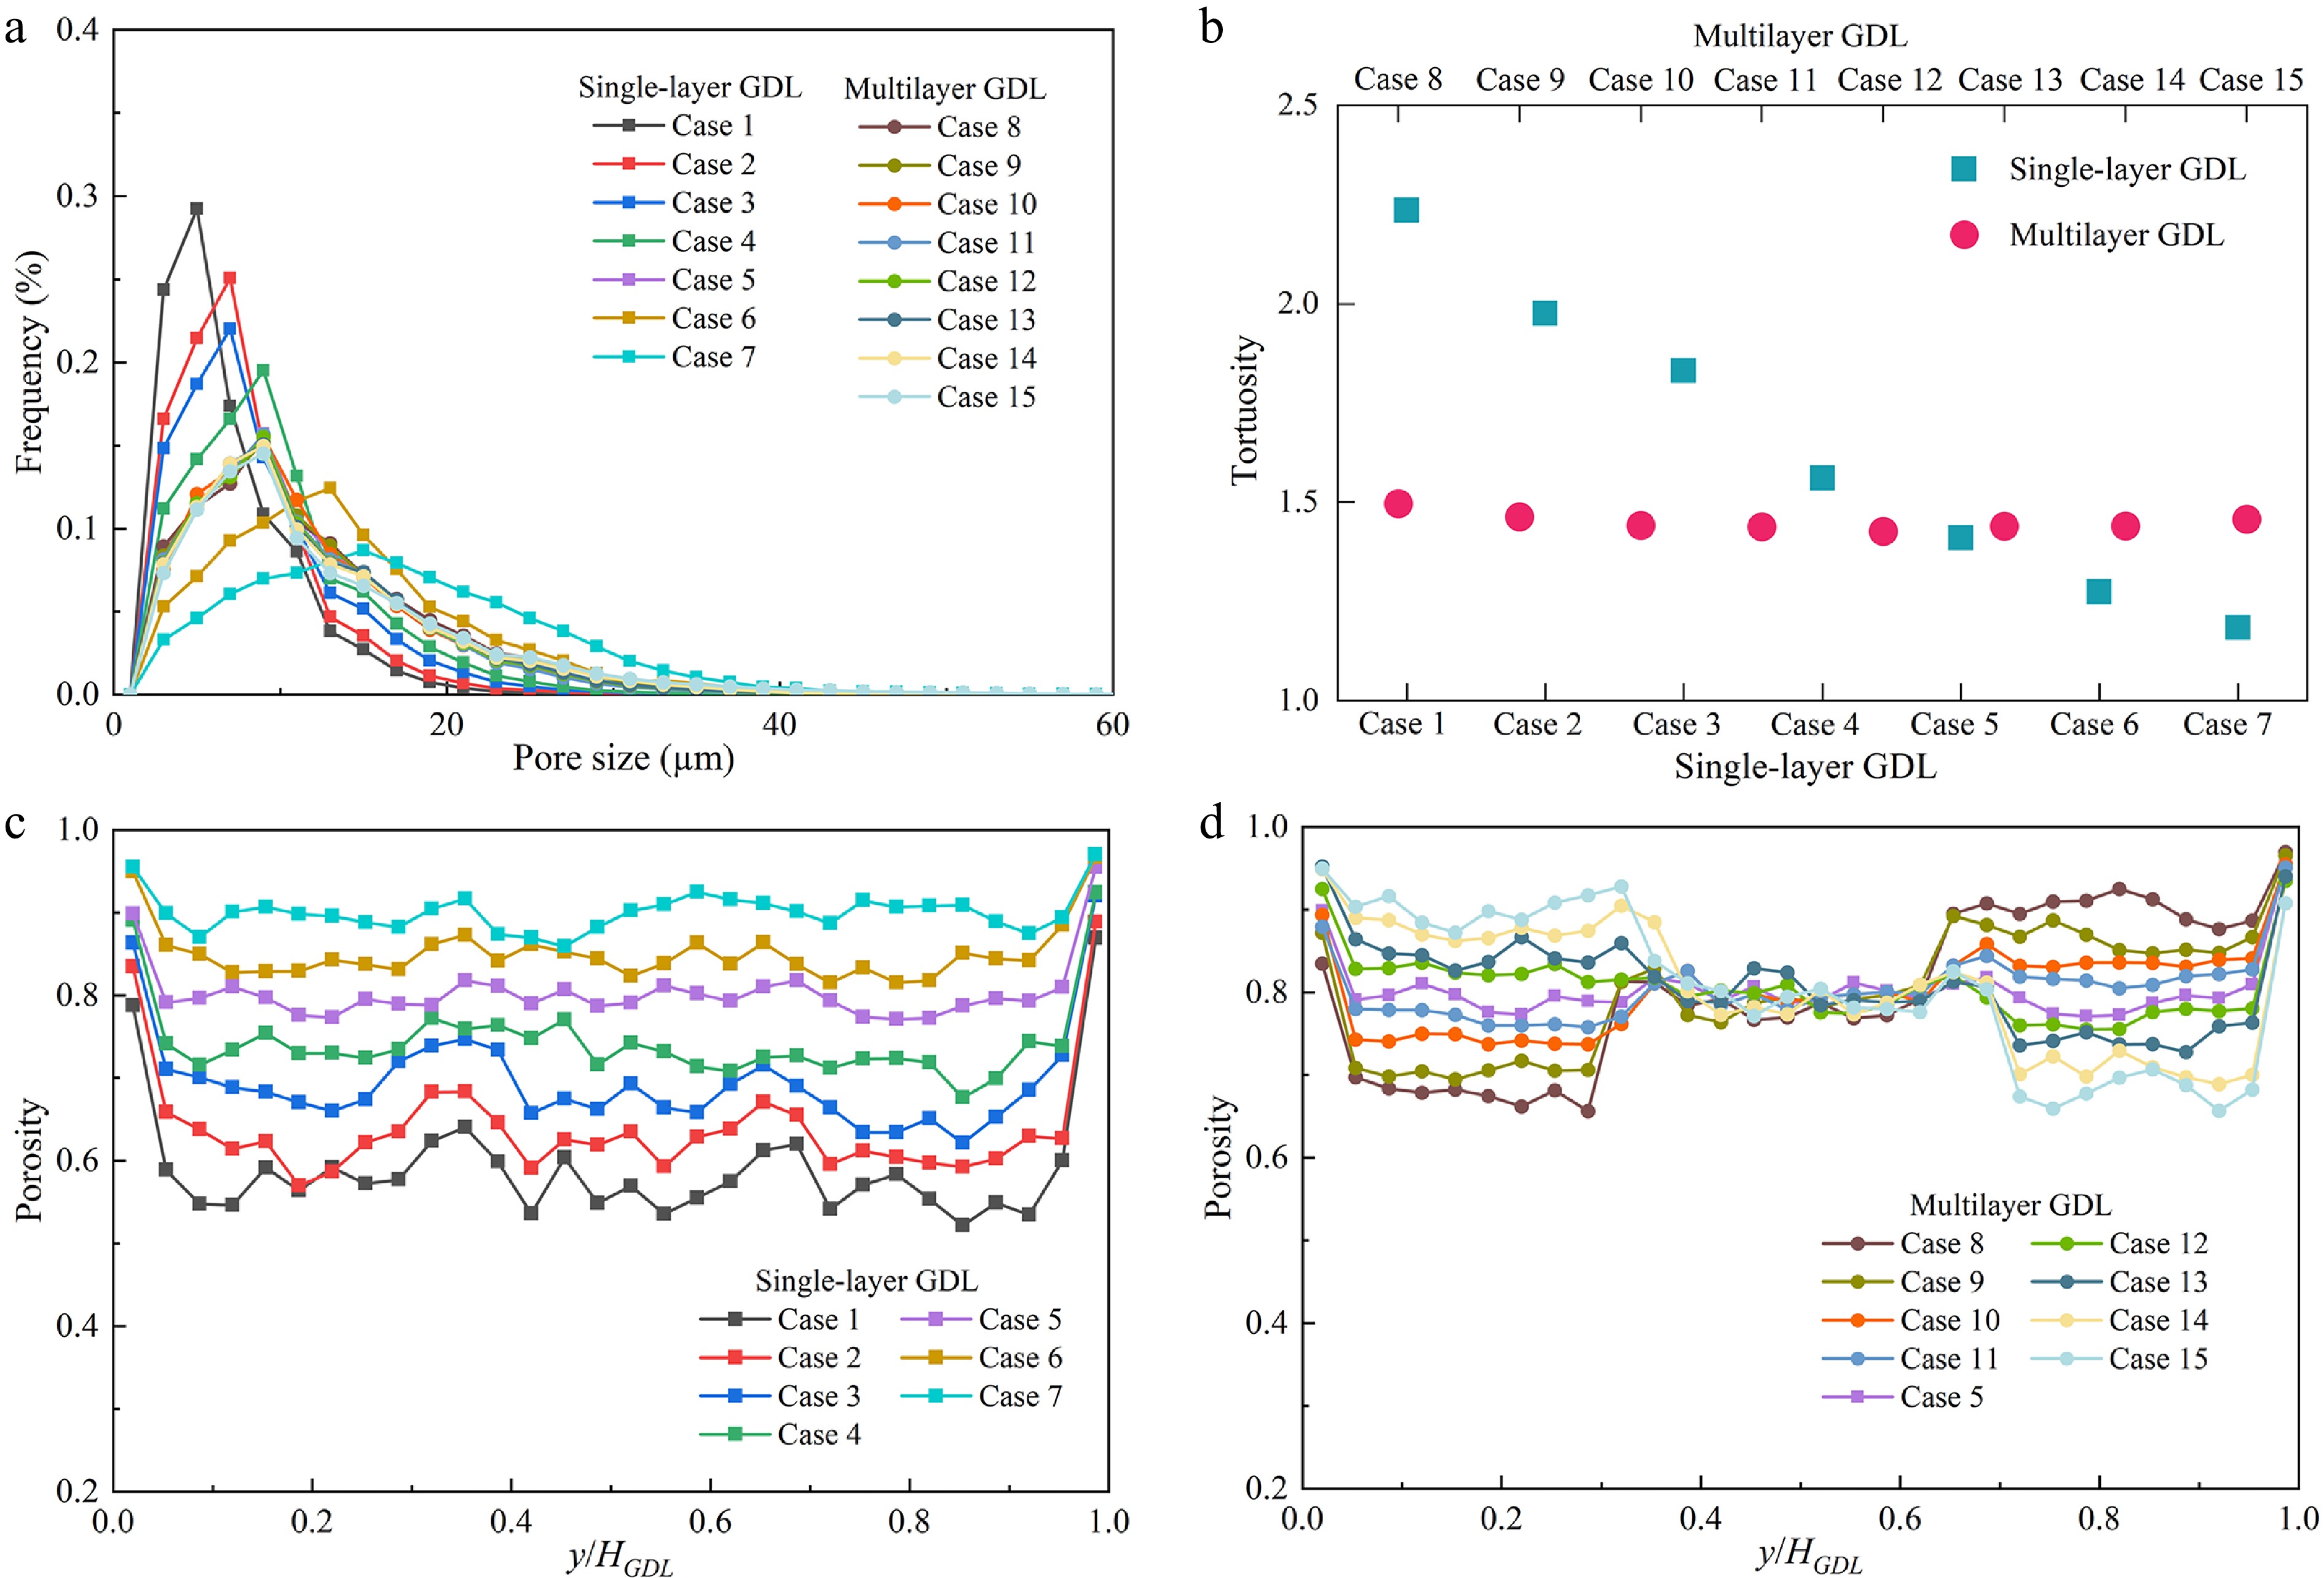
Figure 3.
(a) Pore size distribution, and (b) tortuosity for different cases; TP porosity distributions for (c) single-layer GDLs, and (d) multilayer GDLs with varying porosities.
-
Figure 4 illustrates the water flow characteristics in single-layer GDLs with varying porosity. During dynamic electrochemical reactions, water progressively coalesces into clusters within MPL cracks. Driven by capillary forces, water infiltrates the GDL pores and exhibits three characteristic modes: droplet formation, cluster development, and flow elongation[44]. Subsequently, water preferentially breaks through pores with minimal capillary resistance, thereby establishing stable transport paths[45], which are herein termed the dominant water removal paths within the GDL. For instance, in Region A1 of Fig. 4a, although the relatively low local porosity hinders water transport, the coalescence of initial water clusters enhances the driving force and generates finger-like flow paths toward the GDL-GC interface, which is consistent with flow visualization experiments and thereby supports the reliability of the simulation results[46]. Conversely, in Region A2, extremely low local porosity poses a high capillary barrier, thereby preventing water breakthrough. In particular, when GDL porosity falls below 0.700 (Fig. 4b), excessively high tortuosity promotes the development of severe flooding within the GDL (Regions B1–B3), markedly hindering oxygen transport. As GDL porosity increases, overall capillary resistance decreases substantially, promoting the development of dominant water removal paths and thus strengthening oxygen supply (Regions B4−B6). Meanwhile, the coalescence of breakthrough droplets enhances liquid connectivity within the GDL and forms more continuous water removal paths (Regions C1−C3)[47], whereas the resulting larger droplets in the GC are more difficult to transport by the gas flow. When the porosity reaches 0.9 (Case 7), weakened capillary effects suppress the development of dominant water removal paths (Region B7) and intensify localized water blockage. Therefore, for single-layer GDLs with varying porosity, capillary resistance at excessively low porosity, pore connectivity and tortuosity, and weakened capillary effects at excessively high porosity jointly influence the water removal characteristics.
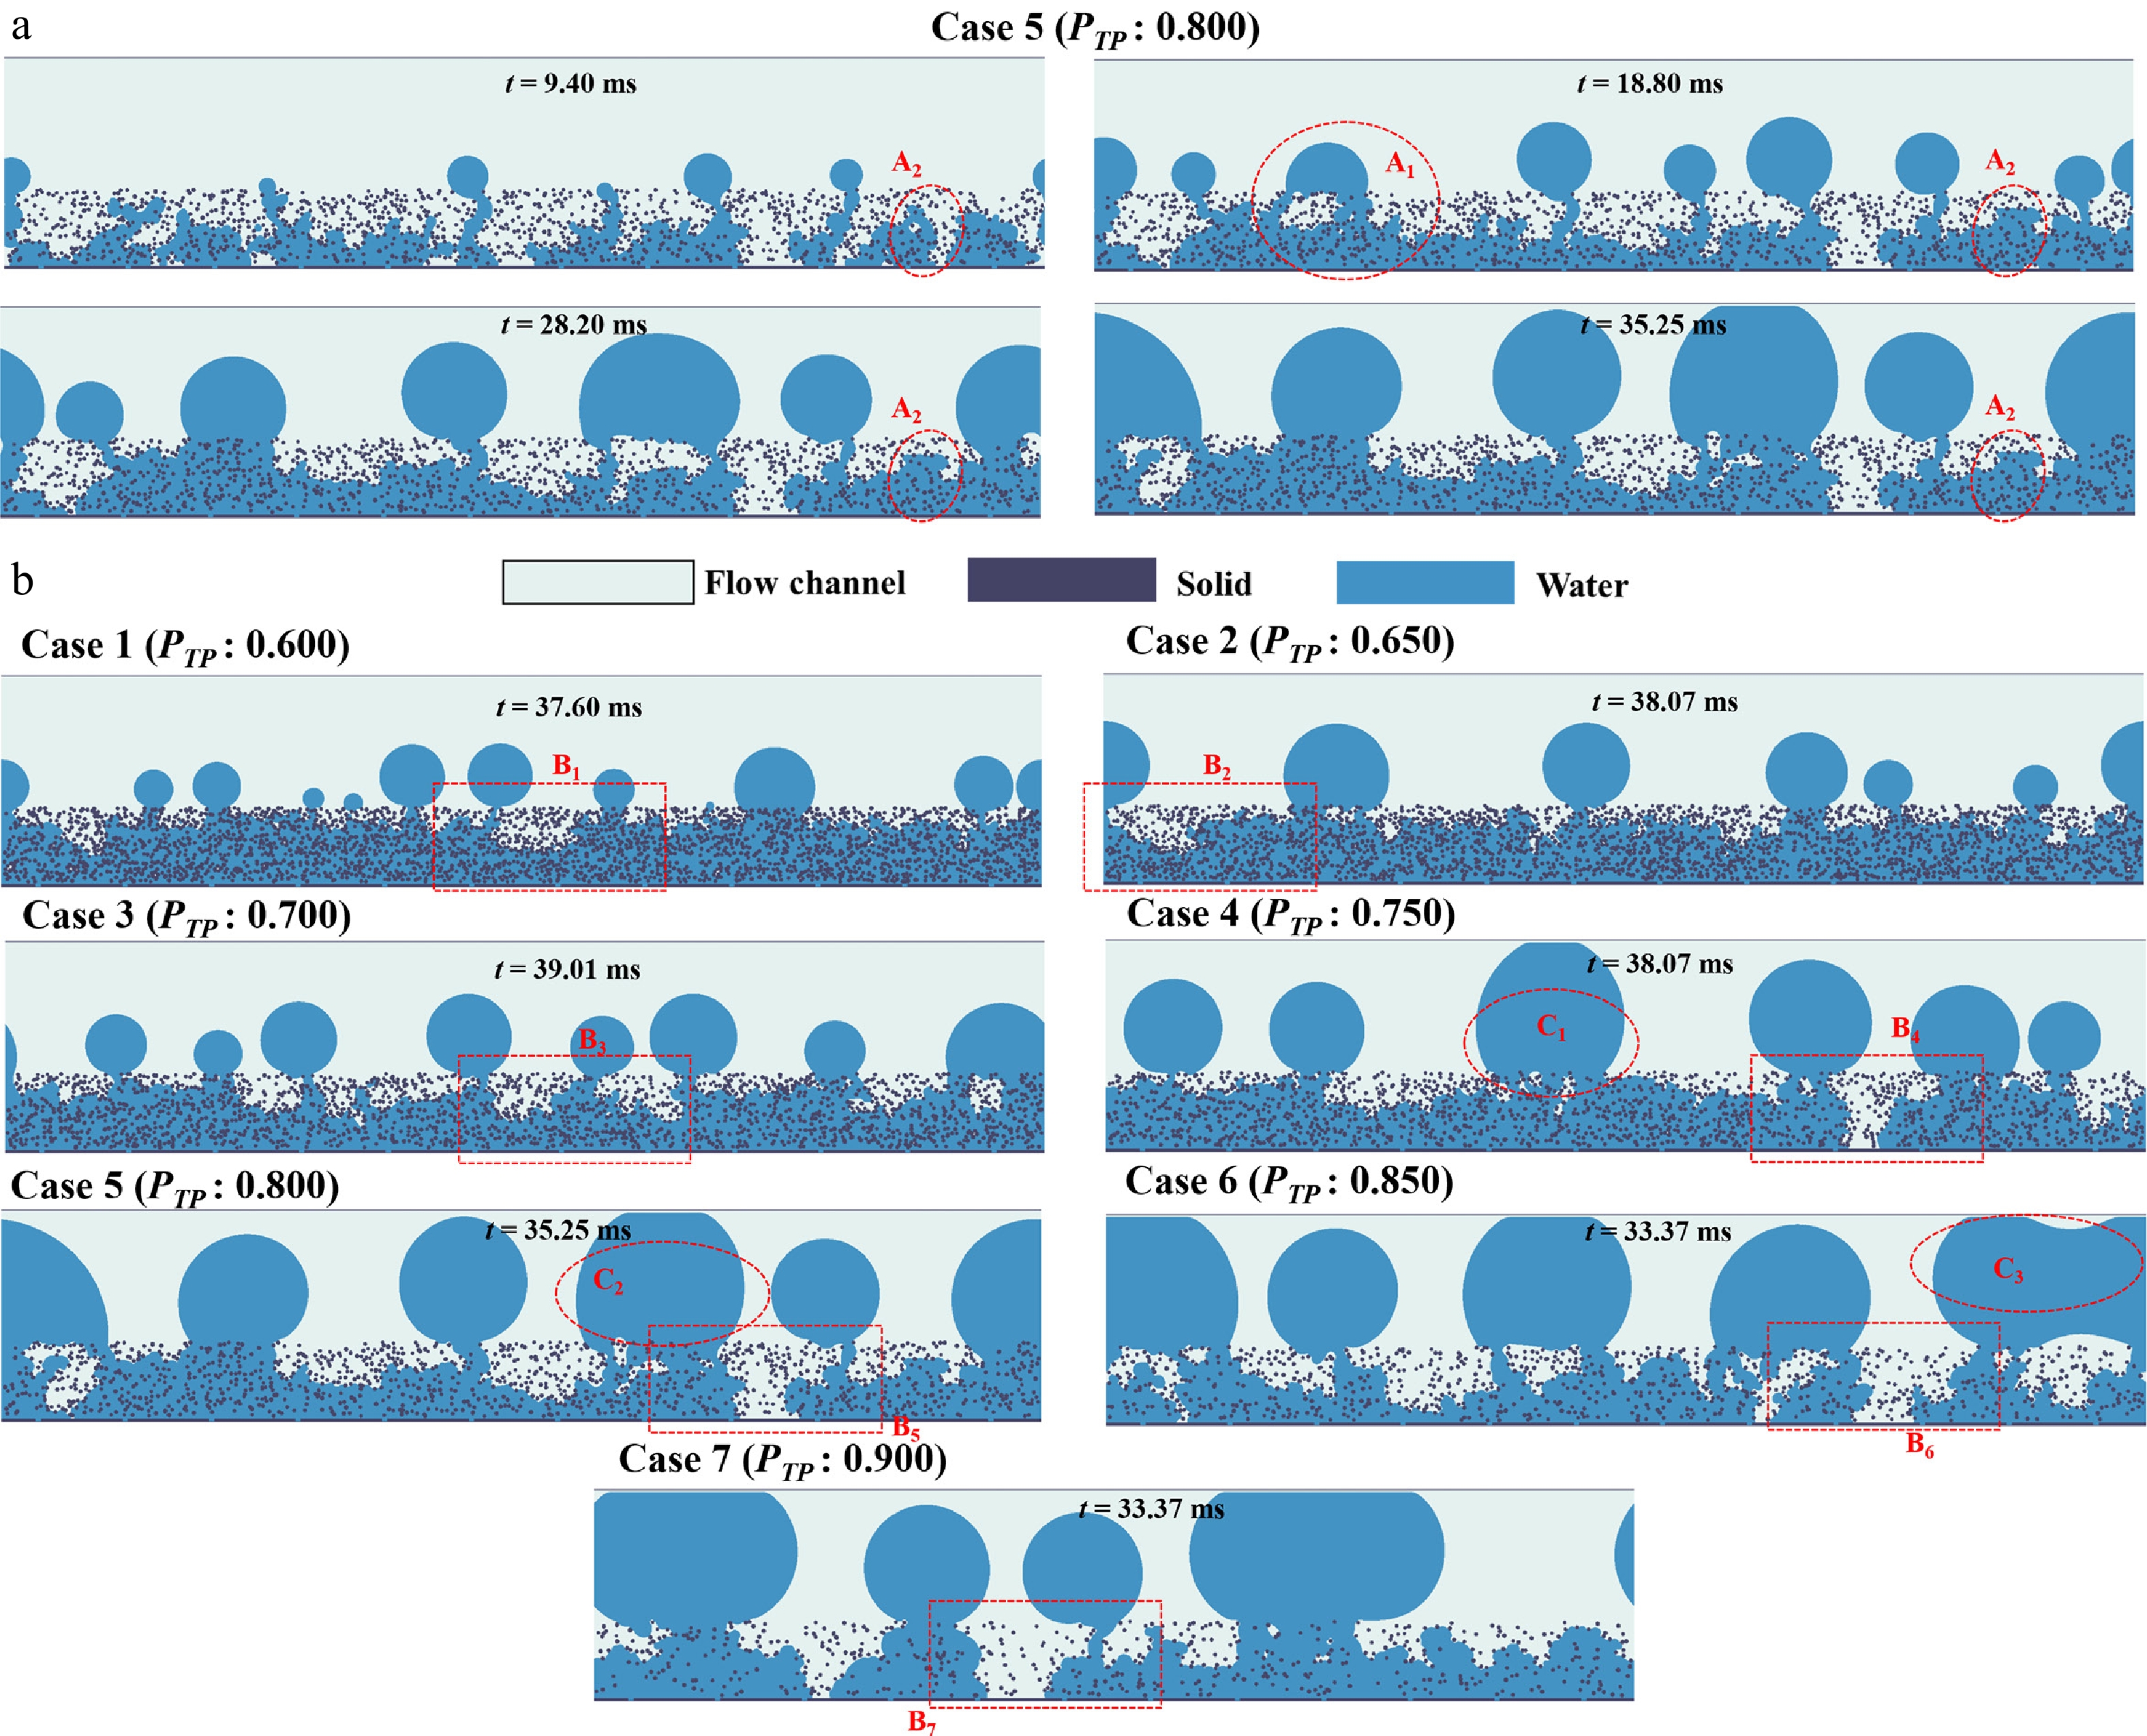
Figure 4.
Evolution of water flow characteristics in (a) a single-layer GDL with porosity 0.800 and (b) Cases 1–7 with varying single-layer GDL porosities.
Figure 5a depicts the temporal evolution of the local water saturation (Slocal,y) along the TP direction in the GDL for Case 5. From the MPL-GDL interface to the GDL-GC interface, Slocal,y decreases gradually with increasing y, consistent with previous reports[18,44]. Specifically, near the GDL-GC interface, structural discontinuities and capillary-pressure jumps induce an increase in Slocal,y. As porosity increases (Fig. 5b), Slocal,y decreases in the MPL-GDL region (Region A1) but increases in the GDL-GC region (Region A2). This occurs because higher GDL porosity weakens flow blockage and enhances permeability, thereby progressively mitigating water accumulation and lowering the average GDL pressure (PreGDL) (Fig. 5c). The GDL water saturation (SGDL) correspondingly decreases with increasing porosity (Fig. 5d), but the trend reverses in Case 7. The water removal efficiency (Ewater) is defined as the ratio of water saturation in the GC to that in the GDL (SGC/SGDL) and is used as a dimensionless drainage indicator that characterizes the relative tendency of water to migrate across the GDL-GC interface into the GC relative to the amount retained in the GDL at the same time, thereby assessing water transport and breakthrough ability. For Cases 1−7, the corresponding Ewater values are 0.25, 0.32, 0.44, 0.55, 0.77, 1.01, and 0.86, respectively (Fig. 5e). In this work, each case was regenerated at least five times using a random algorithm to obtain comparable GDL configurations with identical porosity but distinct microstructures, and the maximum deviation among the replicated Ewater values was 6.8%, confirming the numerical reproducibility of the simulations. The trend in Ewater closely parallels that of the average normalized oxygen concentration in the reaction region (Coxygen/Coxygen,top), wherein increasing the porosity of single-layer GDLs enhances water removal efficiency by up to a factor of four and improves oxygen transport capacity by approximately 34%, whereas excessive porosity leads to a decline in efficiency.
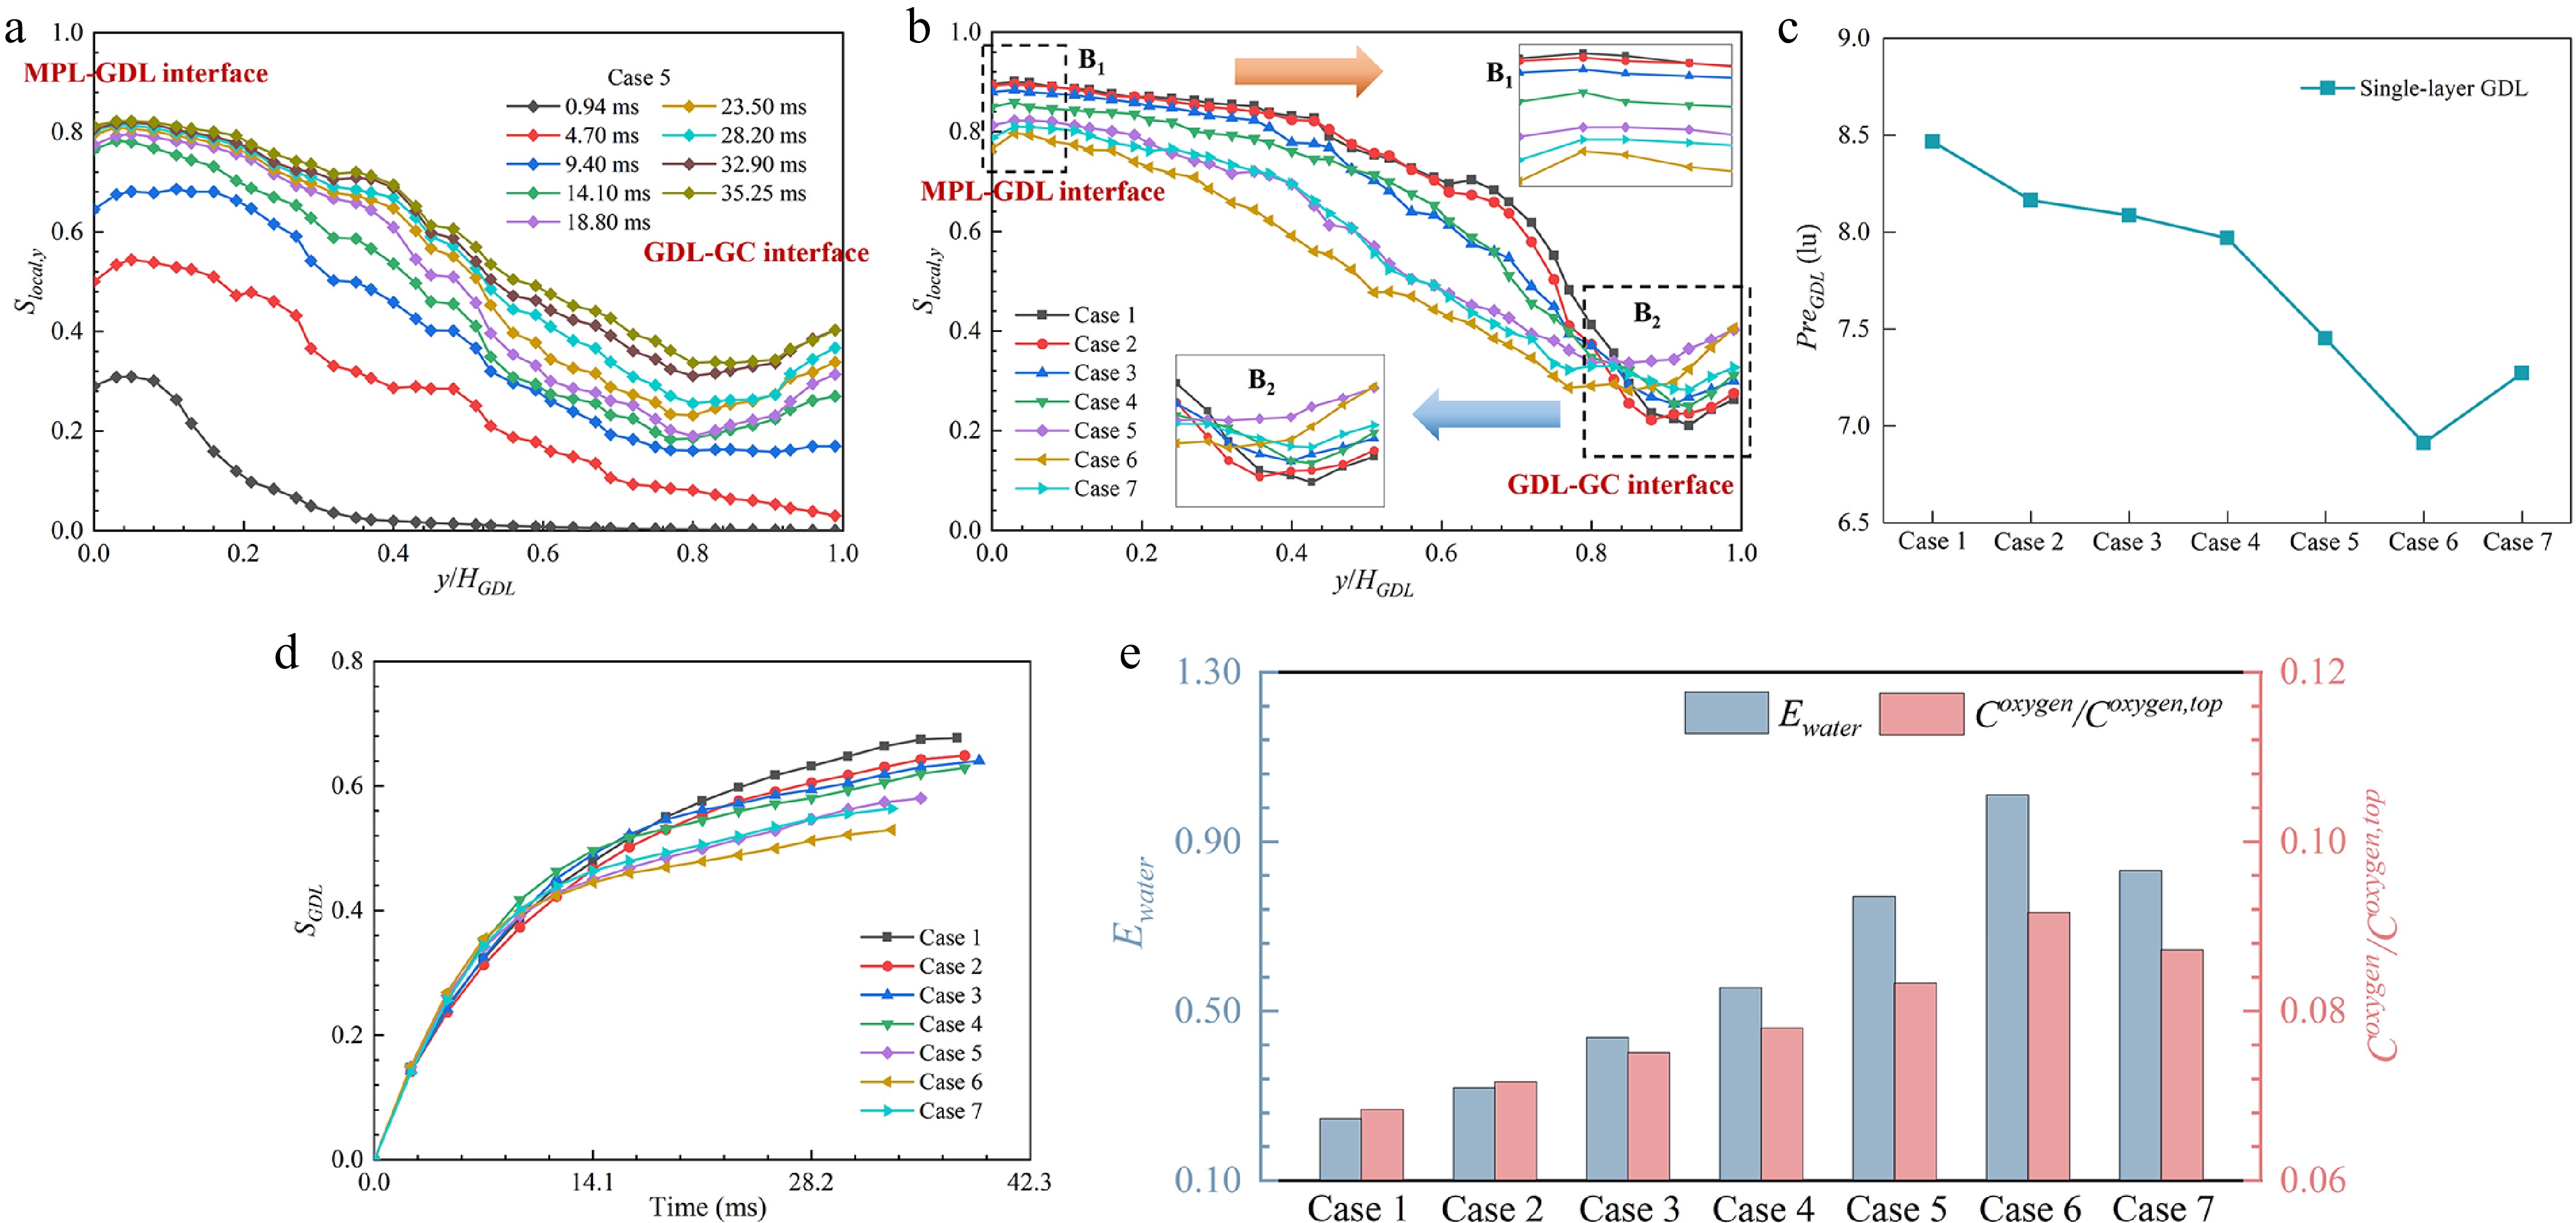
Figure 5.
(a) Temporal evolution of Slocal,y along the TP direction for a GDL porosity of 0.800 (Case 5); (b) steady-state Slocal,y distributions; (c) PreGDL, (d) SGDL; and (e) Ewater and normalized Coxygen for single-layer GDLs with varying porosities.
Water removal in multilayer GDLs
-
To evaluate the performance of multilayer GDLs relative to the single-layer case, the GDL is further modeled as a three-layer porosity gradient structure comprising bottom, middle, and top layers along the TP direction. Accordingly, Case 5 (PTP: 0.800) serves as the baseline. As illustrated in Fig. 6, when the porosity gradient decreases along the TP direction, flow resistance is minimal near the MPL and increases progressively toward the GC. This configuration creates a capillary barrier at the GDL-GC interface, hindering the development of dominant water removal paths (Regions A1−A4). Conversely, as the porosity gradient moderately increases along the TP direction (Cases 12, 13), the higher driving force near the GDL-MPL interface offsets the larger capillary resistance, whereas the lower capillary resistance near the GDL-GC interface promotes water breakthrough, thereby markedly reducing water accumulation (Regions A6−A7). Correspondingly, the enhanced water mobility increases the number of initial water clusters from six (Case 5) to eight (Case 13). However, when the interlayer porosity difference becomes excessive (Cases 14, 15), the resulting mismatch in capillary entry pressure across adjacent layers disrupts dominant water removal paths and promotes water retention (Regions A8−A9). Consequently, water removal is mainly influenced by water invasion near the GDL-MPL interface, breakthrough resistance near the GDL-GC interface, capillary-driven transport assisted by the porosity gradient, and retention induced by excessive interlayer contrast for multilayer GDLs with different porosity gradients.
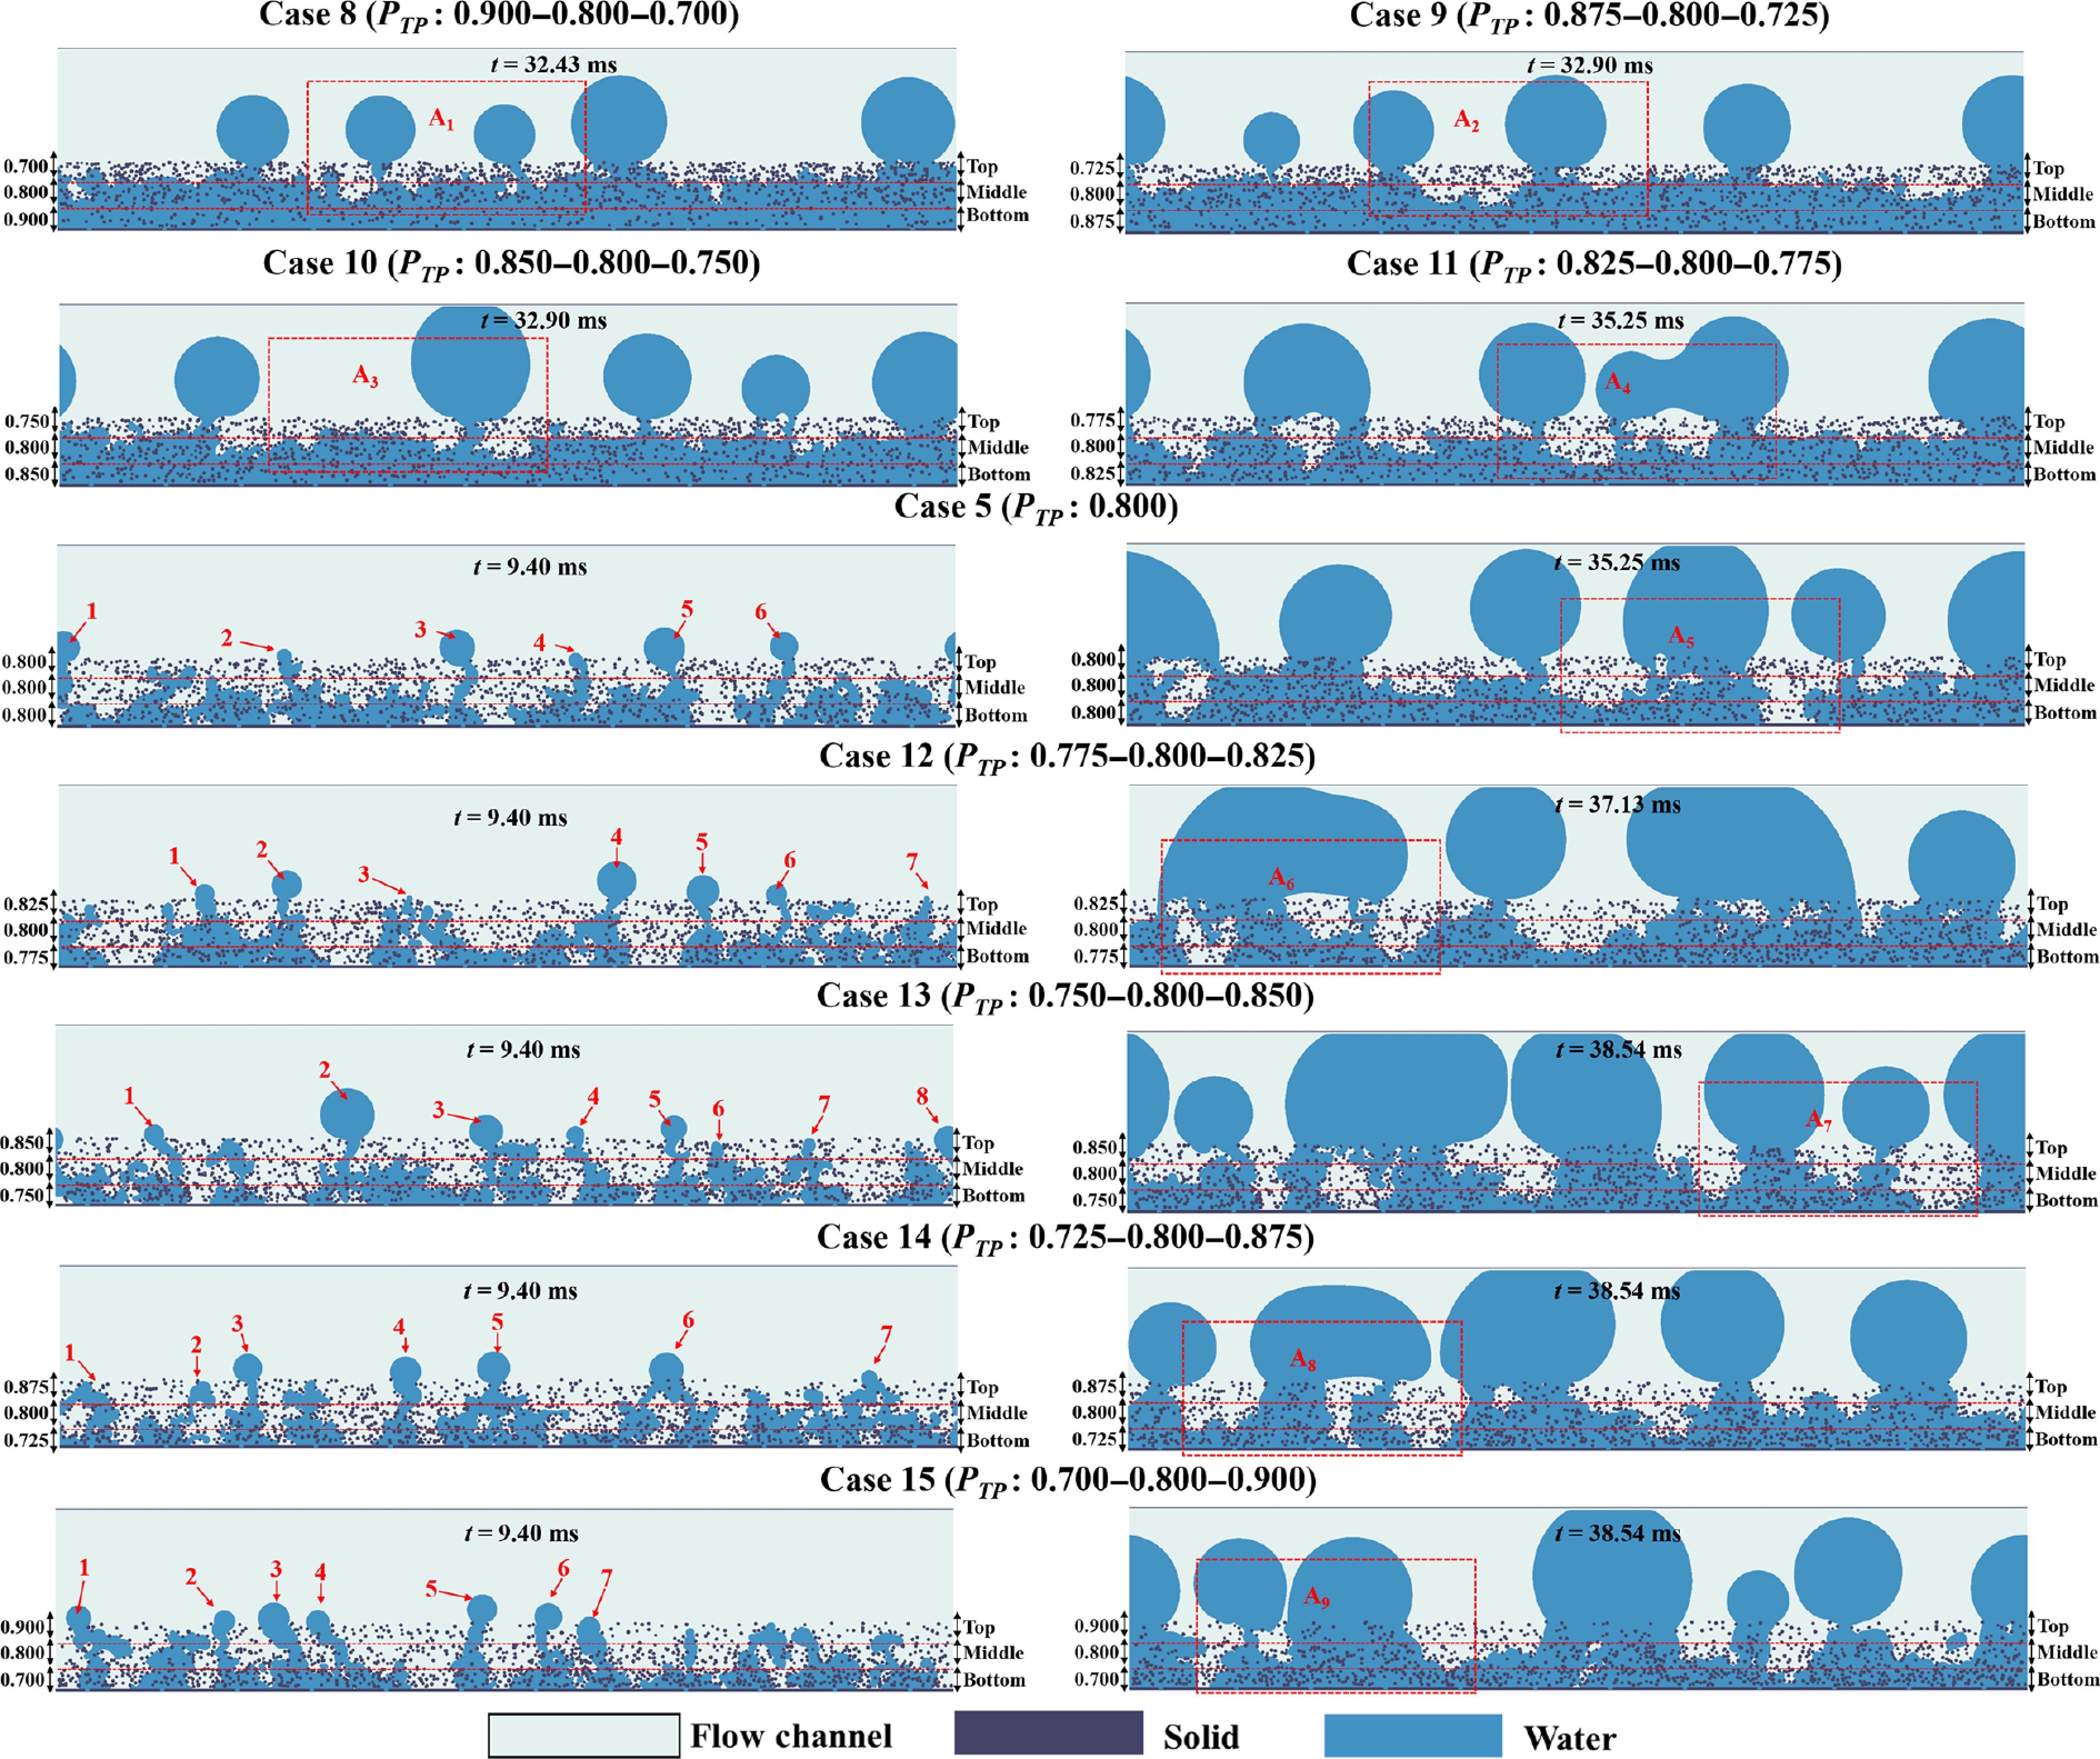
Figure 6.
Illustration of water flow evolution under different multilayer GDL porosities.
Therefore, multilayer GDLs can effectively modulate interlayer water flow and distribution characteristics (Fig. 7a−d). When the porosity gradient decreases along the TP direction (Fig. 7a), the Slocal,y gradient steepens, and most water is concentrated in the GDL bottom layer. As the porosity gradient increases along the TP direction (Fig. 7b), the Slocal,y gradient from bottom to top becomes less steep, indicating the formation of a stable driving force pathway for water flow. However, an excessive interlayer porosity difference (Fig. 7c) generates high interlayer capillary resistance, thereby increasing bottom-layer water content and steepening the Slocal,y profile again. Therefore, appropriately increasing the porosity gradient along the TP direction helps establish a capillary-pressure gradient (Fig. 7e), thereby reducing water accumulation in the GDL, yielding SGDL values of 0.57 and 0.53 (Cases 12, 13). In particular, performance is optimal in Case 13, with Ewater increasing by 40% and normalized Coxygen by 11% relative to the single-layer case (Fig. 7g). However, excessive interlayer porosity differences reduce both Ewater and normalized Coxygen (Cases 14, 15), and the effect is especially pronounced in Case 15, where performance falls below that of the single-layer case.
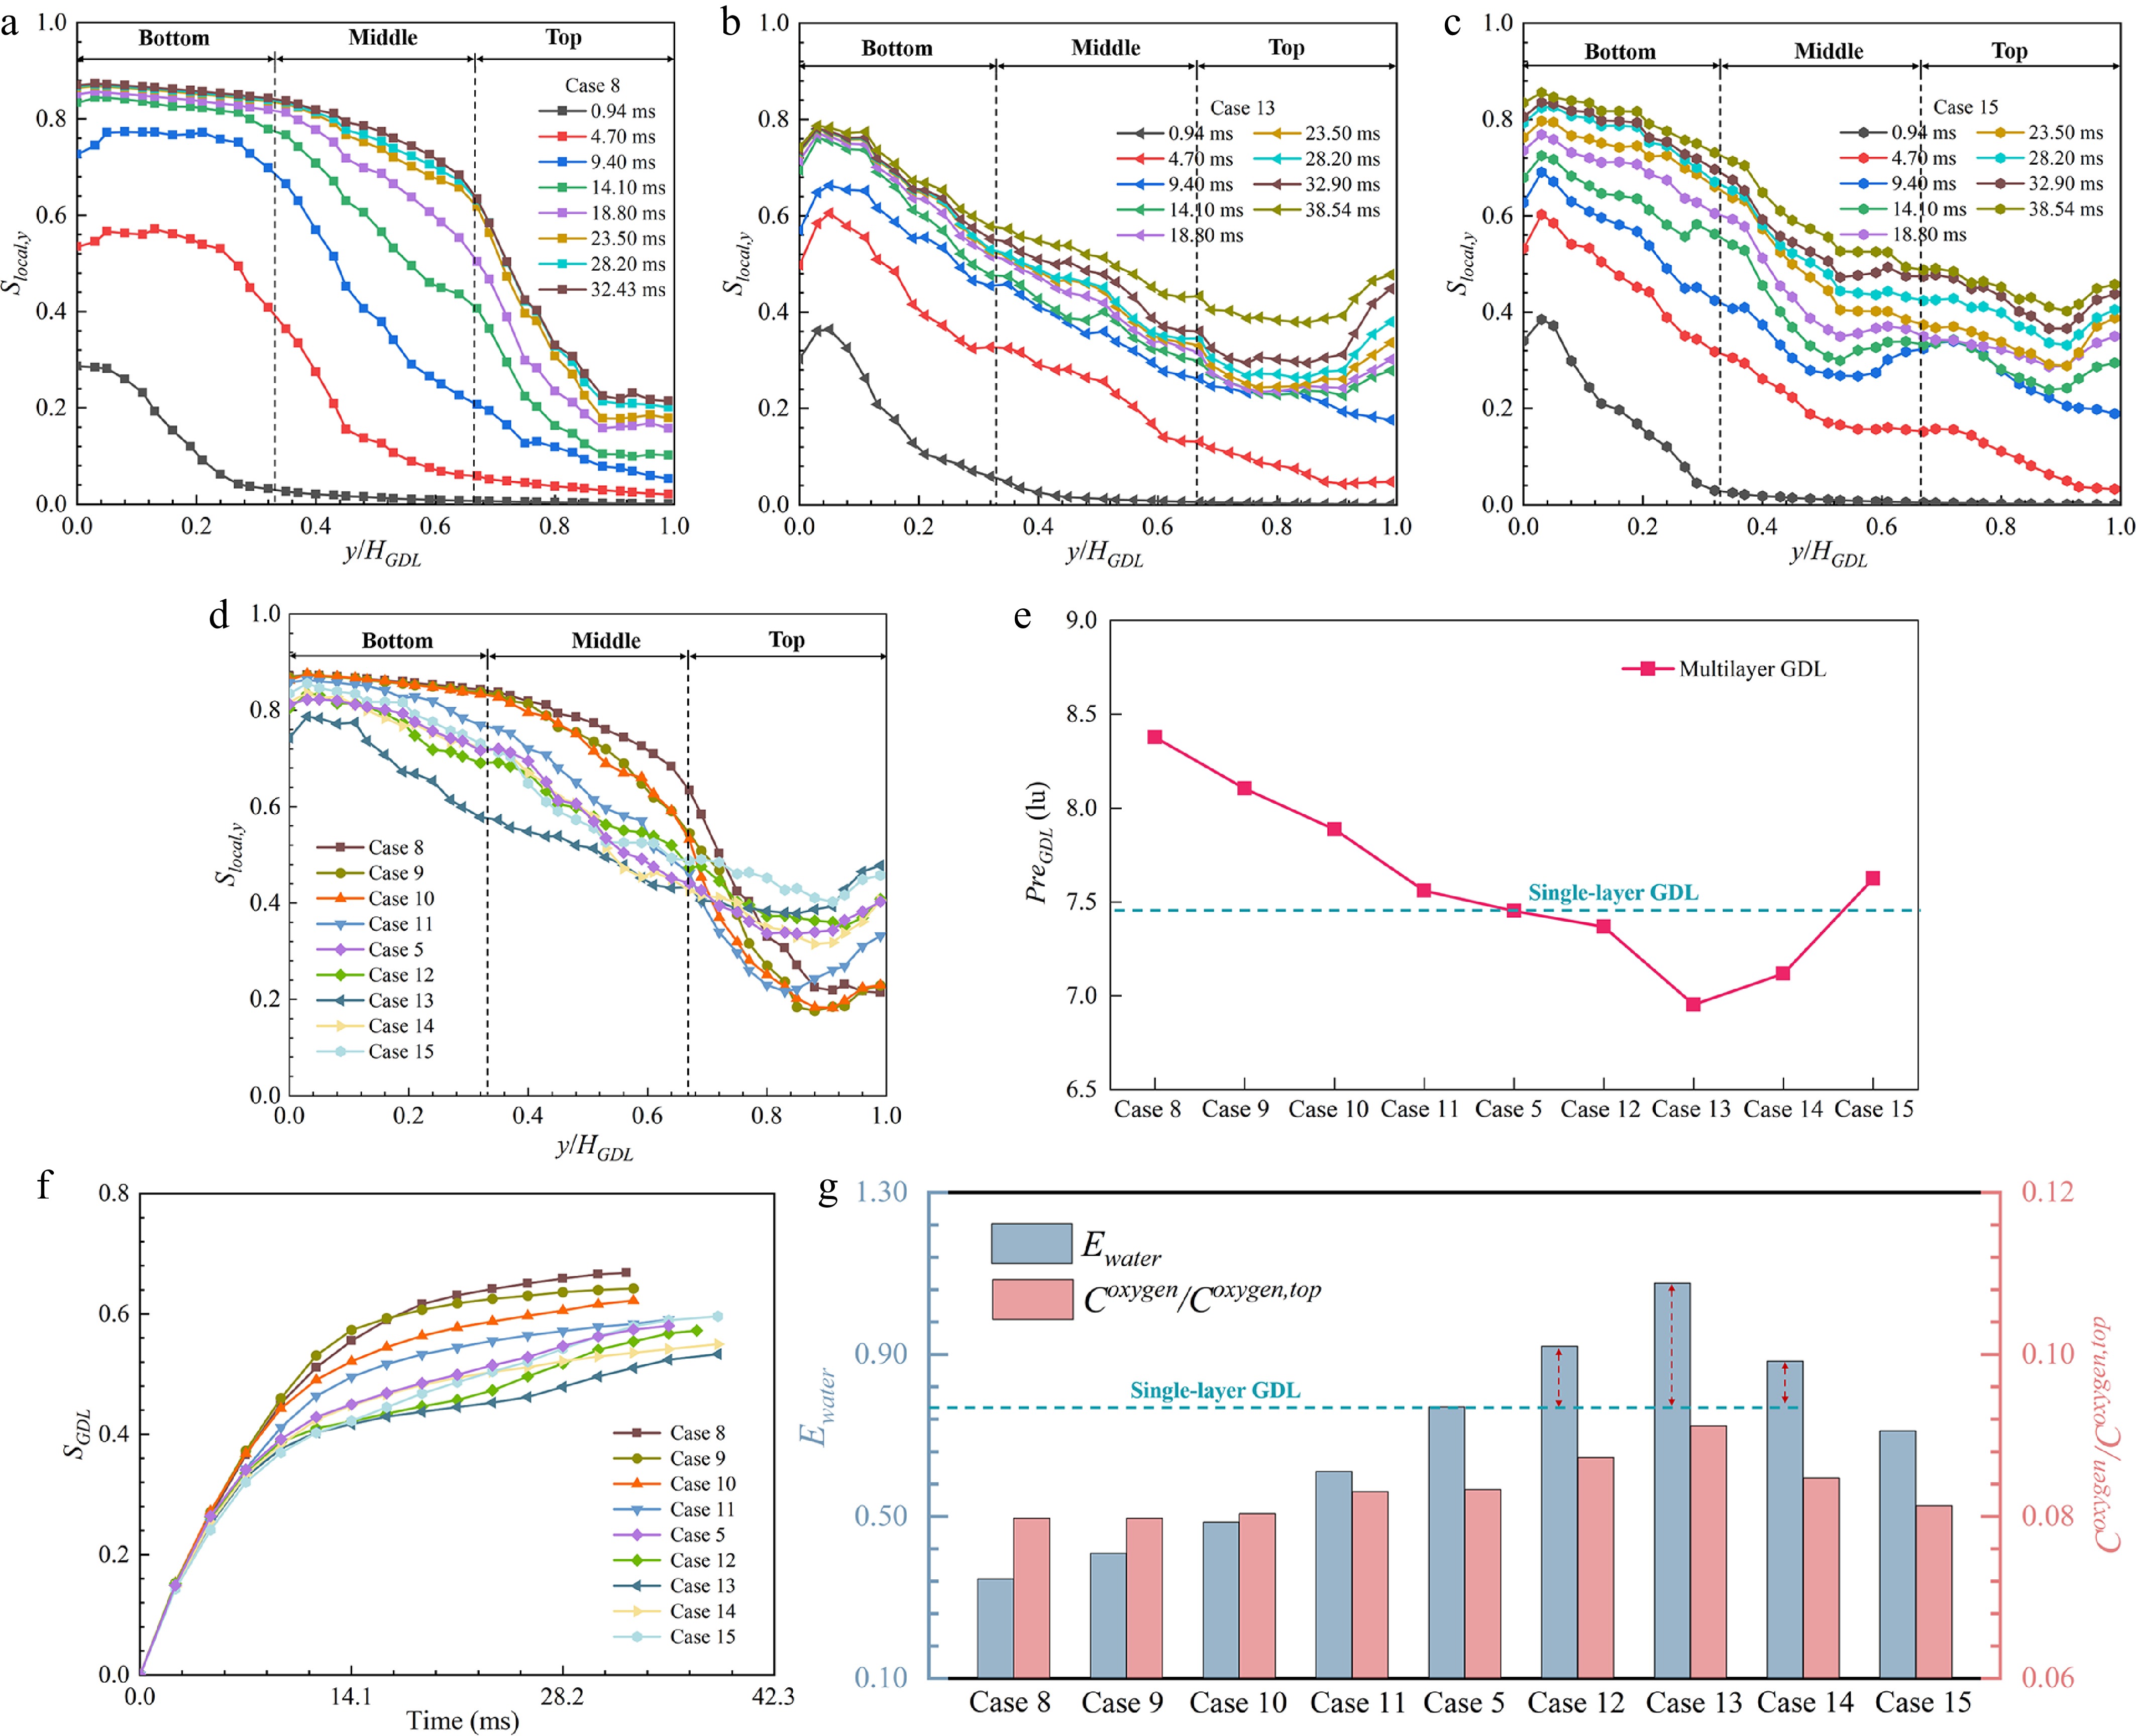
Figure 7.
Temporal evolution of Slocal,y along the TP direction for multilayer GDLs in (a) Case 8, (b) Case 13, and (c) Case 15; (d) steady-state Slocal,y, (e) SGDL, (f) PreGDL, and (g) Ewater and normalized Coxygen for multilayer GDLs with varying porosities.
Heat accumulation with GDL multilayering
Heat accumulation in single-layer GDLs
-
Dynamic electrochemical reactions in PEMFCs generate substantial water and heat[6−8,48]. Because water has a high specific heat capacity and carbon fiber exhibits high thermal conductivity[10,11], spatial heterogeneity in water content and GDL porosity significantly influences heat transfer in PEMFCs. As illustrated in Fig. 8a, a temperature gradient develops within the GDL, with the highest temperature located near the bottom of the GDL, forming a pronounced heat accumulation region that decreases along the TP direction. This trend is also consistent with the findings reported by Wei et al.[48]. As the reaction proceeds, heat accumulation within the GDL progressively intensifies, with the local heat source primarily concentrated in regions where water transport is restricted (Regions A1), whereas regions with higher water content exhibit noticeably weaker heat accumulation (Regions A2), consistent with Fig. 4. Meanwhile, higher porosity in single-layer GDLs reduces local water content and fiber fraction. The concurrent reduction in heat capacity and thermal conduction ability weakens thermal buffering and heat dissipation, thereby promoting a higher temperature rise (Fig. 8b). Notably, in Cases 5, 6 (Regions B1−B2), local heat sources are widespread in the bottom of the GDL. Although water content rises at excessively high GDL porosity (Case 7), the carbon fiber fraction decreases further, thereby sustaining pronounced heat accumulation (Region B3). Figure 8c shows the steady-state average temperatures of the GDL (TGDL) and its bottom layer (TBottom), with the maximum across-case difference in TGDL reaching 12 K. In this work, each case was regenerated at least five times using a random algorithm to obtain comparable GDL configurations with identical porosity but distinct microstructures, and the resulting TGDL values varied by no more than 0.36 K, confirming the numerical reproducibility of the simulations.
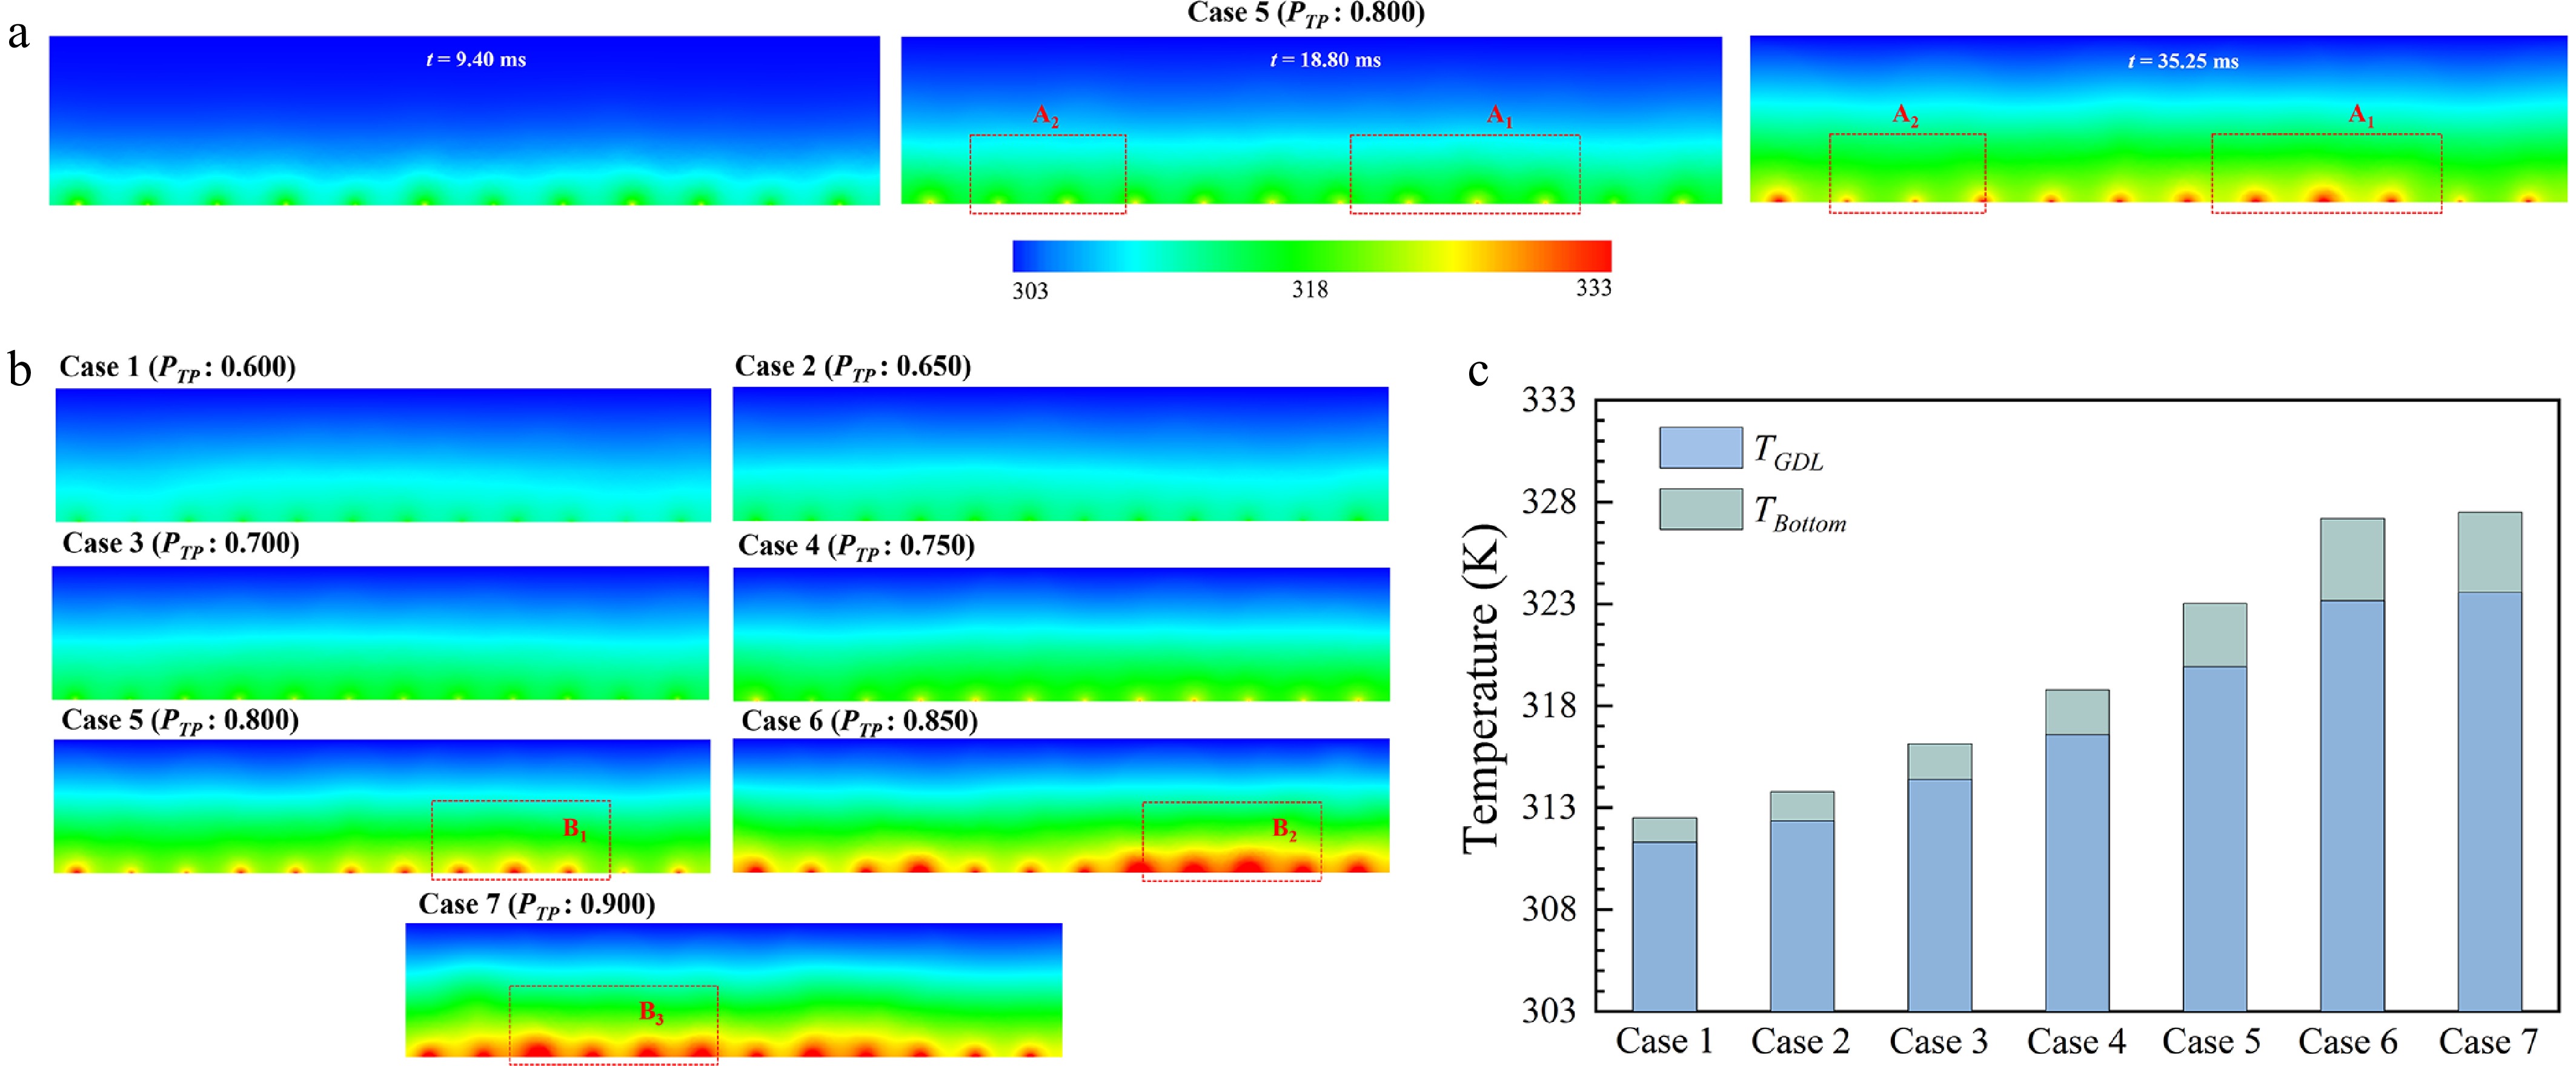
Figure 8.
(a) Evolution of temperature distributions in Case 5 with porosity 0.800; steady-state (b) temperature distributions, and (c) TBottom and TGDL for single-layer GDLs with varying porosities.
Heat accumulation in multilayer GDLs
-
In the temperature fields of multilayer GDLs, as the porosity gradient decreases along the TP direction (Fig. 9a; Cases 8−11), flooding is pronounced, whereas heat accumulation remains relatively low (Regions A1−A4). By contrast, when the porosity gradient increases along the TP direction and the interlayer porosity difference is small (Fig. 9b; Cases 12, 13), heat accumulation increases markedly over time, and the localized heat source region expands (Regions B1−B2), reaching a maximum at an interlayer porosity difference of 0.050 (Case 13). At this point, TBottom is 3.4 K higher than the single-layer value (Fig. 9c). However, when the interlayer porosity difference becomes excessive (Fig. 9b; Cases 14, 15), the temporal increase in heat accumulation weakens, and the extent of localized heat sources gradually shrinks (Regions B3−B4). This behavior arises because the GDL bottom layer is the primary site of reaction heat accumulation. The increased bottom layer capillary resistance promotes local water retention (Fig. 9d), while the fiber fraction remains relatively high (Fig. 9e). Together, these factors enhance thermal buffering and heat transfer, thereby significantly reducing the temperature rise (Fig. 9c). Therefore, these results indicate that multilayer GDLs can mitigate heat accumulation relative to single-layer GDLs. Notably, although neglecting evaporation and latent heat may overestimate the magnitude of the temperature rise, it does not affect the interpretation of the relative trends in heat accumulation under different GDL structures. Specifically, the simulation results show that regions with higher water content tend to exhibit lower temperatures, and considering latent heat would further strengthen this trend, which remains consistent with the heat accumulation pattern revealed in this work.
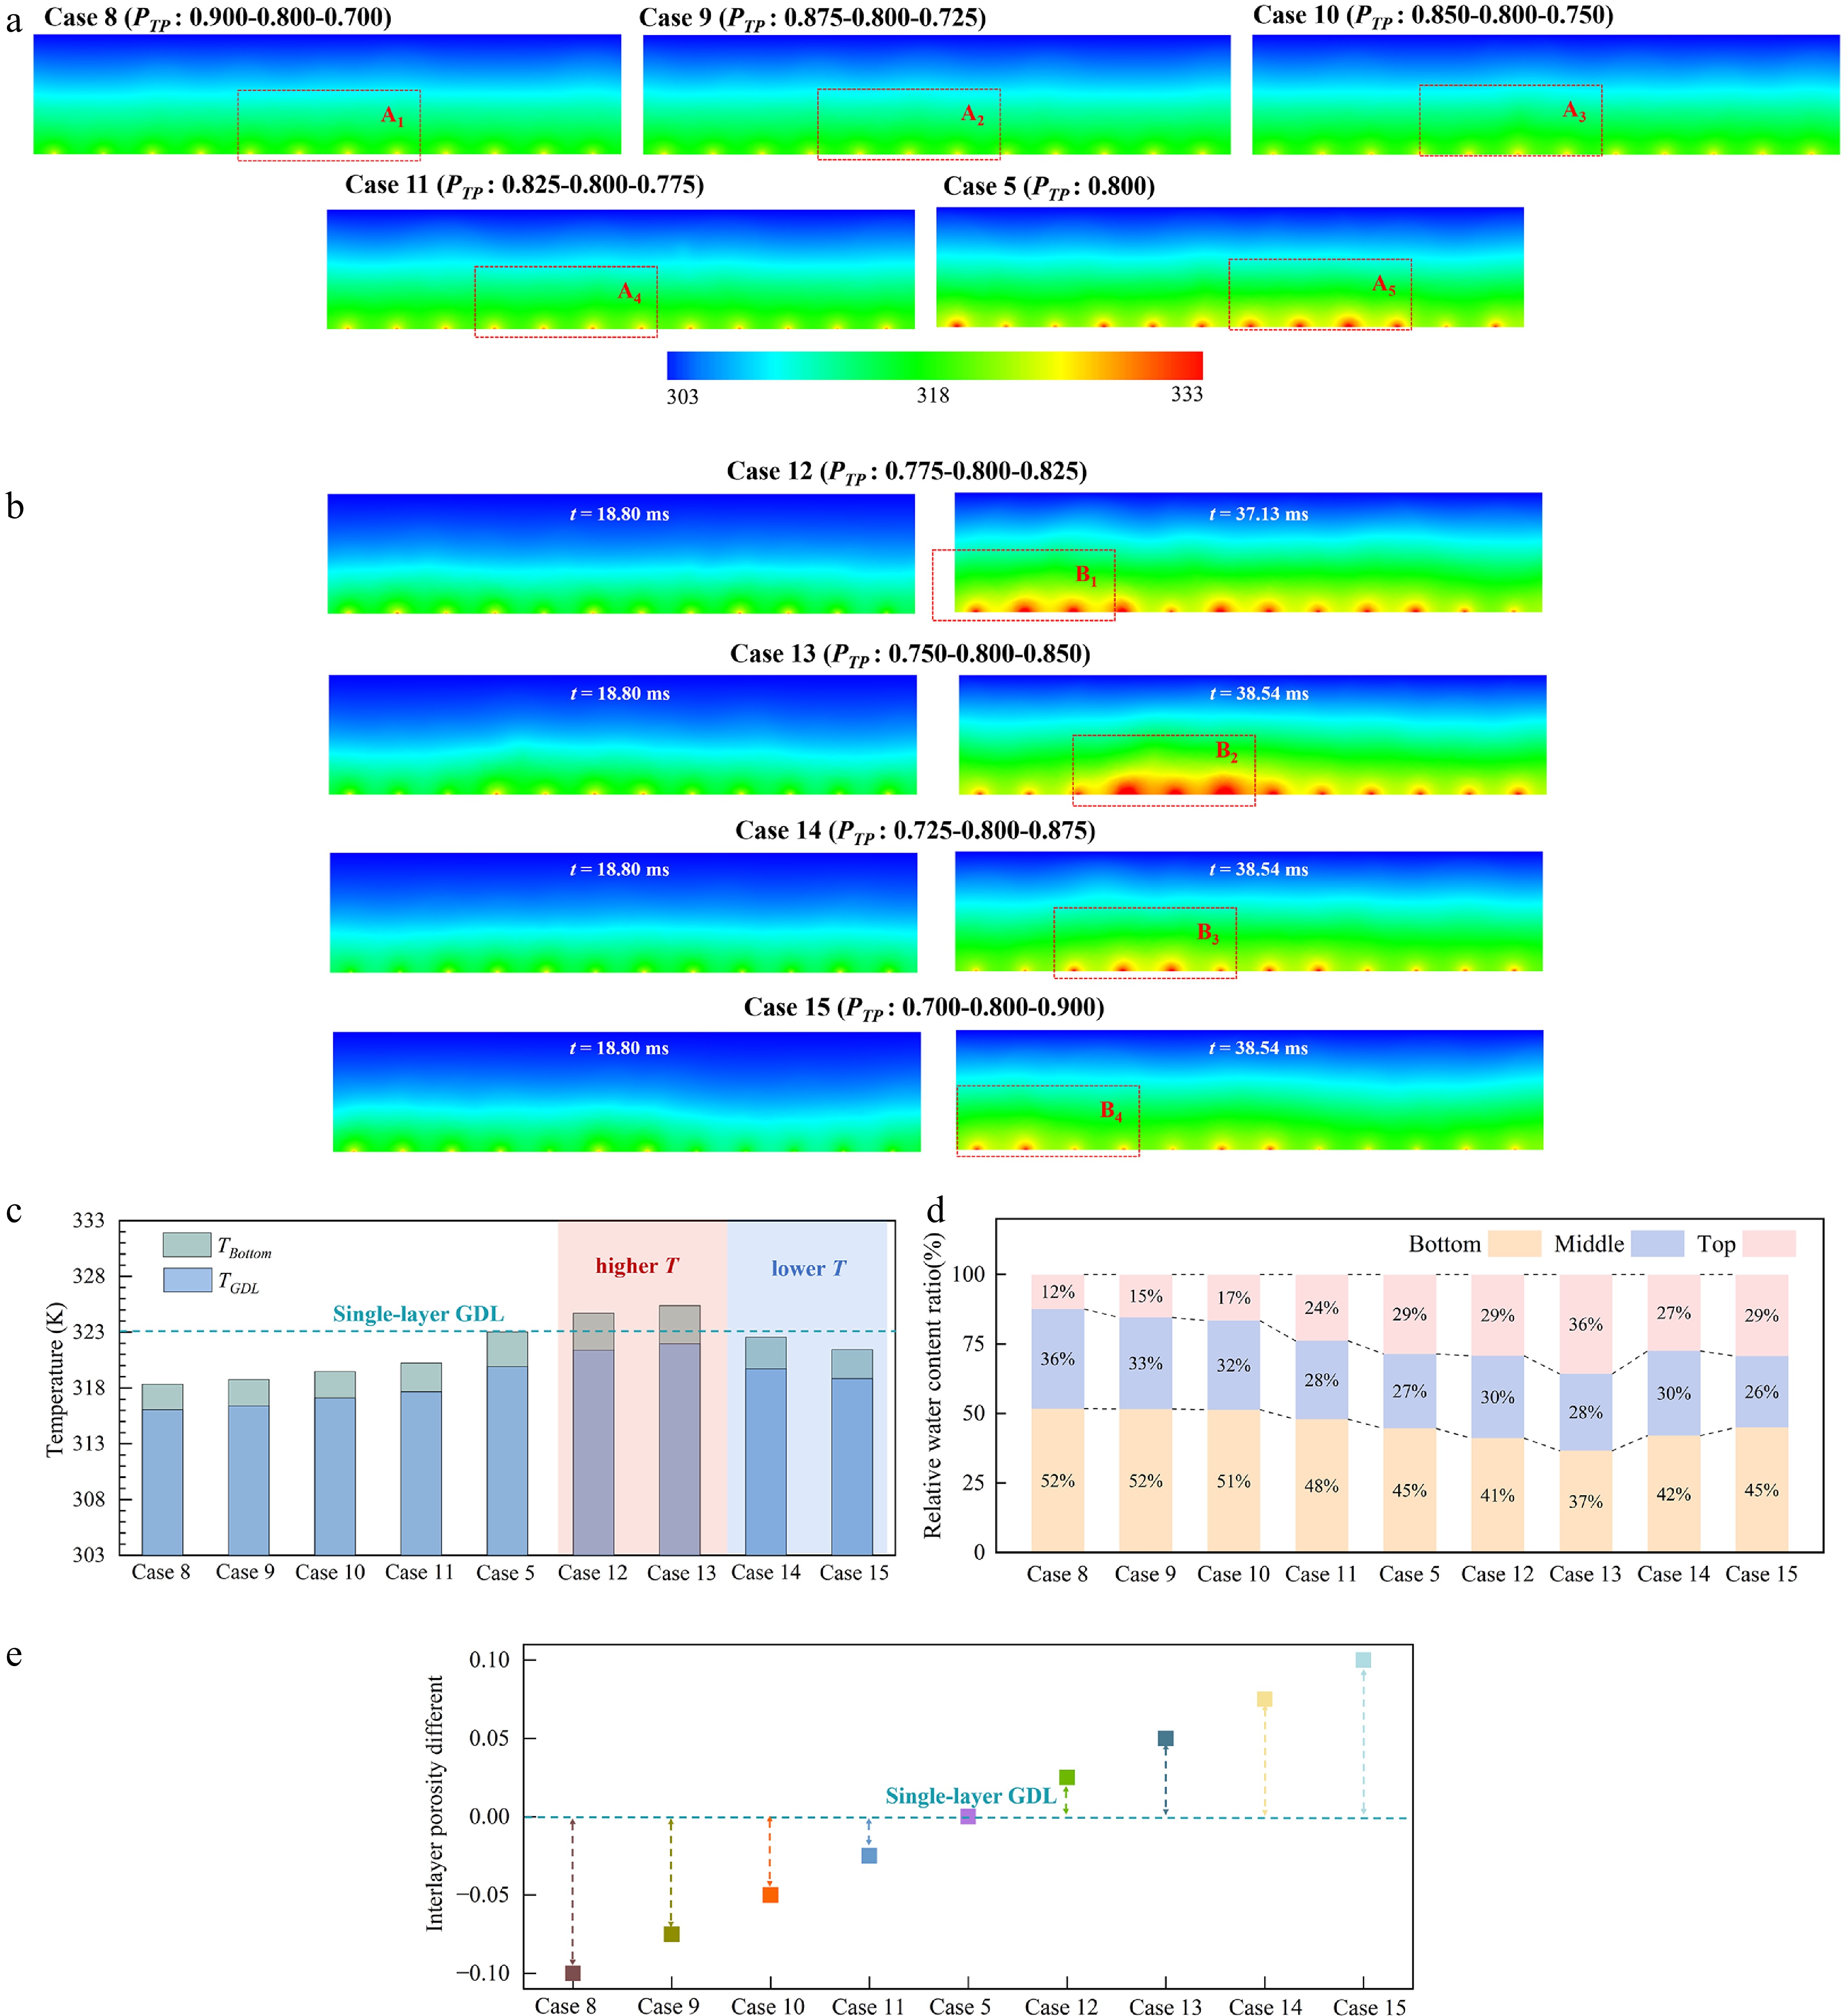
Figure 9.
Temperature distributions for multilayer GDLs with (a) porosity gradients decreasing and (b) increasing along the TP direction. (c) Steady-state values of TBottom and TGDL, (d) relative water content ratios in the bottom, middle, and top layers and (e) interlayer porosity different among multilayer GDLs with varying porosities.
Correlation between water removal and heat accumulation
-
Although several studies have investigated the effects of GDL structural variations on water flow or heat transport[8−14], the coupled mechanisms linking water removal and heat accumulation within the GDL remain insufficiently understood. This study finds that higher porosity increases both Ewater and TGDL in single-layer GDLs (Fig. 10). When porosity becomes excessive (Case 7), Ewater decreases, whereas TGDL remains elevated. This occurs because weakened capillary effects reduce water removal capacity within the GDL, whereas an insufficient fiber fraction markedly diminishes heat dissipation capacity. In multilayer GDLs, Case 5 serves as the reference to partition the domain into Regions A−C. Derived empirical relations for Ewater and TGDL in Region A can readily be used to infer those in the remaining regions. When the porosity gradient decreases along the TP direction (Cases 8−11), Ewater and TGDL are lower and cluster in Region A. When the porosity gradient increases along the TP direction (Cases 12, 13), both Ewater and TGDL are higher and fall primarily in Region B until interlayer porosity differences become excessive (Cases 14, 15). Different from the single-layer case, TGDL is markedly reduced beyond the turning point (Region C). This occurs because both bottom-layer water content and fiber content increase, thereby enhancing heat dissipation performance. Therefore, the multilayer design achieves a lower degree of heat accumulation and provides relatively improved water removal performance within the GDL compared with the single-layer case. Notably, this work does not aim to directly predict the absolute optimal parameters for practical PEMFCs, but rather to support the comparative interpretation of the trends and the mechanistic conclusions identified in this work.
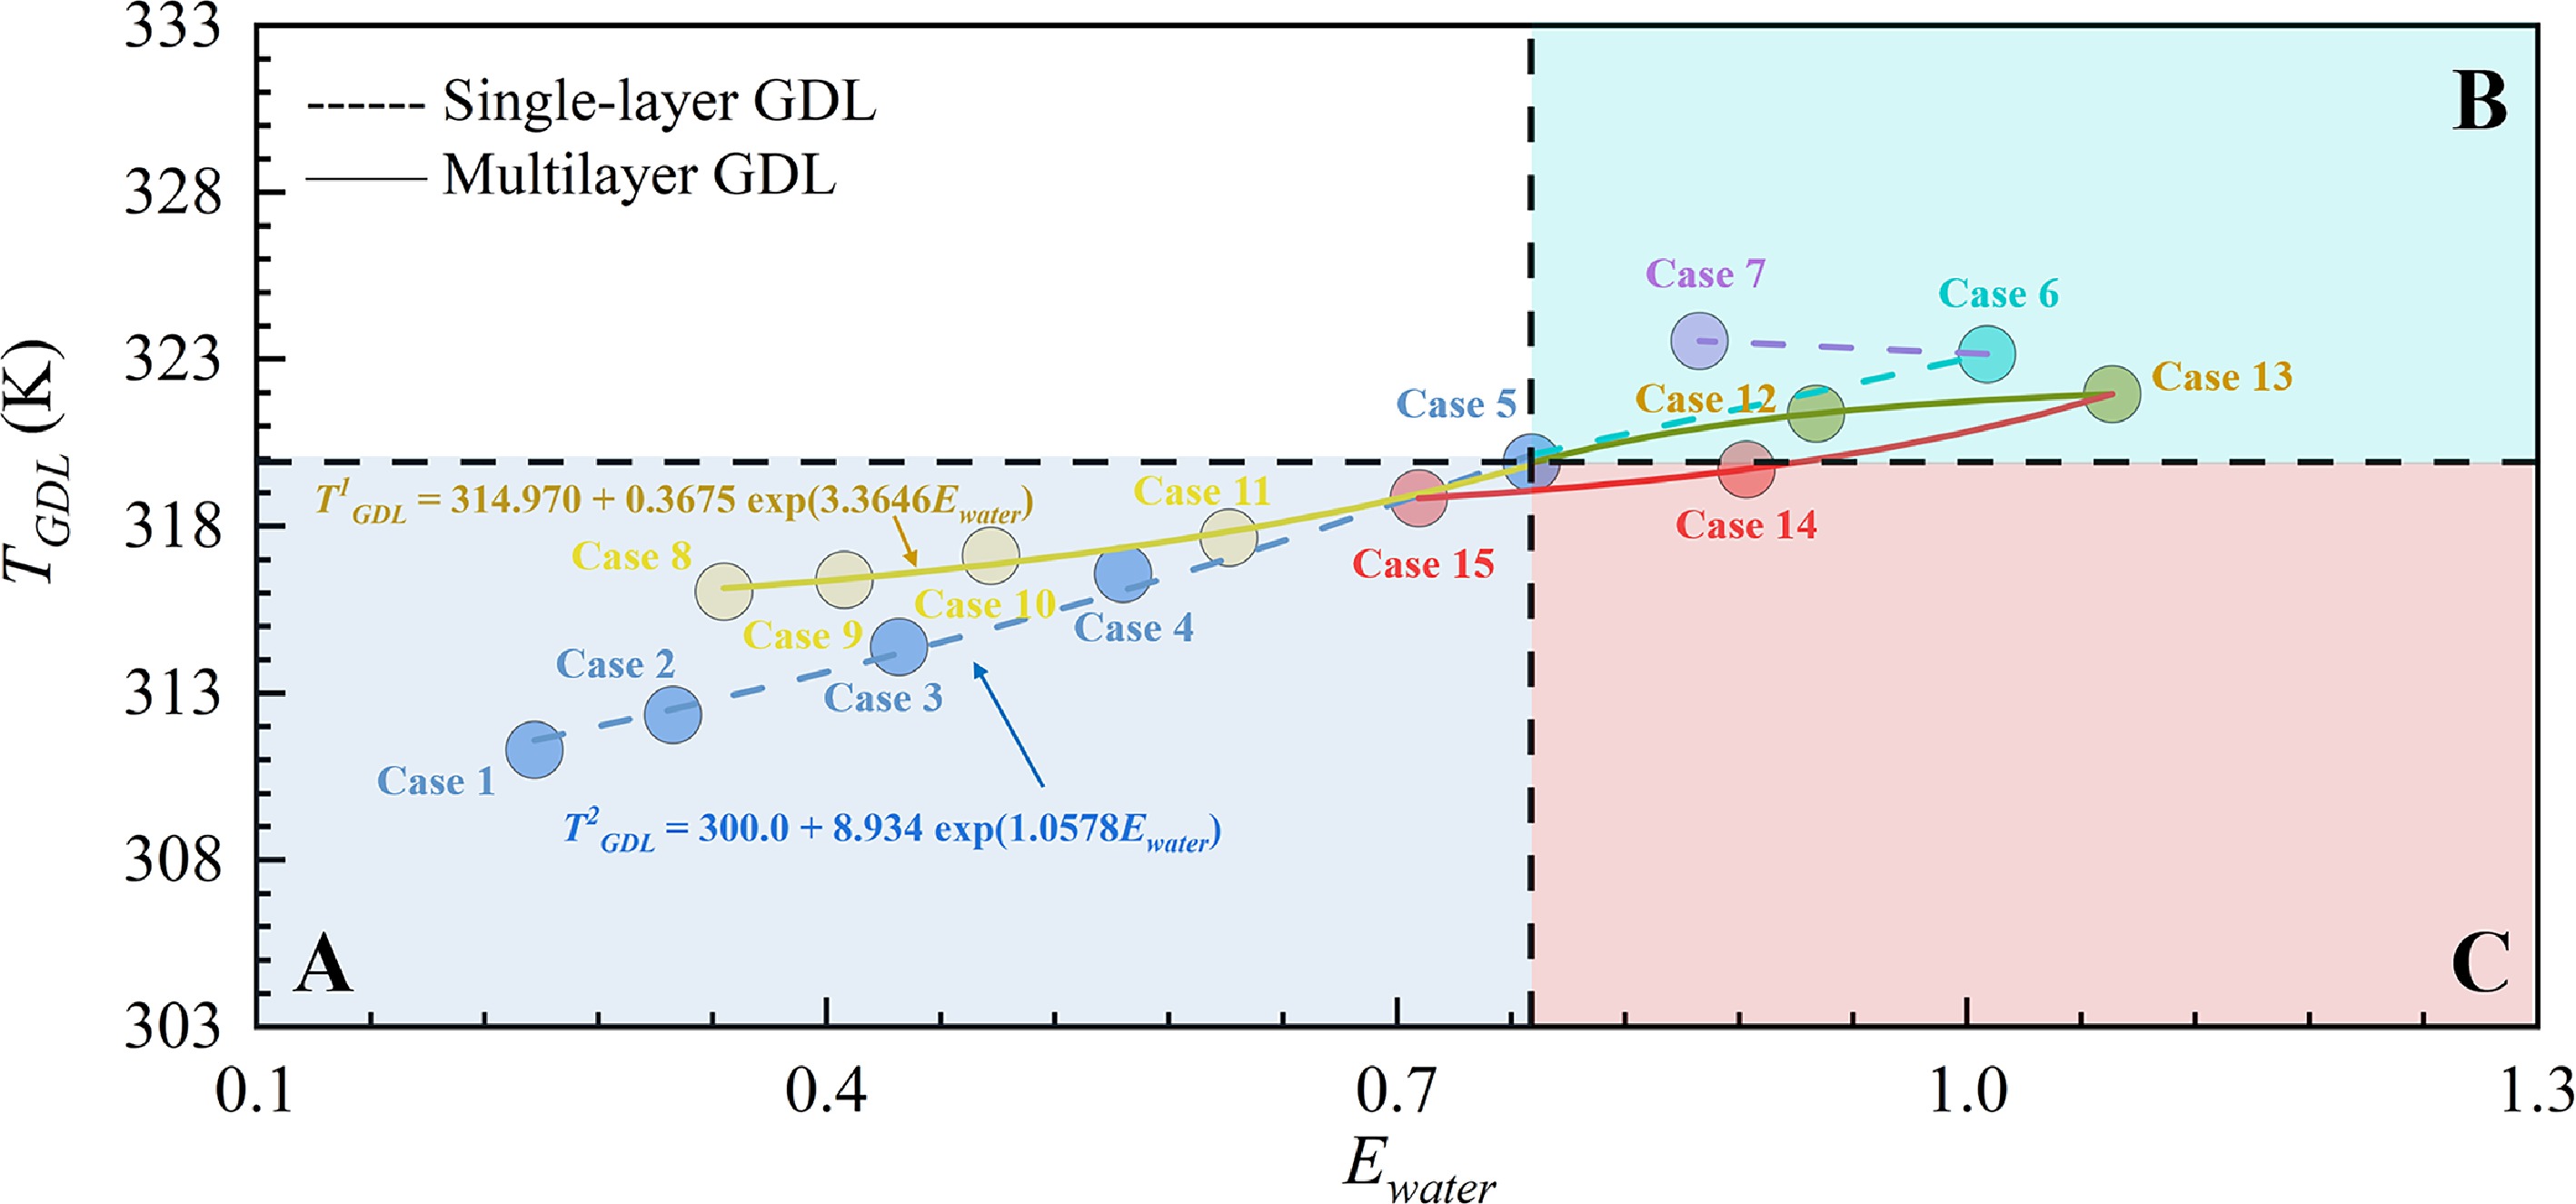
Figure 10.
Correlation between Ewater and TGDL in the single-layer and multilayer GDLs.
Insights into determinants of dynamic reaction rates
-
In PEMFCs, the optimization effect of GDL structural regulation on reaction performance can be effectively evaluated by quantifying variations in
$ {J}^{oxygen} $ $ {J}^{oxygen} $ $ {J}^{oxygen} $ $ {J}^{oxygen} $ $ {J}^{oxygen} $ $ {J}^{oxygen} $ $ {J}^{oxygen} $ 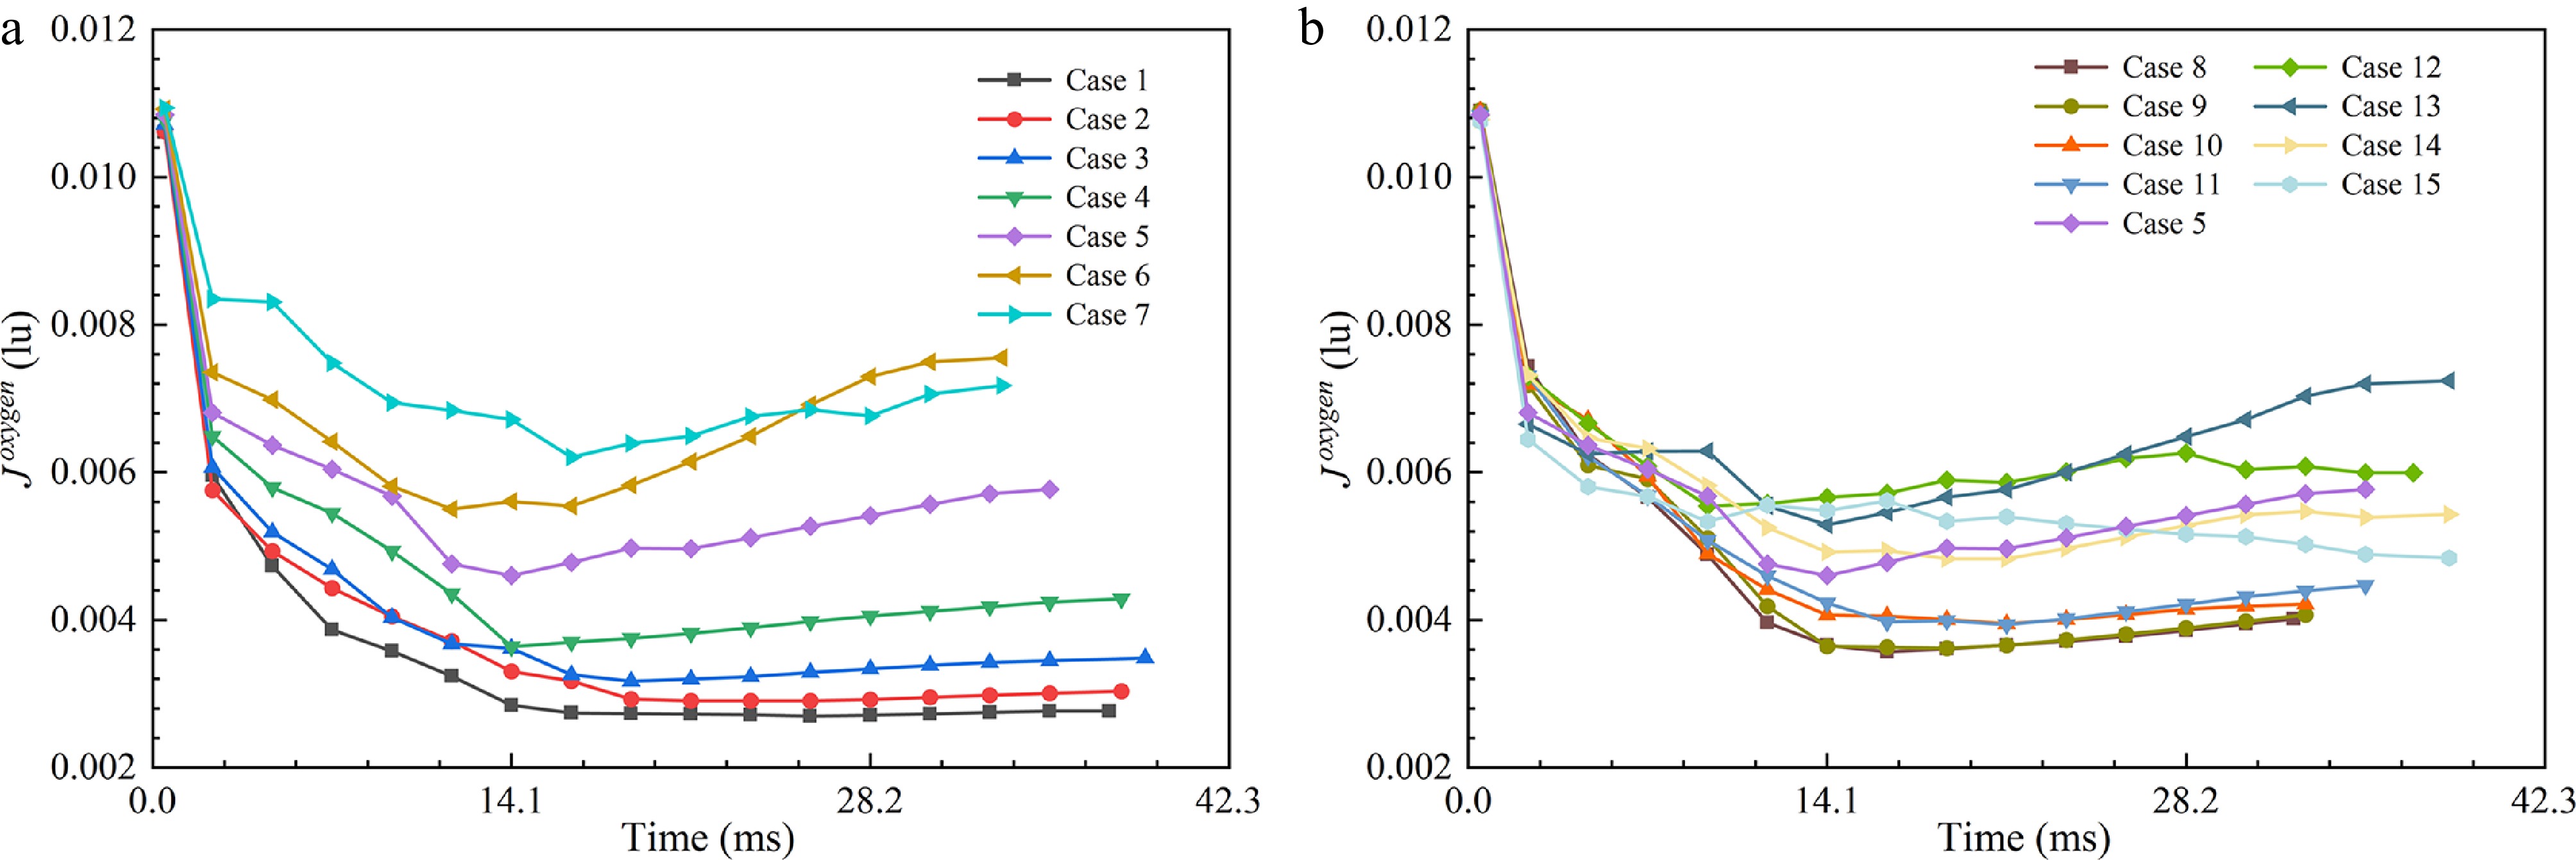
Figure 11.
Variation of $ {J}^{oxygen} $ in the (a) single-layer and (b) multilayer GDLs.
As shown in Eq. (8),
$ {J}^{oxygen} $ $ {k}_{elec}\left(T\right) $ $ {C}^{oxygen} $ $ {C}^{oxygen} $ $ {k}_{elec}\left(T\right) $ $ {J}^{oxygen} $ $ {k}_{elec}\left(T\right) $ $ {C}^{oxygen} $ $ {J}^{oxygen} $ $ {J}^{oxygen} $ $ {k}_{elec}\left(T\right) $ $ {C}^{oxygen} $ $ {k}_{elec}\left(T\right) $ $ {C}^{oxygen} $ $ {J}^{oxygen} $ $ {k}_{elec}\left(T\right) $ $ {C}^{oxygen} $ $ {k}_{elec}\left(T\right) $ $ {J}^{oxygen} $ $ {C}^{oxygen} $ $ {C}^{oxygen} $ $ {k}_{elec}\left(T\right) $ $ {J}^{oxygen} $ $ {k}_{elec}\left(T\right) $ $ {C}^{oxygen} $ $ {k}_{elec}\left(T\right) $ $ {J}^{oxygen} $ $ {k}_{elec}\left(T\right) $ $ {C}^{oxygen} $ $ {C}^{oxygen} $ $ {k}_{elec}\left(T\right) $ $ {J}^{oxygen} $ $ {k}_{elec}\left(T\right) $ 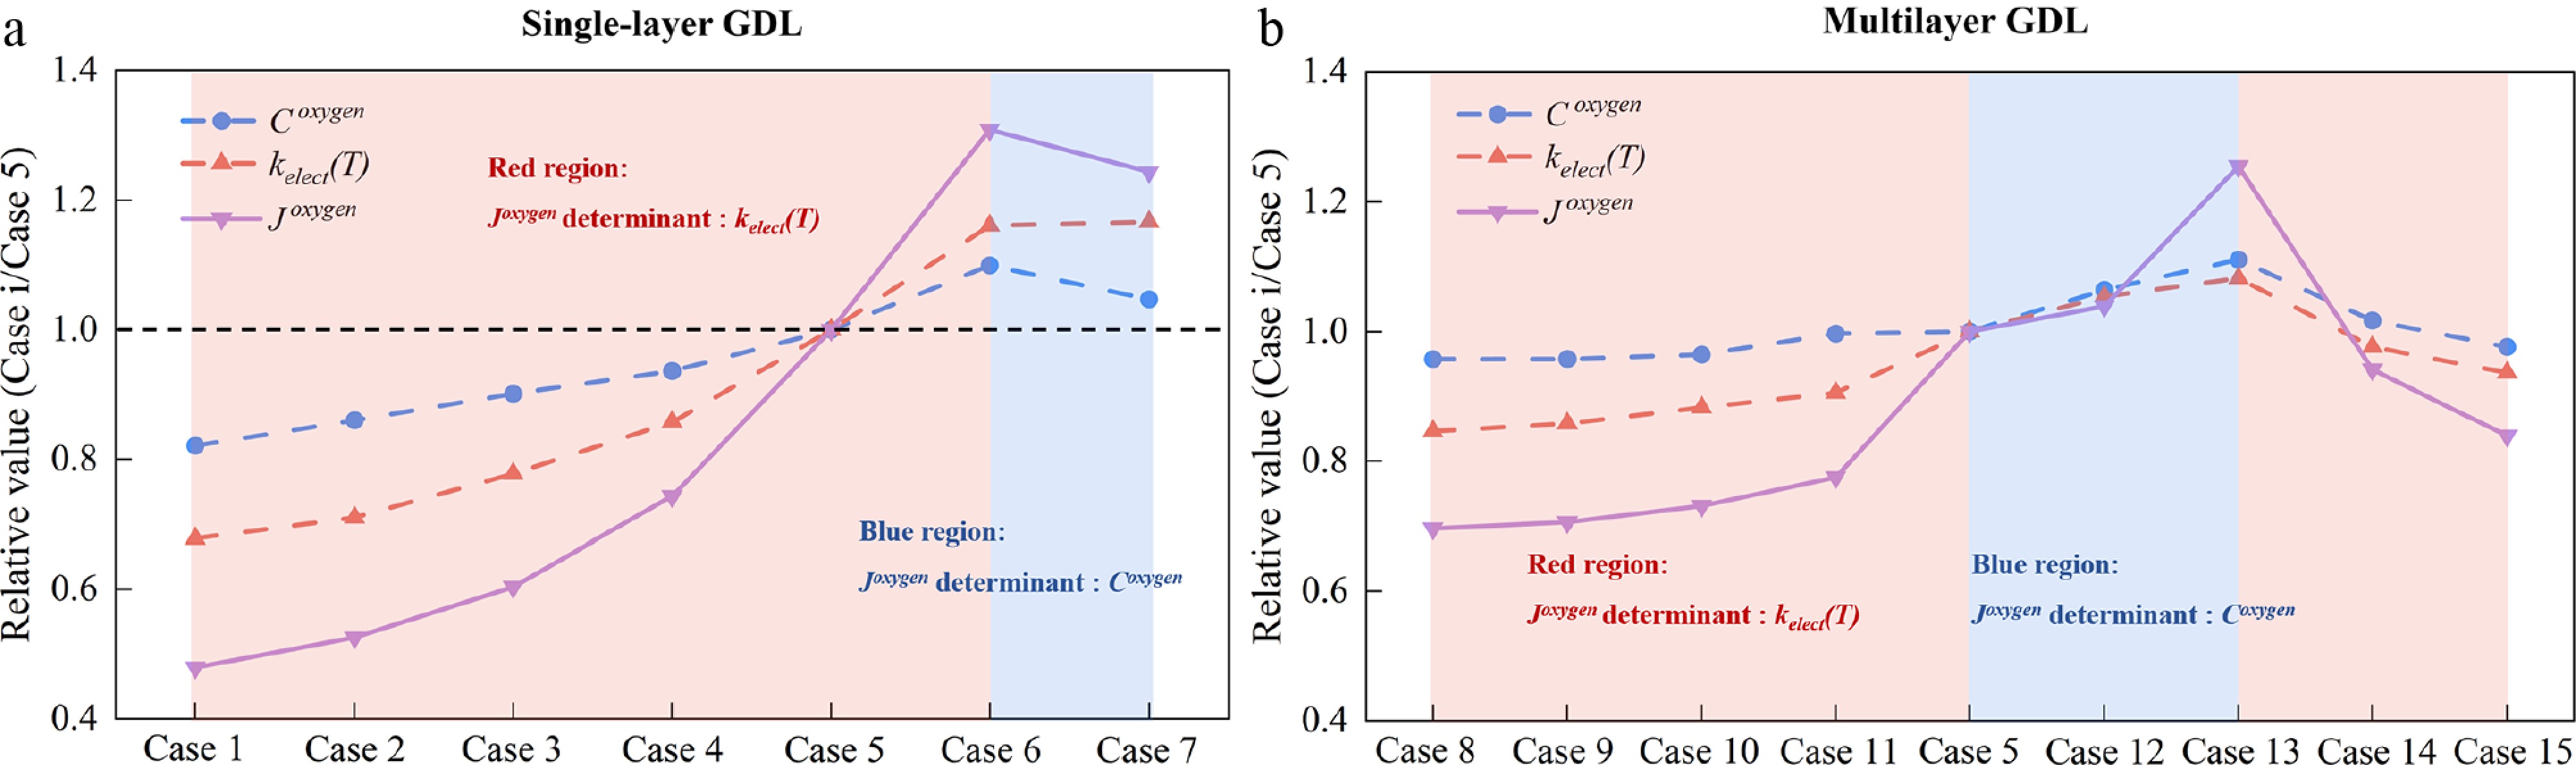
Figure 12.
Effects of $ {C}^{oxygen} $ and $ {k}_{elec}\left(T\right) $ on $ {J}^{oxygen} $ in (a) single-layer and (b) multilayer GDLs. The red regions indicate that $ {k}_{elec}\left(T\right) $ is the determinant of $ {J}^{oxygen} $, whereas the blue regions indicate that $ {C}^{oxygen} $ is the determinant of $ {J}^{oxygen} $.
By quantitatively analyzing the determinants governing reaction rate variations under different GDL structures in Fig. 12, this work further provides a mechanistic understanding of how GDL structural regulation influences the PEMFC reaction rate (Fig. 13), which comprises two principal pathways. One is the oxygen mass transfer pathway, in which GDL structural variations affect water removal efficiency, thereby altering the oxygen concentration, as quantified by
$ {C}^{oxygen} $ $ {k}_{elec}\left(T\right) $ $ {C}^{oxygen} $ $ {k}_{elec}\left(T\right) $ $ {J}^{oxygen} $ 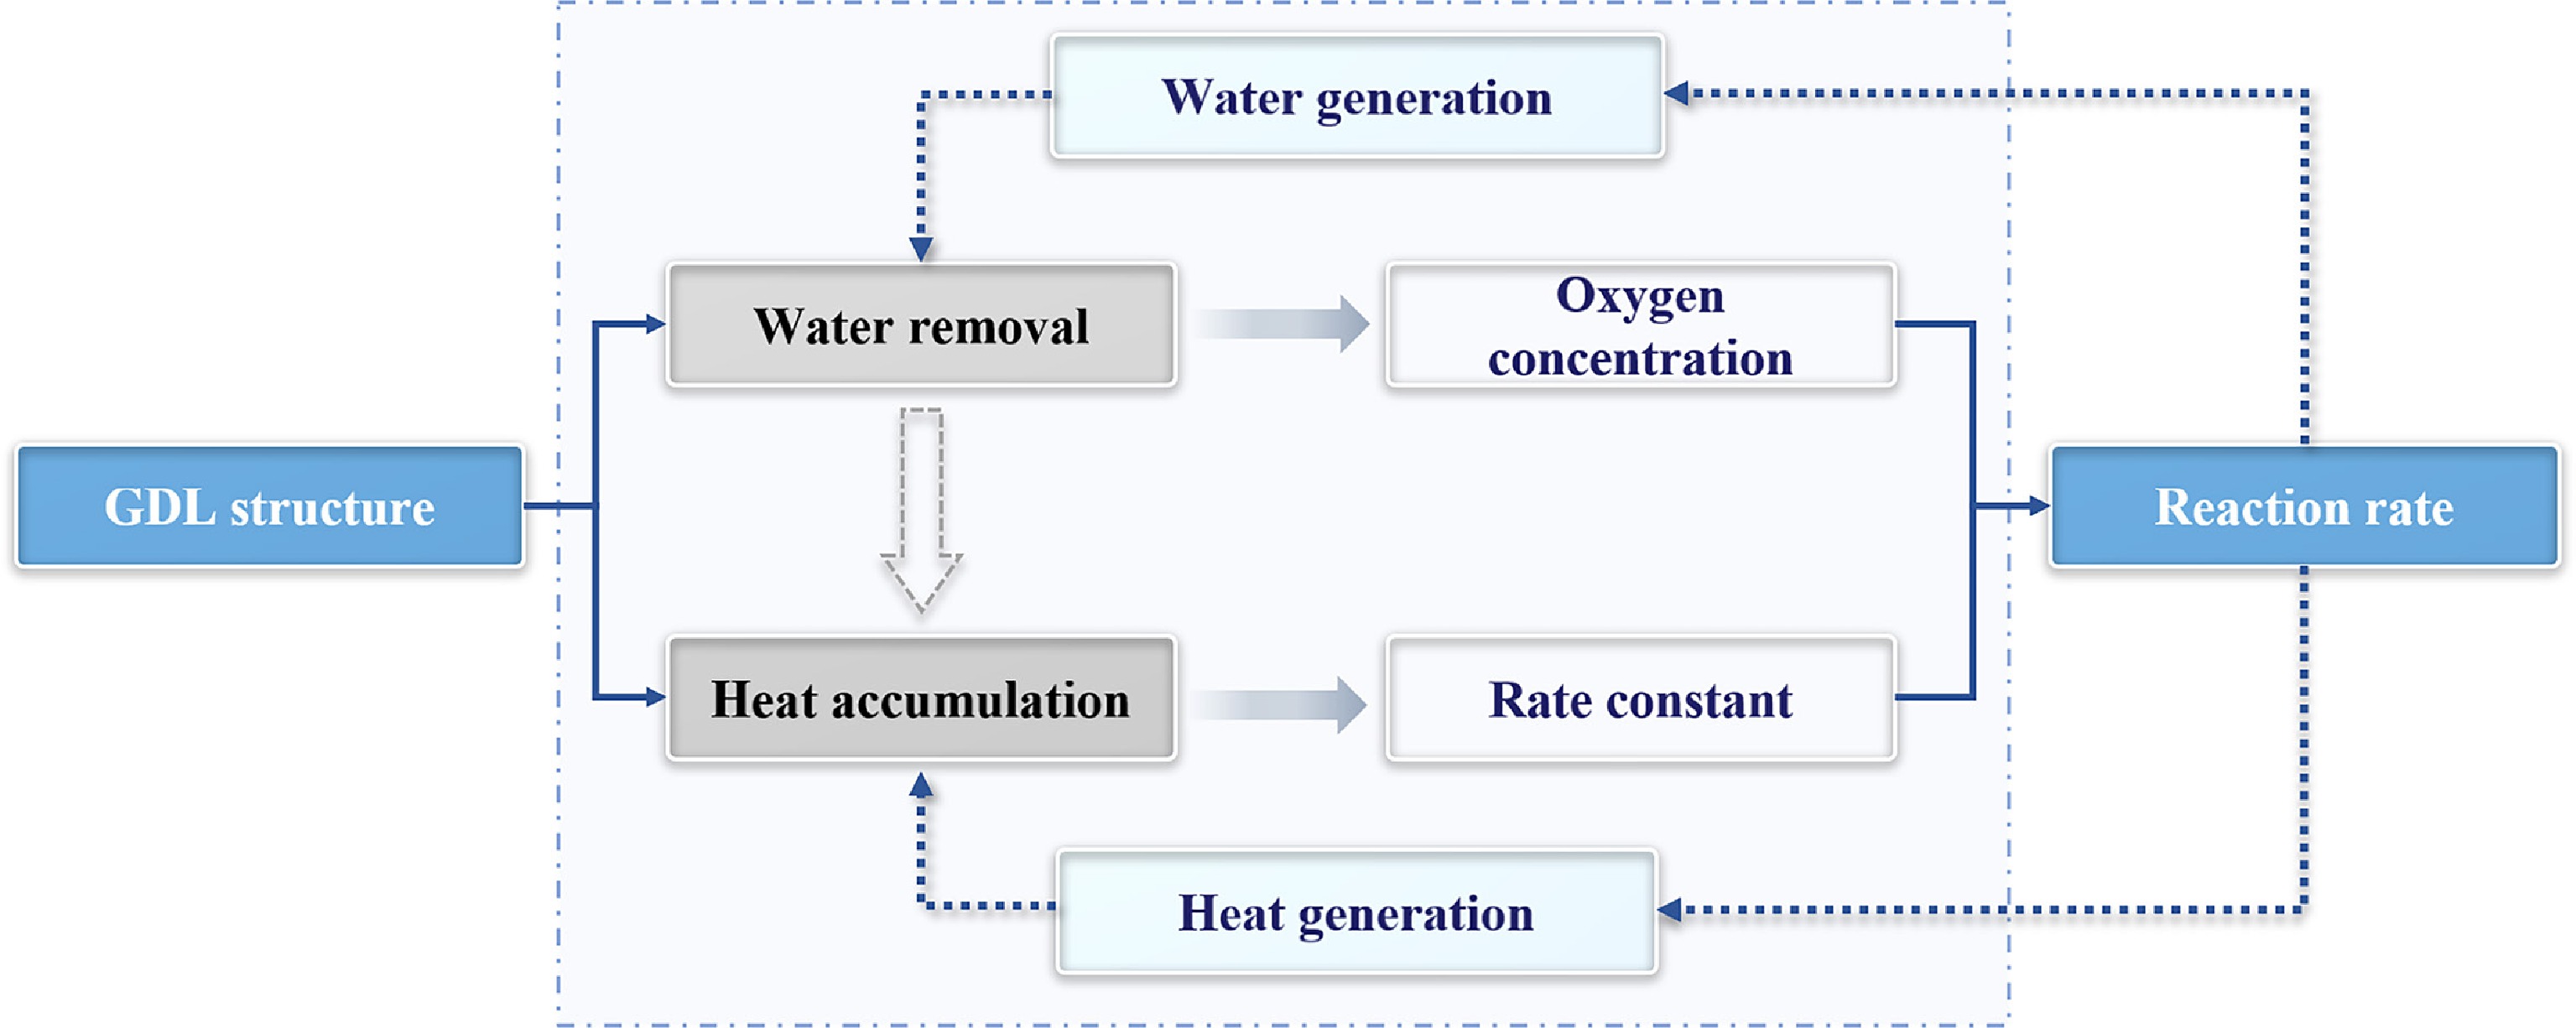
Figure 13.
Schematic of the decoupled analysis linking the GDL structure to the dynamic reaction rate in PEMFCs.
-
This study develops an LBM-based mesoscale model to investigate the microscopic mechanisms governing water removal and heat accumulation in non-uniform single-layer and multilayer GDLs. The model is further employed to decouple the determinants of the dynamic reaction rate across GDL structural variations and to identify two principal pathways. The main findings are summarized as follows:
(1) Increasing porosity in single-layer GDLs lowers capillary resistance and widens the dominant water removal paths, thereby facilitating water and oxygen transport. However, as the porosity approaches 0.9, weakened capillary effects exacerbate localized water blockage, thereby reducing the water removal performance of the GDL. In multilayer GDLs, an increasing through-plane porosity gradient allows the higher driving force near the GDL-MPL interface to offset the larger capillary resistance, while the lower resistance near the GDL-GC interface promotes water breakthrough. Accordingly, the capillary pressure gradient in multilayer GDLs yields a maximum improvement of 40% in water removal efficiency compared with the single-layer cases. However, when the interlayer porosity difference becomes excessively large, the resulting mismatch in capillary entry pressure across adjacent layers impedes both water removal and oxygen supply.
(2) In single-layer GDLs, higher porosity improves water removal but often intensifies localized heat accumulation because reduced water content and fiber fraction weaken thermal buffering and heat dissipation. In multilayer GDLs, increasing the porosity gradient along the through-plane direction progressively intensifies heat accumulation until the interlayer porosity difference exceeds 0.05. Unlike the single-layer case, heat accumulation is markedly mitigated beyond the turning point. This mitigation arises because increased capillary resistance in the bottom layer promotes local water retention while the fiber fraction remains relatively high. Together, these factors strengthen heat transfer and thermal buffering, thereby mitigating heat accumulation.
(3) The dynamic reaction rate depends jointly on the rate constant affected by heat accumulation and the oxygen concentration linked to water removal efficiency within the GDL. In multilayer GDLs, the maximum reaction rate increases by up to 26% compared with the single-layer case. To elucidate how water removal and heat accumulation affect reaction rate, a decoupled analysis is conducted to identify its determinants. In single-layer GDLs, the determinant of reaction rate is the temperature-dependent rate constant, but shifts to oxygen concentration at excessive porosity. In multilayer GDLs, the determinant of the reaction rate is the temperature-dependent rate constant when the porosity gradient decreases, whereas it shifts to oxygen concentration as the porosity gradient increases, but reverts to the temperature-dependent rate constant when interlayer porosity differences become excessive.
-
The authors confirm their contributions to the paper as follows: writing – original draft, software: Wang Y; visualization: Wang Y, Teng Y, Cao Y, Han S, Shi X; writing – review and editing, supervision, data curation, conceptualization: Li W, Li Y; validation: Wang Y, Ye B, Cao Y, Shi X; investigation: Wang Y, Ye B, Teng Y, Han S; methodology: Wang Y, Li W, Ye B, Teng Y, Shi X, Li Y; funding acquisition: Li Y. All authors reviewed the results and approved the final version of the manuscript.
-
All data generated or analyzed during this study are included in this published article and its supplementary information files.
-
The authors declare that they have no known competing financial interests or personal relationships that could have appeared to influence the work reported in this paper.
-
accompanies this paper online at: https://doi.org/10.48130/prkm-0026-0021.
- The supplementary files can be downloaded from here.
- Supplementary File 1
- Copyright: © 2026 by the author(s). Published by Maximum Academic Press, Fayetteville, GA. This article is an open access article distributed under Creative Commons Attribution License (CC BY 4.0), visit https://creativecommons.org/licenses/by/4.0/.
-
About this article
Cite this article
Wang Y, Li W, Ye B, Teng Y, Cao Y, et al. 2026. LBM simulation of water removal and heat accumulation in PEMFCs: influence of GDL multilayering and determinants of dynamic reaction rates. Progress in Reaction Kinetics and Mechanism 51: e027 doi: 10.48130/prkm-0026-0021 

LBM simulation of water removal and heat accumulation in PEMFCs: influence of GDL multilayering and determinants of dynamic reaction rates
- Received: 14 May 2026
- Revised: 25 June 2026
- Accepted: 03 August 2026
- Published online: 29 September 2026
Abstract: Effective water and heat management is essential for sustaining efficient electrochemical performance in proton exchange membrane fuel cells. Structural variations in the gas diffusion layer (GDL) markedly affect water removal and heat accumulation. Particularly, GDL multilayering has attracted increasing attention for optimizing local transport. However, the underlying microscopic mechanisms remain unclear. This work employs the lattice Boltzmann method to investigate microscopic coupling mechanisms by which GDL multilayering affects water removal and heat accumulation. The results indicate that increasing porosity in single-layer GDLs reduces capillary resistance, which broadens dominant water removal paths and intensifies localized heat accumulation, whereas excessive porosity weakens capillary effects, thus exacerbating water blockage. With GDL multilayering, an increasing porosity gradient along the through-plane direction establishes a capillary-pressure gradient, further enhancing water removal and heat accumulation until interlayer porosity differences become excessive. Unlike the single-layer case, heat accumulation is markedly mitigated beyond the turning point due to the combined effects of higher local water content and fiber fraction. A decoupled analysis was conducted to elucidate how water removal and heat accumulation affect the reaction rate through oxygen concentration and the rate constant, respectively. In single-layer GDLs, the determinant of reaction rate is the temperature-dependent rate constant, but shifts to oxygen concentration at excessive porosity. In multilayer GDLs, the determinant of reaction rate is the temperature-dependent rate constant when the porosity gradient decreases, whereas it shifts to oxygen concentration as the porosity gradient increases, but reverts to the temperature-dependent rate constant when interlayer porosity differences become excessive.