


-
Since the 21st century, rapid economic expansion and soaring energy demand worldwide have precipitated severe environmental pollution and an energy crisis, posing existential threats to human survival[1]. In response to these challenges, China's energy system is undergoing a profound structural transformation[2], with clearly defined strategic objectives to achieve carbon peaking by 2030, and carbon neutrality by 2060[3]. As the limitations of traditional fossil fuels become increasingly evident, the vigorous development of renewable energy has emerged as an essential pathway for driving a green and low-carbon transition[4]. Among renewable energy sources, biomass energy stands out for its potential to enable efficient conversion and high-value utilization, playing a crucial role in constructing a circular economy[5], and facilitating carbon emission reduction[6]. Among various biomass conversion technologies, pyrolysis has gained widespread attention as a promising approach for biomass valorization due to its cost-effectiveness and operational efficiency[7]. Specifically, converting agricultural waste into energy or energy carriers (e.g., biochar) through pyrolysis, not only does it enables resource recycling but also enhances the resilience and security of the energy systems[8]. Biochar, a solid product derived from biomass pyrolysis, has garnered increasing attention for its potential applications. These include adsorbing pollutants (e.g., heavy metals and pesticide residues) in soil[9], removing contaminants from wastewater treatment sludge[10], and serving as an advanced electrode material for supercapacitors in energy storage systems[11]. Consequently, research on biomass-to-biochar conversion via pyrolysis has become a global interest.
Sugarcane bagasse, a by-product of the sugar industry, serves as an ideal precursor for biochar production owing to its abundant availability and concentrated geographical distribution. Global sugarcane production exceeds 2 billion tons annually, with Brazil being the largest producer (approximately 715 million tons), followed by India and China. The large-scale processing of sugarcane generates substantial bagasse waste, with annual output reaching approximately 349 million tons[12]. Conventional disposal methods, such as open burning or landfilling not only pose environmental risks but also represent a large-scale waste of valuable resources. By converting bagasse into biochar, this waste stream can be upgraded into a high-value product, thereby mitigating resource wastage and enhancing the economic value of agricultural by-products.
Currently, biochar preparation mainly relies on conventional electrically heated pyrolysis. Existing research has primarily focused on elucidating the influence of parameters such as pyrolysis temperature and activating agent type on the properties of the resulting product. For instance, Bouaik et al.[13] conducted a systematic investigation into the impact of operational parameters, including temperature, heating rate, and residence time, on product yield and quality across different pyrolysis methods. Rambhatla et al.[14] analyzed the effect of pyrolysis temperature using mixed wood sawdust as a feedstock. However, they overlooked the important influence of the activating agent on pyrolysis products. The activation process employing chemical agents represents a critical step in biochar preparation from pyrolyzed biomass. Wang et al.[15] and Li et al.[16] examined the chemical mechanisms and pore structure development during pyrolysis, utilizing bamboo and salicornia as feedstocks, respectively, in combination with KOH as an activating agent. Furthermore, Wang et al.[17] explored the synergistic effect of KOH and NH3 during bamboo powder activation. However, a comparative analysis of their results with those obtained using a single activating agent was not performed.
The production of biochar through traditional heating methods has been extensively investigated in previous research. In contrast, microwave-assisted pyrolysis has emerged as a promising alternative technique is garnering increasing attention. Unlike conventional electric heating, which relies on external heat transfer mechanisms (conduction, radiation, and convection) to establish a temperature gradients from the exterior to the interior[18], microwave heating enables direct energy transfer to molecule constituents within the biomass through dielectric polarization. This process primarily involves dipole-dipole rotation, resulting in volumetric and uniform heating of the material[19]. Consequently, microwave heating offers distinct advantages, including rapid heating rates[20], high energy efficiency, and enhanced heating uniformity[21]. Studies have demonstrated that microwave pyrolysis not only has the potential to increase biochar yield but also improve its physicochemical properties, such as specific surface area[22], and pore structure characteristics[23].
In recent years, microwave pyrolysis has been increasingly employed to convert diverse biomass wastes into biochar. For instance, Cheng et al.[24] demonstrated the application of KOH activation combined with microwave treatment on walnut shells, while Chen et al.[25] developed low-cost, high-performance biochar from banana peel through this technique. Yagmur et al.[26] investigated the process conditions for phosphoric acid activation of spent tea leaves. Additionally, Qiu et al.[27] compared the microwave pyrolysis outcomes across multiple feedstocks, including rice husk, peanut shell, and corn stalk. Moreover, the distinctive operational parameters governing microwave pyrolysis for biochar synthesis have become a focus point among researchers, aiming to elucidate their specific effects on product properties. Cui et al.[28] further examined the effects of microwave power, reaction cavity volume, and the proportion of microwave-absorbing material on the heating process. To analyze these influencing factors, the orthogonal decomposition method is extensively utilized.
Response surface methodology (RSM) is a widely adopted statistical technique used to determine optimal process parameters or product formulations. By constructing mathematical models[29], RSM characterizes the relationships between input variables and output responses, clarifies interaction effects among parameters, and thereby enables efficient process optimization with fewer experimental trials[30].
During the microwave pyrolysis of sugarcane bagasse into biochar, complex interactions exist among critical process parameters—such as pyrolysis temperature, KOH addition, and CO2 flow rate—which collectively determine product characteristics. In analyzing these influencing factors, the orthogonal decomposition method has been commonly employed. However, this method falls short in precisely identifying optimal operating conditions. Given this limitation, the RSM was applied in this study to systematically optimize this multi-factor pyrolysis system.
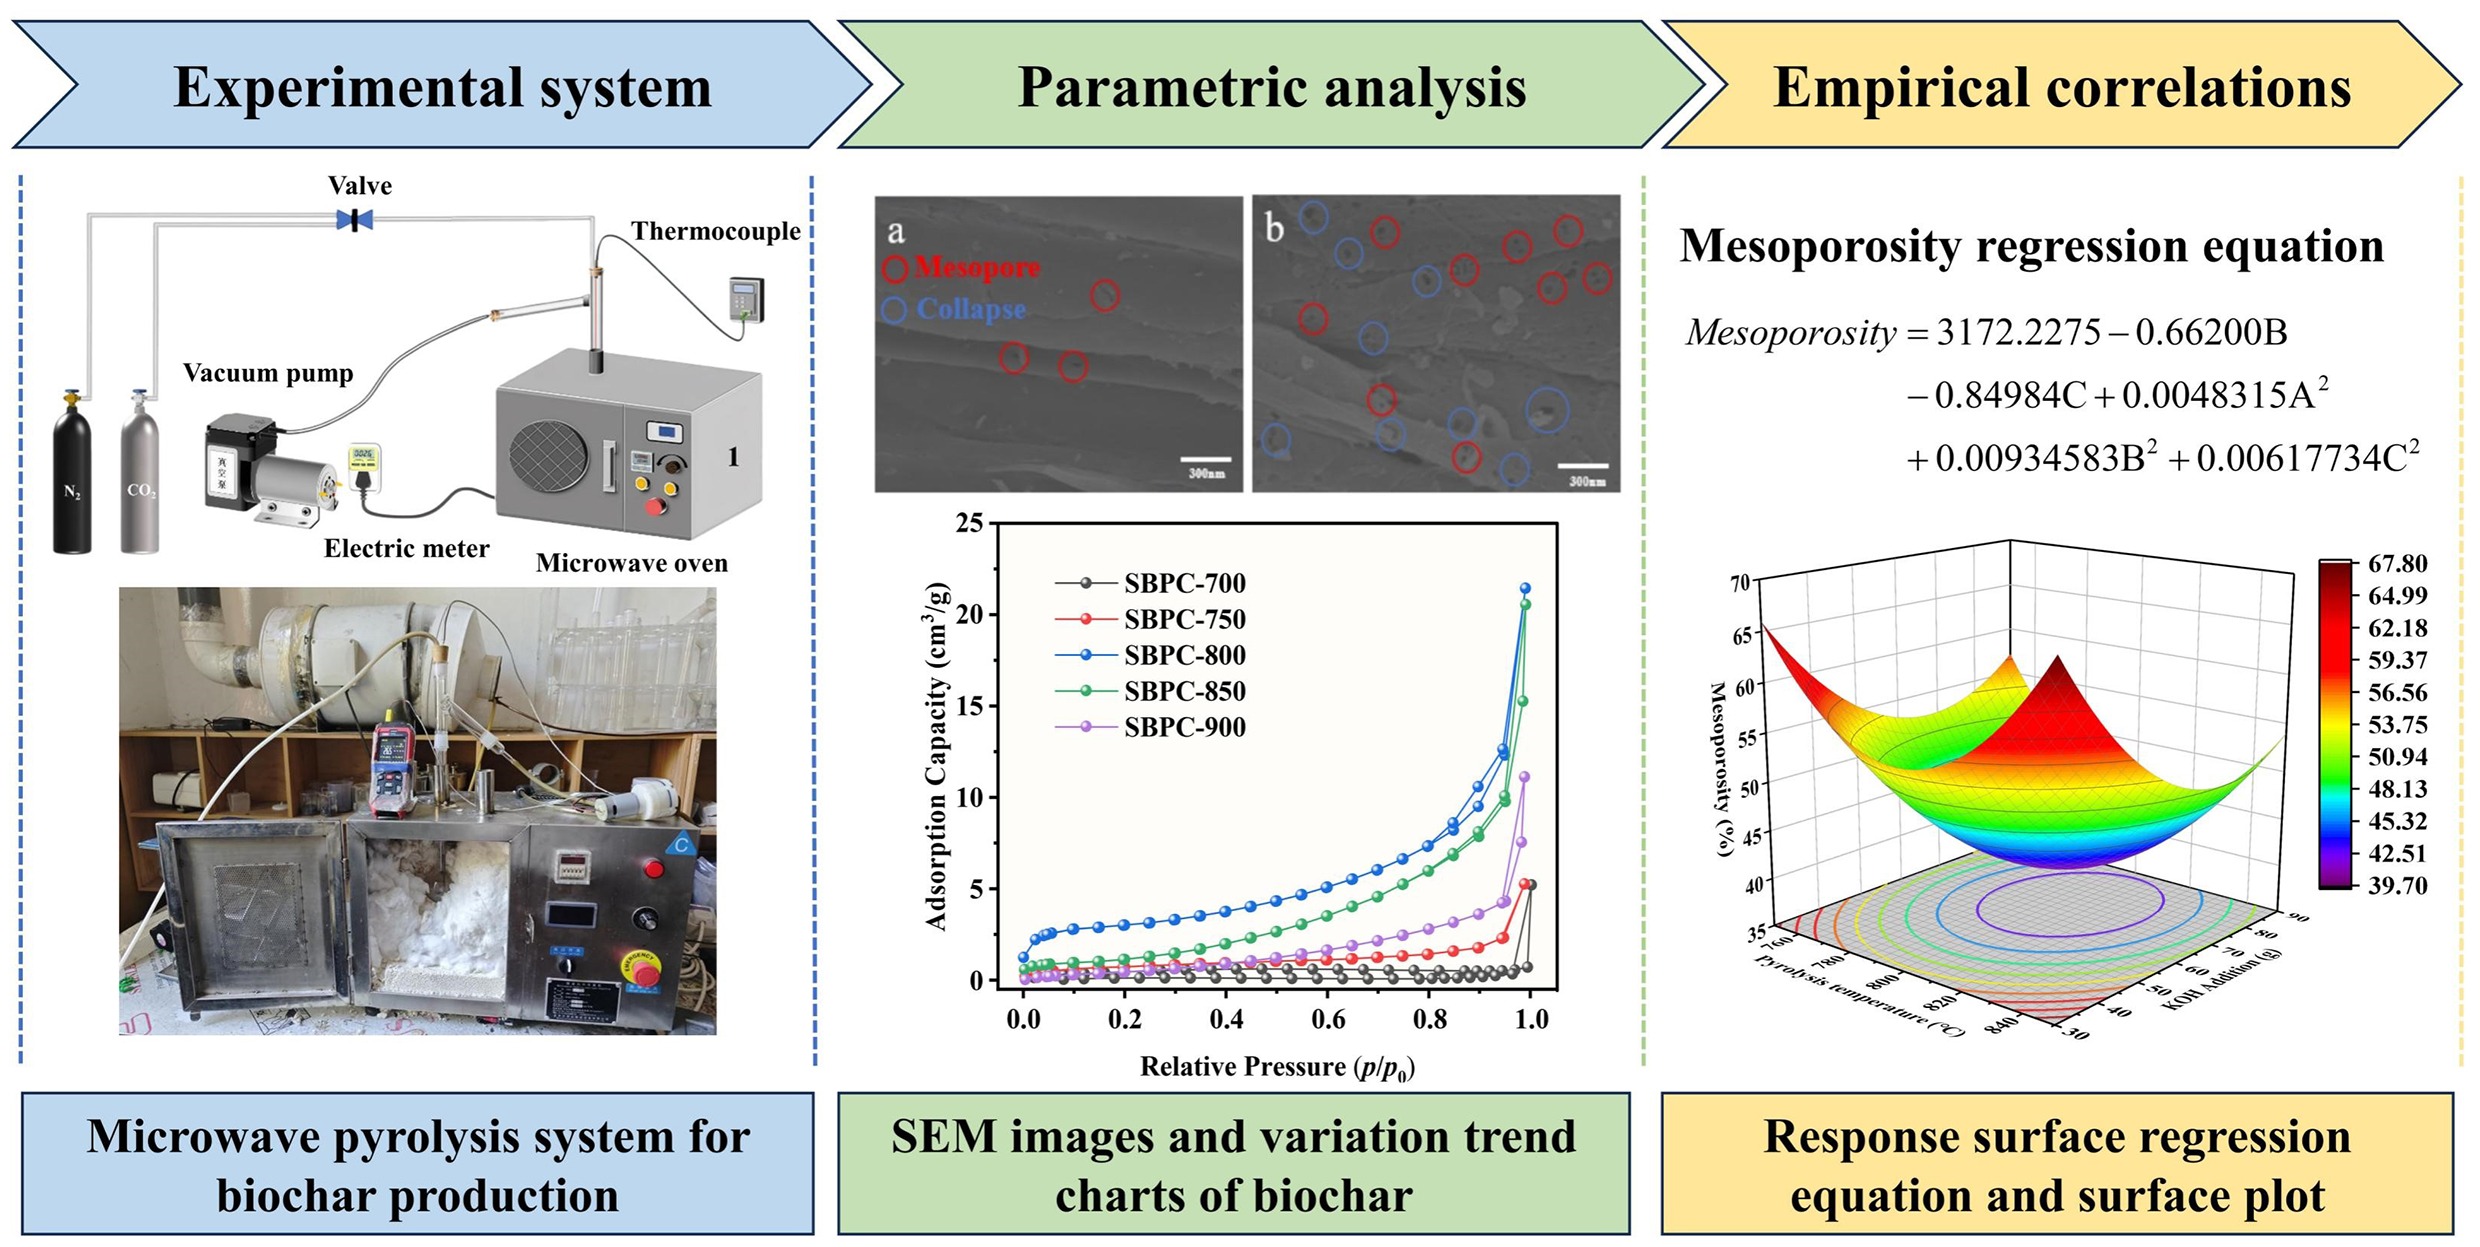
This study employs RSM to investigate the influence of key process parameters on properties of biochar derived from the microwave pyrolysis of sugarcane bagasse. The combined effects of KOH addition, pyrolysis temperature, and CO2 flow rate on biochar yield, pore structure, and specific surface area were comprehensively analyzed using RSM. Optimum process conditions were subsequently determined based on the developed regression model to achieve biochar with desired physicochemical characteristics.
-
Sugarcane bagasse was used as the biomass material, which was collected as an industrial by-product from Guangxi Dongmen Nanhua Sugar Industry Co., Ltd (Guangxi, China). The raw material was initially purified in an ultrasonic cleaner to eliminate impurities such as dust and soil particles, and then oven-dried at 100 °C for 12 h. Subsequently, the dried material was subjected to particle size classification using an automatic sieve shaker equipped with a set of British Standard sieves (No. 10, 22, 30, and 60), resulting in a finely ground powder with a particle size below 0.250 mm (as shown in Fig. 1). This prepared biomass powder was subsequently utilized in the microwave pyrolysis experiments. The microwave-assisted pyrolysis system consisted of four major components: a microwave heating unit, a temperature measurement unit, a reaction chamber, and a gas collection system.
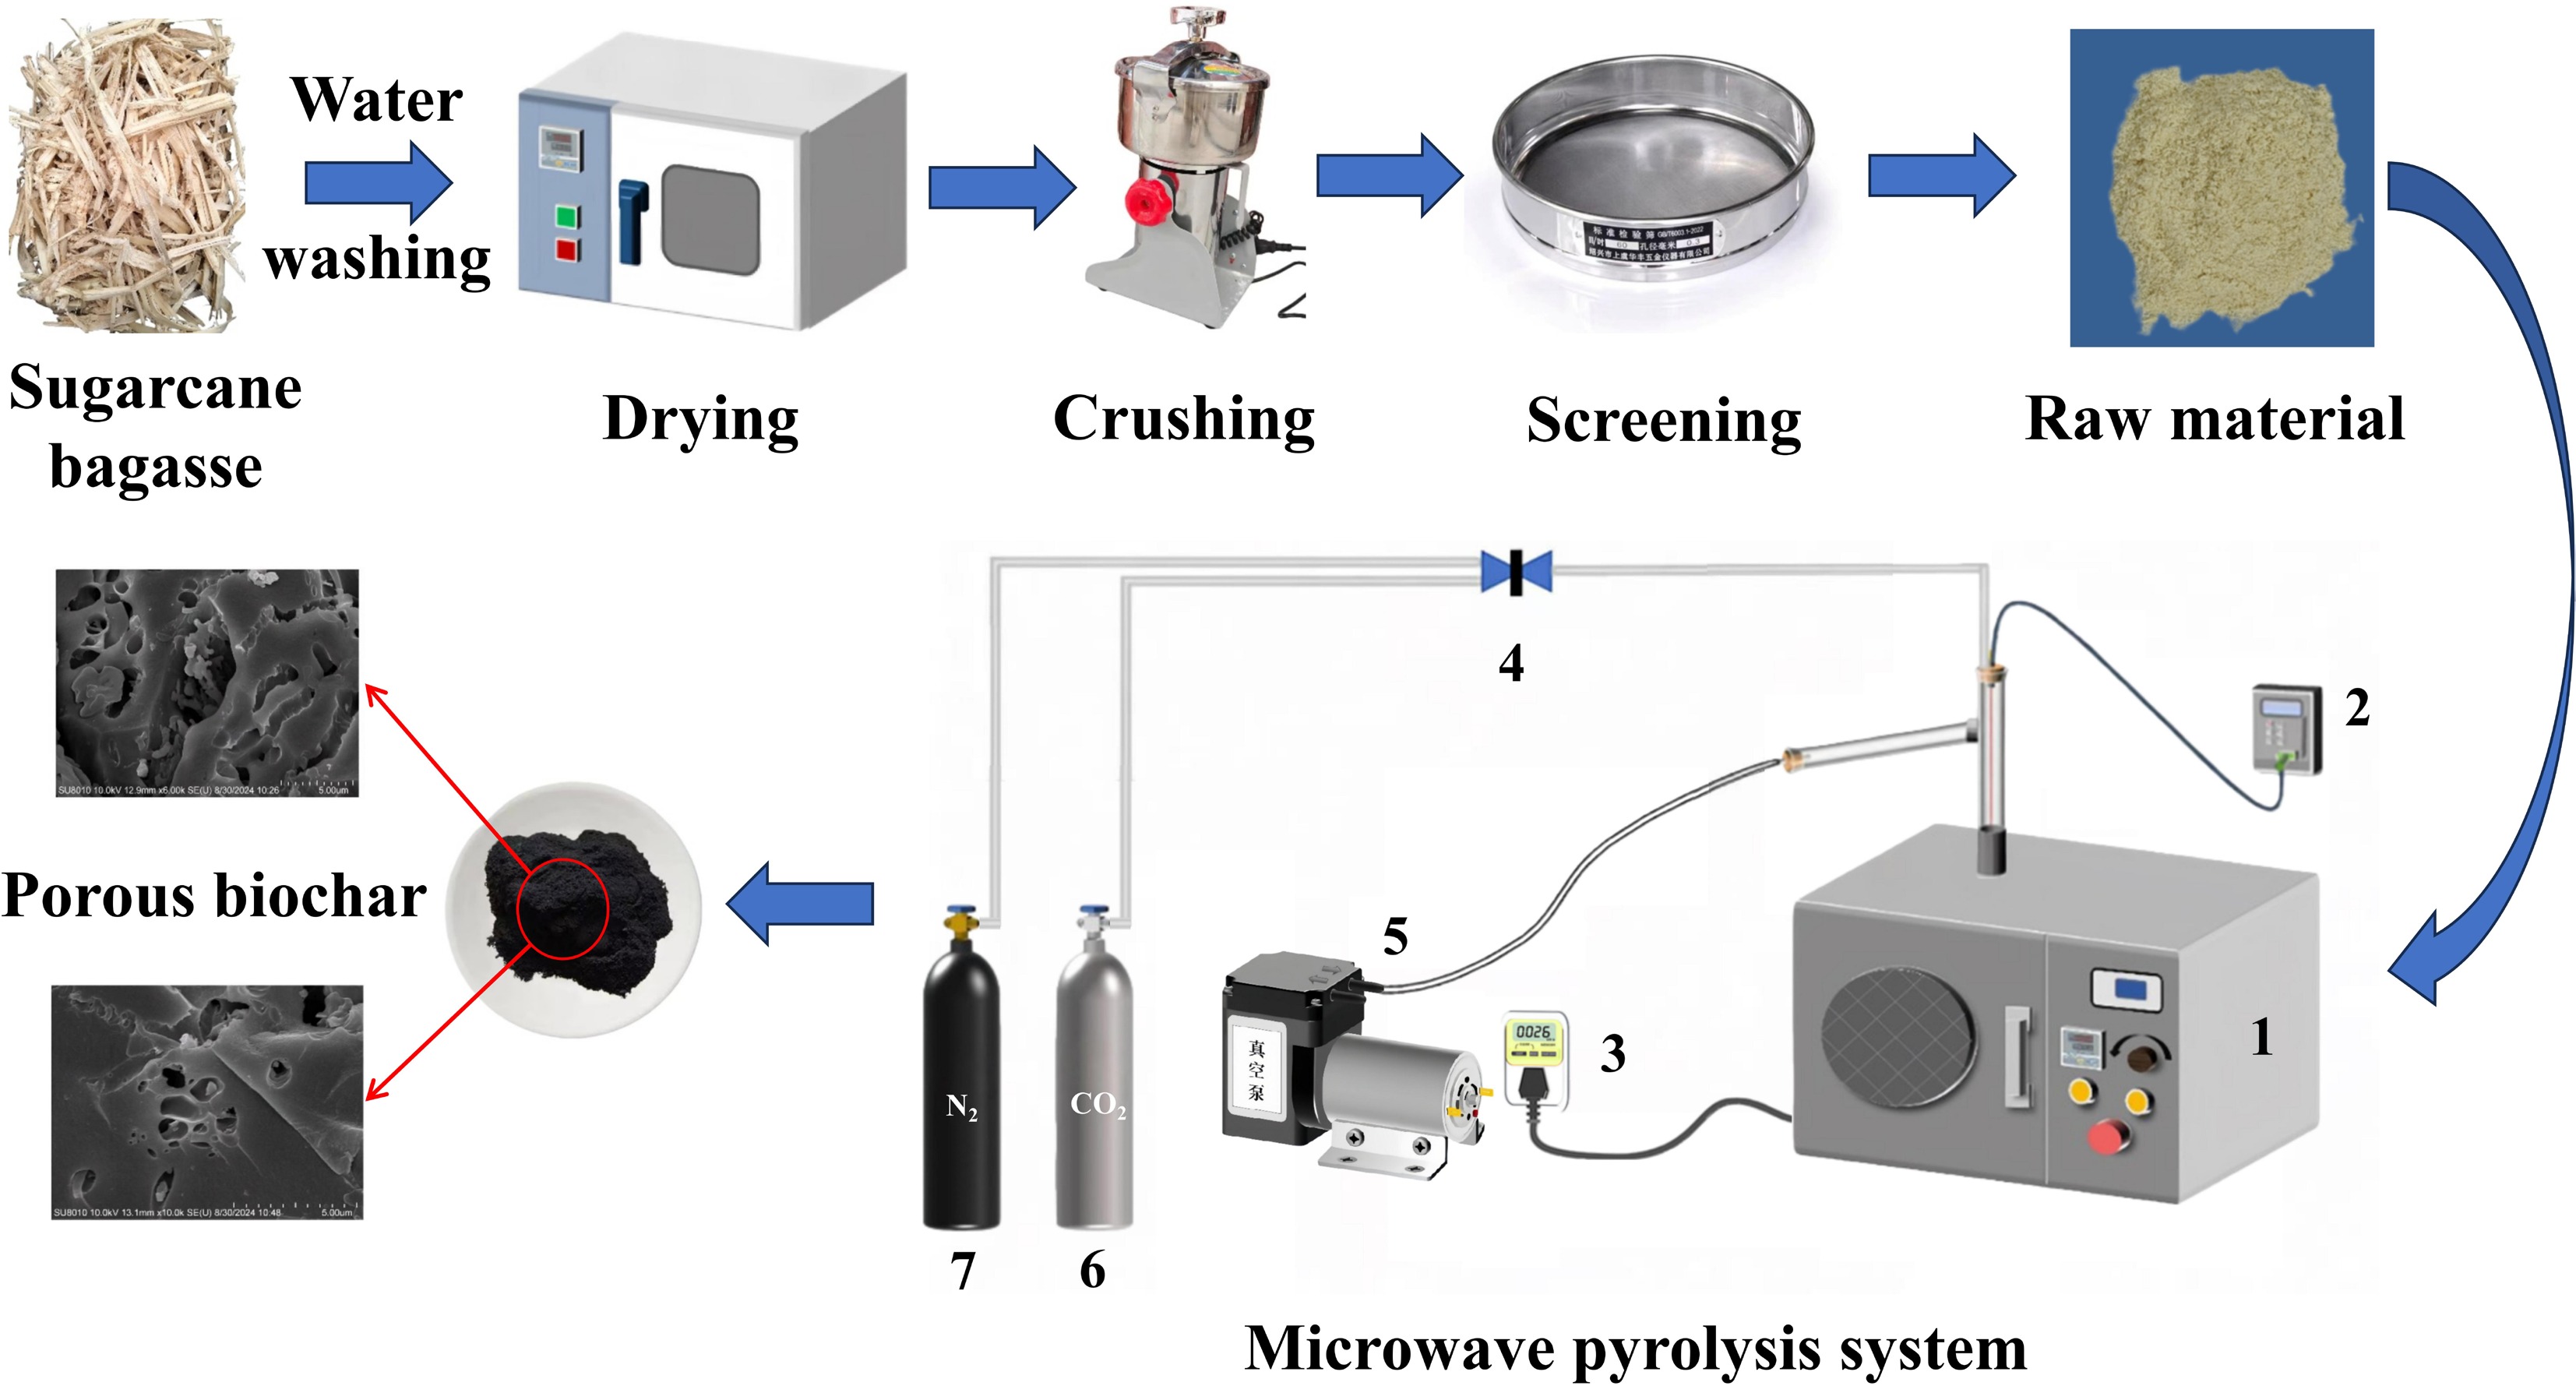
Figure 1.
Schematic diagram of experimental microwave-assisted pyrolysis system: (1) microwave oven, (2) thermocouple, (3) electric meter, (4) valve, (5) vacuum pump, (6) CO2, and (7) high purity nitrogen.
Proximate and ultimate analyses were used to characterize the physicochemical properties of the biomass. The results, as presented in Table 1, are consistent with findings in previous studies. These compositional parameters play a critical role in estimating the available energy content. According to the American Society of Testing Material (ASTM) D3172-3189 standards, the fixed carbon (FC) content was calculated by deducting the contents of moisture, volatile matter, and ash from the initial mass of the biomass. A high moisture level notably affects the pyrolysis process, specific surface area (SBET), and pore structure due to the extra energy consumed during carbonization. In this study, FC content of sugarcane bagasse was determined to be 16.09%. Previous studies have reported FC values for similar biomass ranging from 14.6% to 16.9%. Such variations are generally attributed to factors such as plant variety, geographical location, climate, and sowing season.
Table 1. Proximate and ultimate analysis of sugarcane bagasse
Parameters Value Proximate analysis (wt.%) Moisture 5.37 Ash 8.23 Volatile 70.31 Fixed carbon 16.09 Ultimate analysis (wt.%) C 44.80 H 5.35 Oa 40.55 N 0.38 S 8.92 a Calculation of variances. Furthermore, ultimate analysis quantified the elemental composition of the biomass waste, including carbon (C), hydrogen (H), nitrogen (N) and sulfur (S), and oxygen (O). The oxygen (O) content was calculated using Eq. (1). The carbon and oxygen contents of the sugarcane bagasse were 44.8% and 40.55%, respectively. Nitrogen and sulfur were detected only in trace amounts, whereas oxygen accounted for a substantial proportion of the biomass waste.
$ \text{Oxygen}\left(\text{O}\right)=100-\text{C}-\text{H}-\text{N}-\text{S} $ (1) Characterization techniques
-
The microscopic morphology of the biochar was examined by scanning electron microscopy (SEM), which consisted of a tungsten wire electron source, high vacuum conditions, an acceleration voltage of 1.2 kV and a magnification of 10,000x. Elemental composition and spatial distribution, specifically the presence of C, N, O, and S across the porous carbon structure, was analyzed using energy-dispersive X-ray spectroscopy (EDS). The porous texture of the samples was evaluated through N2 adsorption-desorption measurements conducted at −196 °C using a high-speed automated surface area and pore size analyzer (Autosorb-iQ-MP). Prior to analysis, approximately 150 mg of each sample was degassed at 150 °C overnight to eliminate surface contaminants. The Brunauer-Emmett-Teller (BET) method was applied to determine the SBET. Themicropore volume (Vmic) and mesopore volume (Vmes) were estimated based on the t-plot method. The total pore volume (Vpore) was calculated using density functional theory (DFT) method.
Response surface analysis
-
This study conducted single-factor experiments to assess the individual effects of parameters on biochar yield, microscopic morphology, specific surface area, and pore structure. The results from the single-factor tests were subsequently used to determine the appropriate high and low level settings for each factor. The experimental design was based on the Box-Behnken design (BBD) matrix, which formed the methodological foundation for subsequent statistical analysis. The outcomes were evaluated using RSM, which was applied to optimize the bagasse pyrolysis process. This approach enabled a comparative analysis of the effects of individual factors and their interactions, and was used to predict the optimal preparation conditions that maximize the specific surface area of the biochar and achieve the most economically favorable yield. In the BBD matrix framework, each independent variable was assigned to three levels: low (−1), medium (0), and high (+1). As detailed in Table 2, the values of +1 and −1 correspond to the experimentally defined high and low levels, respectively.
Table 2. Experimental design of factors and levels
Factor level Pyrolysis temperature (°C) KOH addition (g) CO2 flow rate
(ccm)1 850 90 120 0 800 60 80 −1 750 30 40 The experimental design was established based on a three-factor BBD, where the points were located at the midpoints of the edges of a cube model, as illustrated in Fig. 2. This ensures a rotatable and symmetrical arrangement of factor levels. A total of 17 experimental runs were performed, comprising 12 points at the edge midpoints, and five replicate trials at the center point, which served to quantify experimental error.
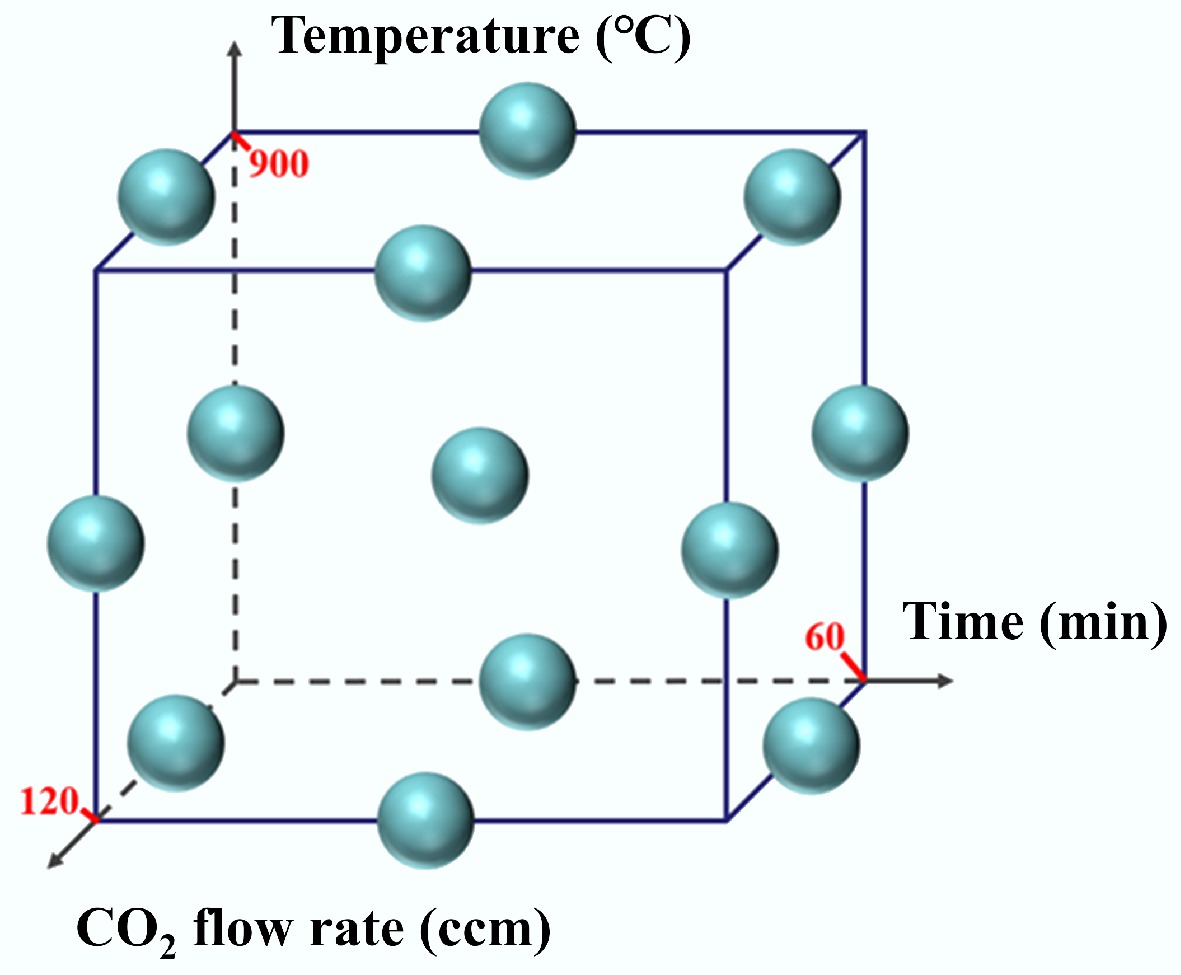
Figure 2.
Schematic diagram of actual sampling points in three-factor BBD.
-
To evaluate the effect of pyrolysis temperature on the specific surface area, five samples were prepared under the conditions detailed in Table 3.
Table 3. Experimental conditions of the biochar from pyrolysis of sugarcane bagasse in relation to temperature
Sample name Pyrolysis temperature (°C) Atmosphere Residence time (min) Microwave power (W) SBPC-700 700 100%N2 50 650 SBPC-750 750 100%N2 50 650 SBPC-800 800 100%N2 50 650 SBPC-850 850 100%N2 50 650 SBPC-900 900 100%N2 50 650 These five samples were characterized using SEM, and the resulting micrographs are presented in Fig. 3. At lower pyrolysis temperatures, the material surface displayed a smooth, layered structure with few mesoporous structures, as highlighted by red circles in Fig. 3. As the temperature increased (Fig. 3a), the population of mesopores on the surface became more pronounced. A pyrolysis temperature of 800 °C yielded abundant microspores; however, pore collapses was also observed, as indicated by the blue circles (Fig. 3b). Upon further increasing the temperature to 900 °C, a marked degradation of the pore structures was evident (Fig. 3d). The observed structural deterioration, including the coalescence and collapse of microporous, is primarily attributed to the thermal rearrangement of carbon atoms and rapid release of volatile compounds. The latter can cause pore wall thinning or fracture. Concurrently, the formation of solid products, e.g., molten ash, at elevated temperatures likely contributed to pore blockage and the eventual collapse of the pore network. Additionally, intensified anisotropic shrinkage of the biomass fibers likely resulted in a decrease in pore uniformity and a reduction in the specific surface area, which is consistent with the subsequent BET analysis.
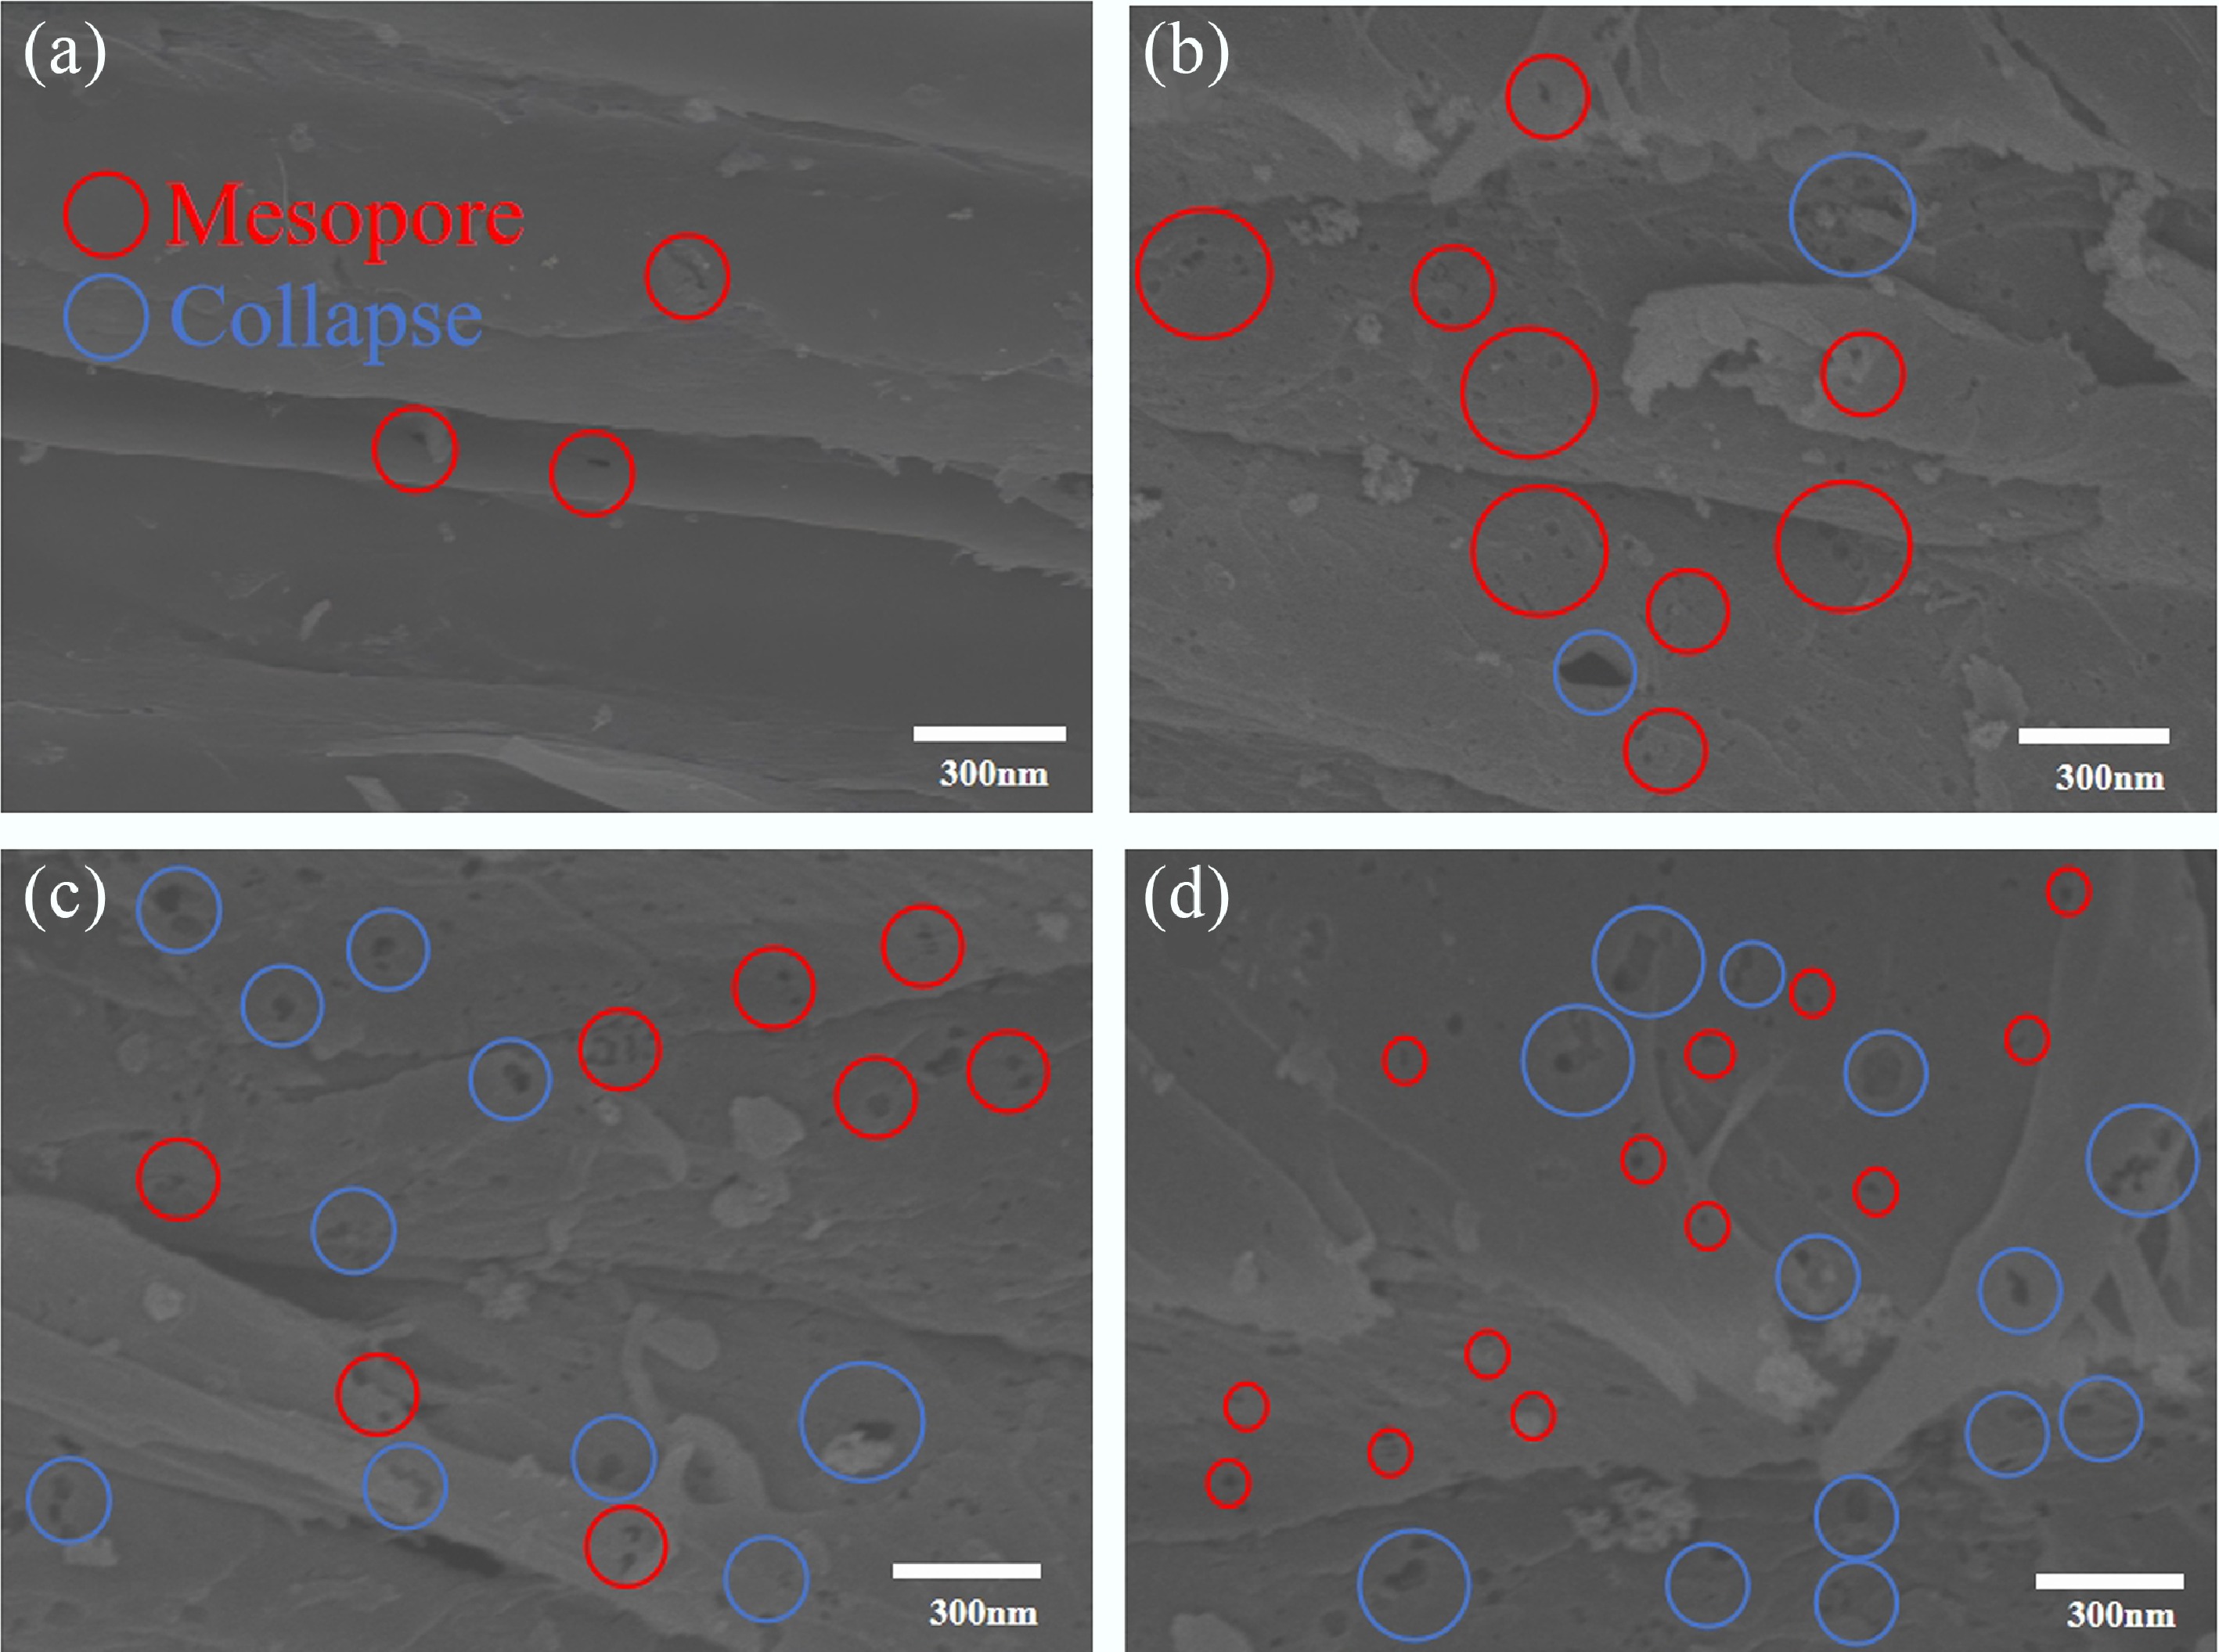
Figure 3.
SEM images of sugarcane bagasse biochar at different pyrolysis temperatures. (a) SEM images of SBPC-700, (b) SEM images of SBPC-800, (c) SEM images of SBPC-850, and (d) SEM images of SBPC-900.
The pore structure of the biochar samples was characterized through adsorption-desorption isotherms of N2. As shown in Fig. 4a, the isotherms of SBPC-2-800 and SBPC-800 align with Type IV in the classification system proposed by the International Union of Pure and Applied Chemistry (IUPAC). In the low relative pressure range (p/p0 = 0−0.1), the N2 adsorption curves of all SBPC samples exhibited a sharp initial uptake, confirming the presence of a substantial number of micropores. In the relative pressure range of 0.4 to 1.0, hysteresis loops were evident in the isotherms of SBPC-850 and SBPC-900, suggesting well-developed mesoporosity.
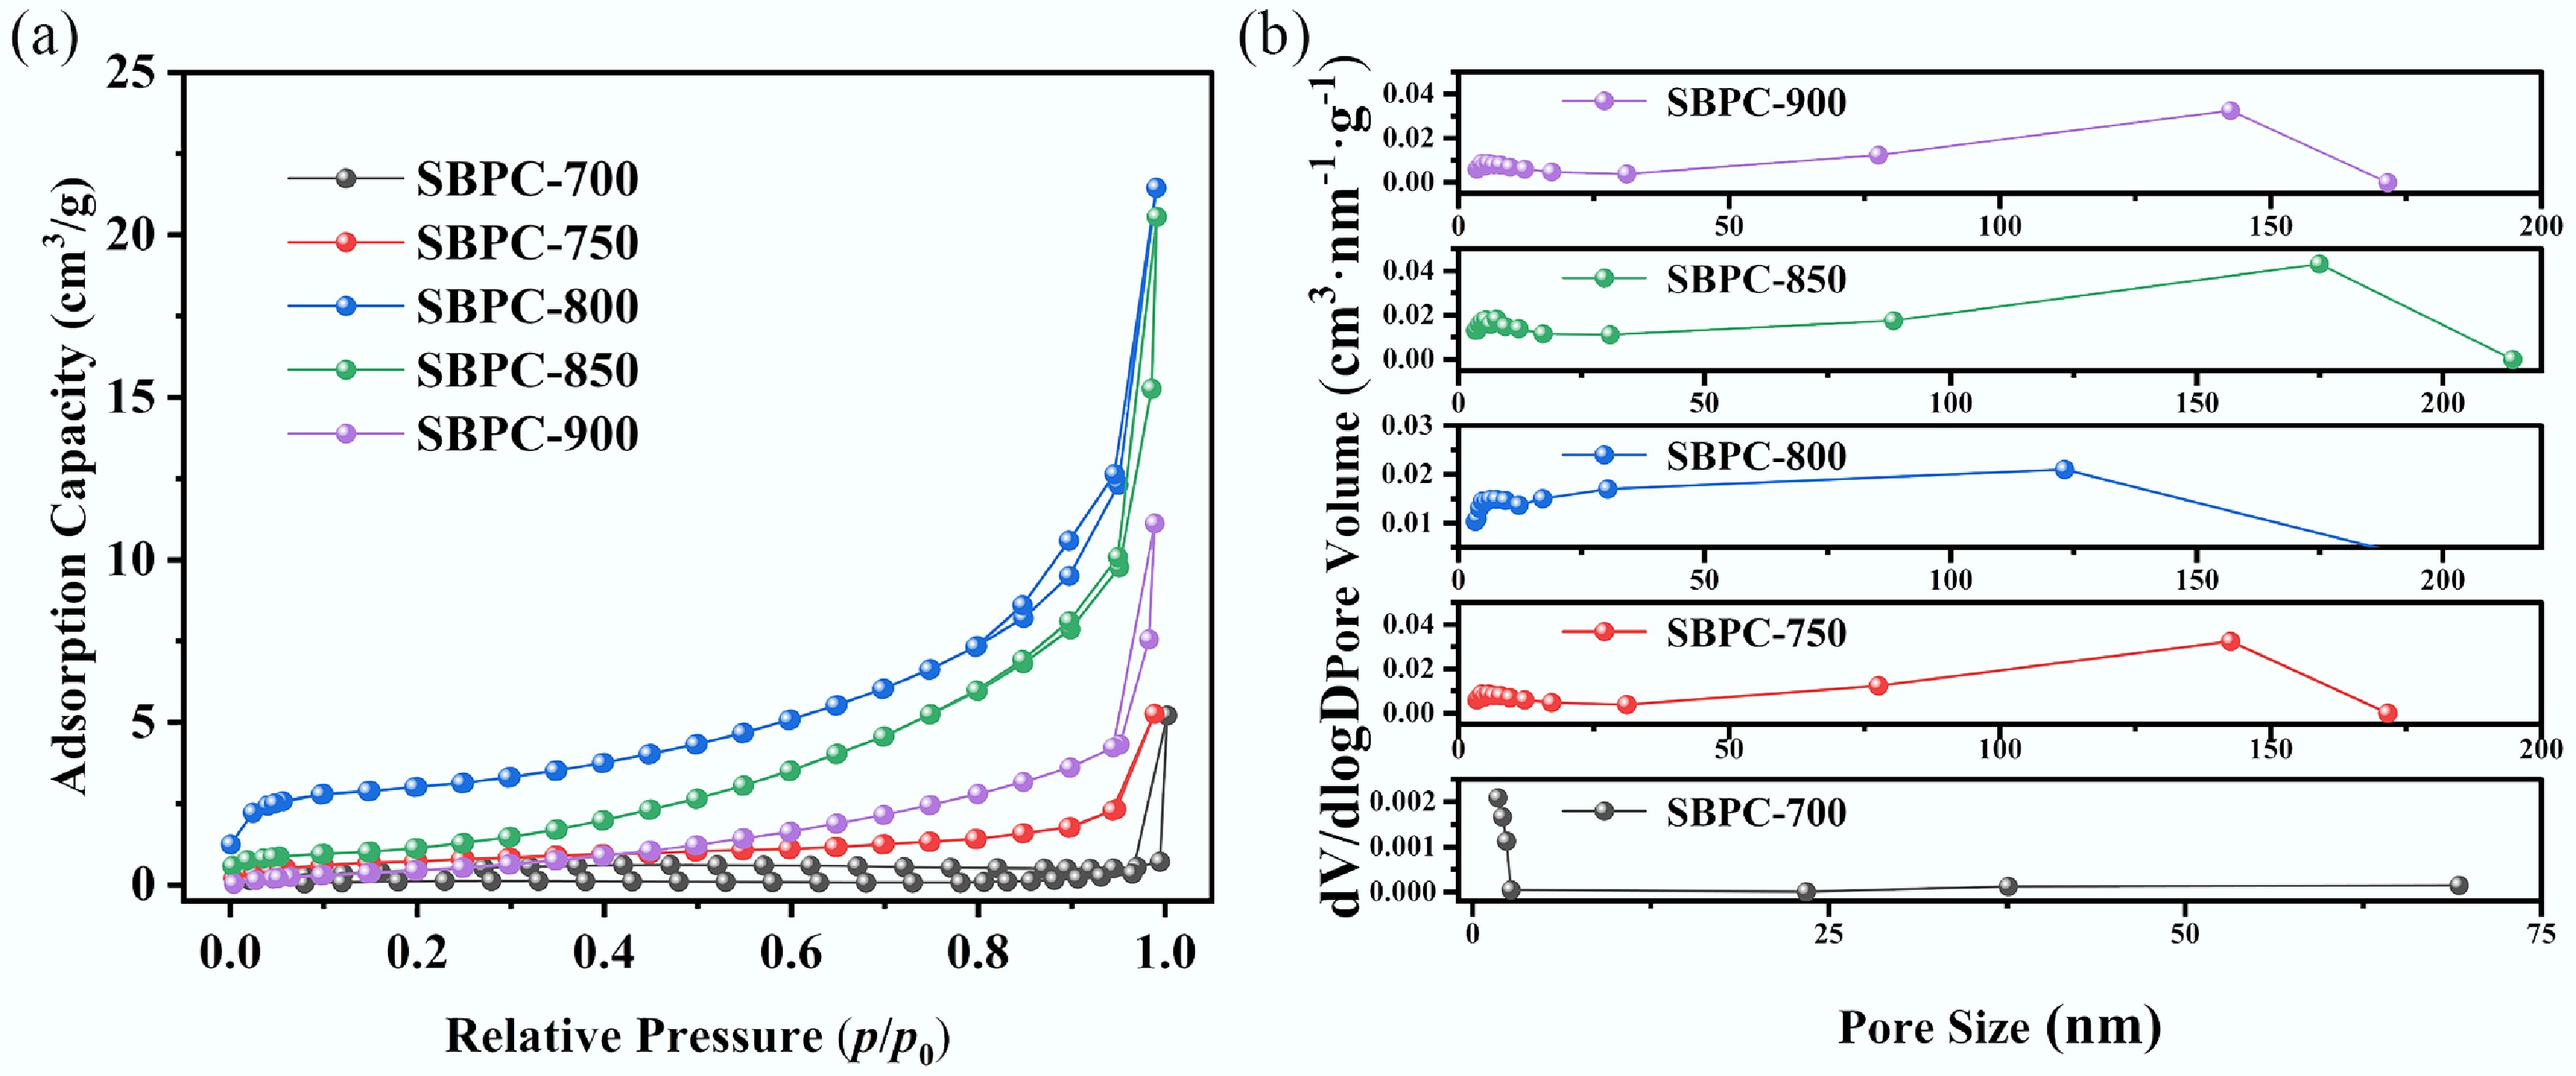
Figure 4.
Pore structure of biochar at different pyrolysis temperatures. (a) N2 adsorption-desorption isotherm and (b) pore size distribution.
Furthermore, the Barrett-Joyner-Halenda (BJH) method was applied to quantitatively assess the pore size distribution based on the adsorption data. The results are summarized in Fig. 4b and Table 4. As the pyrolysis temperature increased, the specific surface area of the samples initially increased, but subsequently decreased. More specifically, the area increased from 4.491 to 11.905 m2/g as the temperature increased from 700 to 800 °C, followed by a decline 7.91 m2/g at 900 °C.
Table 4. Porous structure parameters of biochar at varying pyrolysis temperatures
Sample name SBET
(m2/g)Vtotal
(cm3/g)Vmic
(cm3/g)Vmes
(cm3/g)Vmes/Vtotal
(%)SBPC-700 4.491 0.0318 0 0.0318 100.00 SBPC-750 5.2795 0.006348 0.000697 0.005651 89.02 SBPC-800 11.905 0.033 0.002 0.031 93.94 SBPC-850 10.608 0.0401 0.002 0.0381 95.01 SBPC-900 7.931 0.04506 0.001 0.04406 97.78 This phenomenon can be explained by the accelerated release of volatile matter at elevated temperatures. This release was not synchronized with the formation rate of the carbon skeleton, leading to insufficient mechanical strength of the pore walls. This prompts the collapse of micropores and the formation of mesopores, which ultimately results in a reduction of the specific surface area. A rise in the ratios of Vmes/Vtotal from 93.94% for SBPC-800 to 97.78% for SBPC-900 (and, which further supports the conclusion that micropores were transformed into mesopores through structural deterioration).
Effect of CO2 flow rate
-
To evaluate the impacts of CO2 flow rate on the microscopic morphology, specific surface area, and pore structure of biochar, five separate experiments were performed under a residence time of 50 min, and a microwave power of 650 W. The CO2 flow rates were specifically set at 0, 30, 75, 120, and 150 ccm. The detailed experimental parameters are listed in Table 5.
Table 5. Experimental conditions in relation to CO2 flow rate for of bagasse-derived biochar
Sample name Pyrolysis temperature (°C) CO2 flow
rate (ccm)Residence time (min) Microwave power (W) SBPC-100N 800 0 50 650 SBPC-80N 800 40 50 650 SBPC-50N 800 80 50 650 SBPC-20N 800 120 50 650 SBPC-0N 800 160 50 650 The biochar yields obtained under varying CO2 flow rates (0, 40, 80, 120, and 160 ccm) are illustrated in Fig. 5. As the CO2 flow rate increased from 0 to 160 ccm, the biochar yield decreased from 30.69 wt.% to 17.45 wt.%. This decreasing trend is mainly ascribed to the rapid thermal degradation of the lignocellulosic structure in bagasse. The presence of CO2 restricted biochar formation and thereby lowered the final yield. Moreover, unreacted CO2 engaged in secondary gasification reactions with the biochar at elevated temperatures. These reactions further promote the decomposition of the carbonaceous product, thereby contributing to the yield reduction.
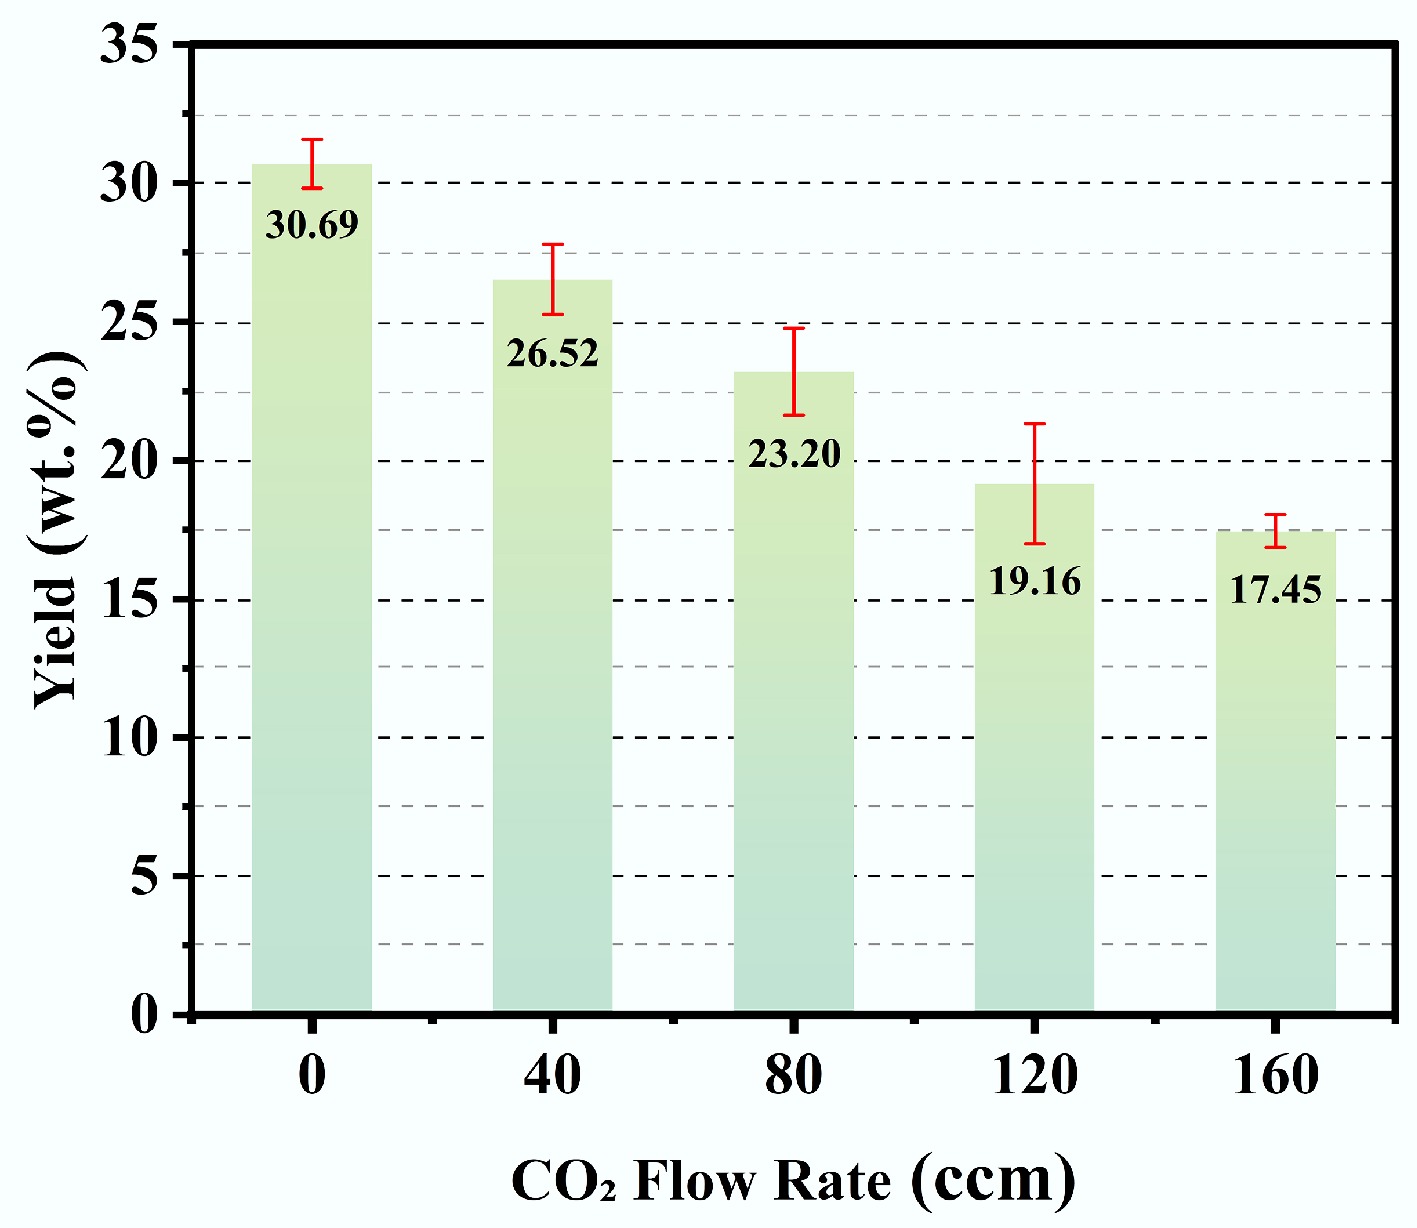
Figure 5.
Yield of biochar under varied CO2 flow rates.
The pore structure of the resulting samples was further examined through N2 adsorption-desorption analysis. As shown in Fig. 6a, all samples displayed Type IV adsorption isotherms according to the IUPAC classification. A sharp increase in nitrogen uptake within the low relative pressure range (p/p0 = 0−0.1) in the isotherms signified the existence of micropores. Moreover, a distinct hysteresis loop was evident in the relative pressure range of 0.4−1.0 for sample SBPC-80N, confirming its developed mesoporous structure. Using the obtained adsorption isotherms, the pore structure was quantitatively evaluated by applying the DFT method. The results for pore size distribution and structural parameters are displayed in Fig. 6b and Table 6, respectively.
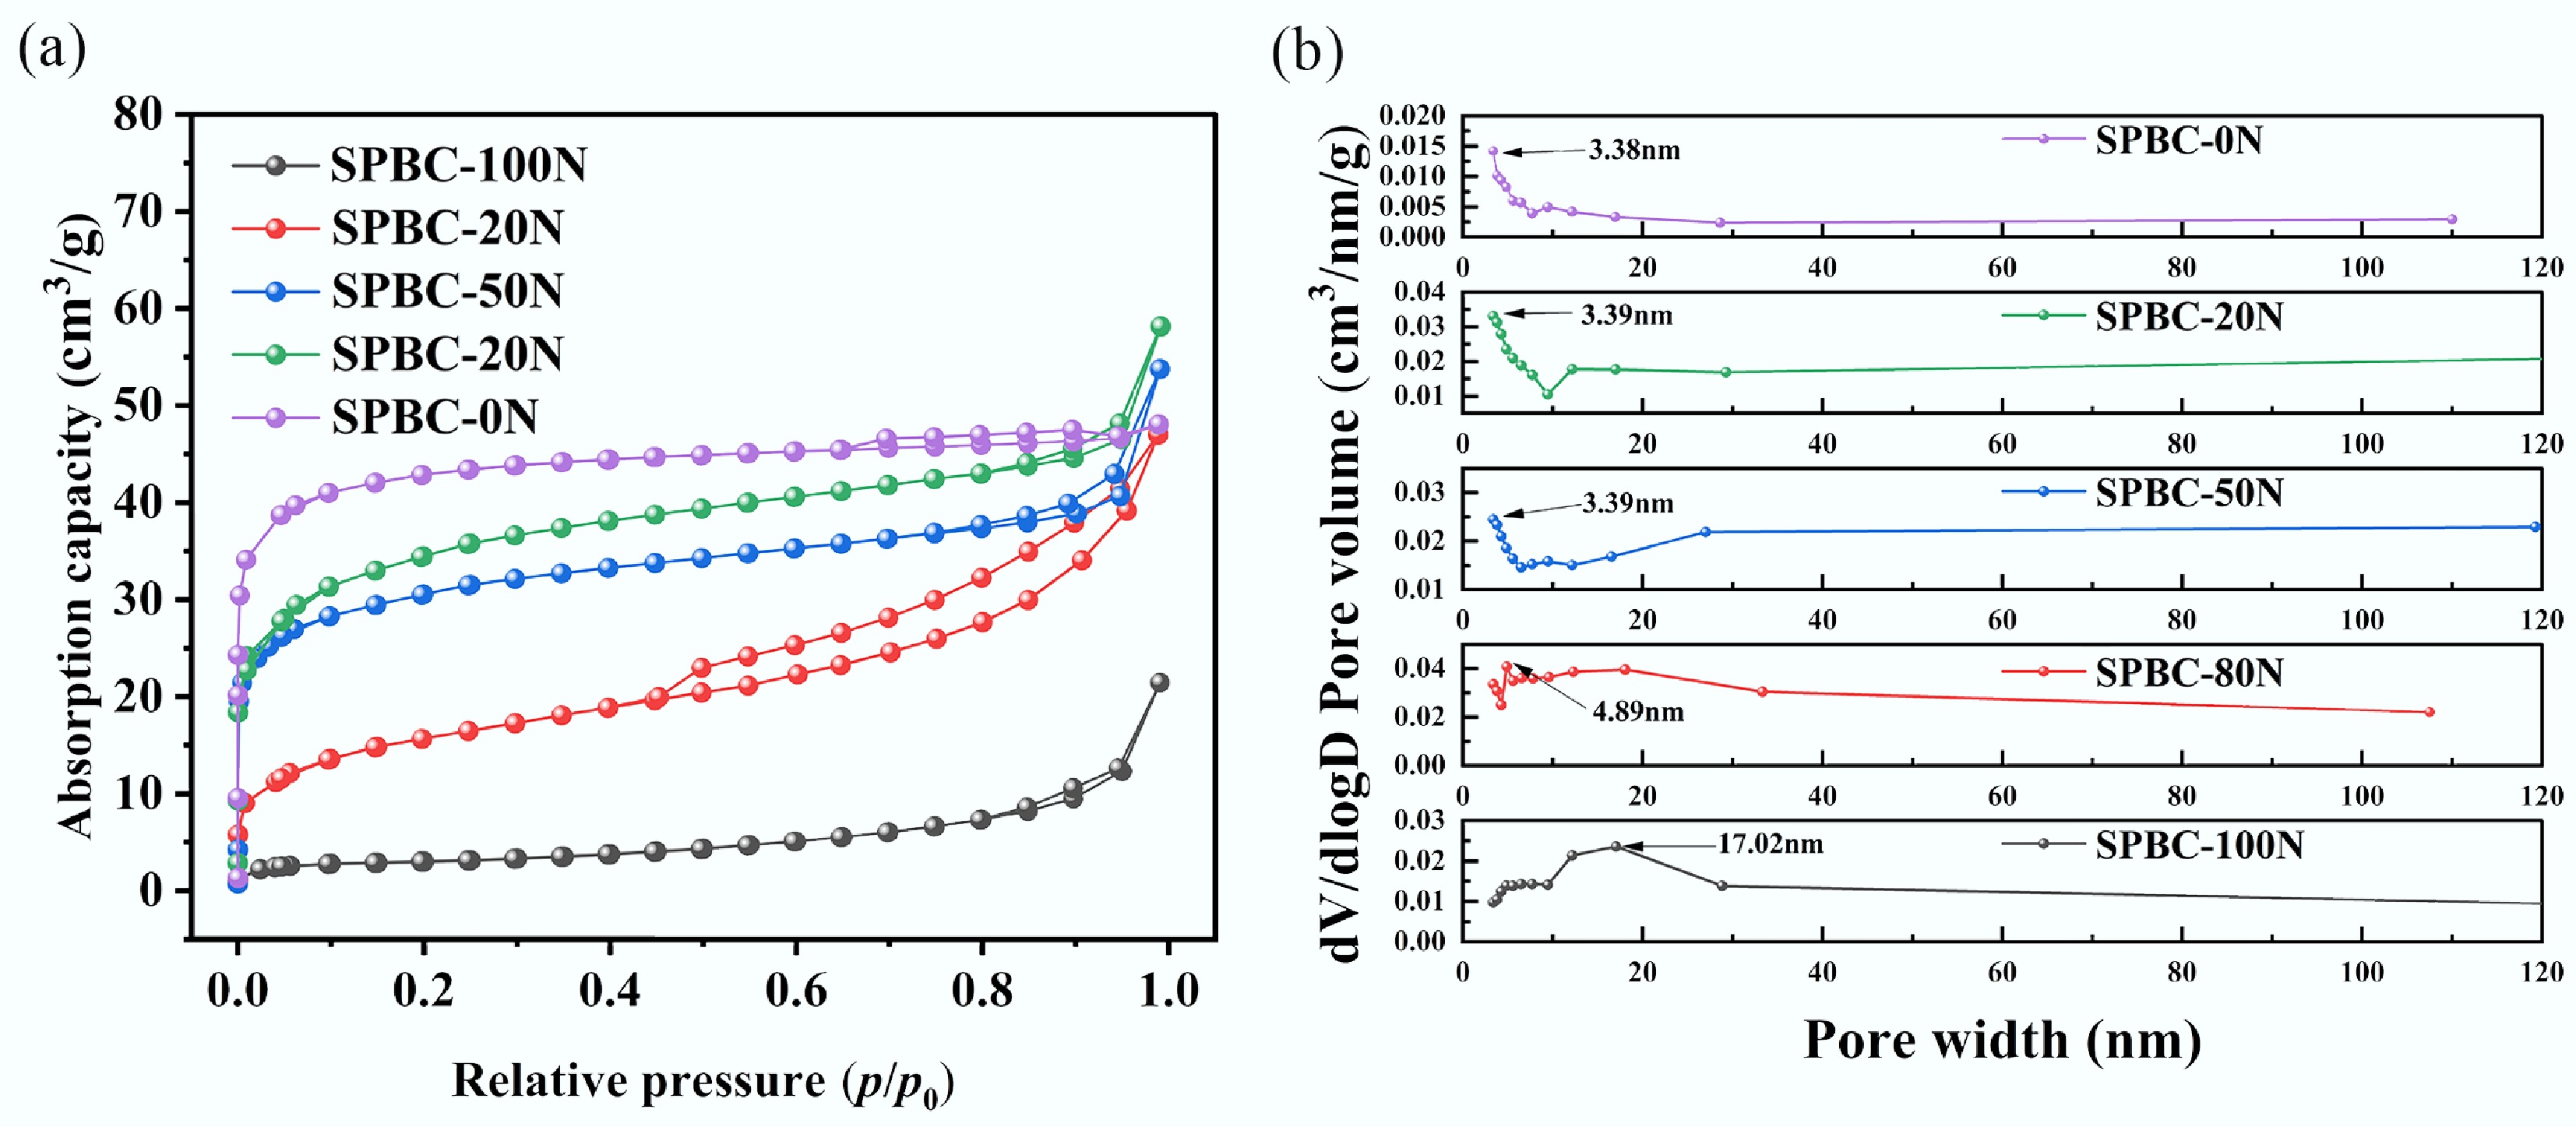
Figure 6.
Porous structure of biochar activated under varied CO2 flow rates. (a) N2 adsorption-desorption isotherm and (b) pore size distribution.
Table 6. Pore structure parameters of biochar activated under varied CO2 flow rates
Sample name SBET
(m2/g)Vtotal
(cm3/g)Vmic
(cm3/g)Vmes
(cm3/g)Vmes/Vtotal
(%)SBPC-100N 11.905 0.033 0.002 0.031 93.94 SBPC-80N 55.395 0.073 0.005 0.068 93.12 SBPC-50N 111.90 0.083 0.024 0.059 71.12 SBPC-20N 123.33 0.090 0.048 0.070 77.77 SBPC-0N 162.59 0.074 0.063 0.011 15.24 The porous structural properties (SBET, Vmic, Vmes, Vmes/Vtotal) of the five biochar samples (SBPC-100N, SBPC-80N, SBPC-50N, SBPC-20N, and SBPC-0N) are summarized in Table 6. With increasing CO2 flow rate, the SBET of the biochar increased continuously, reaching a maximum value of 162.59 m2/g for SBPC-0N at CO2 flow rate of 160 ccm. The Vmes/Vtotal ratios of the samples decreased from 93.94% to 15.24% as the CO2 flow rate increased, supporting the premise that mesoporous frameworks were progressively converted into micropores under intensified CO2 flow conditions.
RSM analysis
ANOVA and regression equations
-
Table 7 outlines the experimental conditions and corresponding outcomes. The data suggested that the combined interaction effects of the three factors collectively exerted an obvious influence on the response variable. Accordingly, a response surface model was developed to analyze the effects of individual factors and their pairwise interactions on the output responses.
Table 7. Experimental results of three-factor three-level design
No. Factors SBET
(m2/g)Mesoporosity
(%)Yield
(wt. %)A B C 1 750 30 80 376.12 65.45 18.96 2 850 30 80 413.41 66.92 18.48 3 750 90 80 604.24 57.93 16.21 4 850 90 80 657.34 54.46 16.02 5 750 60 40 742.70 57.57 17.68 6 850 60 40 834.96 57.42 17.11 7 750 60 120 503.67 68.12 14.81 8 850 60 120 527.33 67.54 14.57 9 800 30 40 673.36 62.39 19.03 10 800 90 40 763.34 49.41 16.03 11 800 30 120 341.94 68.27 16.17 12 800 90 120 703.64 55.91 13.51 13 800 60 80 1,138.33 42.52 15.15 14 800 60 80 1,120.66 40.88 15.07 15 800 60 80 1,106.28 40.36 15.21 16 800 60 80 1,108.07 40.27 15.26 17 800 60 80 1,095.74 39.47 15.23 A: the pyrolysis temperature, B: the KOH addition, C: the CO2 flow rate. Specific surface area analysis
-
To determine the optimal correlation between the factors and the response, three regression approaches—linear, two-factor interaction (2FI), and quadratic regression models—were comparatively assessed. The goodness-of-fit for each candidate model was evaluated based on the adjusted R2 values. As summarized in Supplementary Table S1, the quadratic model exhibited both a non-significant lack-of-fit (p > 0.0001), and an adjusted R2 of 0.9916. These metrics imply that the residual variability is largely attributable to random error, confirming the structural validity of the model. Consequently, the quadratic model was selected, and the corresponding regression equation for specific surface area is presented as Eq. (2).
The F-test, a statistical method for comparing variances across samples, was employed to assess the statistical significance of observed differences in sample statistics when inferring population parameters. In analysis of variance (ANOVA), the F-value and the p-value are derived from regression model tests to evaluate the effects of different factors and their interactions. The F-value quantifies the relative impact of these factors and their interactions, and p-value determines their statistical significance (p < 0.01: high significant; p < 0.05: significant).
$ \begin{aligned} {\text{S}}_{\text{BET}}=\;&\rm -74,307.6435+183.26560A+39.38778B+18.22586C\;+\\ &\rm 0.002635AB-0.008575AC+0.056608BC\;-\\ & \rm 0.11389A^2-0.35146B^{{2}}-0.11058C^2 \end{aligned} $ (2) As shown in Table 8, the ANOVA of the biochar specific surface area regression model. yielded an F-value of 227.29 and a p-value < 0.0001, confirming the quadratic model's appropriateness and high significance. This p-value (< 0.01%) indicates that the observed relationship is unlikely due to random error. For the quadratic regression equation, the p-values for linear terms (A, B, C), interaction term (BC), and quadratic terms (A2, B2, C2) were all < 0.05, denoting statistically significant coefficients. After removing non-significant terms, the revised regression equation is presented as Eq. (3).
Table 8. Analysis of variance table for specific surface area of biochar
Item Sum of squares Mean square F-value p-value Significance Model 1.23 × 10⁶ 1.37 × 10⁵ 227.29 < 0.0001 Highly significant A 5,320.48 5,320.48 8.82 0.0208 Significant B 1.07 × 10⁵ 1.07 × 10⁵ 176.85 < 0.0001 Highly significant C 1.10 × 10⁵ 1.10 × 10⁵ 182.27 < 0.0001 Highly significant AB 62.49 62.49 0.10 0.7569 Not significant AC 1,176.49 1,176.49 1.95 0.2052 Not significant BC 1.85 × 10⁵ 1.85 × 10⁵ 30.60 0.0009 Significant A2 3.41 × 10⁵ 3.41 × 10⁵ 565.96 < 0.0001 Highly significant B2 4.21 × 10⁵ 4.21 × 10⁵ 698.53 < 0.0001 Highly significant C2 1.32 × 10⁵ 1.32 × 10⁵ 218.55 < 0.0001 Highly significant Residual 4,221.75 603.11 / / / Lack-of-fit 3,157.43 1,052.48 3.96 0.1086 Not significant Absolute error 1,064.33 266.08 / / / Total 1.24 × 10⁶ / / / / $ \begin{aligned}\rm {{S}}_{{BET}}=\;&\rm -74,307.6435+183.26560A+39.38778B+18.22586C\;+\\ &\rm 0.056608BC-0.11389A^2-0.35146B^2-0.11058C^2 \end{aligned} $ (3) The lack-of-fit test is used to assess whether the model adequately fits the data or if significant factors are omitted. For this model, the lack-of-fit p-value is 0.0984 (> 0.05), indicating no statistically significant lack of fit. This confirms that the regression model provides a good fit to the experimental data, demonstrating satisfactory model adequacy.
Porosity analysis
-
The results of fitting mesoporosity data using different models are summarized in Supplementary Table S2. The quadratic regression equation for mesoporosity, derived from model fitting, is presented in Eq. (4).
$ \begin{aligned}Mesoporosity=\;&3,172.2275-7.68353{\rm A}-0.66200{\rm B}-0.84984{\rm C}\;-\\ &\rm 0.000823333{AB}-0.00005375{AC}+0.000129167{BC}\;+\\ & \rm 0.0048315{{A}}^{{2}}+0.00934583{{B}}^{{2}}+0.00617734{{C}}^{{2}} \end{aligned} $ (4) ANOVA was performed on the regression coefficients of each term in the equation, with results presented in Table 9. The regression model exhibits an F-value of 83.13 and a p-value < 0.0001, indicating that the quadratic function provides a statistically significant and an appropriate fit for the mesoporosity of biochar. The lack-of-fit p-value for this model is 0.1452 (> 0.05), further confirming no statistically significant lack of fit and validating the model's good fit. However, the p-values for factor A and the interaction terms (AB, AC, and BC) are all greater than 0.05, suggesting that their corresponding regression coefficients are not statistically significant. After removing these non-significant terms, the revised regression equation for mesoporosity is given in Eq. (5).
Table 9. Analysis of variance table for mesoporosity of biochar
Item Sum of
squaresMean
squareF-value p-value Significance Model 1,874.86 208.32 83.13 < 0.0001 Highly significant A 0.93 0.93 0.37 0.5613 Not significant B 256.74 256.74 102.45 < 0.0001 Highly significant C 136.54 136.54 54.49 0.0002 Highly significant AB 6.1 6.1 2.43 0.1627 Not significant AC 0.046 0.046 0.018 0.8958 Not significant BC 0.096 0.096 0.038 0.8503 Not significant A2 614.3 614.3 245.14 < 0.0001 Highly significant B2 297.89 297.89 118.87 < 0.0001 Highly significant C2 411.32 411.32 164.14 < 0.0001 Highly significant Residual 17.54 2.51 / / / Lack-of-fit 12.38 4.13 3.2 0.1452 Not significant Absolute error 5.16 1.29 / / / Total 1,892.4 / / / / $ \begin{aligned}Mesoporosity=\;&\rm 3,172.2275-0.66200{B}-0.84984{C}\;+\\ & \rm 0.0048315{{A}}^{{2}}+0.00934583{{B}}^{{2}}+0.00617734{{C}}^{{2}} \end{aligned} $ (5) Biochar yield analysis
-
The yield data fitting using different models are presented in Supplementary Table S3. The quadratic regression equation for biochar yield, derived from the model fitting, is provided in Eq. (6).
$ \begin{aligned}Yield=\;&\rm 300.511-0.679023{A}-0.24803{B}-0.052269{C}\;-\\ & \rm 010000483333AB-0.00004125{AC}+0.00007083337{BC}\;+\\ & \rm 0.0004182{{A}}^{2}+0.00132{{B}}^{2}-0.000116875{{C}}^{2} \end{aligned} $ (6) The variance table for yield model is shown in Supplementary Table S4. After removing these non-significant terms, the refined regression equation for yield is given by Eq. (7).
$ \begin{aligned}Yield=\;&\rm 300.511-0.67902{A}-0.24803{B}-0.052269{C}\;+\\ & \rm 0.0000708333{BC}+0.0004182{{A}}^{2}+0.00132{{B}}^{2}\;-\\&\rm 0.000116875{{C}}^{2} \end{aligned} $ (7) Data adequacy of models
-
The R2 value is a key metric for assessing model goodness-of-fit, where higher values indicate that predictors explain a larger proportion of variance in the response variable, reflecting superior model performance. As shown in Table 10, the model exhibits an R2 value of 0.9966 (≈1), demonstrating an excellent fit for the specific surface area model. Further analysis of model statistics reveals that the predicted R2 (0.9578), and the adjusted R2 (0.9922) are both close to 1, and show minimal discrepancy, suggesting robust model performance. Additionally, the signal-to-noise ratio of 42.148 is much greater than 4, confirming adequate signal strength for reliable predictions.
Table 10. Coefficient analysis table of specific surface area for biochar.
R2 Adjusted R2 Predicted R2 Signal-to-noise ratio 0.9966 0.9922 0.9578 42.148 Optimization of porous carbon
Specific surface area analysis
-
As shown in Fig. 7, the data from Table 8 were used to generate response surface plots and contour maps based on the fitted equation. These visualizations clearly depict the effects of the experimental factors and their pairwise interactions on the specific surface area. The three-dimensional response surface plot illustrates the relationship between the three factors and the specific surface area, demonstrating the relative influence of each factor.
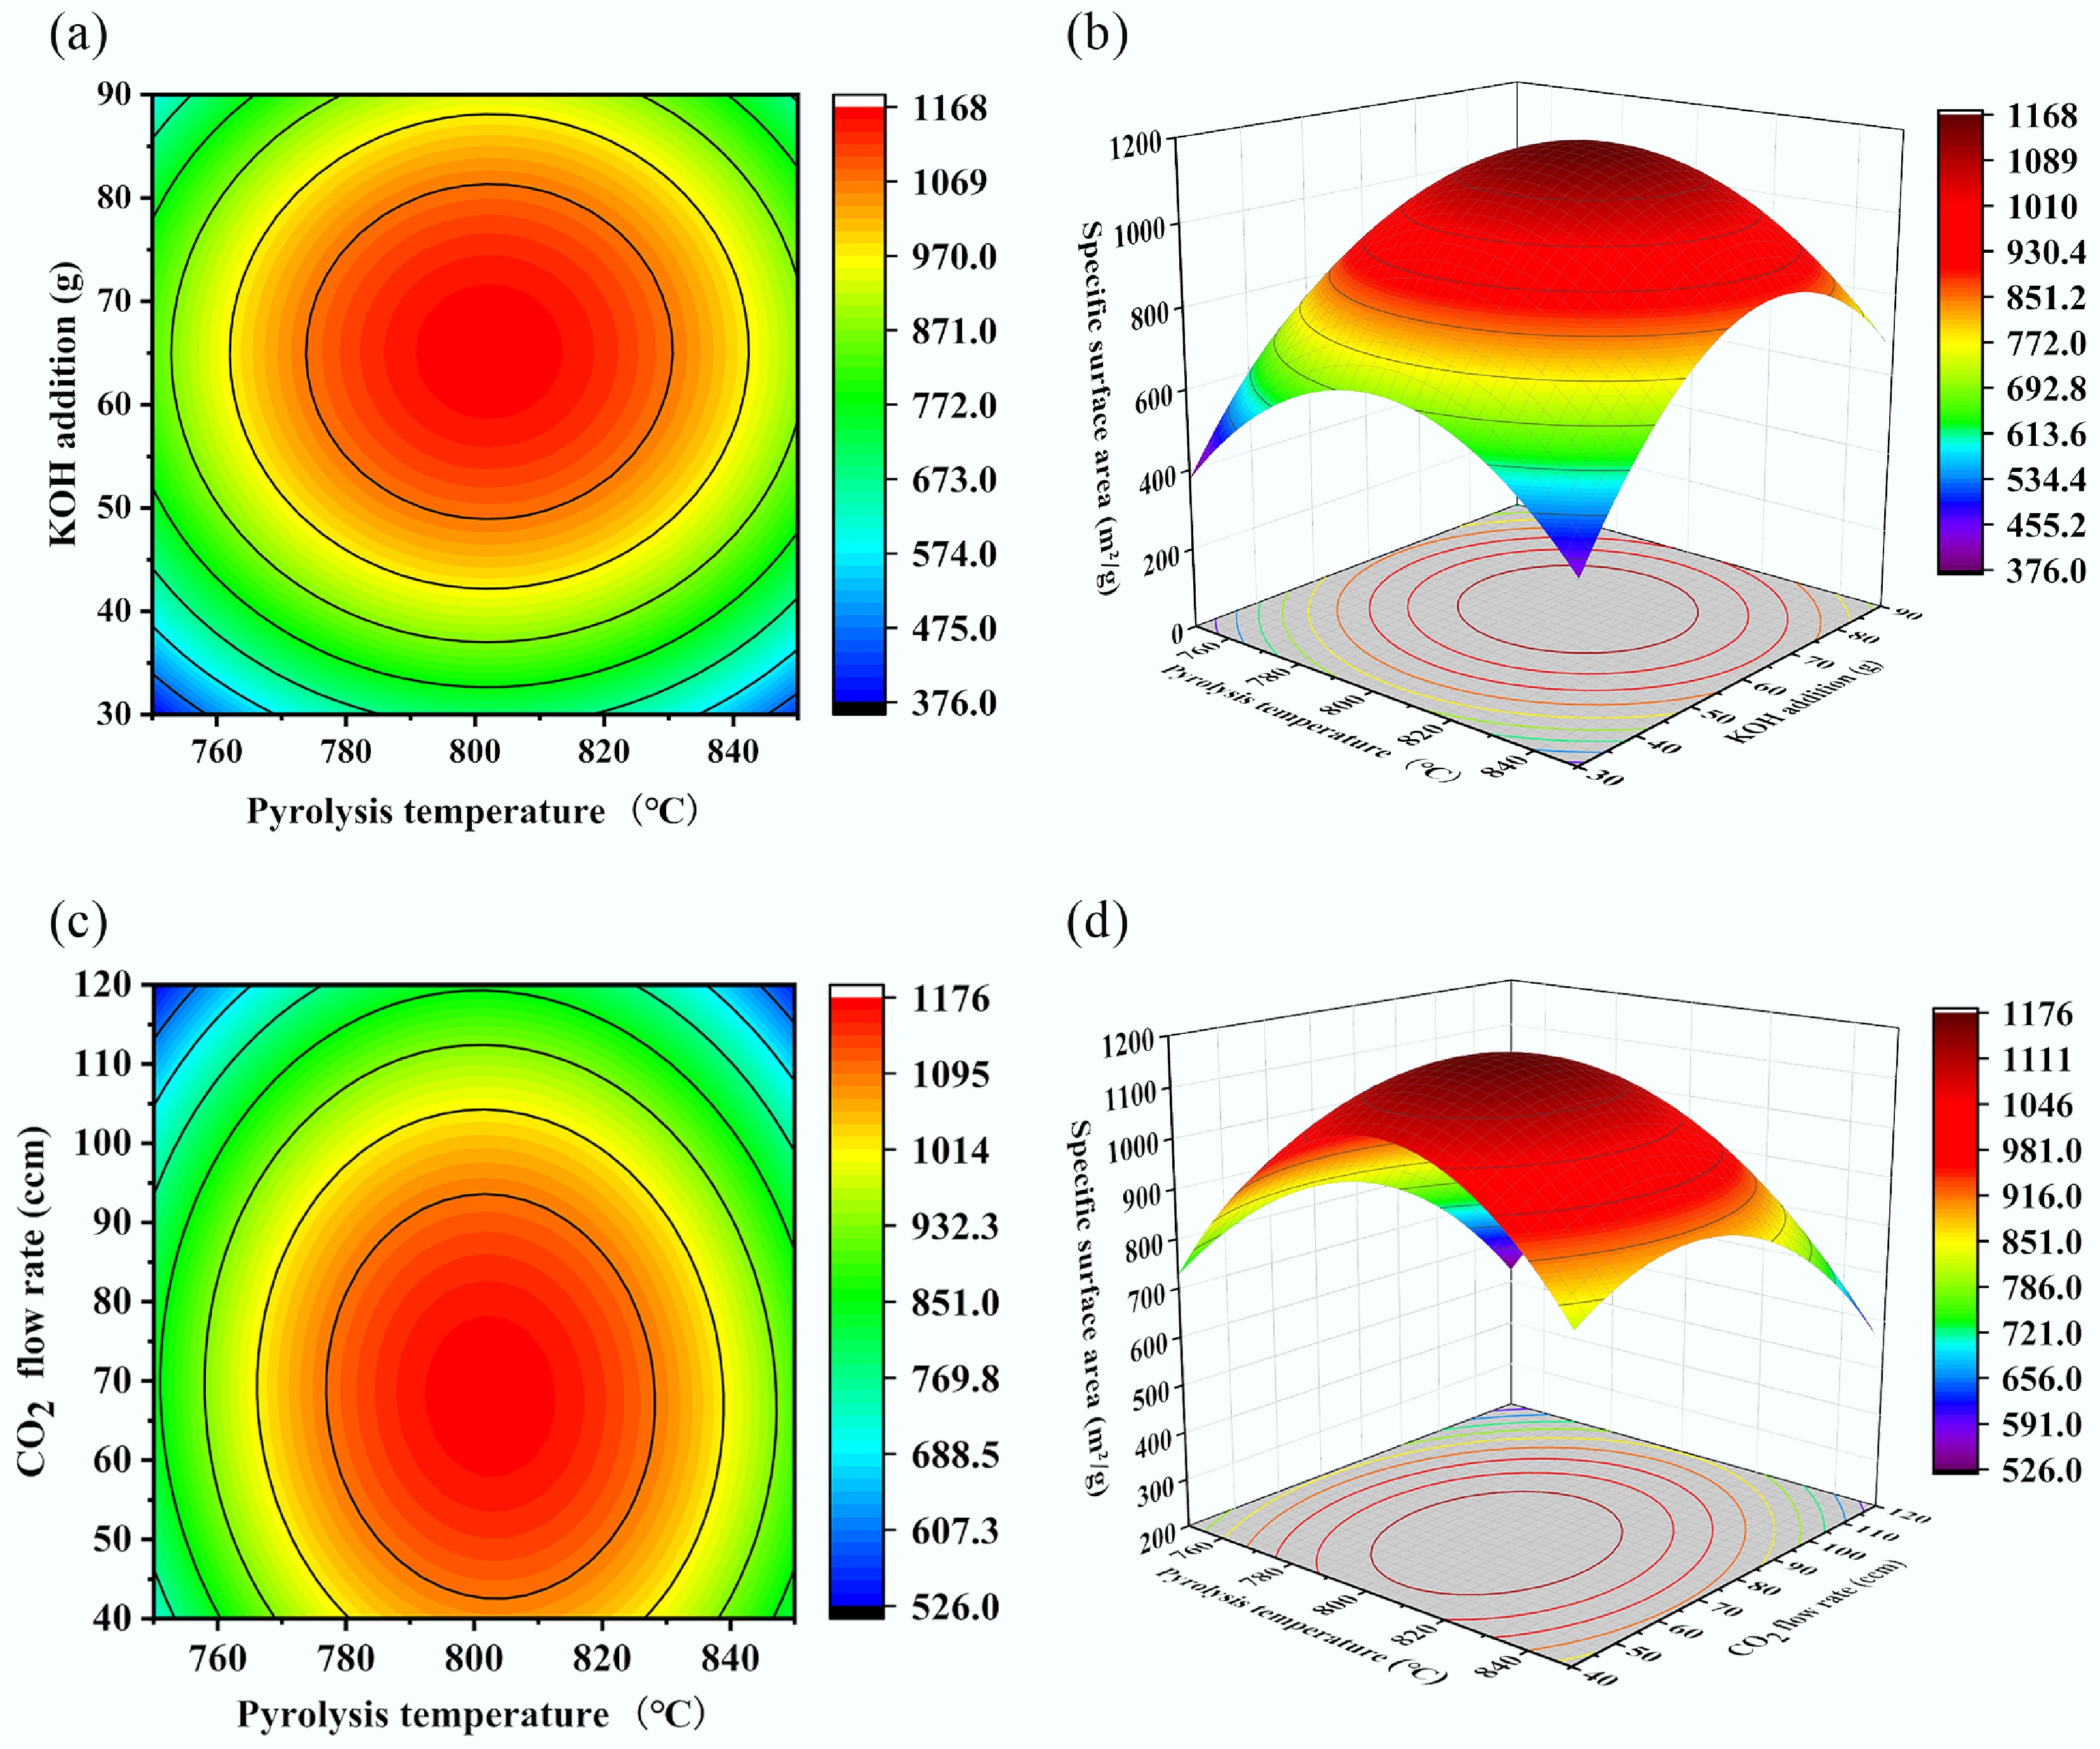
Figure 7.
Contour plots and response surface plots of specific surface area versus different parameters. (a) Pyrolysis temperature-KOH addition contour plot, (b) pyrolysis temperature-KOH addition response surface plot, (c) pyrolysis temperature-CO2 flow rate contour plot, and (d) pyrolysis temperature-CO2 flow rate response surface plot.
In the contour and response surface plots, the color gradient visually represents the magnitude of the response variable. Darker colors on both the three-dimensional surface and contour lines indicate a higher specific surface area of the biochar. In the contour plot, more densely spaced contour lines signify a stronger influence of the corresponding factor on the response variable. In the surface plot, data points positioned above the response surface indicate that the observed value exceeds the predicted value, while points below the surface indicates the predicted value exceeds is greater than the observed value.
As shown in Fig. 7a and b, when the CO2 flow rate was maintained at an intermediate level of 80 ccm, both pyrolysis temperature and KOH addition influenced the specific surface area of the biochar. Excessively high pyrolysis temperatures and KOH additions resulted in a reduction in specific surface area, indicating adverse effects. The specific surface area initially increased and then decreased with increasing KOH addition, and such a trend was also observed with increasing pyrolysis temperature. This phenomenon may be attributed to the reaction between excess CO2 and KOH at elevated temperatures, which diminished the etching effect on the biochar. When the pyrolysis temperature was held at 800 °C and the amount of KOH addition exceeded 60 g, the specific surface area decreased from 1,113.6 to 912.17 m2/g. Similarly, when the amount of KOH addition was fixed at 60 g, and pyrolysis temperature rose above 800 °C, the specific surface area declined from 1,113.6 to 870.96 m2/g. The less steep slope of the response surface for pyrolysis temperature, compared to that for KOH addition, indicated that pyrolysis temperature had a less pronounced effect on the specific surface area than KOH addition.
As shown in Fig. 7c and d, when the amount of KOH addition was held constant at 60 g, the specific surface area of the biochar initially increased and then decreased with rising pyrolysis temperature and CO2 flow rate, resulting in a maximum on the response surface. Analysis of the surface steepness indicated that the CO2 flow rate exerted a greater influence on the specific surface area, while the pyrolysis temperature had a relatively minor effect. The response surface plots illustrating the effects of KOH addition amount and CO2 flow rate on the specific surface area are summarized in Supplementary Fig. S1.
Overall, among these three factors, KOH addition had the most significant impact on the specific surface area of the biochar, followed by the CO2 flow rate, with pyrolysis temperature having the least effect. This is because KOH and CO2 can directly react with the char produced during pyrolysis, thereby significantly enhancing its specific surface area.
Furthermore, the three contour plots indicated that when each factor was set to its intermediate level, the specific surface area was positioned near the center of the contours and corresponded to the darkest region on the response surface, though it did not reach its maximum value. The fitted equation was solved to determine the optimal experimental conditions through response surface optimization: a pyrolysis temperature of 802.77 °C, KOH addition of 64.5 g, and CO2 flow rate of 67.81 cm3/min. Under these conditions, the predicted specific surface area of the biochar was 1,140.34 m2/g. Experimental validation under the optimized conditions yielded an actual specific surface area of 1,156.37 m2/g, with a deviation of only 1.39% from the predicted value. This close agreement further validates the accuracy and reliability of the proposed response surface model.
Porosity analysis
-
The data in Table 9 were processed to generate response surface plots and contour maps of the fitted equation, as shown in Fig. 8. Figure 8a, b reveals that when the CO2 flow rate was maintained at an intermediate level of 80 ccm, both the pyrolysis temperature and KOH addition influenced the mesoporosity of the biochar. Excessively high pyrolysis temperatures and a high amount of KOH additions led to decreased mesoporosity. The mesoporosity of the biochar initially decreased and then increased with increasing KOH addition, and a similar trend was observed with increasing pyrolysis temperature. This phenomenon may be attributed to excess KOH promoting the reaction with CO2, thereby accelerating the consumption of both reagents and diminishing the etching effect on the biochar. The steeper slope of the response surface for KOH addition, compared to that for pyrolysis temperature indicates that the pyrolysis temperature had a relatively minor influence on mesoporosity.
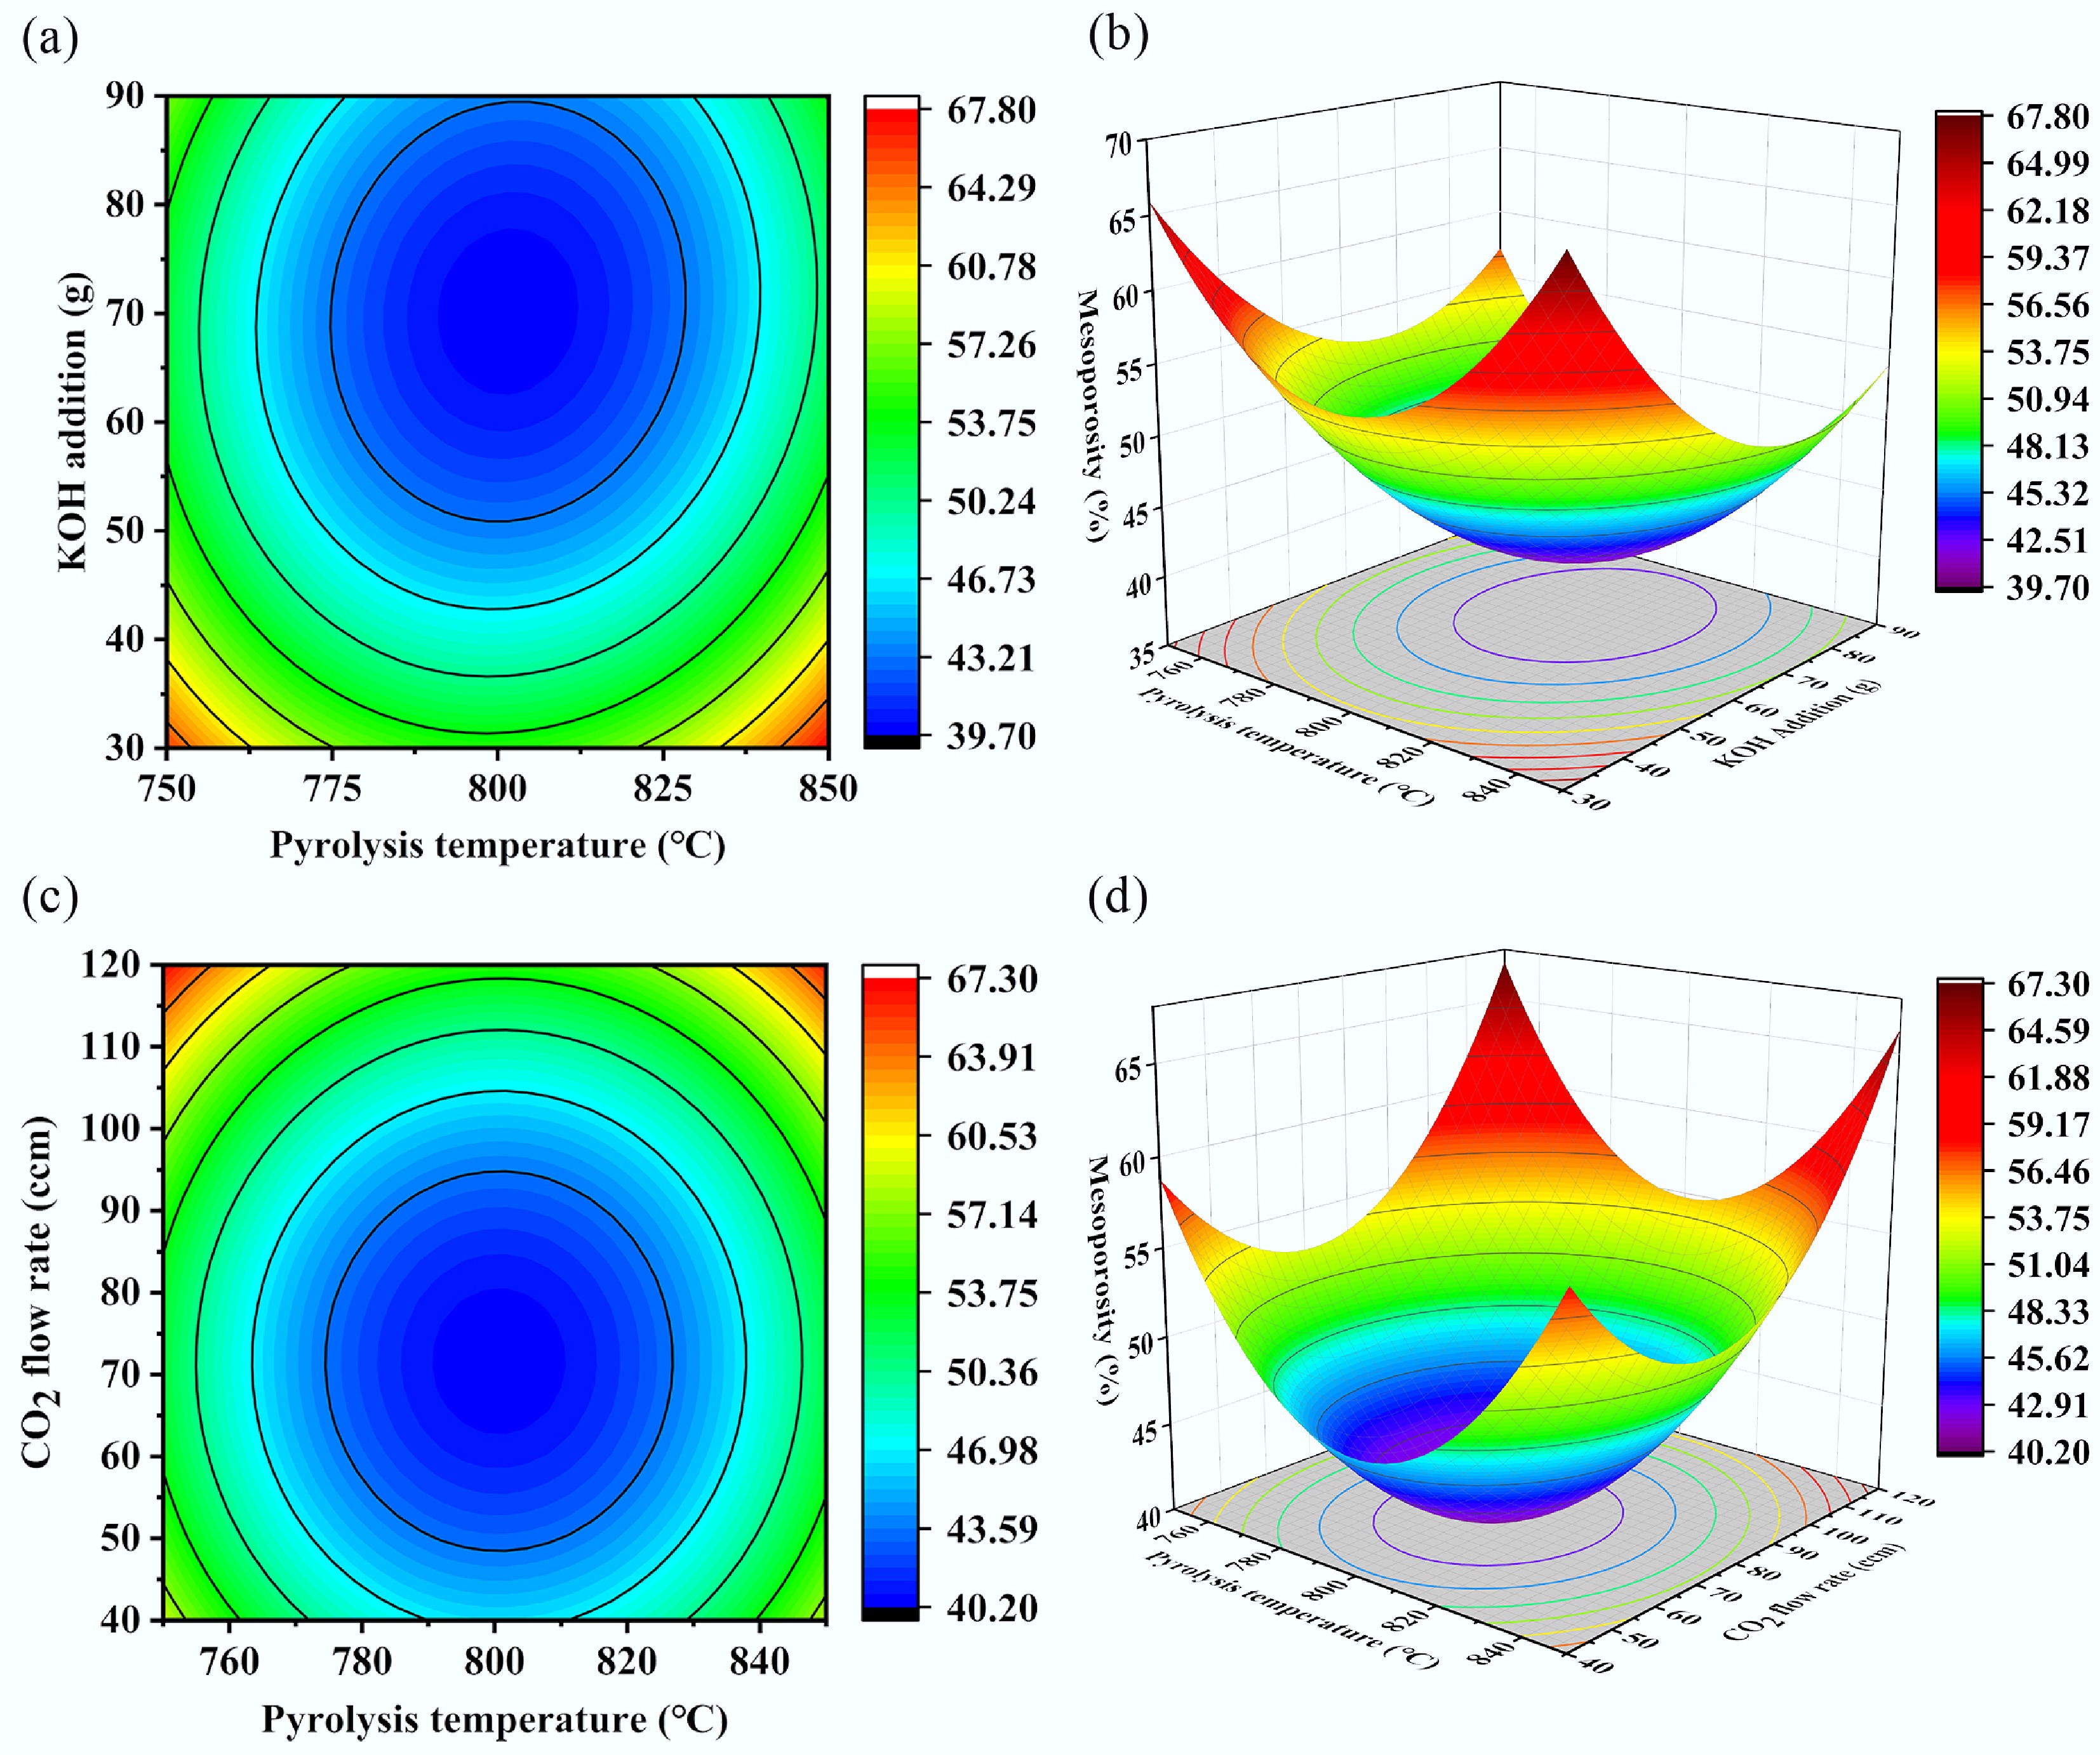
Figure 8.
Contour plots and response surface plots of mesoporosity versus different influencing factors. (a) Pyrolysis temperature-KOH addition contour plot, (b) pyrolysis temperature-KOH addition response surface plot, (c) pyrolysis temperature-CO2 flow rate contour plot, and (d) pyrolysis temperature-CO2 flow rate response surface plot.
As shown in Fig. 8c and d, when the KOH addition was held constant at 60 g, the mesoporosity of the biochar initially decreased and subsequently increased with rising pyrolysis temperature and CO2 flow rate. Analysis of the surface steepness revealed that the CO2 flow rate exerted a greater influence on mesoporosity compared to pyrolysis temperature, which had a relatively minor effect. In summary, among the three factors affecting mesoporosity, KOH addition had the most significant impact, followed by the CO2 flow rate, while the pyrolysis temperature had the least effect. This is attributed to the direct participation of KOH and CO2 in reacting with the char produced during pyrolysis, actively contributing to pore creation and expansion, thereby directly influencing the pore structure. The response surface plots illustrating the effects of KOH addition amount and CO2 flow rate on the mesoporosity are summarized in Supplementary Fig. S2.
Biochar yield analysis
-
Experimental data on biochar yield under various operating conditions were processed to generate response surface plots and contour maps of the fitted equation, as depicted in Fig. 9. Figure 9a, b demonstrates that the biochar yield initially decreased with increasing pyrolysis temperature due to dehydration and volatilization of volatile matter at elevated temperatures. Concurrently, cellulose, hemicellulose, and lignin undergo thermal decomposition, driving off a substantial proportion of light components as gases or tars, and continuously reducing the relative proportion of solid char residues. However, as the temperature rises further, small gaseous molecules generated from pyrolysis, undergo secondary polymerization reactions at high temperatures, leading to the reformation of solid carbon. While KOH, as an activating agent, etches and gasifies the carbon structure during pyrolysis—consuming a substantial amount of carbon and thereby reducing yield as its addition increases—excess KOH can remain in the biochar as potassium salts, which directly contribute to the mass of the solid product. The steeper slope of the response surface for the KOH addition compared to pyrolysis temperature, indicated that the pyrolysis temperature had a relatively minor influence on biochar yield. The response surface plots illustrating the effects of KOH addition amount and CO2 flow rate, as well as heating temperature and CO2 flow rate, on the yield are summarized in Supplementary Fig. S3.
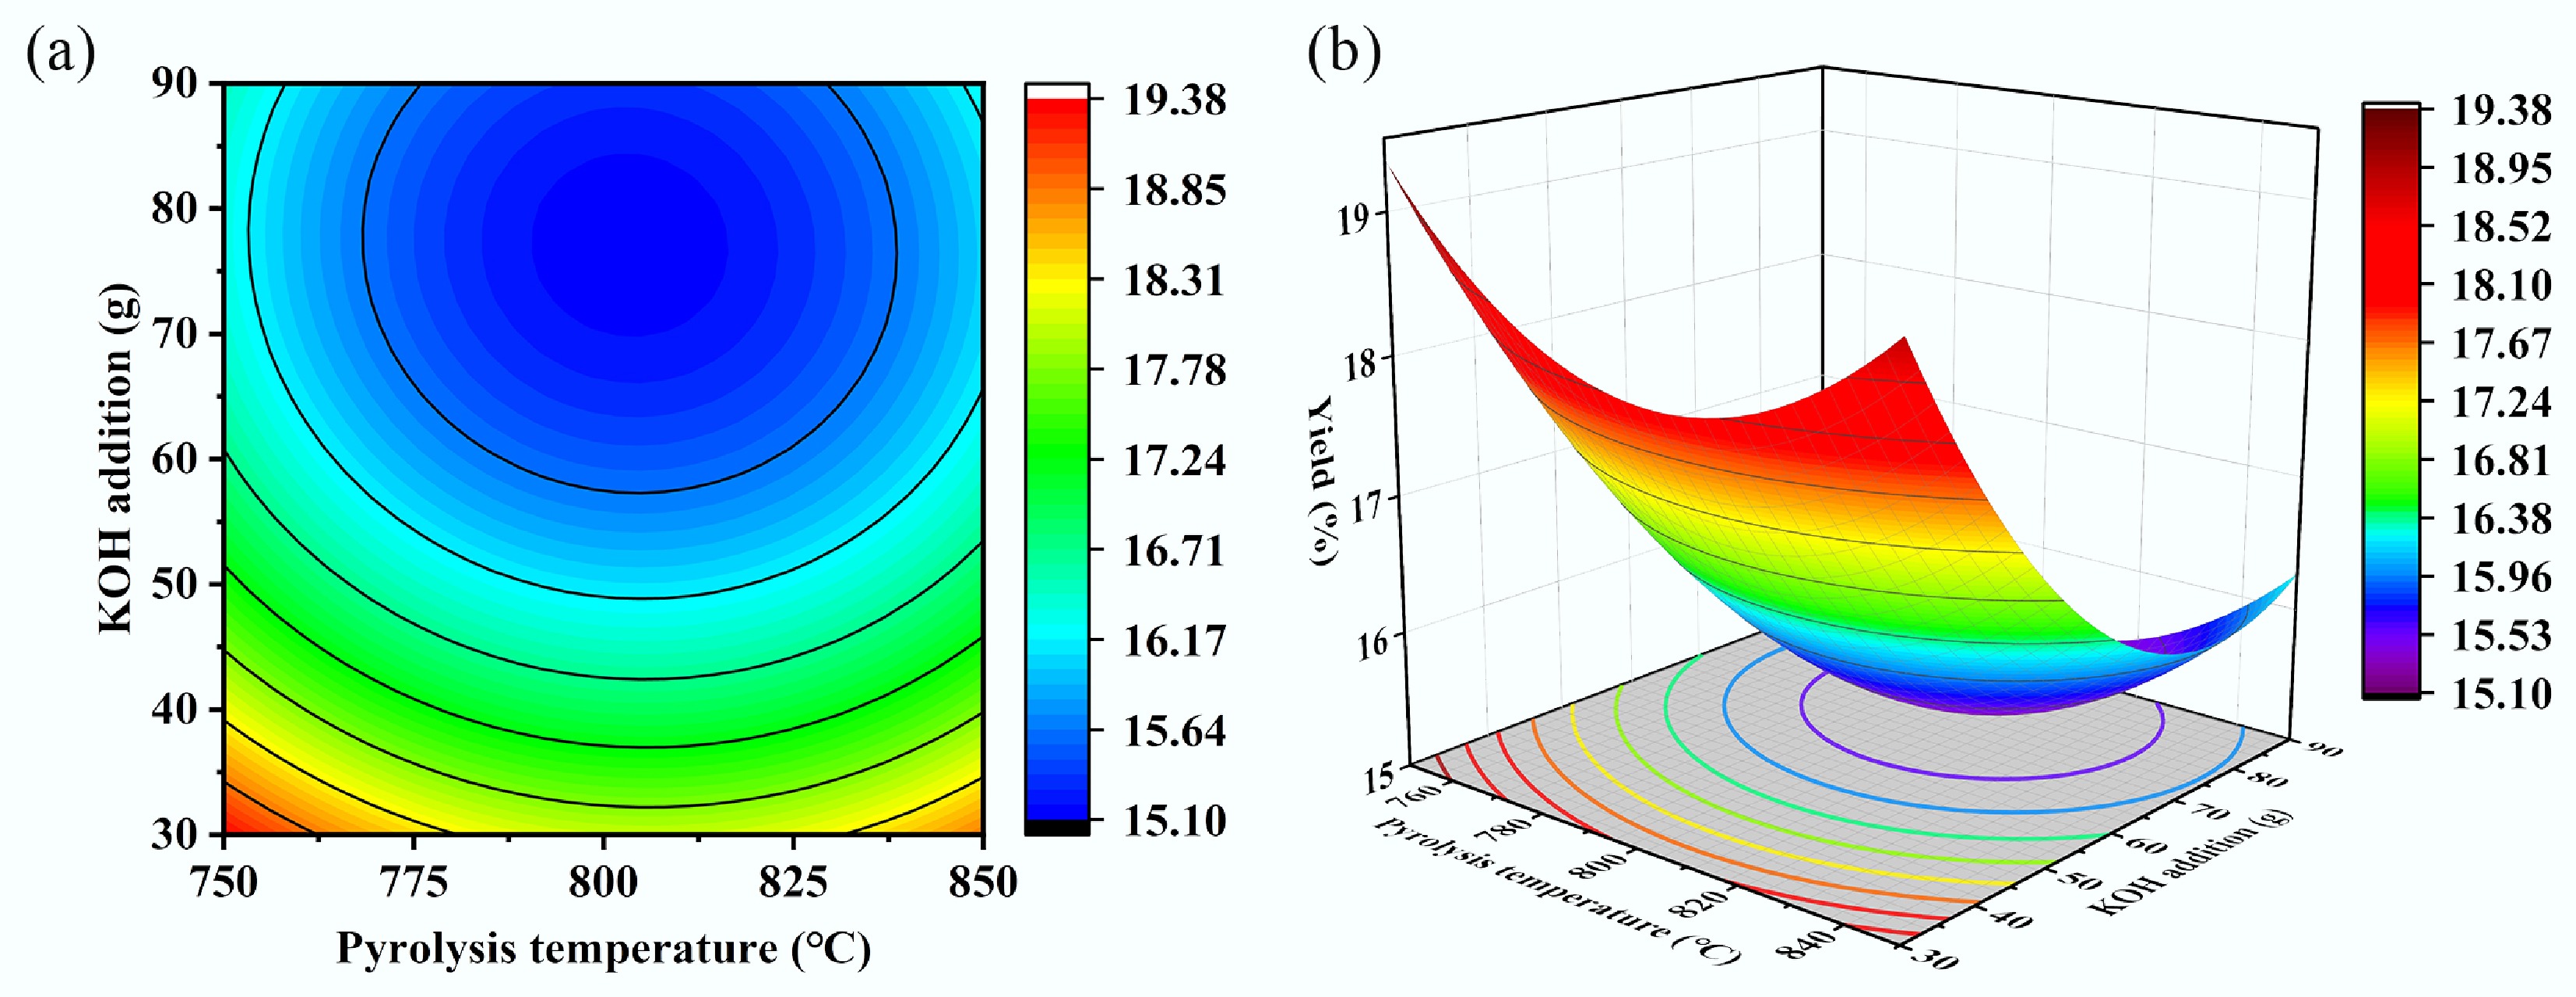
Figure 9.
Contour plots and response surface plots of biochar yield vs different parameters. (a) Pyrolysis temperature-KOH addition contour plot, (b) pyrolysis temperature-KOH addition response surface plot.
The degree of influence of the three factors on biochar yield was ranked as follows: KOH addition > CO2 flow rate > pyrolysis temperature. When the optimal conditions for maximizing specific surface area—namely, a pyrolysis temperature of 802.77 °C, KOH addition of 64.5 g, and a CO2 flow rate of 67.81 ccm—were applied, the biochar yield was minimized to 10.64%, indicating an inverse relationship between specific surface area and biochar yield. Under conditions of elevated temperature, or in the presence of activating agents (e.g., CO2, steam, KOH), pyrolysis transitions beyond the mere release of volatiles. The fixed carbon constituting the biochar skeleton undergoes gasification reactions with these agents, directly consuming solid carbon and effectively 'etching' carbon atoms away from the solid matrix into gaseous products. Consequently, this process reduces biochar yield while simultaneously enlarging micropores and mesopores within the biochar. As the reaction proceeds, existing pore walls may be opened, and new pores are created, leading to a substantial increase in specific surface area. Therefore, a higher specific surface area is generally achieved at the expense of lower char yield.
To validate the accuracy of the model, the validation conditions from the previous section were substituted into the model equation, yielding a predicted mesoporosity of 39.14% for the biochar. Experiments conducted under these conditions resulted in an actual mesoporosity of 39.52%, with a deviation of only 0.97% from the predicted value. This minimal discrepancy further confirms the accuracy and reliability of the model. For bagasse as the raw material, the minimum mesoporosity (39.29%) was achieved under the following experimental conditions: pyrolysis temperature of 801.53 °C, KOH addition of 70.23 g, and CO2 flow rate of 71.54 ccm.
Future research directions
-
Currently, there is insufficient evidence regarding the specific manifestations of thermal vs non-thermal effects of microwave irradiation. Since thermal and non-thermal effects typically occur simultaneously, they are exceedingly difficult to distinguish accurately. Numerous studies have reported findings related to these effects, resulting in three prevailing viewpoints: (1) microwave irradiation cannot destroy chemical bonds[31]; (2) the non-thermal effect is difficult to observe experimentally[32]; and (3) the non-thermal effect occurs only under specific conditions[33]. Furthermore, the sequence in which thermal and non-thermal effects appear during microwave heating remains a subject of ongoing debate. Some researchers argue that these effects emerge simultaneously, with the non-thermal effect having only a minor impact on microwave-assisted chemical reactions[34]. In conclusion, given the limitations of current experimental conditions, it is challenging to fully investigate the influence of microwave thermal and non-thermal effects on biochar. This issue will be explored in future research.
-
This study employed RSM to investigate the effects of pyrolysis temperature and CO2 flow rate, and to optimize the specific surface area, porosity, and biochar yield. The main findings are summarized as follows:
(1) The relative influence of the three parameters on the specific surface area, mesopore ratio, and yield of biochar were determined as follows: KOH addition > CO2 flow rate > pyrolysis temperature.
(2) Three regression equations were developed for predicting the specific surface area, mesopore ratio index, and yield of biochar, with adjusted R2 values all exceeded 0.98, indicating high predictive accuracy.
(3) A maximum specific surface area of 1,156.37 m2/g was achieved under the following optimal conditions: pyrolysis temperature of 802.77 °C, KOH addition of 64.5 g, and CO2 flow rate of 67.81 ccm.
(4) A minimum mesoporosity of 39.29% was obtained at a pyrolysis temperature of 801.53 °C, KOH addition of 70.23 g, and CO2 flow rate of 71.54 cm3/min.
The findings offer valuable theoretical guidance and practical insights for the targeted preparation of biochar with a high specific surface area. The optimized biochar demonstrates great potential for environmental remediation and energy storage applications. Moreover, the methodology presents a generalizable approach for the rational design and scalable production of advanced porous carbon materials.
-
It accompanies this paper at: https://doi.org/10.48130/scm-0025-0014.
-
The authors confirm their contributions to the paper as follows: Study conceptualization, manuscript writing, reviewing, and editing were conducted by Weitao Cao. Haoyang Jing worked on the investigation and writing − original draft preparation. Some investigation and manuscript reviewing works were carried out by Demoz Teklil Araya. Wenke Zhao supervised the whole work, and improved the manuscript. All authors reviewed the results and approved the final version of the manuscript.
-
The datasets used or analyzed during the current study are available from the corresponding author upon reasonable request.
-
The authors are grateful for the financial support from the National Natural Science Foundation of China (Grant Nos 52506009, 52076049), Heilongjiang Province 'Double First-class' Discipline Collaborative Innovation Achievement Project (Grant No. LJGXCG2023-080), Heilongjiang Provincial Key R&D Program 'Unveiling the Leader' Project (Grant No. 2023ZXJ02C04), and the Postdoctoral Fund in Heilongjiang Province (Grant No. LBH-Z22115).
-
The authors declare that they have no known competing financial interests or personal relationships that could have appeared to influence the work reported in this paper.
-
A microwave pyrolysis system for sugarcane bagasse biochar was constructed.
The relative impacts of KOH addition, CO2 flow rate, and pyrolysis temperature were ranked.
Three regression equations were established for specific surface area, mesoposity, and yield.
Optimal parameter combinations were identified to enhance specific surface area and mesoposity.
-
Full list of author information is available at the end of the article.
- The supplementary files can be downloaded from here.
- Copyright: © 2026 by the author(s). Published by Maximum Academic Press, Fayetteville, GA. This article is an open access article distributed under Creative Commons Attribution License (CC BY 4.0), visit https://creativecommons.org/licenses/by/4.0/.
-
About this article
Cite this article
Cao W, Jing H, Araya DT, Zhao WK. 2026. Optimization of microwave-assisted pyrolysis parameters for sugarcane bagasse biochar using response surface methodology. Sustainable Carbon Materials 2: e003 doi: 10.48130/scm-0025-0014 

Optimization of microwave-assisted pyrolysis parameters for sugarcane bagasse biochar using response surface methodology
- Received: 01 November 2025
- Revised: 06 December 2025
- Accepted: 19 December 2025
- Published online: 20 January 2026
Abstract: Microwave-assisted pyrolysis is an efficient biomass conversion technology that enables uniform and rapid heating for biochar production. In this study, a microwave-assisted pyrolysis system was developed to produce bagasse biochar and examine the effects of pyrolysis temperature and CO2 flow rate on its surface morphology and structural characteristics. Based on extensive experimental data, response surface methodology (RSM) was applied to establish empirical correlations among microwave energy input, material structural evolution, and the specific surface area and mesopore ratio of biochar. The results revealed that potassium hydroxide (KOH) addition exerted the most influence on the specific surface area, mesopore ratio, and yield of carbon, followed by CO2 flow rate and pyrolysis temperature. Regression models were subsequently constructed to predict these parameters. Under optimal conditions (pyrolysis temperature: 802.77 °C, KOH addition: 64.5 g, and CO2 flow rate: 67.81 cm3/min), the specific surface area of carbon reached a maximum value of 1,156.37 m3/g. Under another set of conditions (pyrolysis temperature: 801.53 °C, KOH addition: 70.23 g, and CO2 flow rate: 71.54 cm3/min), the mesopore ratio of carbon was minimized to 39.29%. These findings provide valuable guidance for the optimization of microwave-assisted synthesis of coconut-shell biochar in subsequent research.