


-
Mosquito-borne viruses like Chikungunya virus (CHIKV) have become a serious problem to global population health because of the high pace of international commerce and human migration, which have contributed to their domestic incidence and cross-border transmission[1,2]. As a result, human and vector infections related to these pathogens have been increasingly documented over recent years[3,4]. In July 2025, China (Guangdong province) registered about 6,000 cases of CHIKV infection[5]. CHIKV infection usually manifests as an acute febrile disease with severe joint pain; sometimes, this disease can develop into chronic and disabling inflammatory rheumatism, which severely affects the quality of the patients' life[6,7]. Thus, the creation of rapid, sensitive, and portable diagnostic kits plays a significant role in successful infection control, epidemiological monitoring, and evidence-based clinical care.
The analysis of intrinsic gene sequences offers greater accuracy than the analysis of viral surface glycoproteins and can be used to accurately distinguish viral variants and track transmission chains[8]. Mosquito-borne viruses belong to a type of single-strand RNA viruses[9,10], so the commonly used nucleic acid detection assays include reverse transcription-polymerase chain reaction (RT-PCR)[11−13], reverse transcription-loop-mediated isothermal amplification (RT-LAMP)[14−16], rolling circle amplification (RCA)[17,18], and clustered regularly interspaced short palindromic repeat (CRISPR)/CRISPR-associated protein 9 (Cas9)[19−21] amplification, etc. Though these methods show excellent sensitivity in detecting viruses, most of them are dependent on bioenzymes and equipment, which cannot be used in on-site testing conditions. Catalytic hairpin assembly (CHA) is one of the effective and efficient isothermal amplification methods that can specifically detect various targets including nucleic acids, proteins, metal ions, and cells[22−25]. In addition, the lateral flow immunoassay (LFIA) is a strip-based platform used for on-site testing[26−28]. Earlier studies have integrated CHA with LFIA to accomplish rapid viral detection, primarily using target-triggered probes to produce large amounts of double-stranded hybridization products[29−32]. These methods usually modify biomolecules (such as biotin or digoxin) at the ends of products, which enables the products to bridge the colorimetric probes and capture probes (e.g., streptavidin or anti-digoxin antibodies) on the test line (T line) to form a visual signal[33,34]. However, their detection efficiency is restricted by the limited bridging sites on the product, which consequently degrades the detection performance (Fig. 1a). Hence, enhancing the efficiency of bridging is a valuable but unexplored problem.
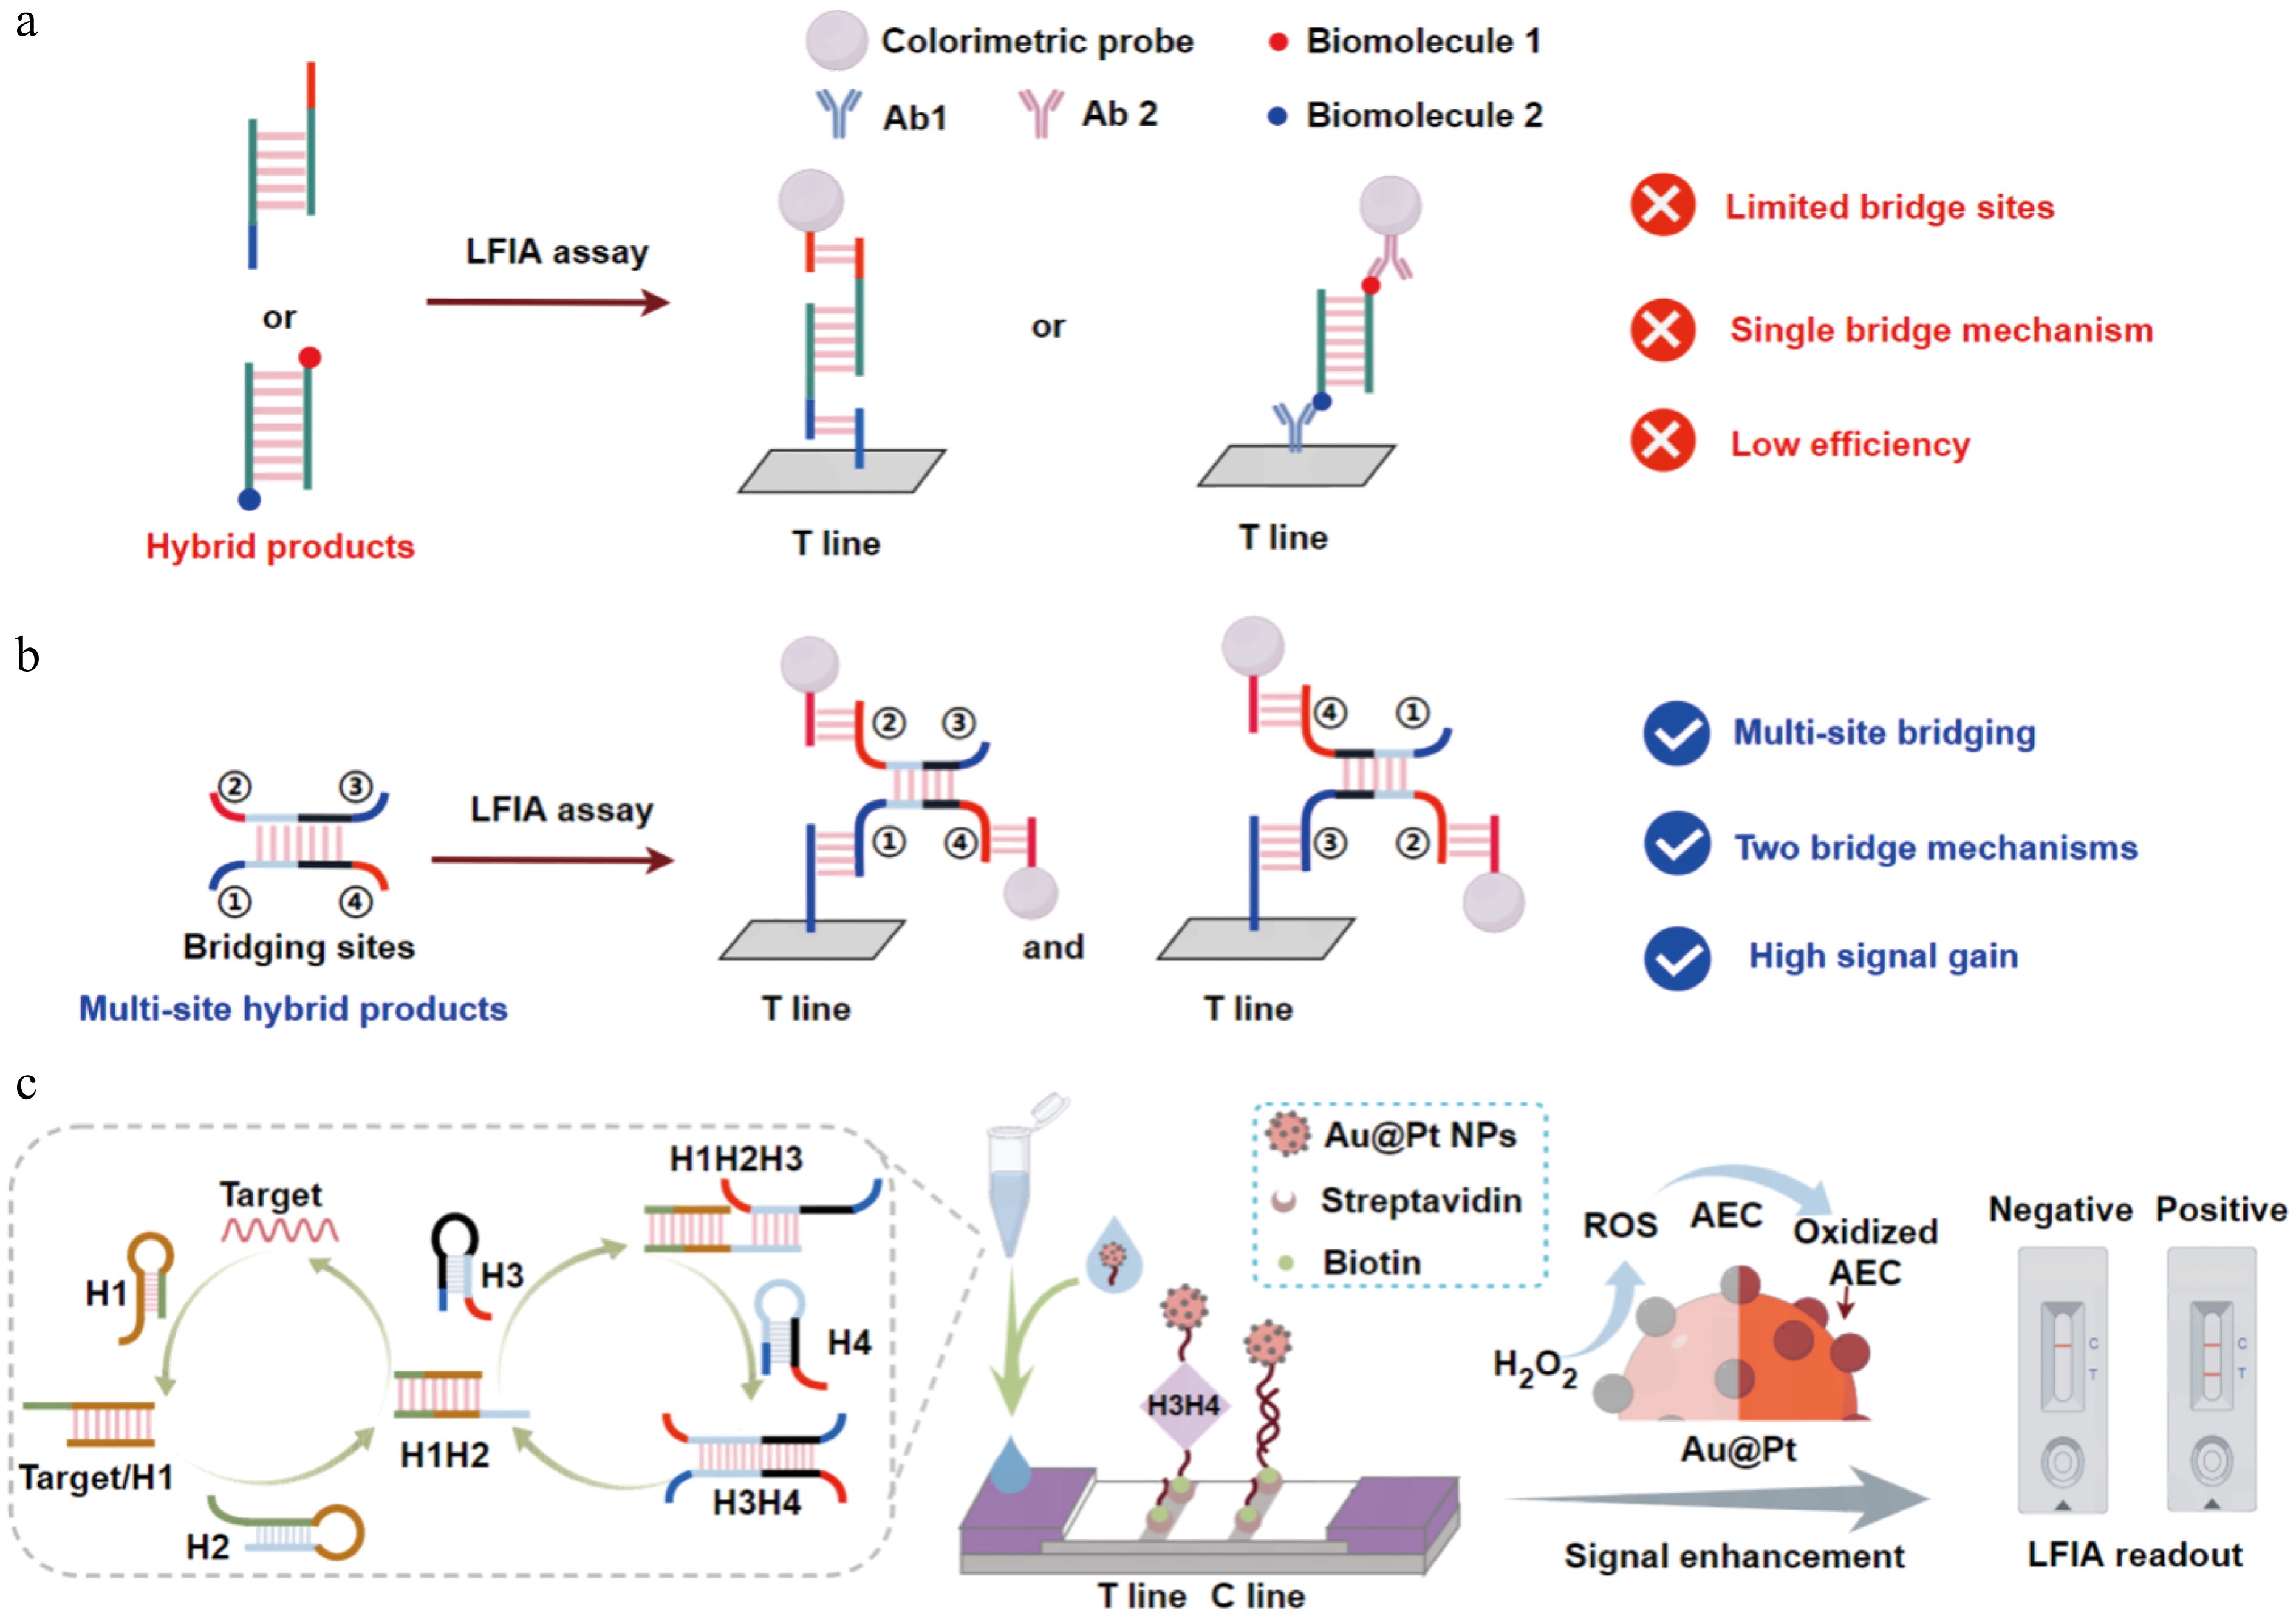
Figure 1.
Detection system of mbLFIA. (a) Hybridization products of the previous bioenzyme-free nucleic acid amplification used in the LFIA-integrated system. (b) Multisite bridging structure used in the LFIA-integrated system. When sites ② and ④ of the structure bind the colorimetric probe, it can bridge the capture probe via site ① or site ③. (c) The mbLFIA was used for the detection of mosquito-borne viruses. After two cycles of CHA amplification, signal enhancement was further accomplished via Au@Pt NPs catalyzing the oxidation and deposition of AEC.
Herein, we introduce a new multisite bridging structure of double-stranded hybridization products that have equivalent bridging sites in pairs (Fig. 1b). When sites ② and ④ bind the colorimetric probe, this structure can bind to the capture probes immobilized on the T line via sites ① or ③, thereby forming a dual-mechanism bridge, which greatly increases the colorimetric performance of LFIA. Given these findings, we propose a multisite bridging-mediated LFIA (mbLFIA) method for the detection of mosquito-borne viruses. Two rounds of CHA amplification are used in this strategy to produce multisite hybridization products. To further enhance the signals' intensity, gold-platinum nanoparticles (Au@Pt NPs) featuring high peroxidase-like activity[35−38] were optimized as colorimetric probes. Au@Pt NPs catalyze the oxidation and deposition of 3-amino-9-ethylcarbazole (AEC), which increases the visibility of the T line even further[39,40]. The specificity and sensitivity of the proposed method were confirmed by detecting CHIKV in infected mice serum samples. Not only does this paper offer a fresh point of view on how to optimize colorimetric signals in LFIA, but it also gives a strong and novel solution for precise on-site surveillance of mosquito-borne viruses, especially in low-resource areas.
-
Unless otherwise explicitly stated, all reagents used in this study were of analytical grade or higher. The following chemicals were purchased from Aladdin (Shanghai, China): hydrogen peroxide (H2O2), potassium chloride (KCl), ethylenediaminetetraacetic acid (EDTA), chloroauric acid trihydrate (HAuCl4·3H2O), acrylamide, bis-acrylamide, and N,N,N′,N′-tetramethyl ethylenediamine (TEMED). Sodium citrate, chloroplatinic acid (H2PtCl6), tris(2-chloroethyl) phosphate (TCEP), L-ascorbic acid (AA), sodium chloride, Triton X-100, 3-amino-9-ethylcarbazole (AEC), tris(hydroxymethyl)aminomethane, and ammonium persulfate (APS) were obtained from Macklin (Shanghai, China). Streptavidin and GelRed were supplied by Sangon Biotech Co., Ltd. (Shanghai, China). All DNA oligonucleotides (including modified strands) were synthesized by BGI Genomics Co., Ltd. (Beijing, China), and all the DNA sequences are detailed in Supplementary Table S1. Nitrocellulose (NC) membranes were procured from Sartorius Corporation. Polyester sample pads, polyvinyl chloride (PVC) backing boards, and absorbent pads were sourced from Hangzhou Autokun Technology. Ultrapure water (18.25 MΩ·cm) was obtained using an UP-water purification system.
Characterization
-
The following instruments were employed: A Tanon 4600SF gel imaging system was used to visualize polyacrylamide gel electrophoresis (PAGE) results; an A300 Fast Thermal Cycler provided temperature control for the CHA reaction; an AutoKun HGS510 instrument was used to dispense T and C lines on NC strips; and an AutoKun HGS201 system was employed for strip cutting. Electrophoresis was carried out using a Keebio-600N electrophoresis apparatus. Transmission electron microscopy (TEM) images were acquired on an FEI Tecnai T20 microscope. X-ray diffraction (XRD) patterns were recorded using a D/max-2400 powder diffractometer (Rigaku) with Cu Kα radiation (λ = 1.54 Å). X-ray photoelectron spectroscopy (XPS) data were collected on a PerkinElmer PHI 5600 spectrometer. Hydrodynamic diameters were measured with a BeNano 90 nanoparticle size analyzer. ImageJ software was used to quantify the intensity of T lines, and NanoMeasure software was employed for particle size analysis based on TEM images.
Preparation of Au@Pt NPs and their conjugation with DNA
-
A 50 mL 1 mmol·L−1 HAuCl4 solution was placed in a round-bottom flask and heated to boiling under vigorous stirring in oil bath. Then, 5 mL 38.8 mmol·L−1 sodium citrate solution was added. After the solution turned wine-red, indicating the formation of Au NPs, the reaction was allowed to proceed for 10 min. Subsequently, 5 mL 10 mmol·L−1 H2PtCl6 solution and 5 mL 100 mmol·L−1 AA solution was introduced sequentially. The Pt element was reduced onto the surface of Au NPs by AA, and the reaction continued under stirring and heating for 1 h. A brownish solution was obtained, indicating the successful formation of Au@Pt NPs. The resulting solution was cooled and stored in a brown glass bottle at 4 °C for further use.
Two nmol thiol-modified DNA was incubated with 15 μL 10 mmol·L−1 TCEP solution at room temperature for 2 h to activate thiol groups. Then 1 mL synthesized Au@Pt NPs solution was transferred into eppendorf (EP) tube. The activated DNA solution was then added to Au@Pt NPs solution, and the mixture was incubated on a rotary mixer. Every 20 min, 10 μL of a salt solution (containing 57 mmol·L−1 Tris-HCl and 2,280 mmol·L−1 NaCl) was added to the mixture. This step was repeated 10 times, resulting in a total addition of 100 μL. After the final salt addition, the conjugation reaction was continued overnight under gentle rotation. Finally, the mixture was centrifuged at 13,000 r·min−1 for 15 min and washed three times with Tris-HCl buffer to obtain Au@Pt-DNA detection probes.
Preparation of Au@Pt NPs based test strips
-
The strip consists of four main components: a sample pad, a NC membrane, an absorption pad, and a PVC backing card. First, the sample pad was immersed in a treatment buffer (20 mmol·L−1 Tris-HCl, 150 mmol·L−1 NaCl, 0.25% Triton X-100, pH 8.0) for 30 min and then dried in an oven for 2 h. The treated pad was stored under dry conditions until use. The sample pad, NC membrane, and absorption pad were then sequentially assembled onto the PVC backing card, ensuring a 2 mm overlap between each adjacent component. The T line and C line were fabricated on the NC membrane by spraying streptavidin-biotinylated DNA detection probe and streptavidin-biotinylated control DNA probe, respectively. These probes were prepared by mixing equal volumes of streptavidin solution (2 mg·mL−1) and biotinylated DNA (100 μmol·L−1), followed by incubation at 25 °C for 2 h. The mixture was purified via ultrafiltration before application. Using a dispenser, the complexes were sprayed onto the NC membrane at a rate of 0.5 μL·cm−1 to form the T and C lines. The assembled strip card was dried in an oven at 37 °C for 2 h. Finally, the card was cut into individual test strips, each with a width of 3 mm, for subsequent analyses.
Test strip detection procedure
-
Each functional hairpin DNA (10 μmol·L−1, dissolved in 10 mmol·L−1 Tris-HCl buffer containing 1 mol·L−1 NaCl, pH 8.0) was first heated at 95 °C for 5 min and then gradually cooled to 25 °C, followed by incubation at this temperature for 2 h to facilitate proper folding. Target was added to CHA system containing H1 (25 nmol·L−1), H2 (25 nmol·L−1), H3 (50 nmol·L−1), and H4 (50 nmol·L−1) in reaction buffer (10 mmol·L−1 Tris-HCl, 100 mmol·L−1 NaCl, 5 mmol·L−1 KCl, pH 8.0). CHA reaction was carried out at 30 °C for 2 h. Thereafter, 7.5 μL Au@Pt-DNA probes was added to the reaction system, and the total volume was adjusted to 30 μL with ultrapure water. The resulting solution was dropped onto the sample pad of test strip and allowed to flow for 10 min until full migration occurred. Then, 40 μL reaction buffer was applied to sample pad to wash away unbound nanoparticles, followed by complete migration of washing solution. Finally, 10 μL enhancement solution (containing 15 mg·mL−1 AEC and 1 mol·L−1 H2O2 in acetate buffer, pH 4.5) was applied to T line area. After 6 min the enhanced signal bands were observed and recorded.
Gel electrophoresis
-
A 5 × TBE buffer was prepared containing 445 mmol·L−1 Tris-base, 445 mmol·L−1 boric acid, and 10 mmol·L−1 EDTA (pH 8.0). In an EP tube, 2.34 mL ultrapure water, 4 mL 30% acrylamide/bis-acrylamide solution (29:1), and 1.6 mL 5 × TBE buffer was mixed by vortexing. Then, 60 μL 10% APS and 8 μL TEMED were added, and the mixture was immediately mixed. The solution was promptly added to gel casting mold and allowed to polymerize at room temperature. The CHA reaction products were mixed with 10 × DNA loading buffer and loaded into the wells of polymerized gel. Electrophoresis was performed in 1 × TBE buffer (89 mmol·L−1 Tris-base, 89 mmol·L−1 boric acid, 2 mmol·L−1 EDTA, pH 8.0) at a constant voltage of 120 V for 1 h. After electrophoresis, the gel was carefully removed and stained with GelRed nucleic acid stain for 20 min. The stained gel was then visualized under UV light at 300 nm using a gel imaging system to observe the resulting bands.
Detection of mice serum samples
-
After infecting mice with the virus, blood samples were collected via retro-orbital bleeding. Serum was separated by centrifugation, and the supernatant was retained. Viral RNA was then extracted from the serum using the HiPure Viral RNA Kit F (Magen, China) according to the manufacturer's instructions. The resulting RNA extract was used directly for test strip detection and RT-qPCR detection.
Quantification of CHIKV in mice serum samples was performed using RT-qPCR with the HiScript II U ONE Step qRT-PCR Probe Kit, following the operating instructions for the BIO-RAD CFX96 instrument. The procedure was briefly as follows: 20 μL RT-PCR reaction mixture was prepared, containing 10 μL of 2 × One Step qRT-PCR Probe Master Mix, 2 μL of 5 × HiScript II Enzyme Mix, 400 nmol·L−1 of each primer and the fluorescent probe, 1 μL of RNA template extracted from mice serum, and nuclease-free water. The thermal cycling protocol consisted of a reverse transcription step at 55 °C for 15 min, followed by initial denaturation at 95 °C for 30 s, and 45 cycles of denaturation at 95 °C for 10 s and extension at 58 °C for 30 s with fluorescence signal acquisition. Samples were determined as positive or negative based on the cycle threshold (Ct) value. A sample was considered positive if the Ct value was fewer than 35 cycles.
Statistical analyses
-
All statistical analyses were performed using GraphPad Prism 8.0.2. The data was presented as mean ± standard deviation (SD). Student's t-test were performed to analyze the data. A P-value < 0.05 was considered statistically significant.
-
The workflow of mbLFIA is illustrated in Fig. 1c. First, the collected samples from virus hosts are lysed to release viral RNA, followed by RNA nucleic acid extraction. The extracted RNA is introduced into the CHA amplification system containing hairpin probes (H1, H2, H3, and H4). The target RNA first hybridizes with hairpin H1 to form target/H1 hybrids, which expose the toehold domain of H1, allowing H1 to further bind hairpin H2 while releasing the target RNA to initiate additional CHA cycles. The formed H1H2 hybrids then expose the toehold domain of H2, which opens and binds to H3. Then the H3 further hybridizes with H4, which releases the H1H2 complex and creates the H3H4 hybridization products. Through two mechanisms, H3H4 can bridge the Au@Pt-DNA probe to the T line, and the aggregation of Au@Pt NPs leads to the formation of visual band. The uncaptured Au@Pt-DNA probes continue hybridizing with the probes on the C line to produce the second band. Without the presence of the target, there is no H3H4 formed and only the C line gives rise to a discernible band.
The colorimetric signal enhancement is accomplished by taking advantage of the peroxidase-like activity of Au@Pt NPs on T line. Au@Pt NPs efficiently catalyze the oxidation of the colorless AEC substrate in the presence of H2O2 to form an insoluble brownish-red precipitate. This insoluble precipitate is deposited on the surface of the Au@Pt NPs to greatly increase the signal intensity of the T line. This strategy is highly effective in converting and enhancing faint target signals, which can greatly enhance the sensitivity of LFIA methods.
Characterization of Au@Pt NPs
-
Our method of synthesizing Au@Pt NPs was carried out in two steps as shown in Fig. 2a. In short, Au NPs were synthesized by the citrate reduction method[41], yielding uniform dispersion particles with a mean diameter of 14.89 ± 0.97 nm (Supplementary Fig. S1a and S1b). Au NPs were used as seeds, and their surfaces were reduced with Pt using AA to obtain a homogeneous black solution of Au@Pt NPs (Fig. 2b). Well-defined lattice fringes with a spacing of approximately 0.23 nm were observed by high-resolution transmission electron microscopy (HRTEM), corresponding to the (111) crystal plane of Au (Fig. 2c). The uniform distribution of Pt throughout the Au core was confirmed by energy-dispersive X-ray spectroscopy (EDS) mapping (Fig. 2d). The mean particle size was 15.66 ± 1.30 nm after the reduction and deposition process of Pt (Fig. 2e). The small size of the nanoparticles enhances the specific surface area of Pt, which provides more active sites, increasing the peroxidase-like catalytic activity. X-ray photoelectron spectroscopy (XPS) survey spectra showed the presence of Au, Pt, C, and O (Supplementary Fig. S2). High-resolution spectra showed metallic Au (Au0, Au 4f7/2 at 84.0 eV, and Au 4f5/2 at 87.7 eV) and metallic Pt (Pt0, Pt 4f7/2 at 70.7 eV, and Pt 4f5/2 at 74.2 eV) as well as a small amount of oxidized Pt species (Pt2+, Pt 4f7/2 at 71.6 eV, and Pt 4f5/2 at 75.4 eV) (Fig. 2f and g). X-ray diffraction (XRD) patterns were found to have good agreement with the standard spectra of Pt (PDF #04-0802) and Au (PDF #99-0056), thus confirming the successful synthesis of Au@Pt NPs (Fig. 2h). We determined the capacity for colorimetric signal amplification by investigating the peroxidase-like activity of Au@Pt NPs through the catalytic oxidation of 3,3,5,5-tetramethylbenzidine (TMB) in the presence of H2O2. It was found that NPs exhibited strong catalytic activity upon the addition of H2O2, indicating the presence of excellent peroxidase-like properties (Fig. 2i). To explore the catalytic mechanism behind the colorimetric signal amplification, we studied the involvement of reactive oxygen species (ROS) in the peroxidase-like activity of Au@Pt NPs. We identified the 1O2 as the main reactive intermediate cause of TMB oxidation when specific scavengers of •OH, 1O2, and O2•− were used. One possible mechanism is that Au@Pt NPs catalyze the breakdown of H2O2 to produce 1O2, which then oxidizes TMB to yield a blue-colored product. Steady-state kinetic measurements were also performed to further understand the peroxidase-like activity of the Au@Pt NPs. The concentration of H2O2 was fixed, and the concentration of TMB was changed. The Michaelis constant (Km) for the Au@Pt NPs was calculated using the Michaelis-Menten equation and the Lineweaver-Burk double reciprocal plot. Lower Km indicate that there is a higher affinity between the nanozyme and the substrate. As the TMB concentration increased, the reaction rate also increased. The Km value was determined to be 0.241 mmol·L−1 (Supplementary Fig. S3a and S3b), which is less than that of horseradish peroxidase (HRP), i.e., 0.43 mmol·L−1[37], and this indicates the greater affinity of Au@Pt NPs towards TMB. Moreover, we also investigated the catalytic performance of the nanoparticles under various solution conditions. First, the catalytic activity was examined at different pH levels (ranging from pH 3.0 to 9.0). The results showed that catalytic activity peaked at approximately pH 5.0. Subsequently, the thermal stability of the NPs was evaluated by heating them to different temperatures and then testing their heat resistance. The results indicated that the NPs retained significant catalytic activity even after being subjected to a high temperature of 90 °C, demonstrating their exceptionally high thermal stability (Supplementary Fig. S4a and S4b). Eventually, we modified the Au@Pt NPs with DNA probes allowing specific probes to bind at the T and C lines. The successful modification was confirmed by the increase in hydrodynamic diameter, the decrease in zeta potential, and the red shift in the ultraviolet-visible (UV-Vis) absorption peak after DNA conjugation (Supplementary Fig. S5a–S5c). In conclusion, the desirable dispersity, excellent peroxidase-like activity, and high stability make Au@Pt NPs promising functional probes of LFIA, supporting their use in sensitive and reliable detection.
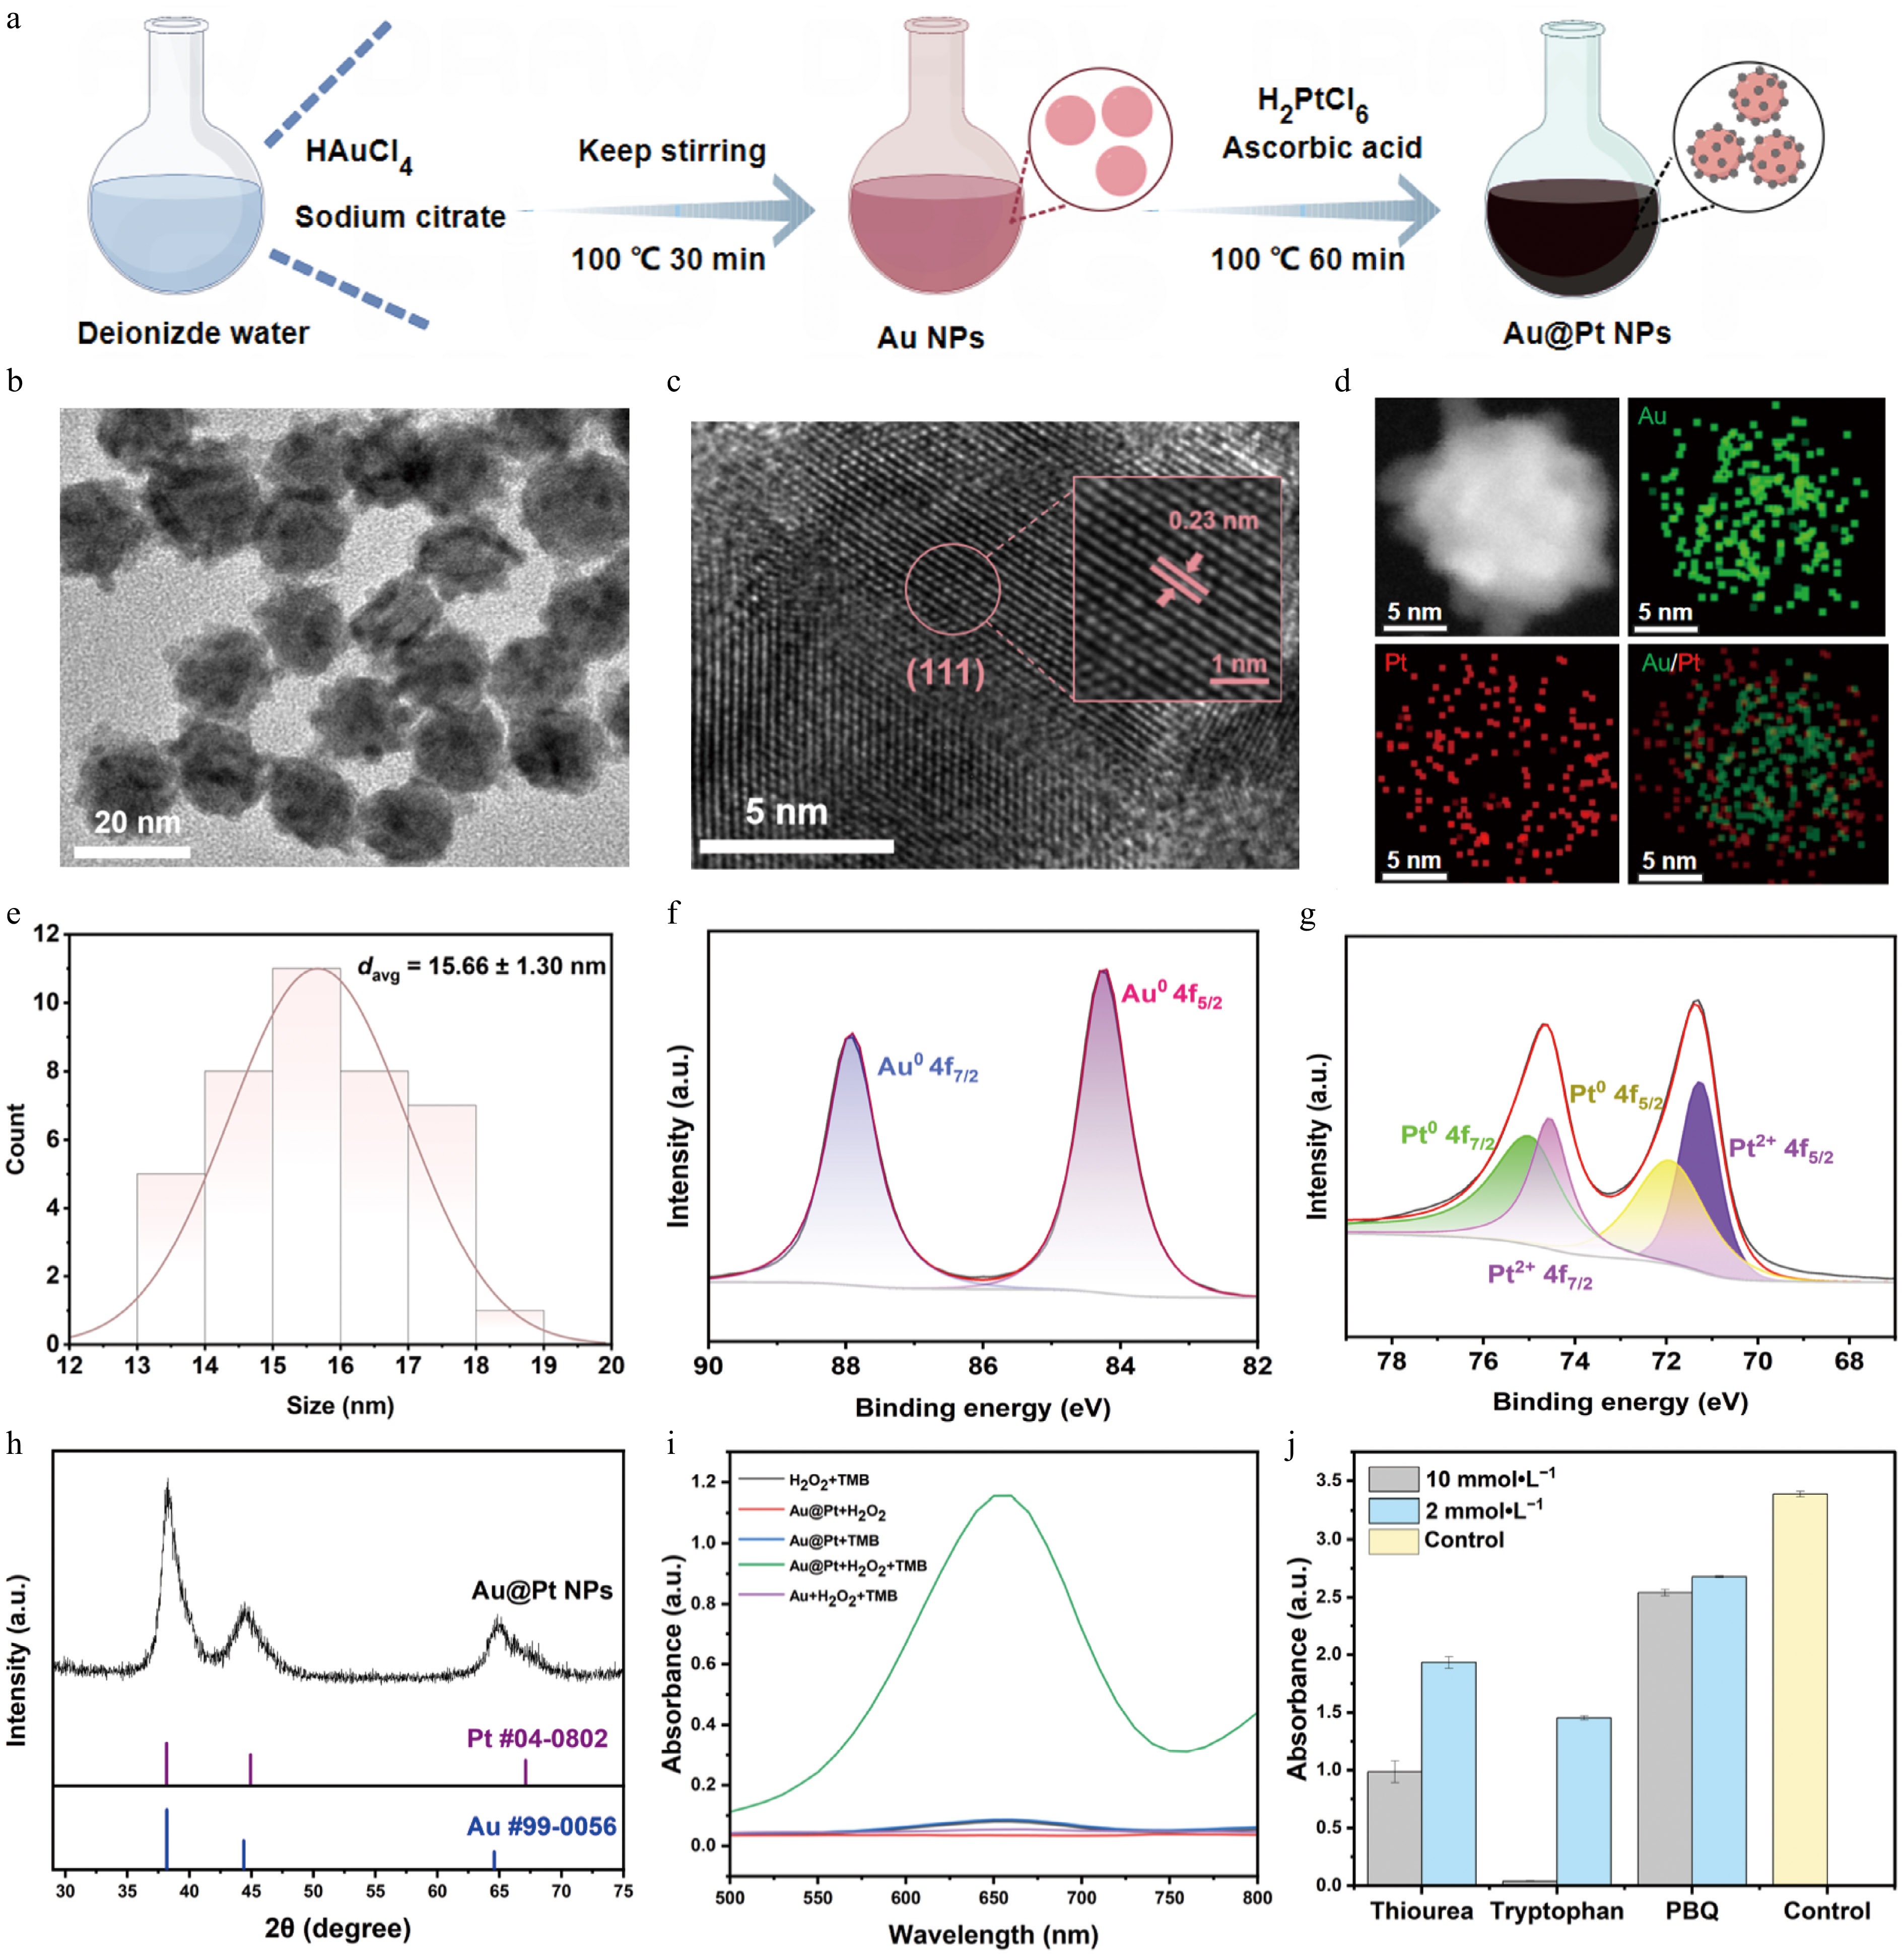
Figure 2.
Synthesis of Au@Pt NPs, preparation of Au@Pt-DNA probes and investigation of peroxidase-like activity. (a) The process of synthesizing Au@Pt NPs, involving the synthesis of Au NPs, followed by the reduction of Pt on the Au NPs' surface. (b) TEM image of Au@Pt NPs; the scale bar is 20 nm. (c) TEM lattice image of Au@Pt NPs, showing a lattice spacing of 0.23 nm; the scale bar is 5 nm. (d) EDX mapping of Au (green) and Pt (red), along with their merged mapping. (e) Particle size distribution histogram of Au@Pt NPs based on TEM analysis. (f) XPS spectra of Au 4f and (g) Pt 4f. (h) XRD pattern of Au@Pt NPs. (i) Visible absorption spectra of the mixed solutions containing Au@Pt NPs + TMB + H2O2, Au@Pt NPs + TMB, Au@Pt NPs + H2O2, TMB + H2O2, and Au NPs + TMB + H2O2. (j) Absorbance at 652 nm of the Au@Pt NPs + TMB + H2O2 catalytic system in the presence and absence of ROS scavengers. Note: Thiourea was used to scavenge •OH, tryptophan was chosen to scavenge 1O2, and p-benzoquinone (PBQ) was utilized to scavenge O2•−.
Feasibility verification of the mbLFIA
-
In order to assess the feasibility of the mbLFIA, we initially analyzed the interaction between the designed hairpin sequences by native polyacrylamide gel electrophoresis (PAGE). Synthetic single-stranded DNA based on a CHIKV sequence was used as the target (Fig. 3a). The presence of the target resulted in the hybridization of hairpins H1 and H2 to form H1H2 hybrids (Lane 5), which indicated that the first CHA cycle was successfully initiated. We subsequently designed a trigger strand, which simulated the toehold region of H2 exposed in the H1H2 hybrid to assess whether it could activate H3 and H4. This trigger strand efficiently activated H3 and H4 to form H3H4, as is apparent in Lane 10, showing that second CHA cycle was successfully activated. Moreover, upon incubation of the target with the combination of H1, H2, H3, and H4, specific bands corresponding to H1H2, H1H2H3, and H3H4 hybrids emerged (Lane 11), which showed that the CHA assay occurred as planned and produced the intended products. We also tested the ability of the CHA assay to yield readable signals on the test strips through the component omission assay. When all the components including the target, H1, H2, H3, and H4 were added, as shown in Fig. 3b, a visible T line was obtained, whereas in all the other situations, only the C line was observed, confirming that four hairpins are necessary to produce the T line signal and that the assay works with good specificity.
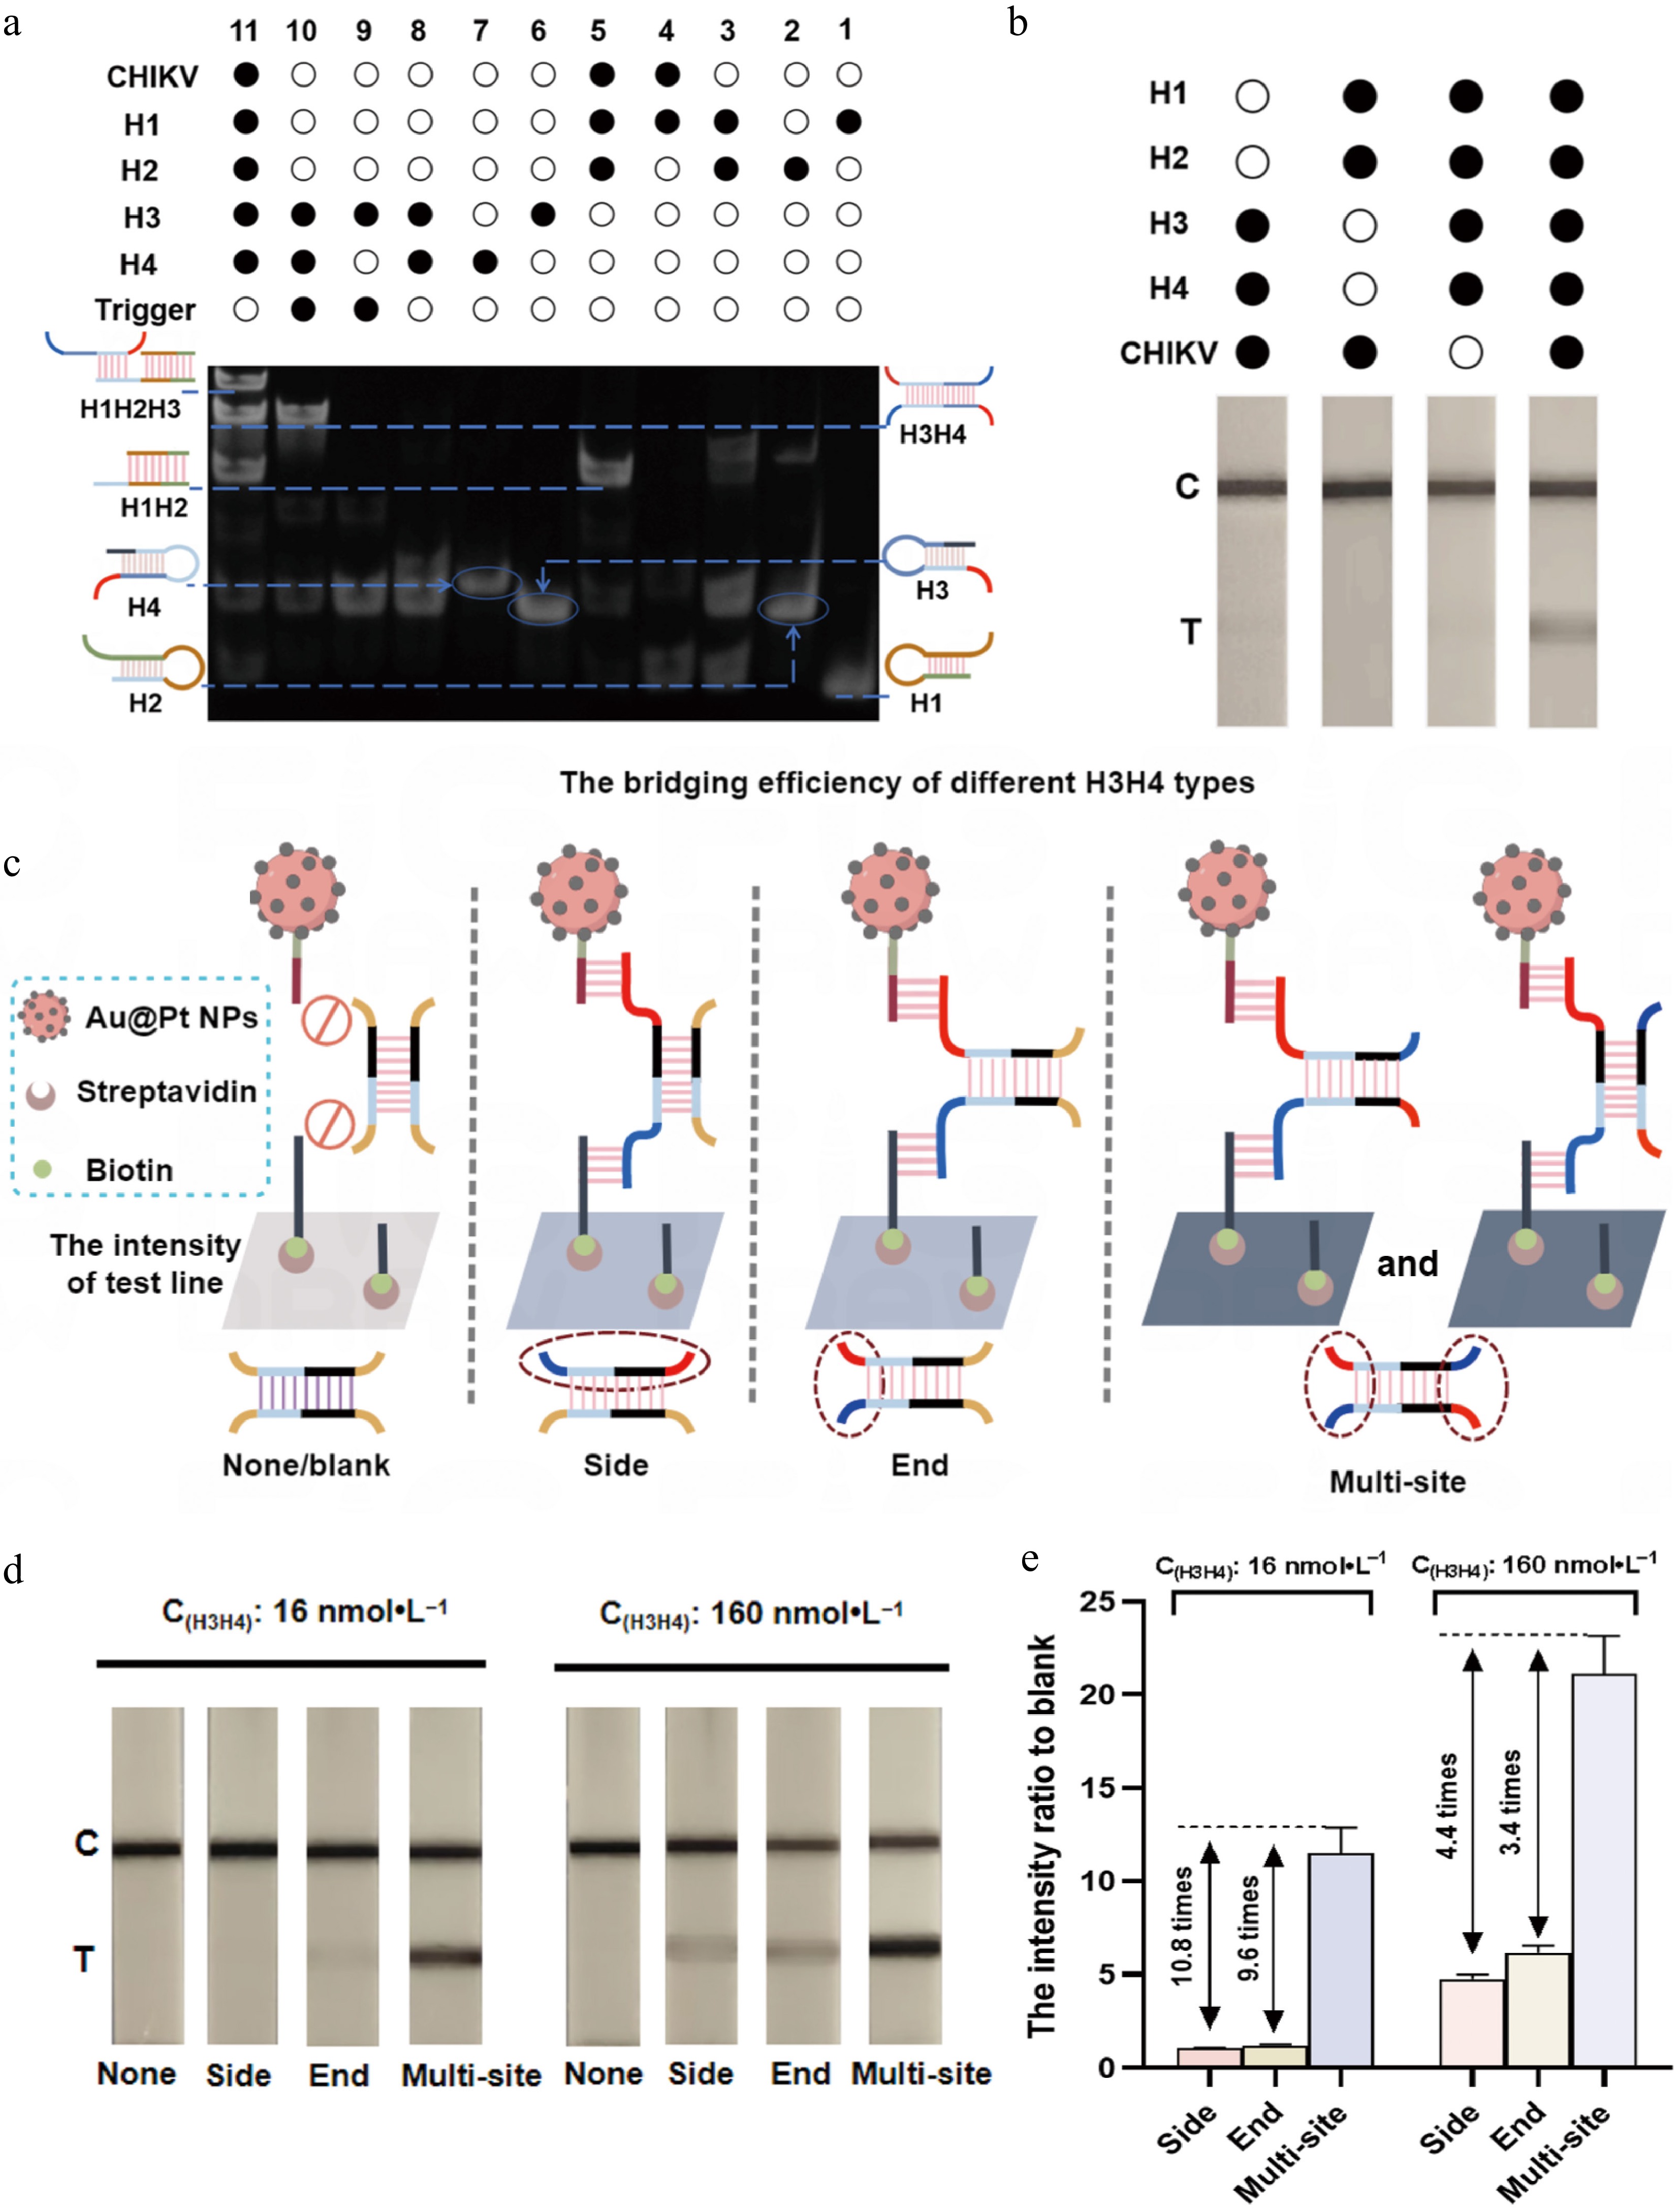
Figure 3.
Feasibility verification of mbLFIA. (a) Characterization of polyacrylamide gel electrophoresis for verifying the feasibility of the CHA assay. Lane 1, H1; Lane 2, H2; Lane 3, H1 + H2; Lane 4, CHIKV + H1; Lane 5, CHIKV + H1 + H2; Lane 6, H3; Lane 7, H4; Lane 8, H3 + H4; Lane 9, H3 + trigger; Lane 10, H3 + trigger + H4; Lane 11, CHIKV + H1 + H2 + H3 + H4. The concentration of DNA used in the gel electrophoresis was 200 nmol·L−1. (b) The mbLFIA's detection results in the presence or absence of H1, H2, H3, H4, and CHIKV. The concentrations of H1 and H2 were 25 nmol·L−1, the concentrations of H3 and H4 were 50 nmol·L−1, and the concentration of CHIKV was 100 pmol·L−1. (c) Schematic diagram for the bridging of Au@Pt-DNA probes on the T line by different types of H3H4 hybrids: 'None' has no site to bridge the Au@Pt-DNA probes; 'Side' can only bridge the Au@Pt-DNA probes via the sites on the same side; 'End' can only bridge the Au@Pt-DNA probes via the sites on single end; 'Multisite' can bridge Au@Pt-DNA probes via multiple sites on equivalent dual ends. The dashed boxes indicate the binding sites of the probes. (d) Colorimetric results on the test strip and (e) the T line's intensity ratio to blank for different types of H3H4 hybrids at concentrations of 16 and 160 nmol·L−1 (the intensity ratio versus the blank were calculated as the equation T line intensity of the variants H3H4/T line intensity of the blank).
To verify the effects of the bridging sites on the signal generation of H3H4 on the T line, we compared four structural variants of the H3H4 hybridization product: None/blank (no site to the bridging probes), side (limited sites on the same side of H3H4 to the bridging probes), end (limited sites on the same end of H3H4 to the bridging probes), and multisite (multiple sites on the equivalent dual end of H3H4 to the bridging probes) (Fig. 3c). The colorimetric efficiency of each variant was assessed at two concentrations (16 and 160 nmol·L−1) with the test strips, and the T line's intensity ratio to that of the blank were quantified with ImageJ software and calculated via the equation: T line intensity of variants H3H4/T line intensity of the blank. At the concentration of 16 nmol·L−1, the T line's signal intensity for the side and end structure were barely detectable, whereas the multisite produced a clear and distinct band. Even at the higher concentration of 160 nmol·L−1, the signals for the side and end configurations remained faint, wheres the multisite band approached saturation. No T line signal was observed for the 'none' structure at either concentration (Fig. 3d). At the low concentration (16 nmol·L−1), the T line's intensity ratio versus the blank of the multisite structure was 10.8 times and 9.6 times higher than that of the side and end structure, respectively, and at the higher concentration (160 nmol·L−1), it was 4.4 times and 3.4 times higher, respectively (Fig. 3e). These results demonstrate that the multisite structure significantly enhances the colorimetric efficiency of the test strip.
Optimization of experimental conditions
-
The secondary structures of the designed DNA hairpins H1, H2, H3, and H4 were simulated using the NUPACK online software tool. The secondary structures all exhibit favorable thermodynamic stability, with their stem regions maintaining consistently high base-pairing probabilities. The negative Gibbs free energies and predominantly high base-pairing probabilities confirm that these structures are well-folded under the tested conditions (Supplementary Fig. S6a–S6d), which is expected to minimize nonspecific background signals in the CHA reaction. We subsequently optimized several key parameters in the test strips' preparation, including the DNA volume modified with Au@Pt NPs, the spraying rate of the solution at the T and C lines, and the type of nitrocellulose (NC) membrane. The optimal conditions were finally determined to be 20 μL of DNA volume modified with Au@Pt NPs, a spraying rate of 0.5 μL·cm−1 for both the T and C lines, and the Unistar CN140 NC membrane, which showed the best performance (Supplementary Fig. S7a–S7c). To further enhance the detection performance of CHA amplification, several critical factors were systematically optimized, including the reaction temperature, concentration ratio of H1H2 to H3H4, the reaction time, and the volume of Au@Pt-DNA probes. The optimal conditions were selected according to the highest signal-to-noise ratio (S/N), defined as the ratio of the T line's intensity in the positive sample to that in the negative one (Fig. 4a). First, the CHA amplification was carried out at different temperatures (25, 30 , 35 , and 40 °C). Elevated background signals were observed on the T line at 35 and 40 °C, whereas the reaction at 30 °C achieved the highest S/N (Supplementary Fig. S8a and Fig. 4b). Next, using a fixed concentration of H3H4 (50 nmol·L−1) to maintain a low background, we optimized the concentration ratio of H1H2 to H3H4 (0.25 : 1, 0.5 : 1, 1 : 1, and 2 : 1). A ratio of 0.5 : 1 was found to engage the highest S/N (Supplementary Fig. S8b and Fig. 4c). The reaction time was also evaluated at 60, 90, 120, and 150 min, with 120 min identified as the optimal time (Supplementary Fig. S8c and Fig. 4d). Finally, different volumes of Au@Pt-DNA probes (5.0, 7.5, 10.0, and 12.5 μL) were tested, and 7.5 μL provided the best S/N (Supplementary Fig. S8d and Fig. 4e). As the synthesized Au@Pt NPs possess strong peroxidase-like activity, we used an enzymatic signal enhancement strategy to further improve their detection sensitivity (Fig. 4f). Although TMB is commonly used for enzymatic signal enhancement, its soluble blue product is prone to diffusion, leading to inaccuracies. In contrast, AEC forms an insoluble brown precipitate upon catalysis, which allows localized signal amplification. Therefore, AEC was selected as the chromogenic substrate for signal enhancement (Fig. 4g). The enhancement conditions, including the H2O2 concentration, incubation time, AEC concentration, and enhancement solution volume, were also optimized. The results indicated that optimal signal enhancement was achieved using an enhancement solution containing 1 mol·L−1 H2O2 and 15 mg·mL−1 AEC, with a volume of 10 μL applied for 6 min (Supplementary Fig. S9a–S9d).
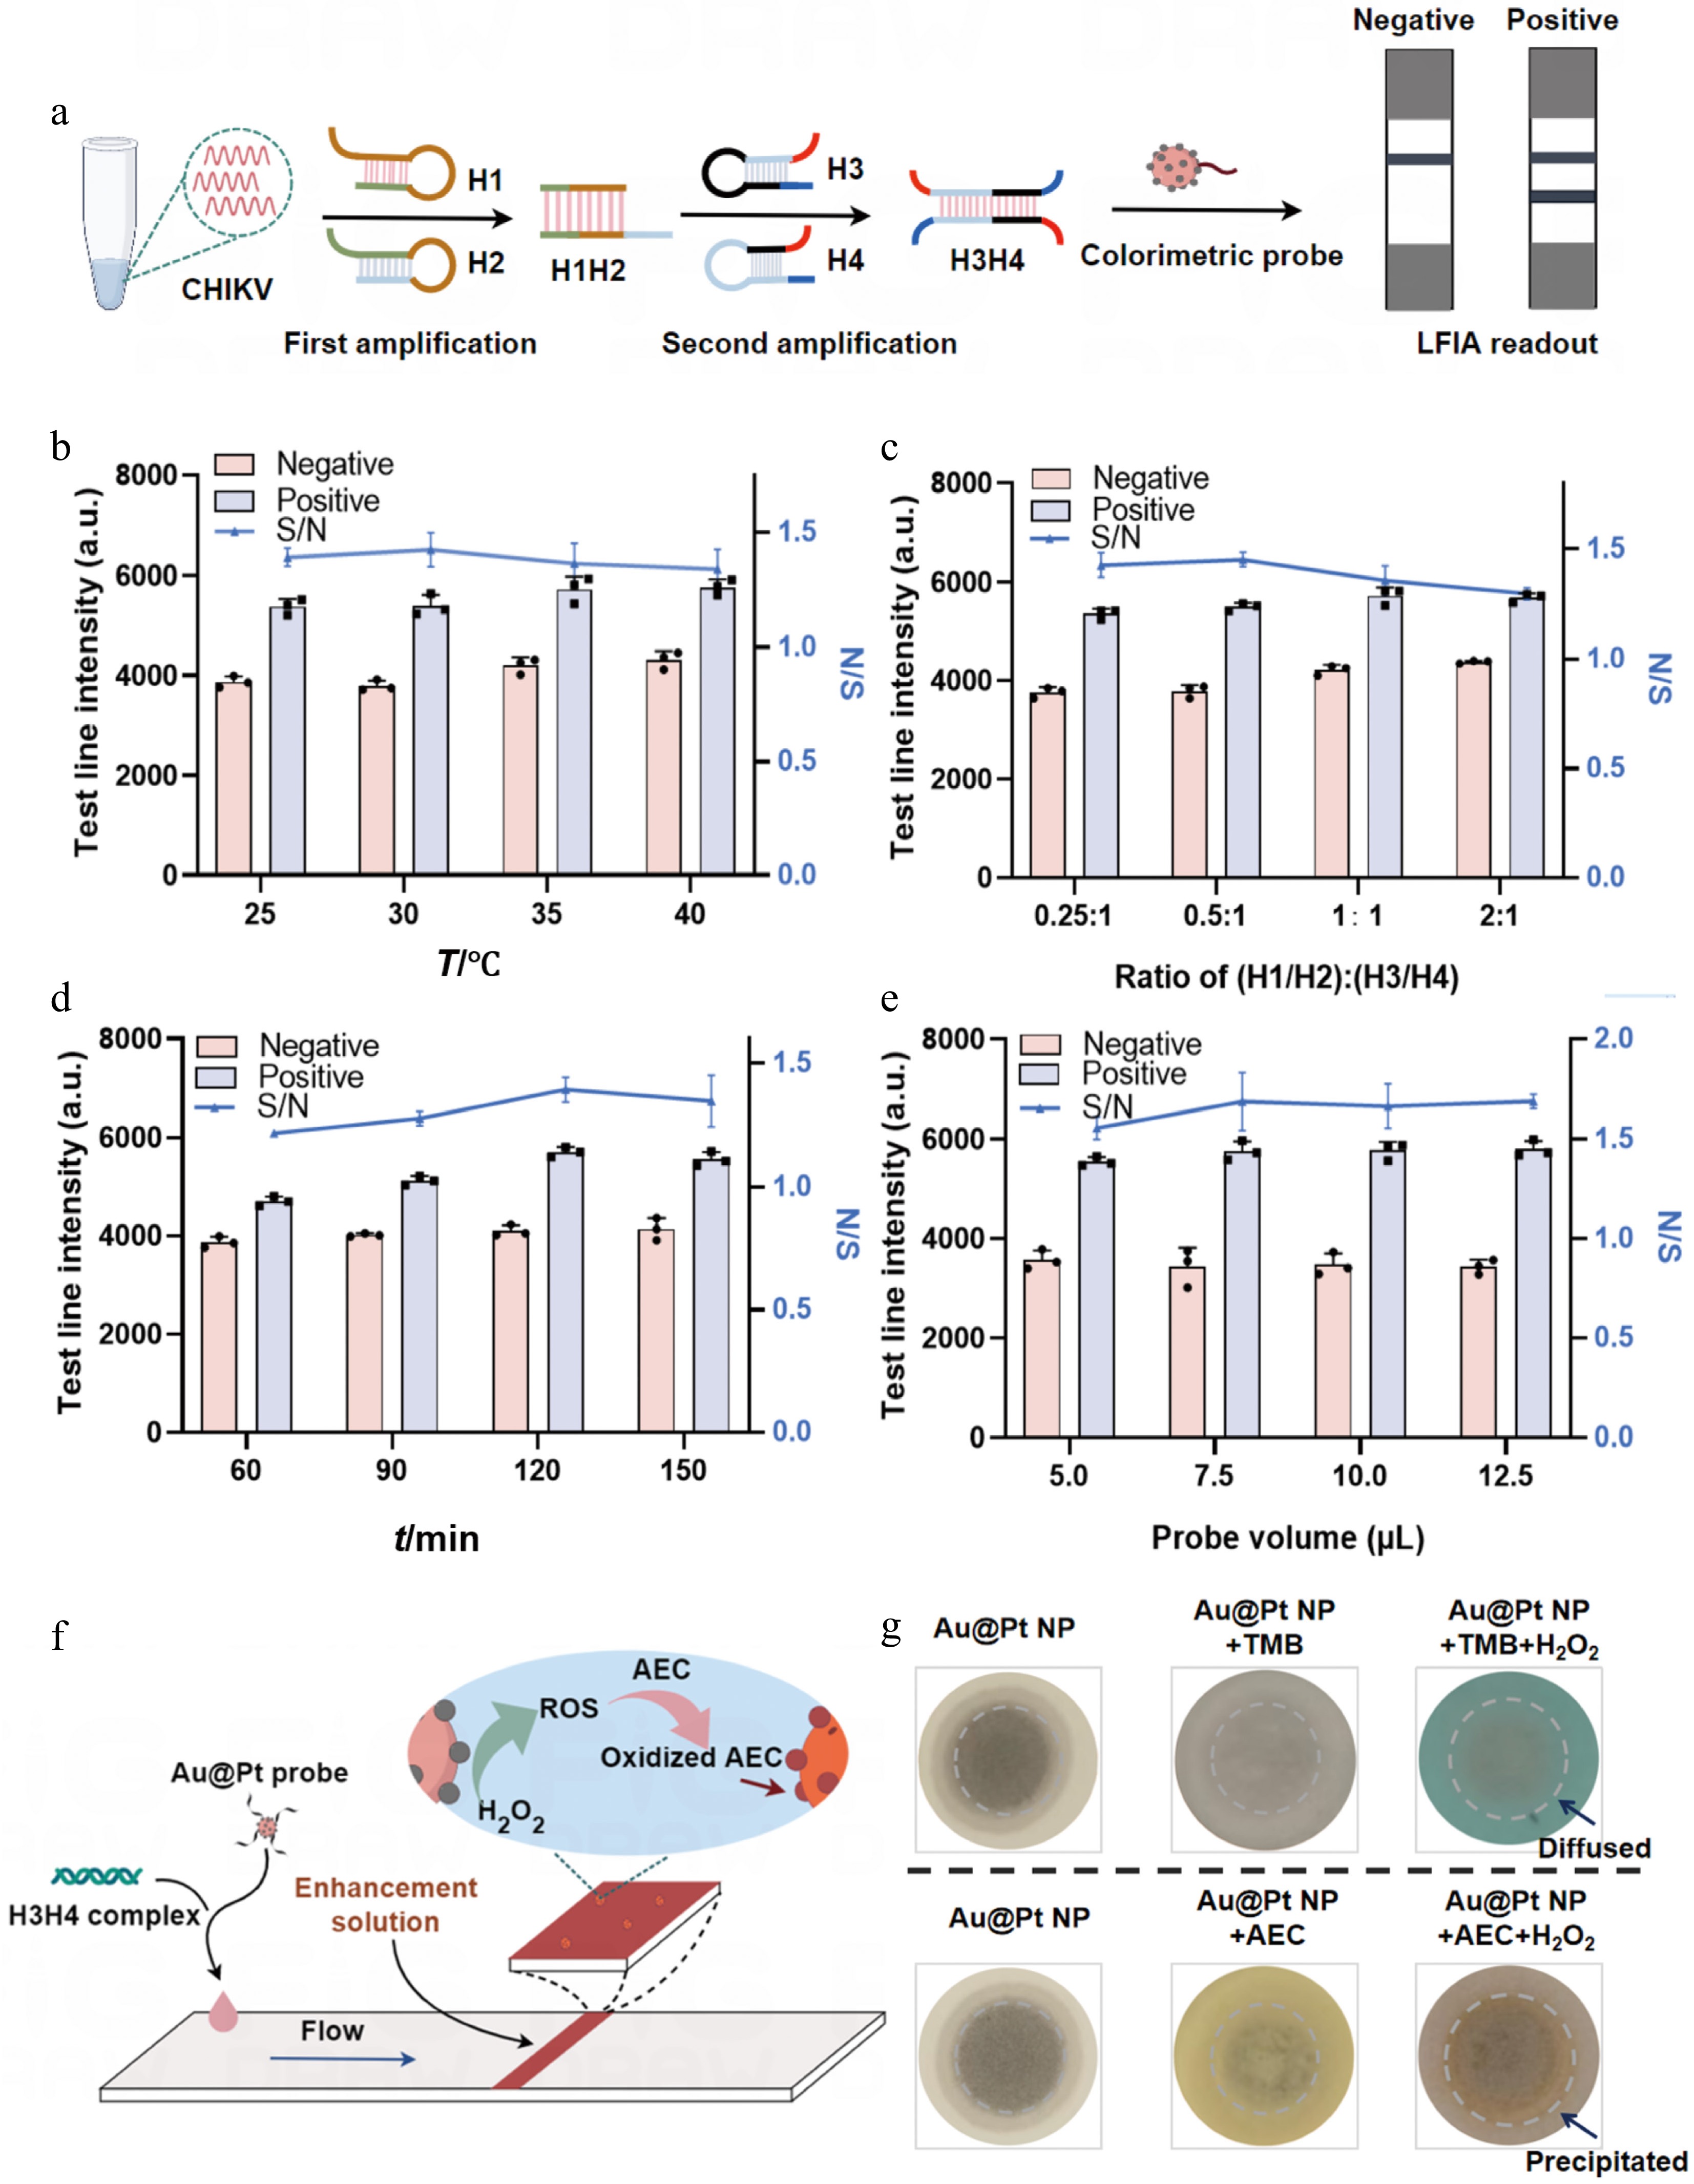
Figure 4.
Optimization of the mbLFIA conditions. (a) Optimization of the relevant reaction conditions using CHIKV as the target model. (b) Relative T line intensity of the positive and negative samples and their signal-to-noise ratios (S/N) under different temperatures, (c) different concentration ratios of H1H2 to H3H4, (d) different reaction times, and (e) different volumes of the Au@Pt-DNA probes. (f) Schematic diagram of the enzymatic signal enhancement strategy. (g) Effect comparison of TMB and AEC catalysis by Au@Pt NPs on NC membranes. In contrast to the diffusible product of TMB oxidation, the product of AEC oxidation catalyzed by Au@Pt NPs forms an insoluble in situ deposit.
Detection performance of the mbLFIA
-
Under the optimized conditions, we evaluated the detection performance of the mbLFIA using synthetic ssDNA of CHIKV as the model target. A series of CHIKV ssDNA standards at concentrations ranging from 0 to 104 pmol·L−1 were tested to assess both the general and colorimetric-enhanced situation of the LFIA. As the CHIKV concentration increased, a gradual darkening of the T line was observed, indicating that the nanozyme-catalyzed deposition effectively amplified the signal without altering the concentration-dependent quantitative relationship. The visual detection range for CHIKV was 20 to 104 pmol·L−1 for the general assay and 2 to 104 pmol·L−1 for colorimetric enhancement. The visual limit of detection (vLOD), defined as the lowest concentration at which the T line's intensity was visibly stronger than that of the negative control, was determined to be 20 and 2 pmol·L−1 for the general LFIA and the colorimetry-enhanced LFIA, respectively. Standard curves were generated by plotting the relative color intensity of the T line against the logarithm of the CHIKV ssDNA concentration both with and without signal amplification. A strong linear correlation was observed in both cases (Fig. 5a). We further validated the detection performance of the mbLFIA in diluted mice serum, urine, and saliva (Supplementary Fig. S10a–S10c). The results showed that the vLOD in mice urine, saliva and serum was mostly consistent with that in a water solution, demonstrating its good detection capability in biological matrices. To further evaluate specificity, several other mosquito-borne viruses were tested, including Dengue virus (DENV), Zika virus (ZIKV), Yellow fever virus (YFV), Japanese encephalitis virus (JEV), West Nile virus (WNV), and Getah virus (GETV)[42]. Each nontarget virus was tested at 2,000 pmol·L−1, whereas CHIKV was tested at 1,000 pmol·L−1. As shown in Fig. 5b and c, the signal response for CHIKV was significantly stronger than that for any nontarget virus, demonstrating high specificity of the mbLFIA for CHIKV. The accuracy of the assay was further assessed through spiked recovery tests in artificial matrices. CHIKV ssDNA was spiked into saliva, urine, and serum (each diluted 50-fold) at concentrations of 300, 600, and 1,200 pmol·L−1. The brown-red color of the T line intensified with increasing CHIKV concentrations. Recovery rates across all three matrices ranged from 80% to 120% (Fig. 5d and e), indicating that the mbLFIA is sensitive to CHIKV and exhibits satisfactory tolerance to complex biological matrices. Compared with other signal amplification strategies reported for RNA detection, our proposed mbLFIA enables highly sensitive detection without the need for bioenzymes or specialized instruments, thus significantly reducing resource consumption and costs. Furthermore, it allows direct visual detection by the naked eye, making it suitable for in-field testing (Supplementary Table S2).
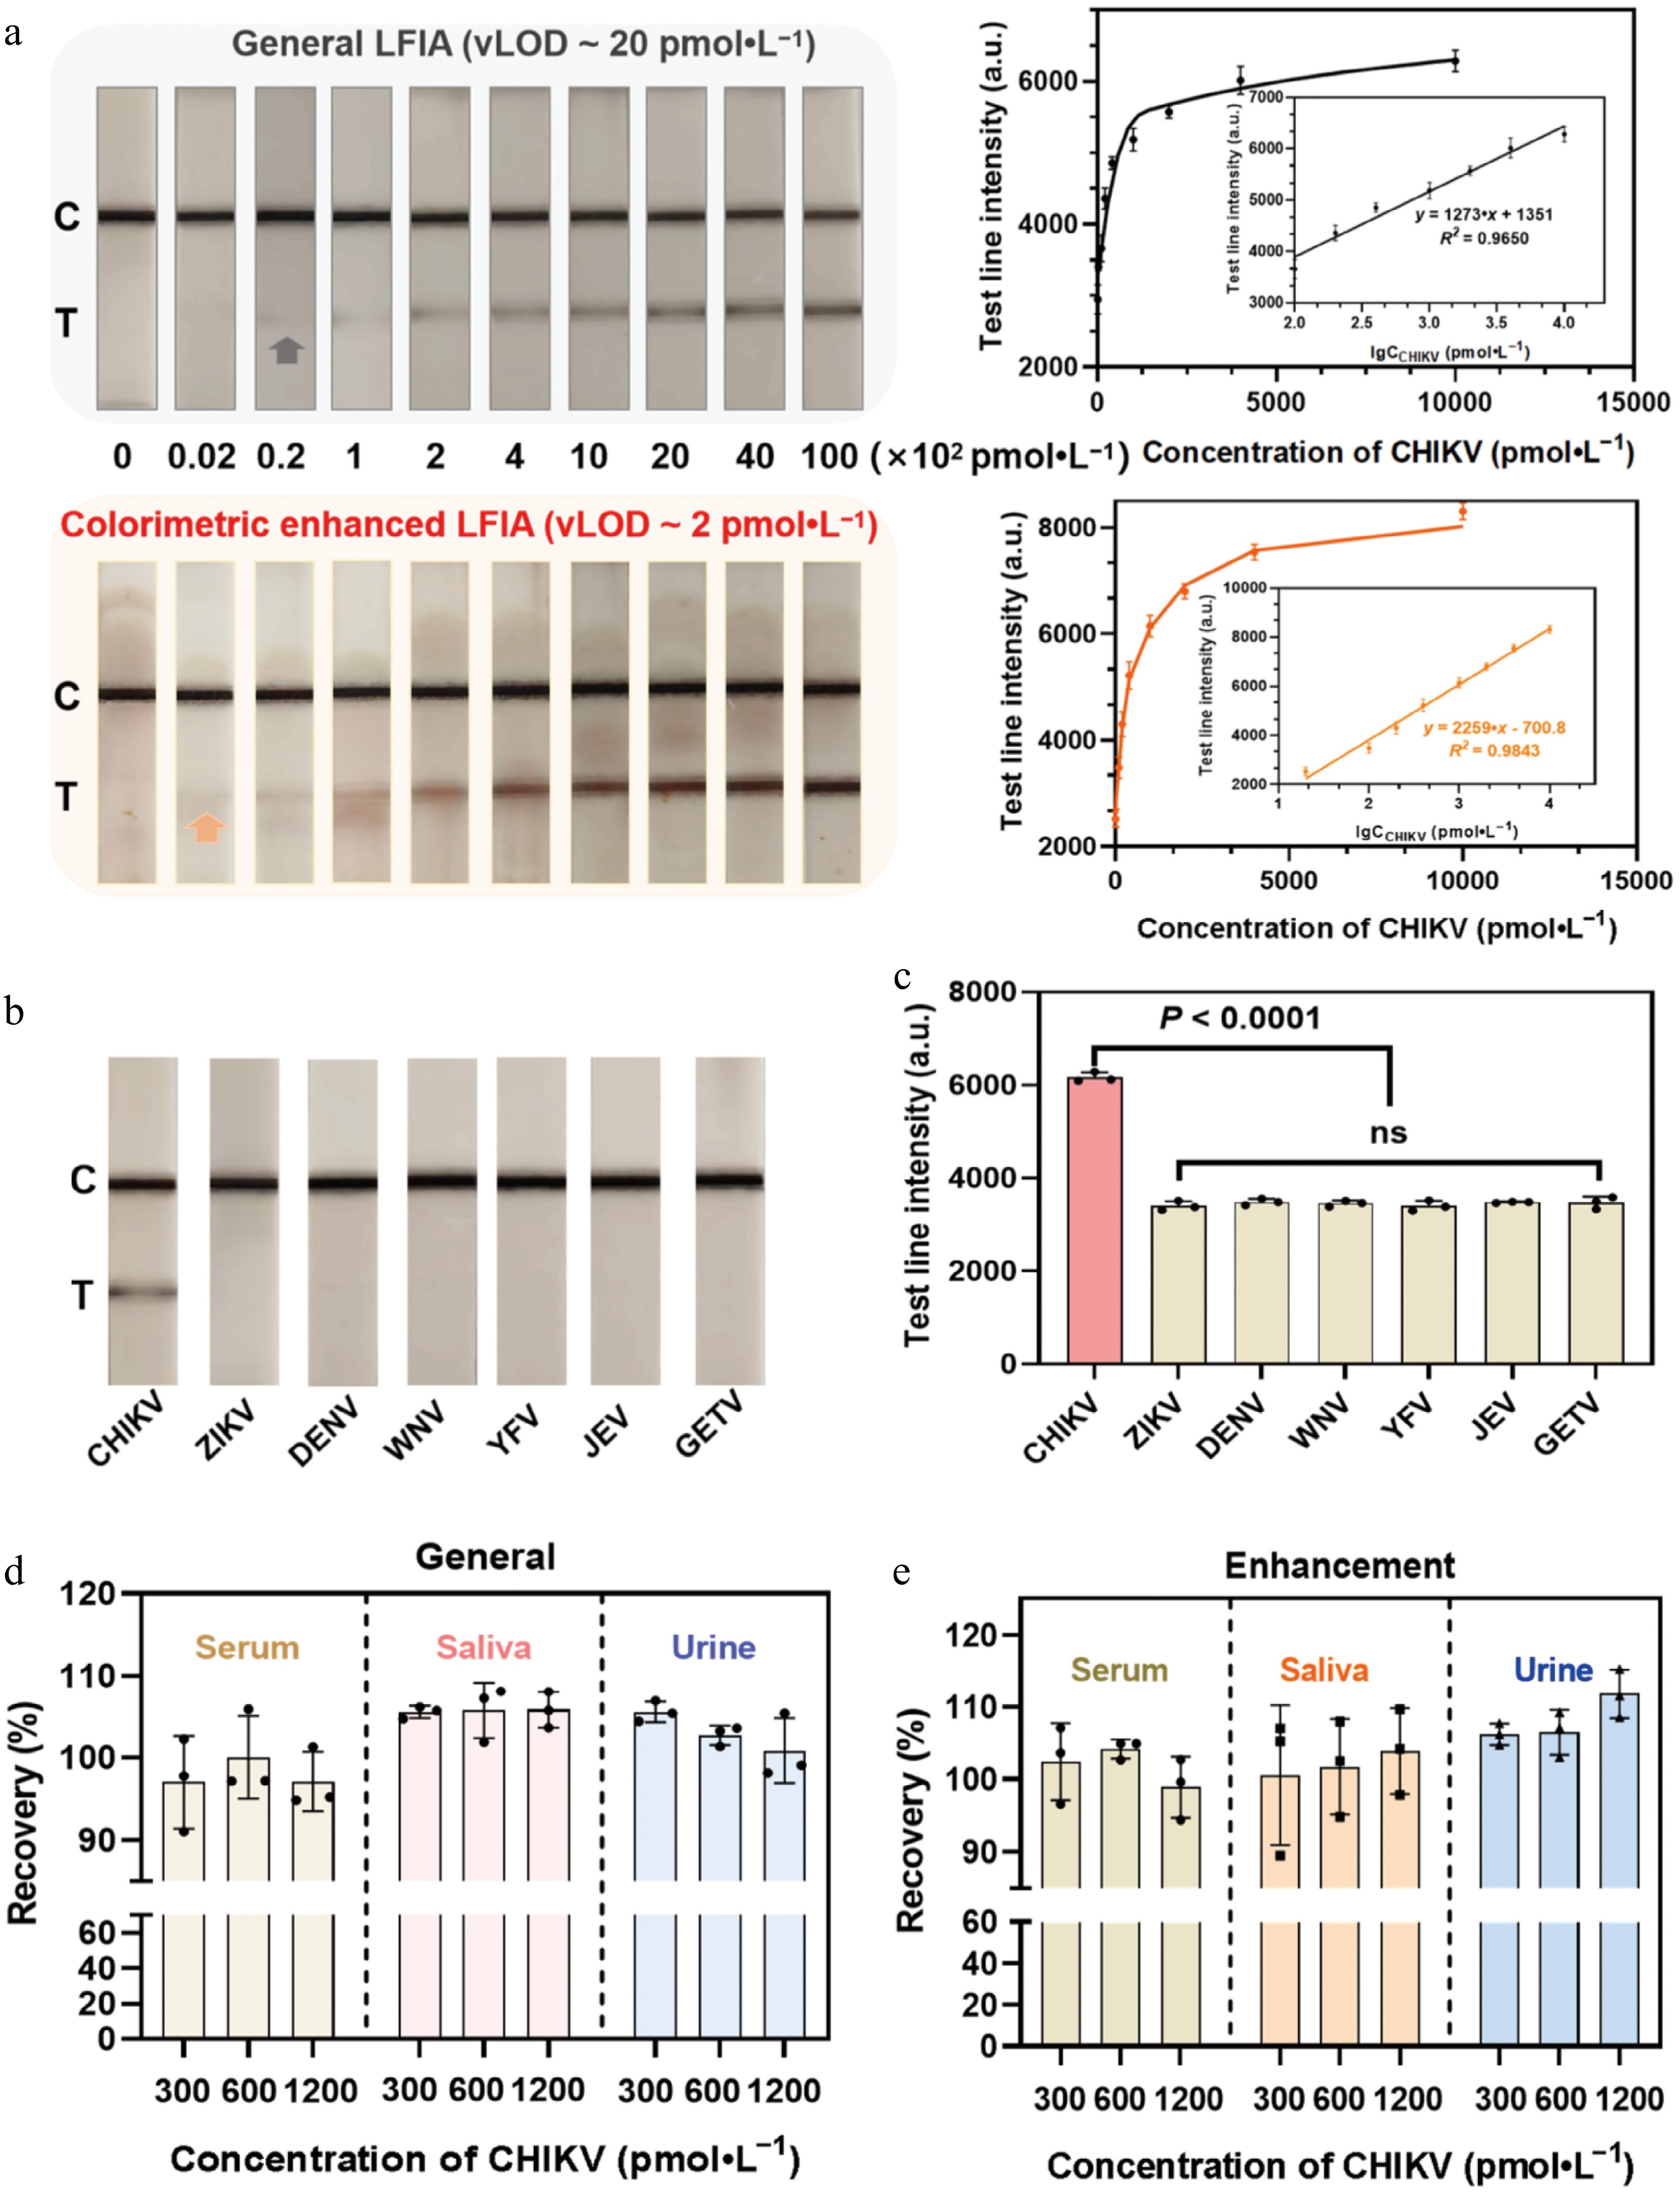
Figure 5.
Analytical performance of the mbLFIA for the detection of CHIKV. (a) Photographs of the test strips in response to different concentrations of CHIKV before and after AEC-based catalytic amplification. Calibration curves of the T line's intensity before and after AEC-based catalytic amplification. (b) Selectivity of different mosquito-borne viruses and (c) qualitative results of the mbLFIA. Dengue virus, DENV; Zika virus, ZIKV; Yellow fever virus, YFV; Japanese encephalitis virus, JEV; West Nile virus, WNV; Getah virus, GETV. Qualitative results of the test strips for the recovery of CHIKV from spiked samples in serum, saliva, and urine matrices by the mbLFIA test strips (d) before and (e) after AEC-based catalytic amplification.
Application of mbLFIA in detecting suspected mice serum samples
-
To evaluate the practical applicability of the method developed for virus detection, we analyzed 36 serum samples collected from suspected CHIKV-infected mice. As illustrated in Fig. 6a, the nucleic acids extracted from these serum samples were tested using the mbLFIA system. The method successfully identified 16 out of 36 samples as being positive for CHIKV infection (Fig. 6b and Supplementary Fig. S11), and the T line intensity of these 16 infected samples was consistently higher than that of 20 healthy samples (Fig. 6c). To further validate the accuracy of the reported method, all samples were also tested using reverse transcription–polymerase chain reaction (RT-PCR) as the gold standard reference. The results obtained from the mbLFIA were in complete agreement with those from RT-PCR (Fig. 6d and Supplementary Fig. S12). Receiver operating characteristic (ROC) analysis further confirmed the high performance of the mbLFIA, showing an area under the curve (AUC) of 1.0, with both sensitivity and specificity reaching 100% (Fig. 6e). Notably, whereas RT-PCR requires sophisticated instruments, bioenzyme treatment, thermal cycling, and real-time fluorescence detection, which makes it unsuitable for on-site testing, our mbLFIA method requires only a temperature control module and portable test strips. We further applied mbLFIA to monitor the therapeutic efficacy of the antiviral drug favipiravir in CHIKV-infected mice. This drug was applied on the first day after infection, and the viral load was measured prior to infection and on the second and fourth days after treatment. The assay showed a constant reduction in viral load in the treated mice, opposite to the growing viral load in the control groups (Supplementary Fig. S13). These results indicate a highly promising possibility that mbLFIA might serve as a sensitive, precise, and applicable method of on-site detection.
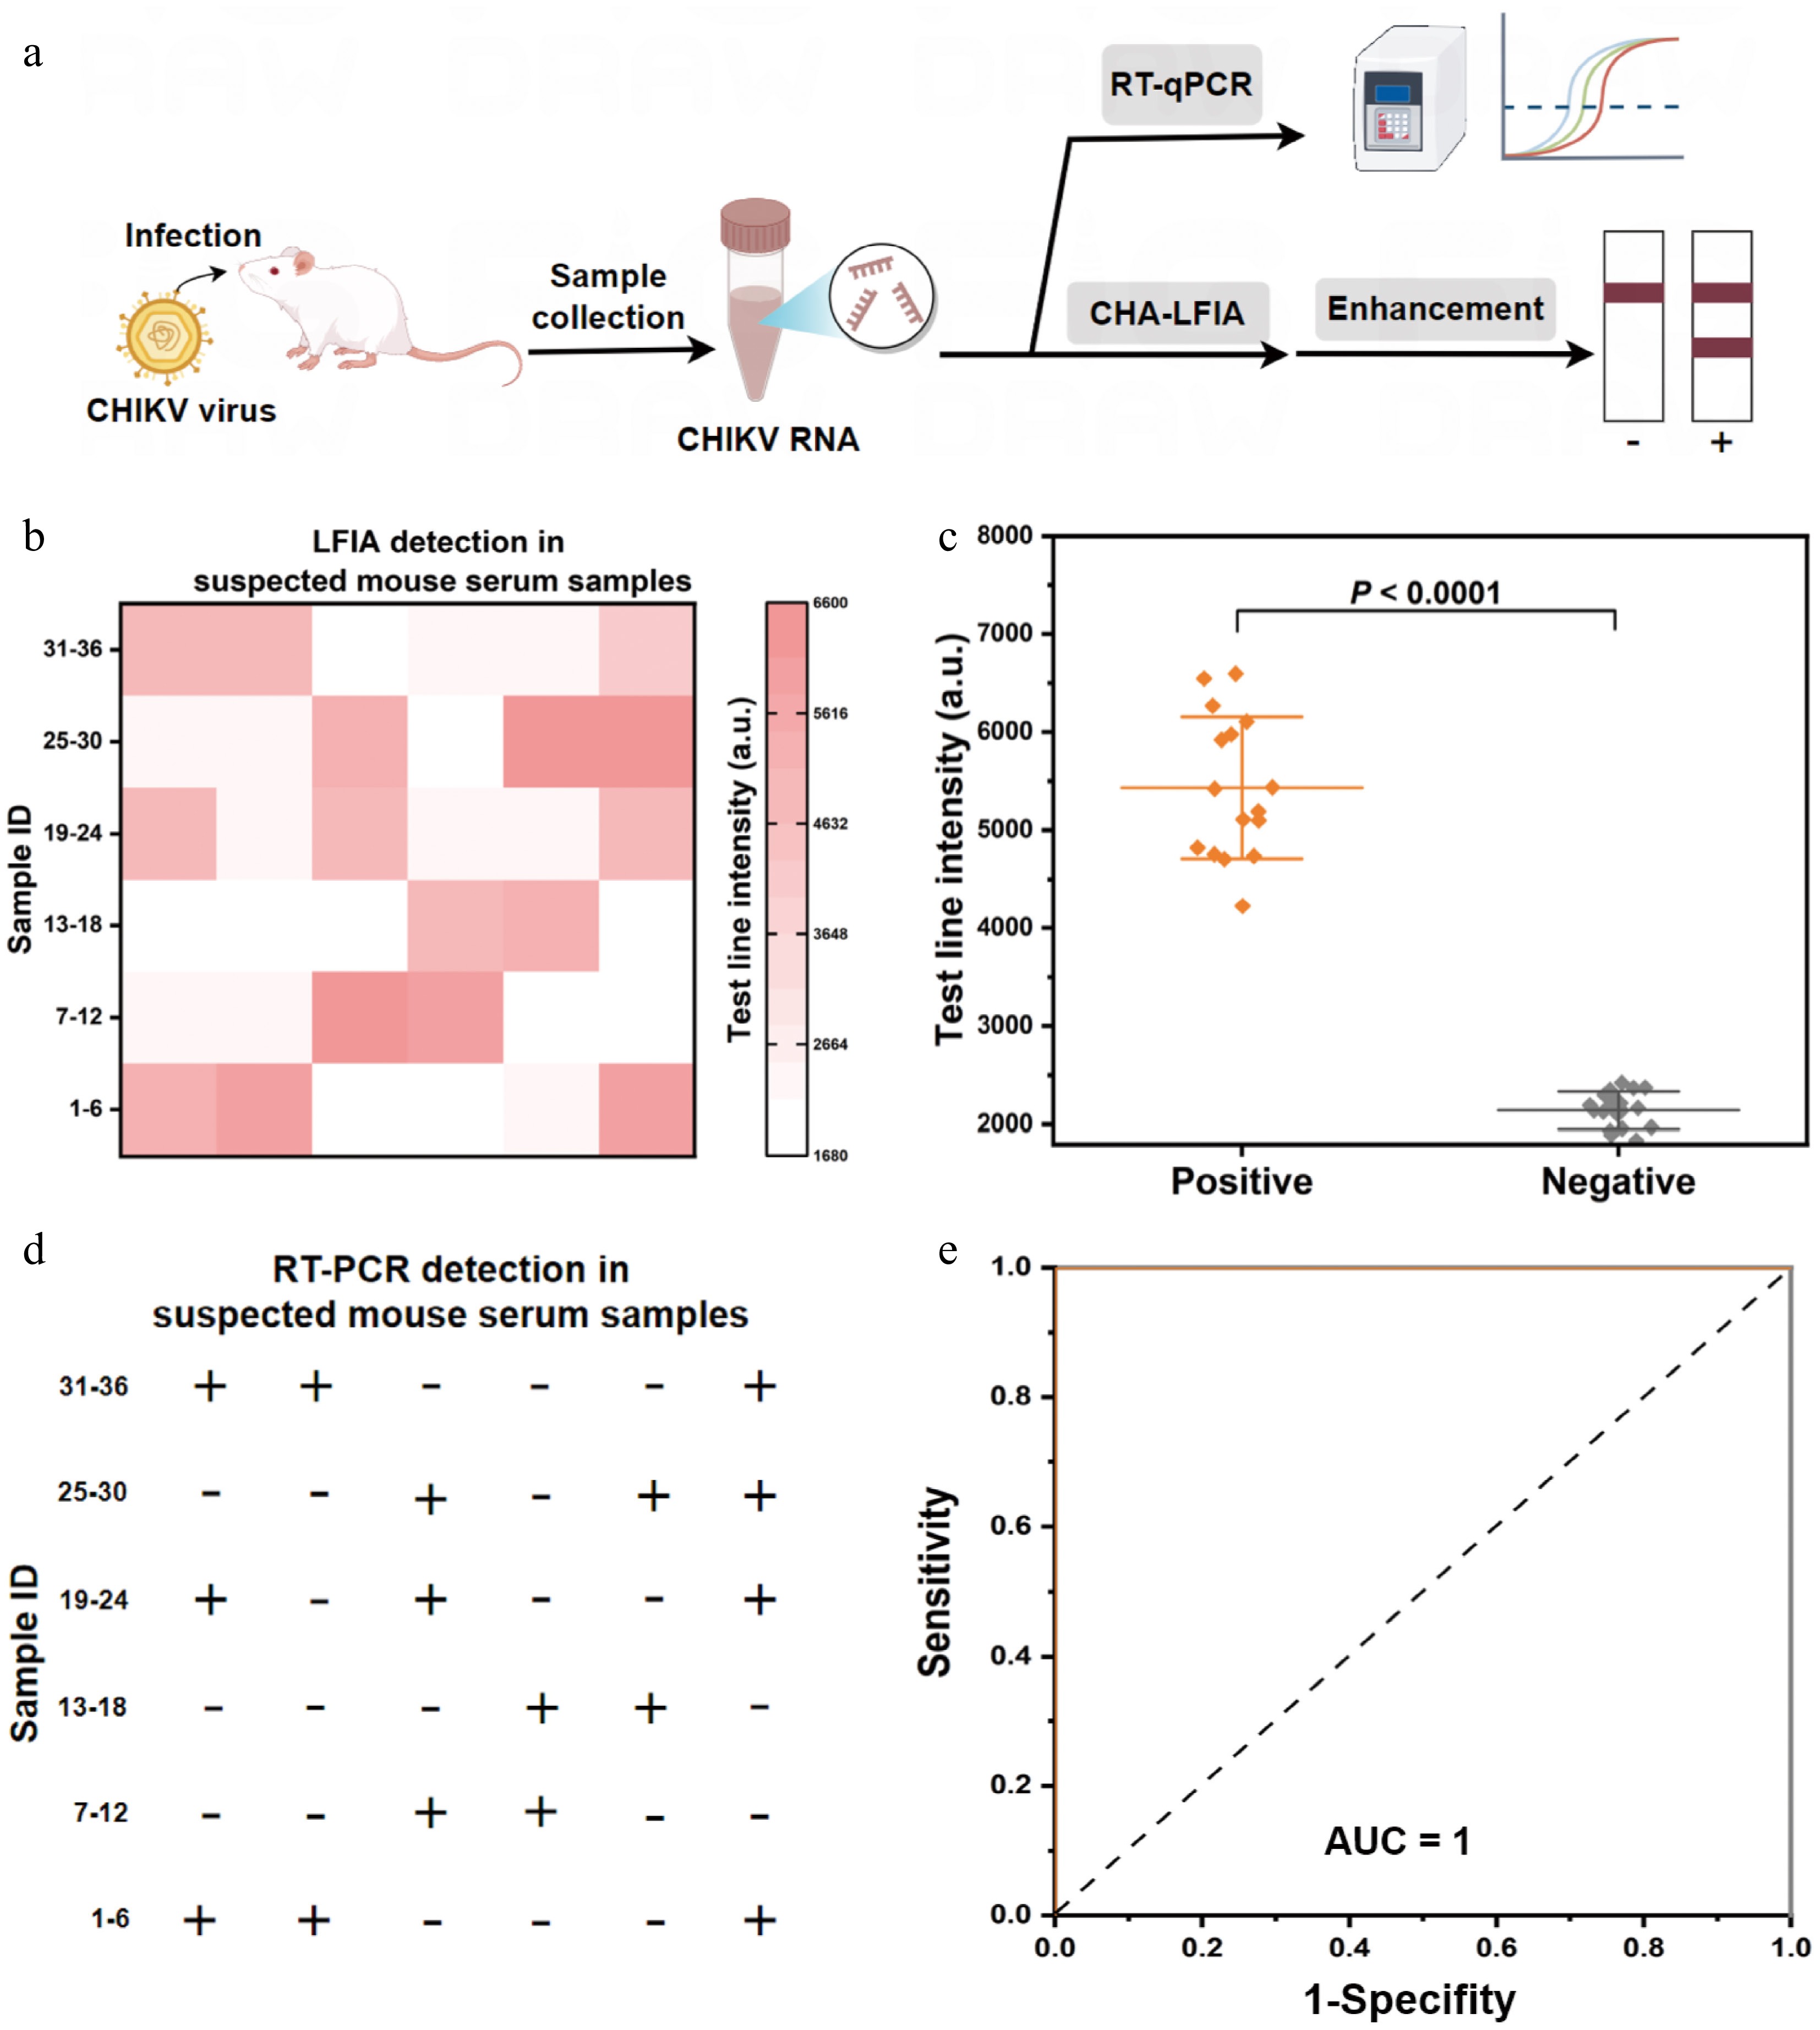
Figure 6.
Identification of CHIKV in suspicious mice serum samples. (a) Requirements of the steps needed to detect CHIKV in suspected mice serum samples by the mbLFIA and RT-qPCR techniques. (b) Heat map indicating the findings of detecting CHIKV in 36 suspected mice serum samples with the mbLFIA. The heat map shows the intensity of the T line of each sample. (c) Scatter plot of the T line's intensity values in 20 negative samples and 16 positive samples identified by the mbLFIA method (two-tailed Student's t-test; ***, P < 0.0001; data are presented as mean ± SD, n = 3). (d) The identification of infected CHIKV samples in 36 suspicious mice serum samples by RT-qPCR. The sign '+' indicates positive samples and '–' indicates negative samples. (e) Detection accuracy of the mbLFIA in sample applications using ROC curve analysis.
-
To summarize, the mbLFIA platform offers a new outlook in enhancing colorimetric signals in LFIAs. Through the design of hybridization products as multisite bridging structure, the vLOD was obtained at a level as low as 20 pmol·L−1 for the detection of CHIKV, which was further improved to 2 pmol·L−1 when AEC enhancement was added. The method possessed high specificity and accuracy in complex media such as serum, saliva, and urine. Moreover, it was able to identify CHIKV in the serum of 36 suspected mice. Positive and negative samples were clearly distinguished on the platform, which agreed completely with the RT-qPCR results. Additionally, there are no specialized instruments or bioenzymes needed to complete the entire detection process, and its visual readout property makes it suitable for the point-of-care testing. We expect further technical advances in the method in the future. Future developments could involve incorporating microfluidic technology to create a fully integrated diagnostic system that will integrate nucleic acid extraction, amplification, and visual detection, which would be more effective in terms of practicality. Furthermore, adding probes with various tags or using multiplexed T lines designed to detect other targets would enable the system to detect more pathogens simultaneously, which would be particularly useful in co-infection of mosquito-borne viruses. The mbLFIA platform offers a viable option for rapid on-site detection and also presents an innovative platform with wide scope of application in the surveillance of mosquito-borne viruses, decision-making in the field of public health, and emergency responses.
This study was financially supported by the National Natural Science Foundation of China (22574173), the Scientific Research Program Project of Drug Regulatory Science, Jiangsu Provincial Medical Products Administration, China (202518), and the Project Program of State Key Laboratory of Natural Medicines (China Pharmaceutical University) (SKLNMZZ2024JS46, SKLNMZZ202510).
-
This study has been reviewed by the Experimental Animal Ethics Committee of the Institute of Military Veterinary Medicine and complies with animal welfare ethical standards. The ethical review number is IACUC of AMMS-11-2025-024.
-
The authors confirm their contributions to the work as follows: conceptualization, methodology, software, formal analysis, investigation, data curation, and writing of the original draft: Nie Y; formal analysis and investigation: Shang C, Fan S; methodology, formal analysis, investigation, and writing: Tan X, Song J; methodology: Li W, Hu Q; supervision and funding acquisition: Ju Y; conceptualization, methodology, formal analysis, and investigation: Dai J, Wang Z; review and editing, and funding acquisition: Ju Y. All authors reviewed the results and approved the final version of the manuscript.
-
The data that support the findings of this study are available from the corresponding author upon reasonable request.
-
The authors declare that they have no conflict of interest.
-
accompanies this paper online at: https://doi.org/10.48130/targetome-0026-0016.
-
#Authors contributed equally: Yao Nie, Chao Shang, Shiyong Fan
- Supplementary Table S1 Sequences of oligonucleotides used in this study.
- Supplementary Table S2 Comparison of the analytical condition of mbLFIA with different signal amplification strategies.
- Supplementary Fig. S1 (a) TEM image of Au NP; scale bar is 20 nm. (b) Particle size distribution histogram of Au@Pt nanoparticles based on TEM analysis.
- Supplementary Fig. S2 XPS full spectrum of Au@Pt NP.
- Supplementary Fig. S3 Steady-state kinetic assay of Au@Pt NPs based on POD-like activity.
- Supplementary Fig. S4 Stability of the catalytic activity of Au@Pt NPs.
- Supplementary Fig. S5 (a) The different change beteen Au, Au@Pt NP, Au@Pt-DNA of hydrodynamic diameter, (b) zeta potential and (c) UV absorbance. Error bars denote the standard deviation (n = 3).
- Supplementary Fig. S6 NUPACK-predicted secondary structures and Gibbs free energies for (a) H1, (b) H2, (c) H3, (d) H4.
- Supplementary Fig. S7 Optimization of preparation conditions for Au@Pt-DNA Probes and Test Strips.
- Supplementary Fig. S8 Optimization photographs of mbLFIA reaction conditions.
- Supplementary Fig. S9 Optimization photographs of enhancement solution.
- Supplementary Fig. S10 Photos of test strips for detecting different concentrations of CHIKV by mbLFIA in 50-fold diluted mice (a) serum, (b) urine, and (c) saliva, the Photos showing results before and after AEC catalytic amplification.
- Supplementary Fig. S11 Image of CHIKV detection in 36 suspected mice serum samples using mbLFIA method.
- Supplementary Fig. S12 CHIKV detection in 36 suspected mice serum samples by RT-qPCR analysis.
- Supplementary Fig. S13 Monitor the therapeutic efficacy of the antiviral drug favipiravir in CHIKV-infected mice using mbLFIA. Error bars denote the standard deviation (n = 4).
- Copyright: © 2026 by the author(s). Published by Maximum Academic Press on behalf of China Pharmaceutical University. This article is an open access article distributed under Creative Commons Attribution License (CC BY 4.0), visit https://creativecommons.org/licenses/by/4.0/.
-
About this article
Cite this article
Nie Y, Shang C, Fan S, Tan X, Song J, et al. 2026. A multisite bridging mediated lateral flow immunoassay for the enhanced detection of mosquito-borne viruses. Targetome 2(2): e017 doi: 10.48130/targetome-0026-0016 

A multisite bridging mediated lateral flow immunoassay for the enhanced detection of mosquito-borne viruses
- Received: 24 January 2026
- Revised: 21 March 2026
- Accepted: 03 April 2026
- Published online: 30 April 2026
Abstract: The increasing number of infections of mosquito-borne viruses, such as Chikungunya virus (CHIKV), highlight the urgent need for portable diagnostic tools in resource-limited areas, as traditional nucleic acid detection methods are unsuitable for on-site testing because of their reliance on bioenzymes and instruments. Bioenzyme-free nucleic acid amplification methods such as the catalytic hairpin assembly (CHA)-based lateral flow immunoassay (LFIA) have emerged as a promising strategy. However, the detection efficiency is constrained by the limited sites of the amplification products for bridging colorimetric probes to the test line. Herein, we report a multisite bridging mediated LFIA (mbLFIA) strategy, designing amplification products that have multiple sites for bridging colorimetric probes through dual mechanisms, thereby increasing the colorimetric signal by up to 10.8 times at low product concentrations. To further enhance the signal intensity, gold@platinum nanoparticles (Au@Pt NPs) featuring high peroxidase-like activity were used as colorimetric probes, as these can catalyze the oxidation and deposition of 3-amino-9-ethylcarbazole (AEC) on the test line, achieving a detection limit as low as 2 pmol·L−1 for CHIKV. In a clinical evaluation using 36 suspected CHIKV mice serum samples, the method identified 16 positives, with 100% concordance to the reverse transcription polymerase chain reaction (RT-PCR) results, demonstrating high specificity and accuracy. This work provides a novel perspective for optimizing colorimetric signals in LFIA and presents a portable tool for the on-site nucleic acid detection of mosquito-borne viruses.