


-
Cholestatic liver injury is a common liver lesion characterized by impaired formation, secretion, and flow of bile, accompanied by the accumulation of toxic bile acids, inflammation, and hepatic damage. Without effective intervention, it can progress into liver fibrosis, cirrhosis, and even liver cancer[1]. However, available therapeutic options for cholestatic liver injury are limited. Ursodeoxycholic acid (UDCA), the recommended first-line drug, can increase bile acid excretion, yet up to 40% of patients show nonresponsiveness[2]. Therefore, there is an urgent need to develop novel therapeutic targets and drugs for cholestatic liver injury.
Celastrol, recognized by Cell as one of the most promising natural products, has attracted significant attention due to broad pharmacological application in various indications[3]. It exhibits potent anti-cancer, anti-inflammation, anti-obesity, and hepatoprotective effects[3,4]. In rats with intrahepatic cholestasis of pregnancy (ICP), celastrol alleviates cholestasis by reducing serum levels of matrix metalloproteinase (MMP)-2 and MMP-9[5]. It also attenuates cholestatic liver injury induced by α-naphthyl isothiocyanate (ANIT) and thioacetamide (TAA) through the activation of sirtuin 1 (SIRT1) and farnesoid X receptor (FXR), along with the inhibition of nuclear factor-kappa B (NF-κB) and P53 signaling pathways[6]. The KEGG pathway analysis further indicates that celastrol modulates inflammation and bile acid homeostasis[6,7].
Liver nonparenchymal cells have been found to play a driving and promoting role in cholestatic liver injury. Single-cell sequencing and spatial transcriptome analyses reveal an enrichment of nonparenchymal cells, including macrophages, natural killer T (NKT) cells, B cells, and cytotoxic T cells, in the livers of patients with biliary atresia[8,9]. Depleting B cells or blocking antigen presentation can attenuate hepatic damage[8], indicating that targeting hepatic nonparenchymal cells holds promising therapeutic potential for cholestatic liver diseases.
Invariant NKT (iNKT) cells are a specialized subset of innate immune cells that possess characteristics of both T cells and natural killer (NK) cells. They can rapidly produce effector molecules through both T cell receptor (TCR)-dependent mechanisms upon activation by antigen stimulation, and through TCR-independent mechanisms in response to cytokines. Mirroring conventional T cells, iNKT cells can be classified into functional subsets based on the effector molecules they express: iNKT1 (IFN-γ-secreting), iNKT2 (IL-4-secreting), and iNKT17 (IL-17-secreting)[10]. Hepatic iNKT cells, especially iNKT17 cells, increase and participate in the progression of cholestatic liver diseases[11].
Lysosomal proteases, cathepsins, play important roles in the initiation, development, and progression of liver diseases. They are involved in various biological processes, such as apoptosis, autophagy, hepatic stellate cell (HSC) activation, and inflammation. Plasma levels of cathepsin B (CTSB), L, and D are positively correlated with the development of liver fibrosis/cirrhosis in patients with chronic liver diseases. Cathepsins function within complex signaling cascades and networks, such as B-cell lymphoma-2 (Bcl-2), NF-κB, and NOD-like receptor thermal protein domain-associated protein 3 (NLRP3) signaling pathways[12,13]. CTSS is mainly expressed in immune cells. Its expression can be induced by inflammatory stimuli and is implicated in antigen presentation and intracellular protein degradation[14]. CTSS is involved in both direct (CD1d-mediated) and indirect (IL-12-mediated) activation of iNKT cells, as well as in their effector functions, such as IFN-γ secretion[15]. However, how CTSS contributes to cholestasis by modulating iNKT cell activity remains unknown.
Estrogen is a high-risk factor for inducing cholestatic liver injury in individuals undergoing ICP, oral contraceptives, or postmenopausal hormone therapy. Our previous studies demonstrated that iNKT17 cells play a key role in ethinylestradiol (EE)-induced cholestatic liver injury by recruiting neutrophils and monocytes to amplify hepatic inflammation[16]. Moreover, iNKT cell deficiency alleviates ANIT-induced cholestatic liver damage[17]. Despite these findings, the therapeutic targets and pharmacological strategies for regulating iNKT cell subsets in cholestasis remain poorly understood, warranting further exploration.
The present study revealed that celastrol induced a protective iNKT1 bias in the liver microenvironment by suppressing CTSS and enhancing the subsequent autophagy/mitophagy in iNKT cells, thereby ameliorating cholestatic liver injury and fibrosis progression. INKT cells are one of the most evolutionarily conserved subsets of unconventional T cells in mammals, highlighting great potential for clinical translation. Our studies reveal a novel pharmacological mechanism and therapeutic target of celastrol in the treatment of cholestasis. The findings open a way for future drug development, and help rationalize strategies for the prevention and treatment of cholestatic liver injury.
-
EE (CAS: 57-63-6, batch number: E0037) was sourced from TCI chemicals (Shanghai, China), ANIT (CAS: 551-06-4, Cat: N4524) from Sigma-Aldrich (St Louis, MO, USA), carbon tetrachloride (CCl4, CAS: 56-23-5, Cat: yg178) from Jiuding chemicals (Shanghai, China), celastrol (CAS: 34157-83-0, Cat: B20707) from Orileaf (Shanghai, China), Z-FL-COCHO (LY3000328, CAS: 1373215-15-6, Cat: CSN17758) from CSNPharma (Vancouver, BC, Canada), taurocholate (TCA, CAS: 345909-26-4, Cat: T856641) from Macklin (Shanghai, China), TGF-β (Cat: 0804-HNAC) from (Sino Biological Inc., Beijing, China), and chloroquine (CQ, CAS: 54-05-7, Cat: IC4440) from Solarbio (Beijing, China). Leukocyte Activation Cocktail with BD GolgiPlug™ (Cat: 550583) and Cytoperm/Cytofix (Cat: 554714) were purchased from BD Pharmingen. Mouse CD1d-PBS-57 tetramer-APC was kindly provided by the NIH Tetramer Core Facility (Atlanta, GA, USA). All flow cytometry antibodies are listed in Supplementary Table S1.
Animals and treatment
-
Male C57BL/6 J mice (6–8 weeks old, 18–20 g) were obtained from SLAC Laboratory Animal Co., Ltd (Shanghai, China). CD1d-knockout mice, which lack mature NKT cells, were kindly given by Dr. Chuan Su (Nanjing Medical University, Nanjing, China). CTSS knockout (Strain No. T012613, C57BL/6JGpt-Ctssem31Cd10560in1/Gpt) mice were purchased from GemPharmatech Company (Nanjing, Jiangsu, China). All mice were housed under specific pathogen-free conditions (22 ± 2 °C, 12 h light/dark cycle) with free access to water and a standard laboratory diet. After 1 week of acclimation, mice were randomly divided into experimental groups (n = 6). Animal procedures were approved by the Ethics Committee of China Pharmaceutical University (2021-10-003). Mice were treated with EE (i.h. 10 mg·kg−1 in an 80% 1.2-propylene glycol/saline solution), ANIT (i.g. 75 mg·kg−1 in corn oil), celastrol (i.g. 2.5, 5, or 10 mg·kg−1 in 1% DMSO, 2% Tween 80, 97% water), Z-FL-COCHO (i.p. 5 mg·kg−1 in 5% DMSO, 55% saline, and 40% PEG300), or CCl4 (i.p. in mineral oil, either repeatedly [1 : 8 ratio, every 3 d for 9 weeks] to induce fibrosis, or as a single dose [1 : 4 ratio] to induce acute liver injury).
Nonparenchymal cell isolation and labelling, and iNKT cell sorting and sequencing
-
The nonparenchymal cells were isolated as described before[16]. To perform RNA sequencing, the cells were stained with CD3e and CD1d, and then sorted using an Aria flow cytometer (Becton Dickinson, Palo Alto, CA, USA).
For cytokine analysis, cells were stimulated with Leukocyte Activation Cocktail for 4–5 h. Following stimulation, nonparenchymal cells were incubated with anti-CD16/32 blocking antibody, followed by surface staining with fluorescence-conjugated antibodies. Intracellular staining was performed using Cytoperm/Cytofix according to the manufacturer's protocol, with centrifugation steps between each staining to remove unbound antibodies. Cell samples were analyzed on BD C6 or CytoFlex flow cytometers (Becton Dickinson, Palo Alto, CA, USA), and data was processed with FlowJo v10 software (FlowJo, Ashland, OR, USA).
Biochemical and histological assays
-
Serum was collected without an anticoagulant. The levels of alkaline phosphatase (ALP), alanine transaminase (ALT), and aspartate transaminase (AST) were measured using quantification kits (Whitman Biotech, Nanjing, China), while type-III procollagen (PC-III) and hyaluronic acid (HA) levels were determined using ELISA kits (Mreda, Beijing, China).
Fixed livers were paraffin-embedded, sectioned, and stained with H&E for histopathological examination, or with Masson's trichrome and Sirius Red staining to evaluate the degree of fibrosis.
RNA extraction and real-time PCR
-
RNA was extracted from liver sections with TRIzol reagent (Vazyme Biotech, Nanjing, China). The isolated RNA was processed by the HiScript™ Q RT SuperMix for qPCR (+ gDNA wiper) kit (Vazyme Biotech) for cDNA synthesis. Relative mRNA quantities were determined by a 20 μL real-time PCR system. mRNA levels were normalized against those of the housekeeping gene. The primer sequences used are shown in Supplementary Table S2.
Western blot and enzyme-linked immunosorbent assay (ELISA)
-
After the proteins were extracted, their concentrations were determined by the BCA method (Beyotime Biotechnology). Proteins were separated by SDS-PAGE and transferred to a PVDF membrane. The membranes were blocked with a 5% bovine serum albumin (BSA) and incubated with the corresponding primary antibodies, including FXR (55 kDa, 1 : 1,000, BS-12867R, Bioss), CYP2B10 (50 kDa, 1 : 500, sc-73546, Santa Cruz), CYP7A1 (55 kDa, 1 : 500, sc-518007, Santa Cruz), CYP8B1 (55 kDa, 1 : 500, sc-23515, Santa Cruz), CTSS (40 kDa, 1 : 200, sc-74429, Santa Cruz), p62 (62 kDa, 1 : 1,000, 18420-1-AP, Proteintech), LC3I/II (14, 16 kDa, 1 : 1,000, 14600-1-AP, Proteintech), Parkin (52 kDa, 1 : 1,000, 14060-1-AP, Proteintech), PINK1 (63 kDa, 1 : 100, 23274-1-AP, Proteintech), α-SMA (38 kDa, 1 : 1,000, #19245, Cell Signaling), COL1A1 (180 kDa, 1 : 1,000, #72026, Cell Signaling), β-actin (42 kDa, 1 : 5,000, 20536-1-AP, Proteintech), β-tubulin (55 kDa, 1 : 5,000, AF7011, Affinity) and GAPDH (36 kD, 1 : 10,000, Proteintech). After incubation with appropriate secondary antibodies, the blots were detected with an enhanced chemiluminescence kit.
Levels of CTSS in liver homogenate were determined by ELISA (CUSABIO, Cat: CSB-EL006204MO, Wuhan, China) according to the manufacturer's protocol.
Surface plasmon resonance (SPR) experiments and molecular docking
-
SPR experiments were performed using a Biacore S200 system (GE Healthcare, Chicago, IL, USA) at 25 °C to determine the binding affinity between celastrol and recombinant CTSS proteins (17-331 AA, Novoprotein, Suzhou, China). CTSS (10 µg·mL−1 in 10 mmol·L−1 sodium acetate buffer, pH 4.5) was immobilized onto a CM5 sensor chip via amine coupling. Celastrol was serially two-fold diluted in running buffer (1.05 × PBS-P+ with 5% DMSO) to generate 13 concentrations. Association (120 s) and dissociation (300 s) were monitored, and the sensorgrams were fitted to a 1 : 1 Langmuir binding model using Biacore S200 Evaluation Software v3.2 to calculate the equilibrium dissociation constant (KD).
Molecular docking was performed using AutoDock Vina to predict the binding mode between celastrol and CTSS (PDB ID: 4P6E). The CTSS crystal structure was obtained from the Protein Data Bank, and ligand preparation was conducted with AutoDock Tools. The binding pose with the lowest energy was selected, and interacting residues were visualized using PyMOL[18,19].
Cell culture and treatment
-
The AML12 mouse hepatocyte cell line (RRID: CVCL_0140) was purchased from the Type Culture Collection of the Chinese Academy of Sciences (Shanghai, China). The DN32.D3 mouse iNKT cell hybridoma line was kindly provided by Dr. Li Bai. Stock solutions of EE (50 mmol·L−1 in DMSO) and TCA (200 mmol·L−1 in DMSO) were prepared and diluted to working concentrations in culture medium immediately before use.
AML12 or LX-2 cells (RRID: CVCL_5792) were seeded in plates for 24 h. After washing with PBS, cells were treated with 100 μmol·L−1 TCA, 6.25 μmol·L−1 EE, 40 mmol·L−1 CCl4, or 5 ng·mL−1 TGF-β for 6 or 24 h. Following another PBS wash, DN32.D3 cells were pretreated with 5 μmol·L−1 CQ for 4 h, then celastrol and DN32.D3 cells were added for 24 h of co-culture. Cells and supernatants were then collected for subsequent analysis.
Patient samples and peripheral blood mononuclear cell (PBMC) isolation
-
In the analysis of fasting TBA and ICP phenotypes, pregnancies complicated by preeclampsia, HELLP (hemolysis, elevated liver enzymes, and low platelets) syndrome, acute fatty liver of pregnancy, HCV infection, liver damage, extrahepatic biliary obstruction, and HIV were excluded to ensure case specificity. Fasting TBA was defined as the highest observed level for each individual during gestational weeks 13 to 42. ICP cases were identified as pregnancies with pruritus and fasting TBA concentrations ≥10 μmol·L−1 within the same period. Six ICP patients and six healthy pregnant controls were recruited from Zhongda Hospital, Southeast University, with written informed consent obtained from all participants. The study protocol conforms to the ethical guidelines of the 1975 Declaration of Helsinki as reflected in a priori approval by the institution's human research committee (2021ZDSYLL022-P01, Zhongda Hospital Southeast University). Blood was collected in anti-coagulated tubes, which were left on ice immediately. PBMCs were isolated by density gradient centrifugation using Ficoll-Paque PLUS for subsequent RNA extraction.
Lentiviral transduction and CTSS overexpression
-
Lentiviral particles were produced by co-transfecting HEK293T cells (RRID: CVCL_0063) with the transfer plasmid (pBosLV3-CMV-Ctss or empty vector, Bioscien), packaging plasmid psPAX2, and envelope plasmid pMD2.G using Lipofectamine 3000 (Thermo Fisher Scientific). Viral supernatants were collected at 48- and 72-h post-transfection, filtered through 0.45 μm filters, and stored at −80 °C.
For stable CTSS overexpression, DN32.D3 cells were transduced with viral supernatant in the presence of 4 μg·mL−1 polybrene (Merck). Puromycin selection (2 μg·mL−1) was initiated 48 h post-transduction and maintained for 7 d to establish stable cell pools.
Stable CTSS knockdown in DN32.D3 cells
-
HEK293T cells were transfected with shCTSS (shCTSS_Mus-1 in piko.1-EmGFP-PURO, BIOSCINE) or shNC along with psPAX2 and pMD2.G using Lipofectamine 3000, and viral supernatants were collected. We then infected DN32.D3 cells with the viruses and selected for a stable cell line using 4 μg·mL−1 puromycin.
Data analysis
-
The single-cell RNA sequencing dataset GSE166178, GSE134037, and GSE136103 were analyzed using the Seurat package. Data underwent standard preprocessing, normalization, and scaling. Dimensionality reduction was performed with principal component analysis (PCA) followed by graph-based clustering to identify distinct cell populations, visualized using Uniform Manifold Approximation and Projection (UMAP). Differentially expressed gene (DEG) analysis in NKT cells was conducted using the Wilcoxon rank-sum test, which was subjected to KEGG pathway enrichment analysis via clusterProfiler.
Three additional RNA-seq datasets (Supplementary Table S3) were analyzed using limma to identify DEGs (|log2FC| > 1, P < 0.05). Volcano plots and KEGG enrichment bubble charts were generated using ggplot2 and clusterProfiler, respectively.
Statistical analysis
-
Data are presented as mean ± SEM and were analyzed using GraphPad Prism 7. Differences between the two groups were assessed by Student's t-test, while multiple group comparisons were performed using one-way ANOVA followed by Dunnett's test. A P-value < 0.05 was considered statistically significant.
-
We evaluated celastrol's protective effects using established EE- and ANIT-induced cholestasis models (Fig. 1a and f). Celastrol significantly improved the cholestatic phenotype, reducing liver/body weight ratios and serum AST, ALT, and ALP levels (Fig. 1b and g). Histopathological examination further confirmed attenuated necrosis (black arrows), inflammatory cell infiltration (red arrows), and pseudocholangiolar duct proliferation (yellow arrows) (Fig. 1c and h).
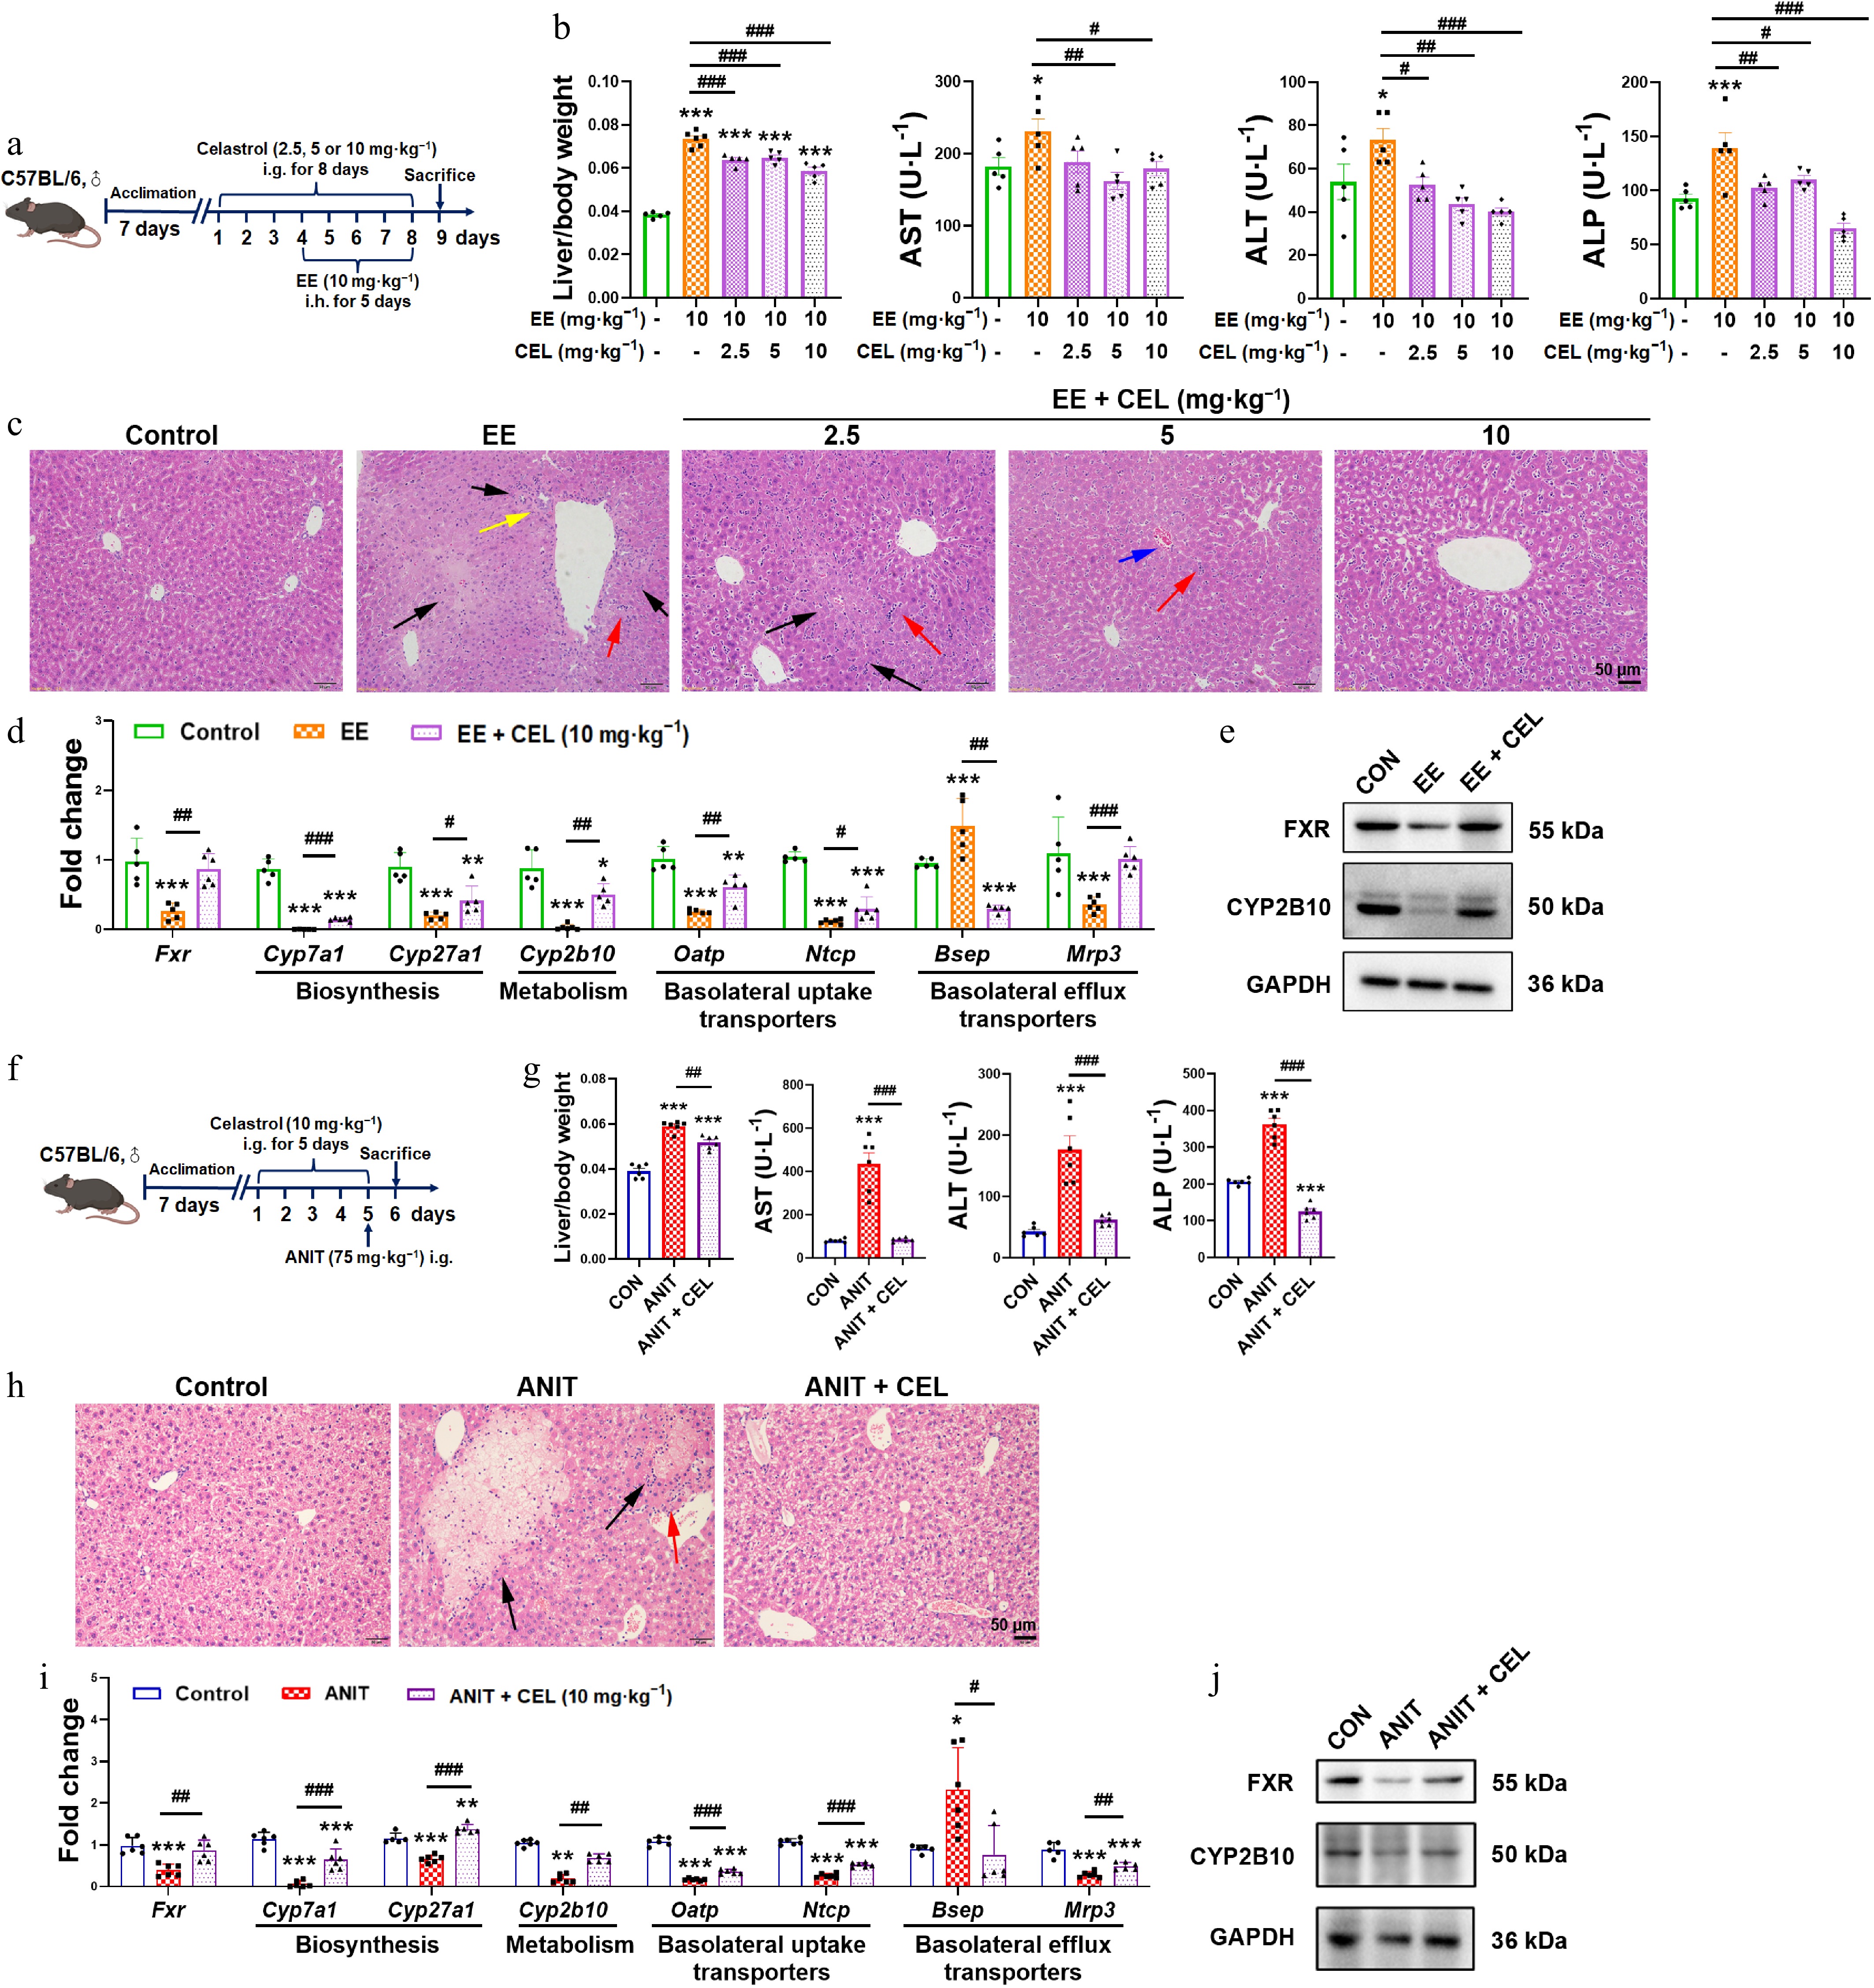
Figure 1.
Celastrol protects against EE- and ANIT-induced cholestasis. (a) The administration methods of celastrol and EE. (b), (g) Liver/body weight ratio, and the serum levels of AST, ALT, and ALP. (c), (h) H&E staining of liver (200 ×, scale bar = 50 μm, black arrow: necrosis; red arrows: inflammatory infiltration; yellow arrows: proliferation of the pseudocholangiolar duct; blue arrows: hepatic sinusoidal congestion). (d), (i) The mRNA expression of key genes related to bile acid homeostasis. (e), (j) The protein levels of FXR and CYP2B10. (f) The administration methods of celastrol and ANIT. Data are presented as mean ± SEM, n = 5–6, * P < 0.05, ** P < 0.01, *** P < 0.001 vs control group; # P < 0.05, ## P < 0.01, ### P < 0.001 vs EE or ANIT group.
Mechanistically, celastrol restored the suppressed expression of nuclear receptor FXR at both the transcriptional and protein levels (Fig. 1d, e, i and j). It also normalized dysregulated bile acid homeostasis, reversing the suppression of bile acid synthesis (Cyp7a1, Cyp27a1), metabolism (Cyp2b10), uptake transporters (organic anion transporting polypeptide [Oatp] and sodium taurocholate cotransporting polypeptide [Ntcp]), and alternative efflux transporter (multidrug resistance protein 3, Mrp3), while modulating the elevated expression of the canonical efflux pump (bile salt export pump, Bsep) (Fig. 1d and i). The protein levels of CYP2B10 were also recovered by celastrol (Fig. 1e and j).
This data demonstrated that celastrol protected against EE- and ANIT-induced cholestasis.
Celastrol promotes protective iNKT1 polarization via hepatocyte crosstalk
-
Our previous studies have shown that iNKT17 cells play a key role in EE-induced cholestasis, and that iNKT cell deficiency protects against ANIT-induced cholestasis[16,17]. Therefore, we investigated the effect of celastrol on iNKT cells. CD3eintCD1d-PBS57 tetramer+ was used as the specific marker to identify iNKT cells (Fig. 2a). Compared to the EE- and ANIT-induced cholestasis groups, celastrol promoted the activation of iNKT cells (CD69+ iNKT cells), increased the percentage of iNKT1 cells (IFN-γ+ iNKT cells), and decreased the percentage of iNKT17 cells (IL-17+ iNKT cells), skewing an iNKT17 subtype bias towards an iNKT1 subtype bias (Fig. 2b–e). Unlike traditional Th1 and Th2 cells, iNKT1 cells are considered protective, whereas iNKT2 cells can upregulate the expression of FasL and granzyme B to induce liver injury[20,21].
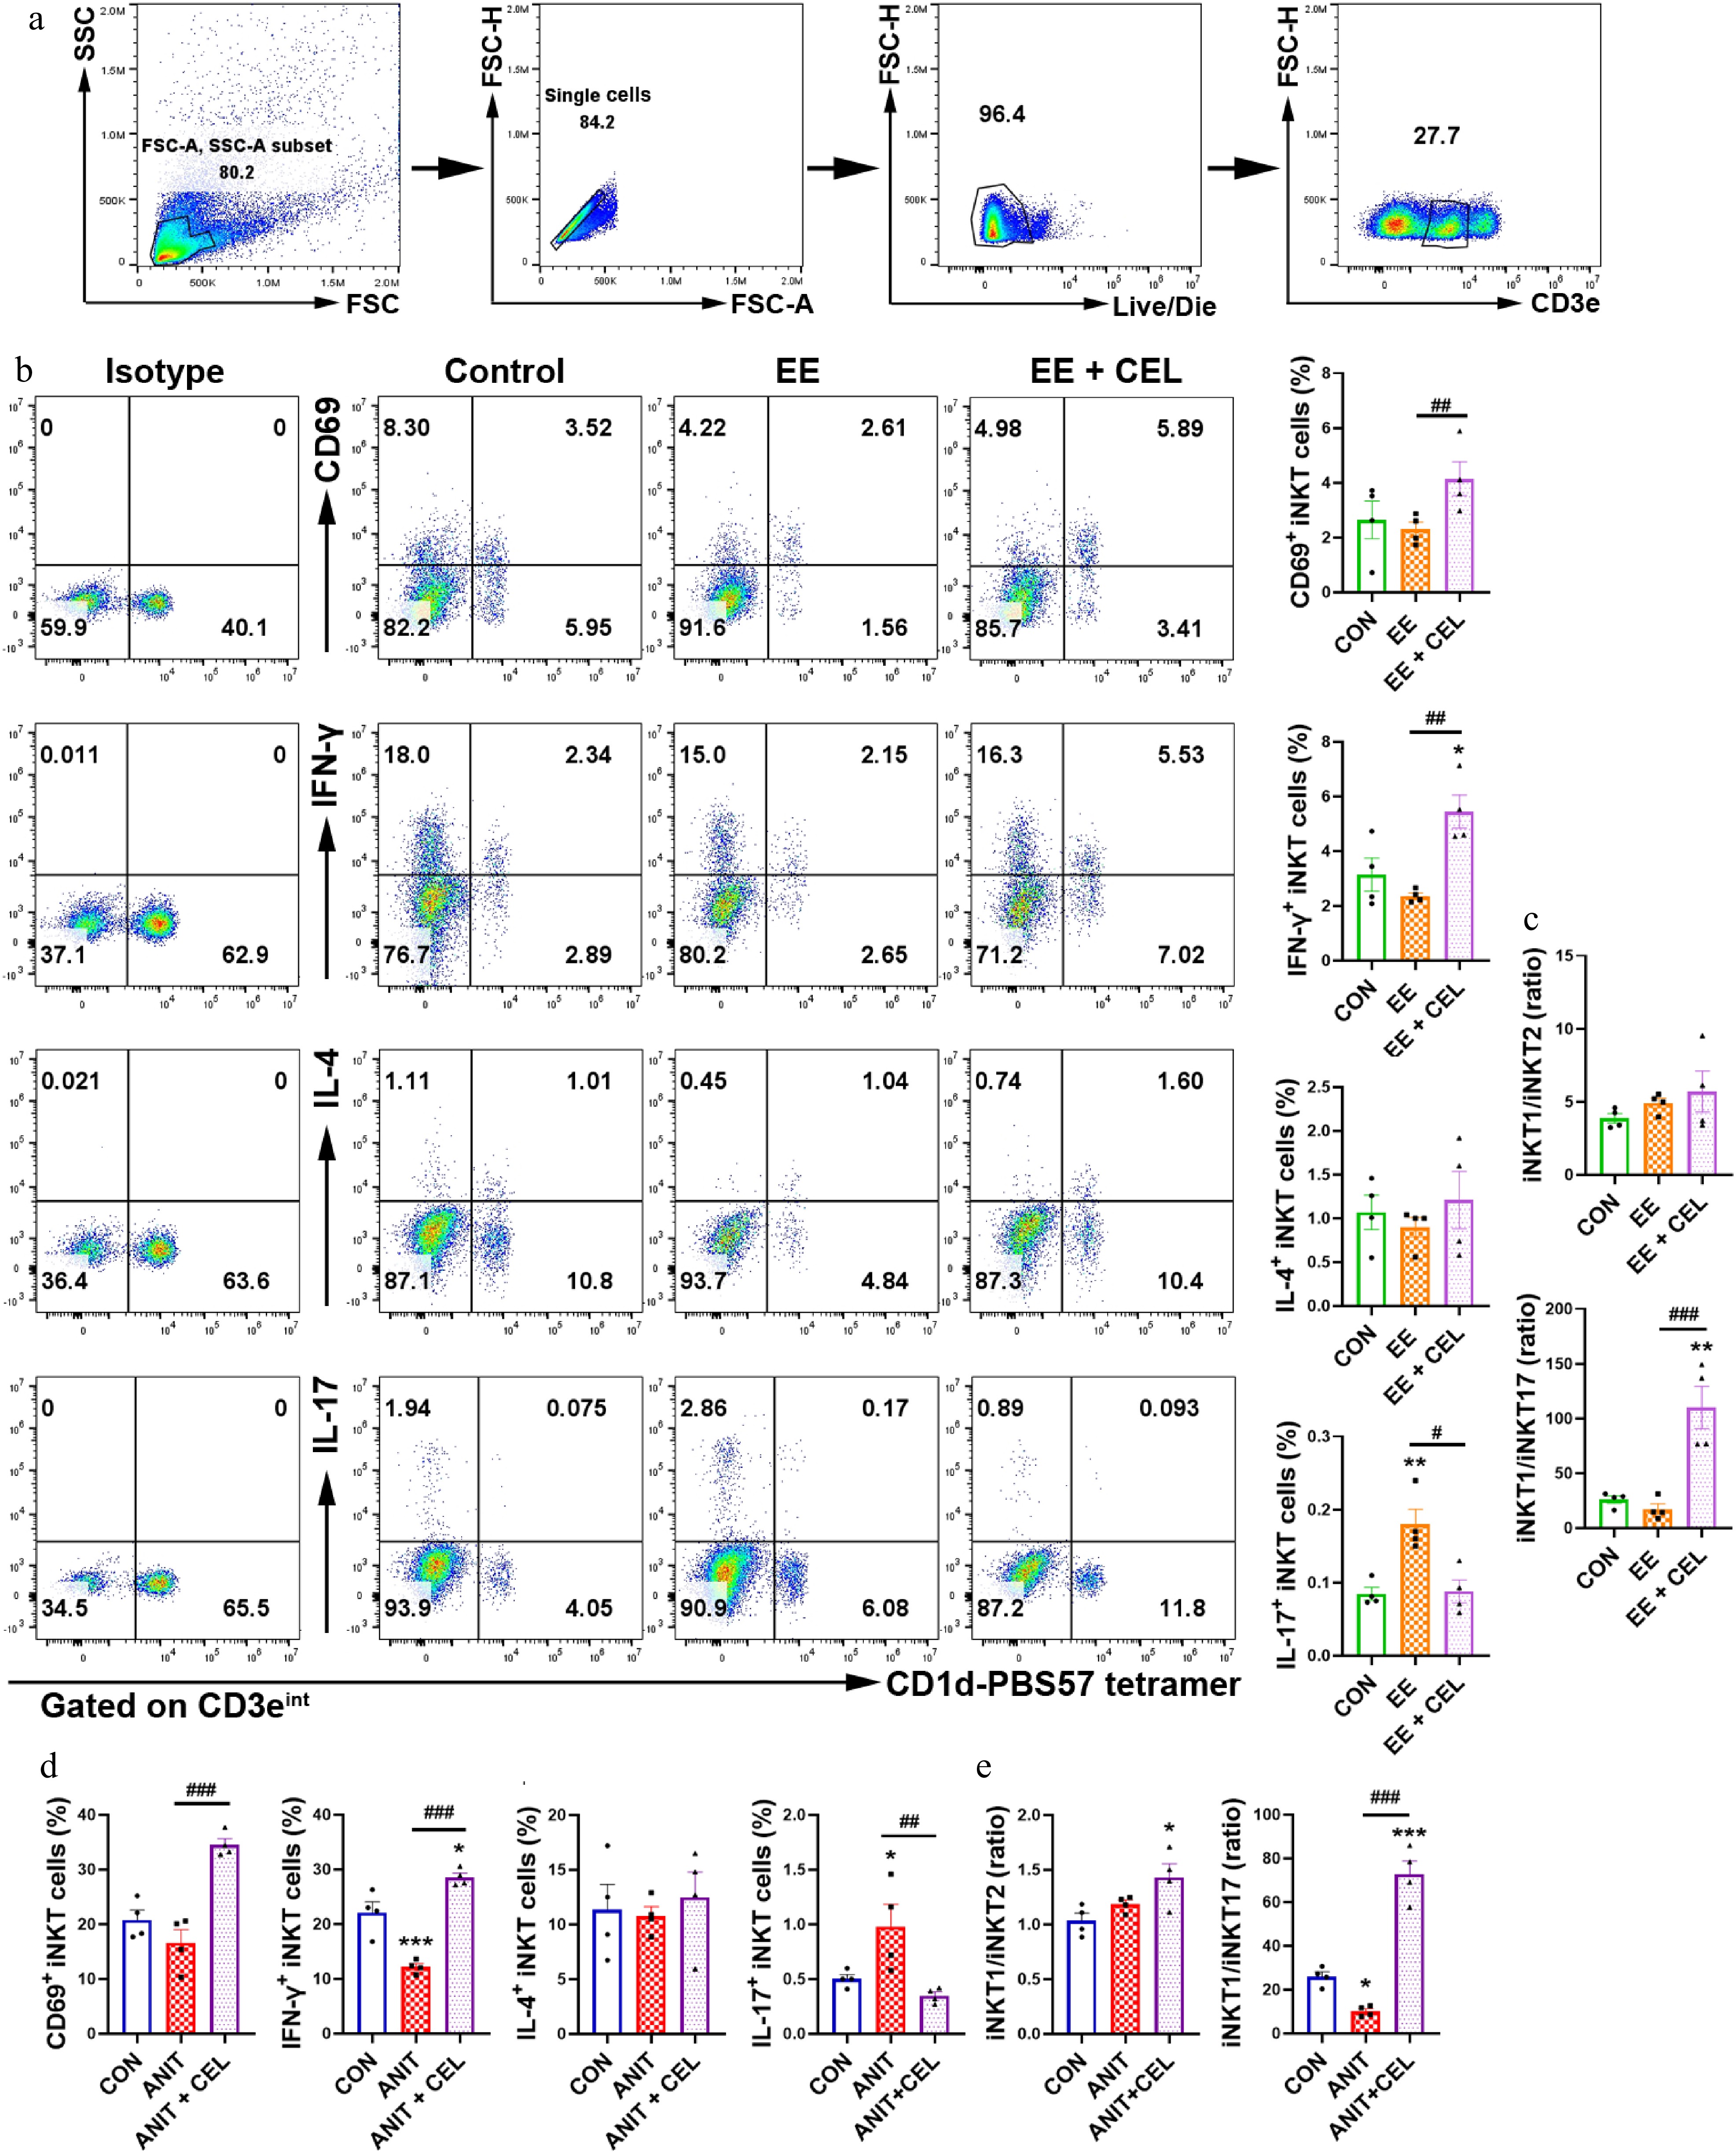
Figure 2.
Celastrol promotes an iNKT1 subtype bias in cholestatic liver. (a) The gating strategy for iNKT cells (CD3eintCD1d-PBS-57 tetramer+). (b), (d) The percentage and analysis of CD69+ iNKT cells, IFN-γ+ iNKT1, IL-4+ iNKT2, and IL-17+ iNKT17 cells, respectively. (c), (e) iNKT1/iNKT2 ratio, iNKT1/iNKT17 ratio. Data are presented as mean ± SEM, n = 4, * P < 0.05, ** P < 0.01, *** P < 0.001 vs control group; # P < 0.05, ## P < 0.01, ### P < 0.001 vs EE or ANIT group.
In vitro, celastrol activated DN32.D3 cells in monocultures, but did not induce subtype bias (Supplementary Fig. S1a and S1b). Considering the in vivo results, we employed two co-culture models to investigate the cells interacting with iNKT cells in the liver microenvironment (Fig. 3b; Supplementary Fig. S1c). In iNKT-hepatocyte co-cultures at concentrations that do not affect cell proliferation (Fig. 3a), TCA-induced cholestatic liver injury in AML12 cells was aggravated in co-culture with DN32.D3 cells, while celastrol alleviated hepatotoxicity in both AML12 cells and the co-culture system (Fig. 3c). In the co-culture system, celastrol recovered the protein levels of CYP7A1, CYP8B1, and FXR, which were decreased by TCA treatment (Fig. 3d). Celastrol also mitigated liver damage in the EE-treated co-culture system (Fig. 3h). Compared with the TCA or EE treatment alone, celastrol increased IFN-γ secretion and reduced IL-4 and IL-17 secretion by DN32.D3 cells (Fig. 3e and i), also suggesting an iNKT1 subtype bias (Fig. 3f and j). In AML12 cells of the co-culture system, celastrol lowered the TCA-induced elevation in the mRNA levels of Cd1d and Il12 (Fig. 3g), suggesting celastrol modulated both direct (CD1d-mediated) and indirect (IL-12-mediated) iNKT cell activation via their interaction with hepatocytes.
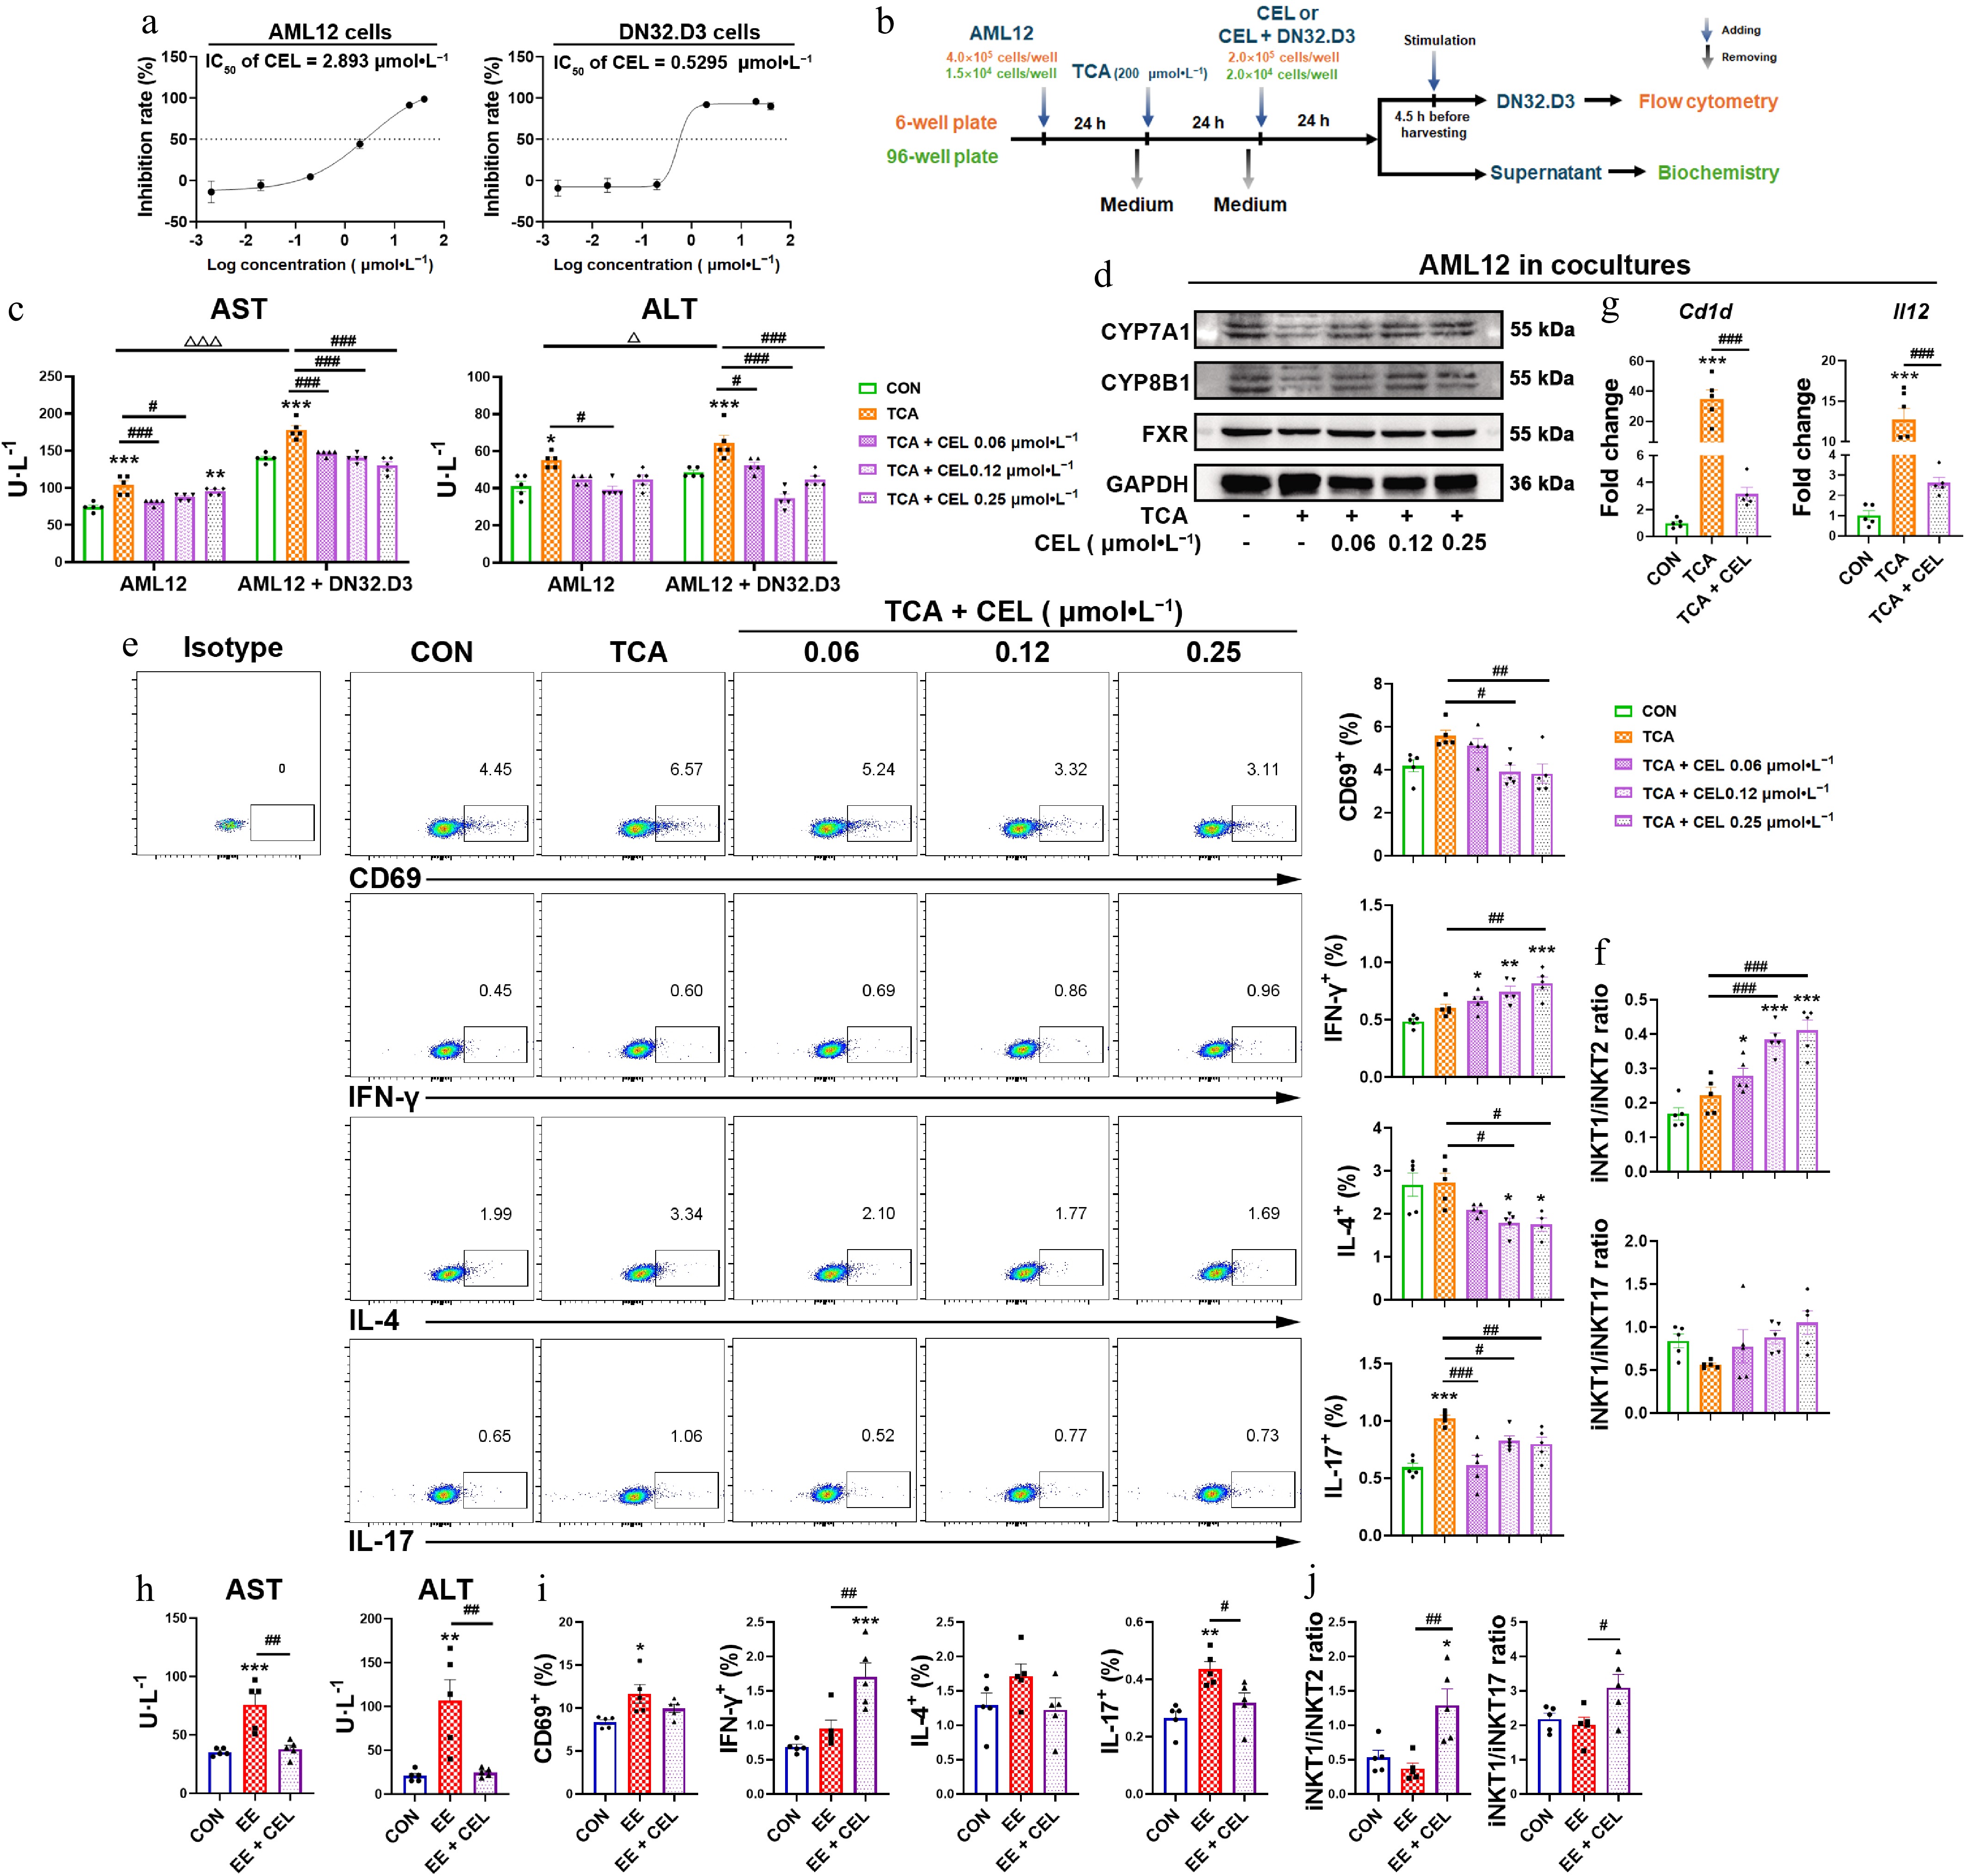
Figure 3.
Celastrol induces an iNKT1 subtype bias in iNKT-hepatocyte co-cultures. (a) The IC50 value of AML12 cells and DN32.D3 cells treated with celastrol. (b) In vitro co-culture method of AML12 cells and DN32.D3 cells, and the method of TCA and celastrol administration. In the in vitro co-culture system, (c), (h) the levels of AST and ALT in the cell supernatant. (d) The protein levels of CYP7A1, CYP8B1, and FXR in AML12 cells. (e), (i) Activation (CD69) and cytokine production (IFN-γ, IL-4, IL-17) by DN32.D3 cells. (f), (j) iNKT1/iNKT2 ratio, iNKT1/iNKT17 ratio. (g) The mRNA levels of Cd1d and Il12 in AML12 cells of the co-culture system. Data are presented as mean ± SEM, n = 5, * P < 0.05, ** P < 0.001, *** P < 0.0001 vs control group; # P < 0.05, ## P < 0.001, ### P < 0.0001 vs TCA or EE group; Δ P < 0.05, ΔΔΔ P < 0.001 vs AML12 cells.
Although celastrol can also activate DN32.D3 cells when they were co-cultured with RAW264.7 cells at concentrations that do not affect cell proliferation (Supplementary Fig. S1d), it increased the secretion of IL-4 and IL-17 compared to the LPS group, resulting in an iNKT17 bias (Supplementary Fig. S1e and S1f).
Thus, celastrol preferentially induced a protective iNKT1 polarization through the interaction with hepatocytes, thereby exerting a hepatoprotective effect.
Celastrol downregulates CTSS and promotes autophagy/mitophagy in iNKT cells
-
To identify potential targets of celastrol, we used flow cytometry to isolate liver iNKT cells (purity > 99%) from the ANIT group and the combined ANIT-and-celastrol group. After transcriptome sequencing, KEGG analysis showed that celastrol significantly affected phagosome, antigen processing and presentation, and lysosome pathways (Fig. 4a). The protein-protein interaction (PPI) network analysis indicated that CTSS was the central target of antigen processing and presentation (Fig. 4a).
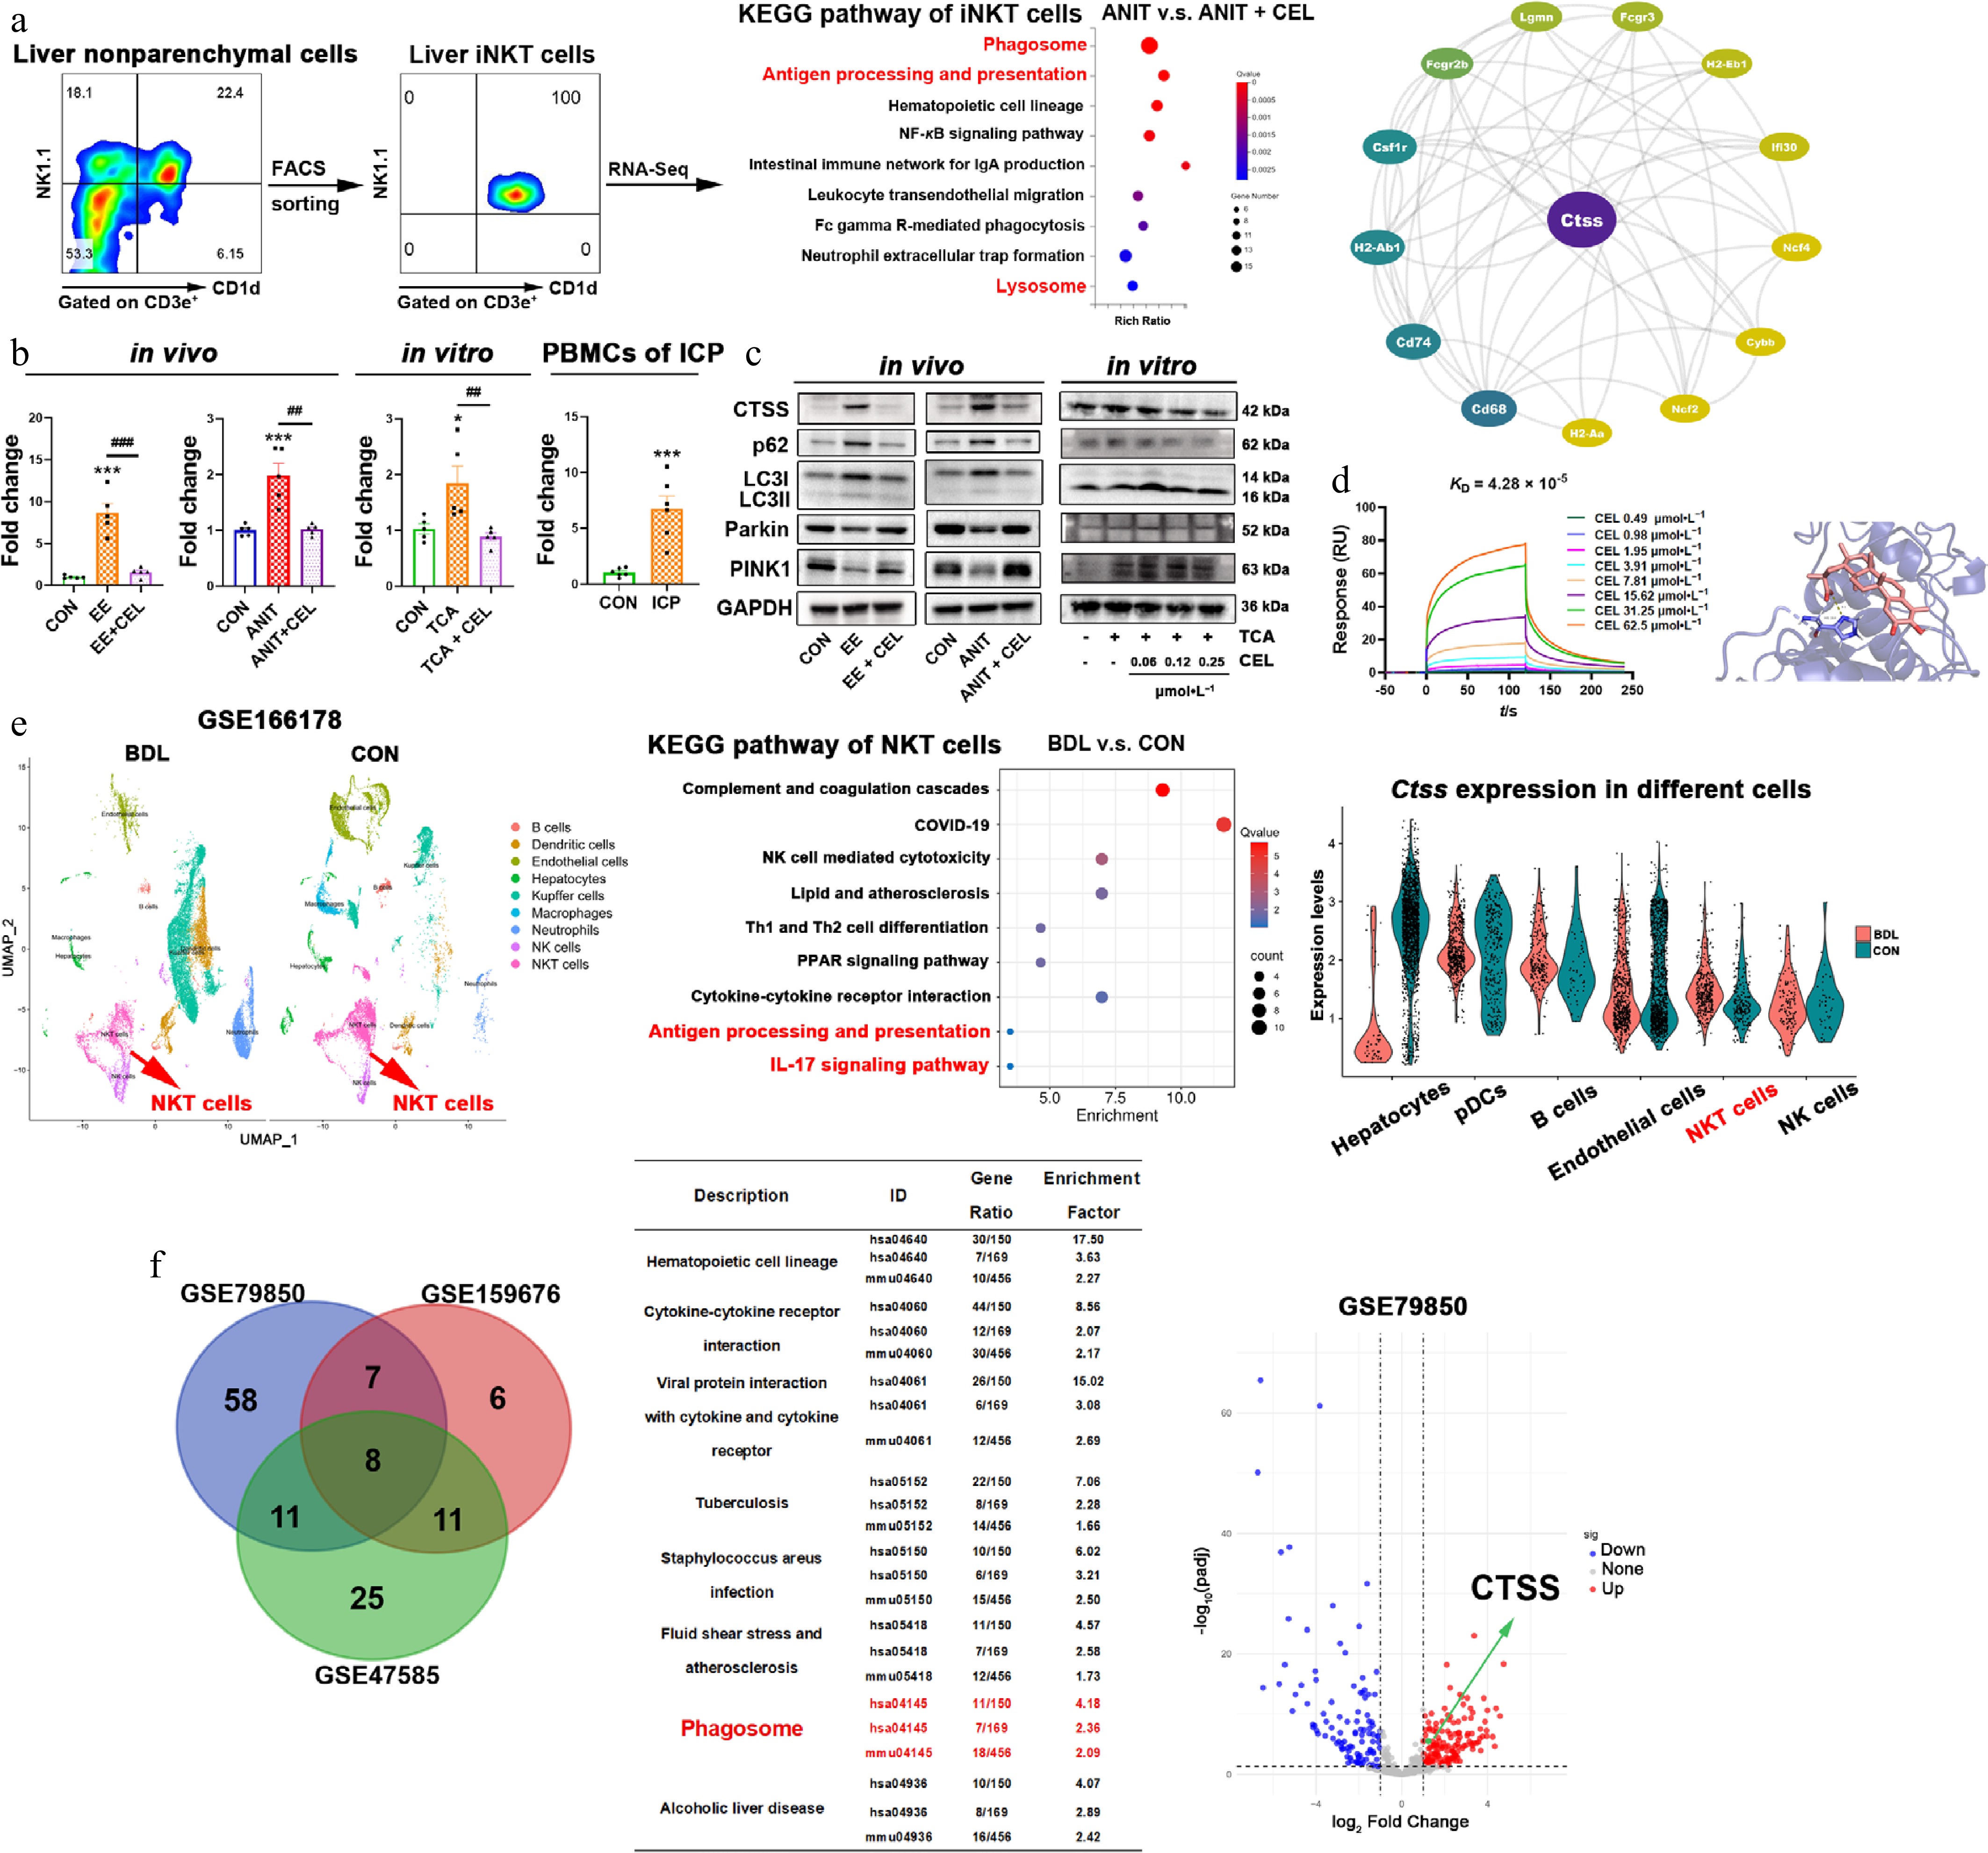
Figure 4.
Celastrol downregulates CTSS and promotes autophagy/mitophagy in iNKT cells. (a) The results of flow cytometry sorting liver iNKT cells, KEGG enrichment pathway analysis of differentially expressed genes (DEGs) using transcriptome sequencing, and protein-protein interaction (PPI) analysis. (b) The CTSS mRNA levels in vivo, in vitro, and in patients. Data are presented as mean ± SEM, n = 5–6, * P < 0.05, *** P < 0.001 vs control group; ## P < 0.01, ### P < 0.001 vs EE, ANIT, or TCA group. (c) The protein levels of CTSS, p62, LC3I/II, Parkin, and PINK1 in vivo, and in vitro. (d) The equilibrium dissociation constant (KD) was obtained by surface plasmon resonance (SPR) experiments using recombinant CTSS protein and celastrol. The binding region and linking amino acids were predicted through molecular docking between celastrol and CTSS (dashed line represents the hydrogen bonding force between CTSS and celastrol, which was 3.1 Å). (e) UMAP visualization of liver nonparenchymal cells from bile duct ligation (BDL) and control (CON) mice in the single cell sequencing dataset (GSE166178). KEGG analysis of upregulated DEGs in NKT cells, and cell type-specific CTSS expression. (f) Venn diagram of shared KEGG pathways from three datasets (liver of patients or mice with cholestasis and healthy controls), and volcano plot from GSE79850.
In both in vivo and in vitro models, cholestasis upregulated CTSS gene and protein levels, while celastrol downregulated CTSS expression (Fig. 4b and c). More importantly, the mRNA levels of CTSS in PBMCs from ICP patients were significantly higher than those from healthy pregnant women (Fig. 4b). Phagosomes and lysosomes are involved in the process of autophagy. CTSS is also critical for the degradation and modulation events of autophagy to maintain cellular proteostasis and lysosomal functions[22]. In cholestasis models, the expressions of both autophagy markers (p62 and LC3II/I) and mitophagy markers (Parkin and PINK1) were decreased, whereas celastrol recovered their expressions (Fig. 4c).
To characterize the direct interaction between celastrol and CTSS, SPR assays were performed using the recombinant CTSS protein. Celastrol exhibited binding affinity to CTSS, with an equilibrium dissociation constant (KD) of 4.28 × 10⁻⁵ mol·L−1 (Fig. 4d). Furthermore, molecular docking analysis using AutoDock Vina was employed to predict the potential binding mode between celastrol and CTSS. The predicted binding energy was −9.2 kcal·mol−1, and a hydrogen bond interaction was identified between celastrol and His164 of CTSS (Fig. 4d), suggesting a stable and specific binding conformation.
We further analyzed a public dataset of 10× Genomics single cell sequencing (GSE166178) and visualized nine different liver nonparenchymal cell types from bile duct ligation (BDL) and control (CON) mice, which were distinguished by color through UMAP mapping. The results showed significant differences in NKT cells between BDL and CON mice. KEGG analysis revealed a significant upregulation of the antigen processing and presentation, and the IL-17 signaling pathway in NKT cells (Fig. 4e). In BDL mice, the expression of CTSS increased in NKT cells, but not in hepatocytes, pDCs, endothelial cells, or NK cells (Fig. 4e). Moreover, KEGG enrichment analysis was performed on differentially expressed genes (DEGs) in the liver of cholestatic patients, or mice, and the healthy controls. The intersection of the three datasets was found to be enriched in eight pathways, including phagosome (Fig. 4f). The volcano plot of GSE79850 also showed an elevation in CTSS expression in the livers of patients with cholestasis (Fig. 4f). The above results suggest that CTSS is a potential pathological target in cholestatic liver injury and a potential pharmacological target of celastrol.
CTSS inhibition attenuates cholestatic injury via autophagy restoration
-
To first substantiate the central role of iNKT cells in driving CTSS expression, we employed CD1d-deficient (CD1d KO) mice, which lack NKT cells. Importantly, the cholestasis-induced upregulation of hepatic Ctss mRNA was markedly abolished in CD1d KO mice (Fig. 5a), providing compelling evidence that iNKT cells were the primary cellular source of CTSS in the cholestatic milieu. CD1d KO mice exhibited significantly attenuated cholestatic liver injury compared to WT mice, while the hepatoprotective effect of celastrol was abolished in CD1d KO mice, demonstrating that NKT cells are critical for celastrol to alleviate cholestatic hepatotoxicity (Fig. 5b and c).
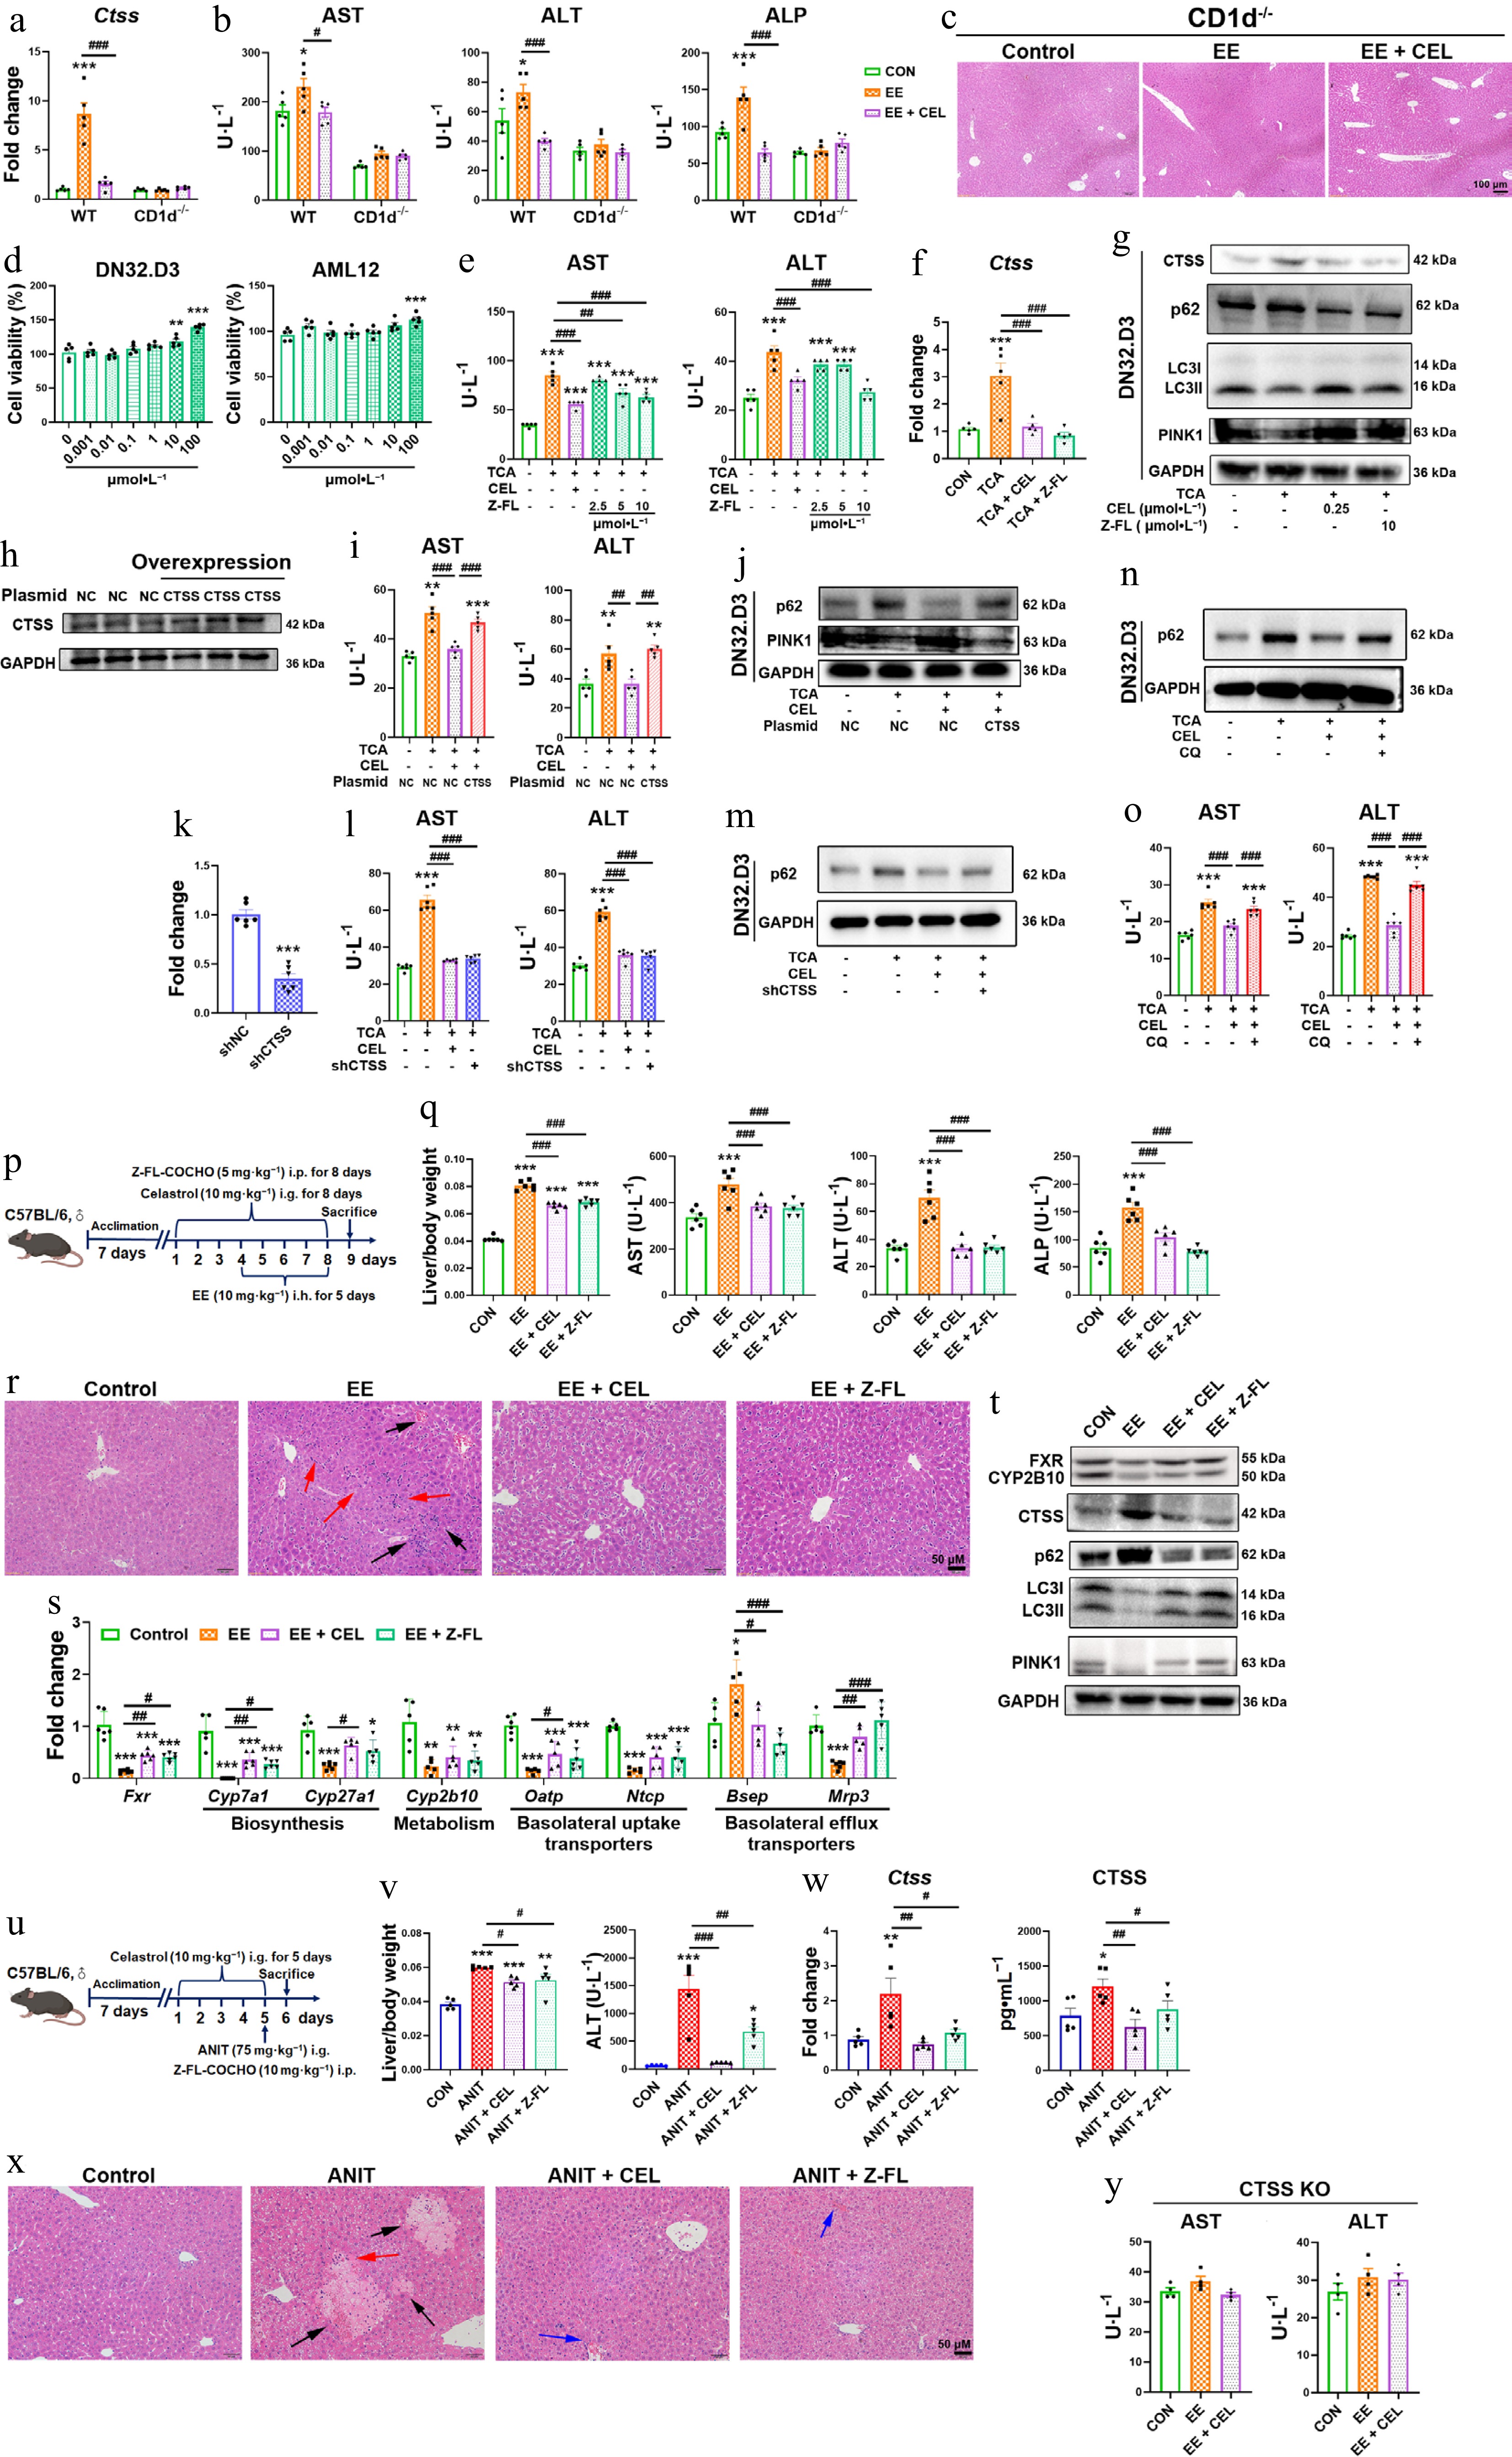
Figure 5.
CTSS inhibition protects against cholestatic liver injury. (a) CTSS mRNA expressions, and (b) serum AST, ALT, and ALP levels in CD1d–/– mice. (c), (r) and (x) H&E staining of liver (black arrow: necrosis; red arrows: inflammatory infiltration; blue arrows: hepatic sinusoidal congestion). (d) Cell viability of DN32.D3 and AML12 cells treated with Z-FL-COCHO. In co-culture, (e), (i), (l) and (o) AST and ALT levels in supernatant. (f) The mRNA expressions of Ctss in DN32.D3 cells. (g) Protein levels of autophagy/mitophagy markers in DN32.D3 cells. (h) CTSS overexpression in DN32.D3 cells. (j) Autophagy/mitophagy markers in CTSS-overexpressing DN32.D3 cells. (k) After shRNA-mediated knockdown of CTSS, the mRNA expression of Ctss in DN32.D3 cells. (m), (n) Protein levels of p62 in shCTSS-expressing or chloroquine (CQ)-treated DN32.D3 cells. (p), (u) The administration methods. (q) Liver/body weight ratio, and the serum levels of AST, ALT, and ALP. (s) The mRNA expression of key genes related to bile acid homeostasis. (t) The protein levels of FXR, CYP2B10, CTSS, p62, LC3I/II, and PINK1. (v) Liver/body weight ratio and the serum levels of ALT in ANIT-induced cholestasis. (w) The mRNA and protein levels of CTSS. (y) The serum levels of AST and ALT in CTSS knockout mice. Data are presented as mean ± SEM, n = 5–6, * P < 0.05, ** P < 0.01, *** P < 0.001 vs control group; # P < 0.05, ## P < 0.01, ### P < 0.001 vs EE, ANIT, TCA, or CEL group.
In co-culture, the CTSS inhibitor Z-FL-COCHO mitigated TCA-induced hepatotoxicity, suppressed CTSS upregulation and promoted autophagy/mitophagy (Fig. 5d–g). Notably, CTSS overexpression in DN32.D3 cells abolished celastrol's benefits, including reduced ALT/AST release and restored autophagy/mitophagy (Fig. 5h–j). Knockdown of CTSS expression in DN32.D3 cells also decreased AST and ALT levels in the cell supernatant, and inhibited p62 protein expression in DN32.D3 cells, indicating that genetic suppression of CTSS also showed hepatoprotection and autophagy restoration (Fig 5k–m). Moreover, the hepatoprotective effect of celastrol was eliminated by blocking lysosomal degradation with CQ, revealing that autophagy restoration was crucial for the hepatoprotection of celastrol (Fig. 5n and o).
To further validate CTSS as a therapeutic target, we administered the CTSS inhibitor Z-FL-COCHO in cholestatic models (Fig. 5p and u). Both celastrol and Z-FL-COCHO ameliorated cholestatic phenotypes, reducing liver/body weight ratios, and serum AST, ALT, and ALP levels, and improving histopathology in EE- and ANIT-induced models (Fig. 5q, r, v and x). Mechanistically, Z-FL-COCHO treatments restored FXR expression and bile acid regulators (Cyp7a1, Mrp3, Bsep, and CYP2B10), suppressed CTSS upregulation, and enhanced autophagy/mitophagy (decreased p62, increased LC3II/I, PINK1) (Fig. 5s, t and w). More importantly, the liver-protective effect of celastrol was abolished after CTSS was knocked out (Fig. 5y). These results confirmed that CTSS was central to celastrol's mechanism, sufficient to alleviate cholestasis and restore autophagic flux.
CTSS inhibition promotes an iNKT1 subtype polarization
-
In EE/ANIT-induced cholestasis, Z-FL-COCHO decreased the percentage of hepatic iNKT17 cells, leading to an iNKT1 subtype bias (Fig. 6a–d). In the co-culture system, celastrol and Z-FL-COCHO both increased the secretion of IFN-γ, and decreased the secretion of IL-4 and IL-17 by DN32.D3 cells compared to the TCA group, indicating a bias towards an iNKT1 subtype (Fig. 6e and f). Furthermore, the iNKT1 subtype bias induced by celastrol was abolished by CQ, indicating that autophagy played a key role in the iNKT1 cell polarization of celastrol (Fig. 6g and h). Notably, CTSS knockout skewed the iNKT1 cell polarization of celastrol to the pathogenic iNKT17 bias (Fig. 6i and j). Therefore, CTSS-autophagy induced a protective iNKT1 bias in the liver microenvironment in cholestasis.
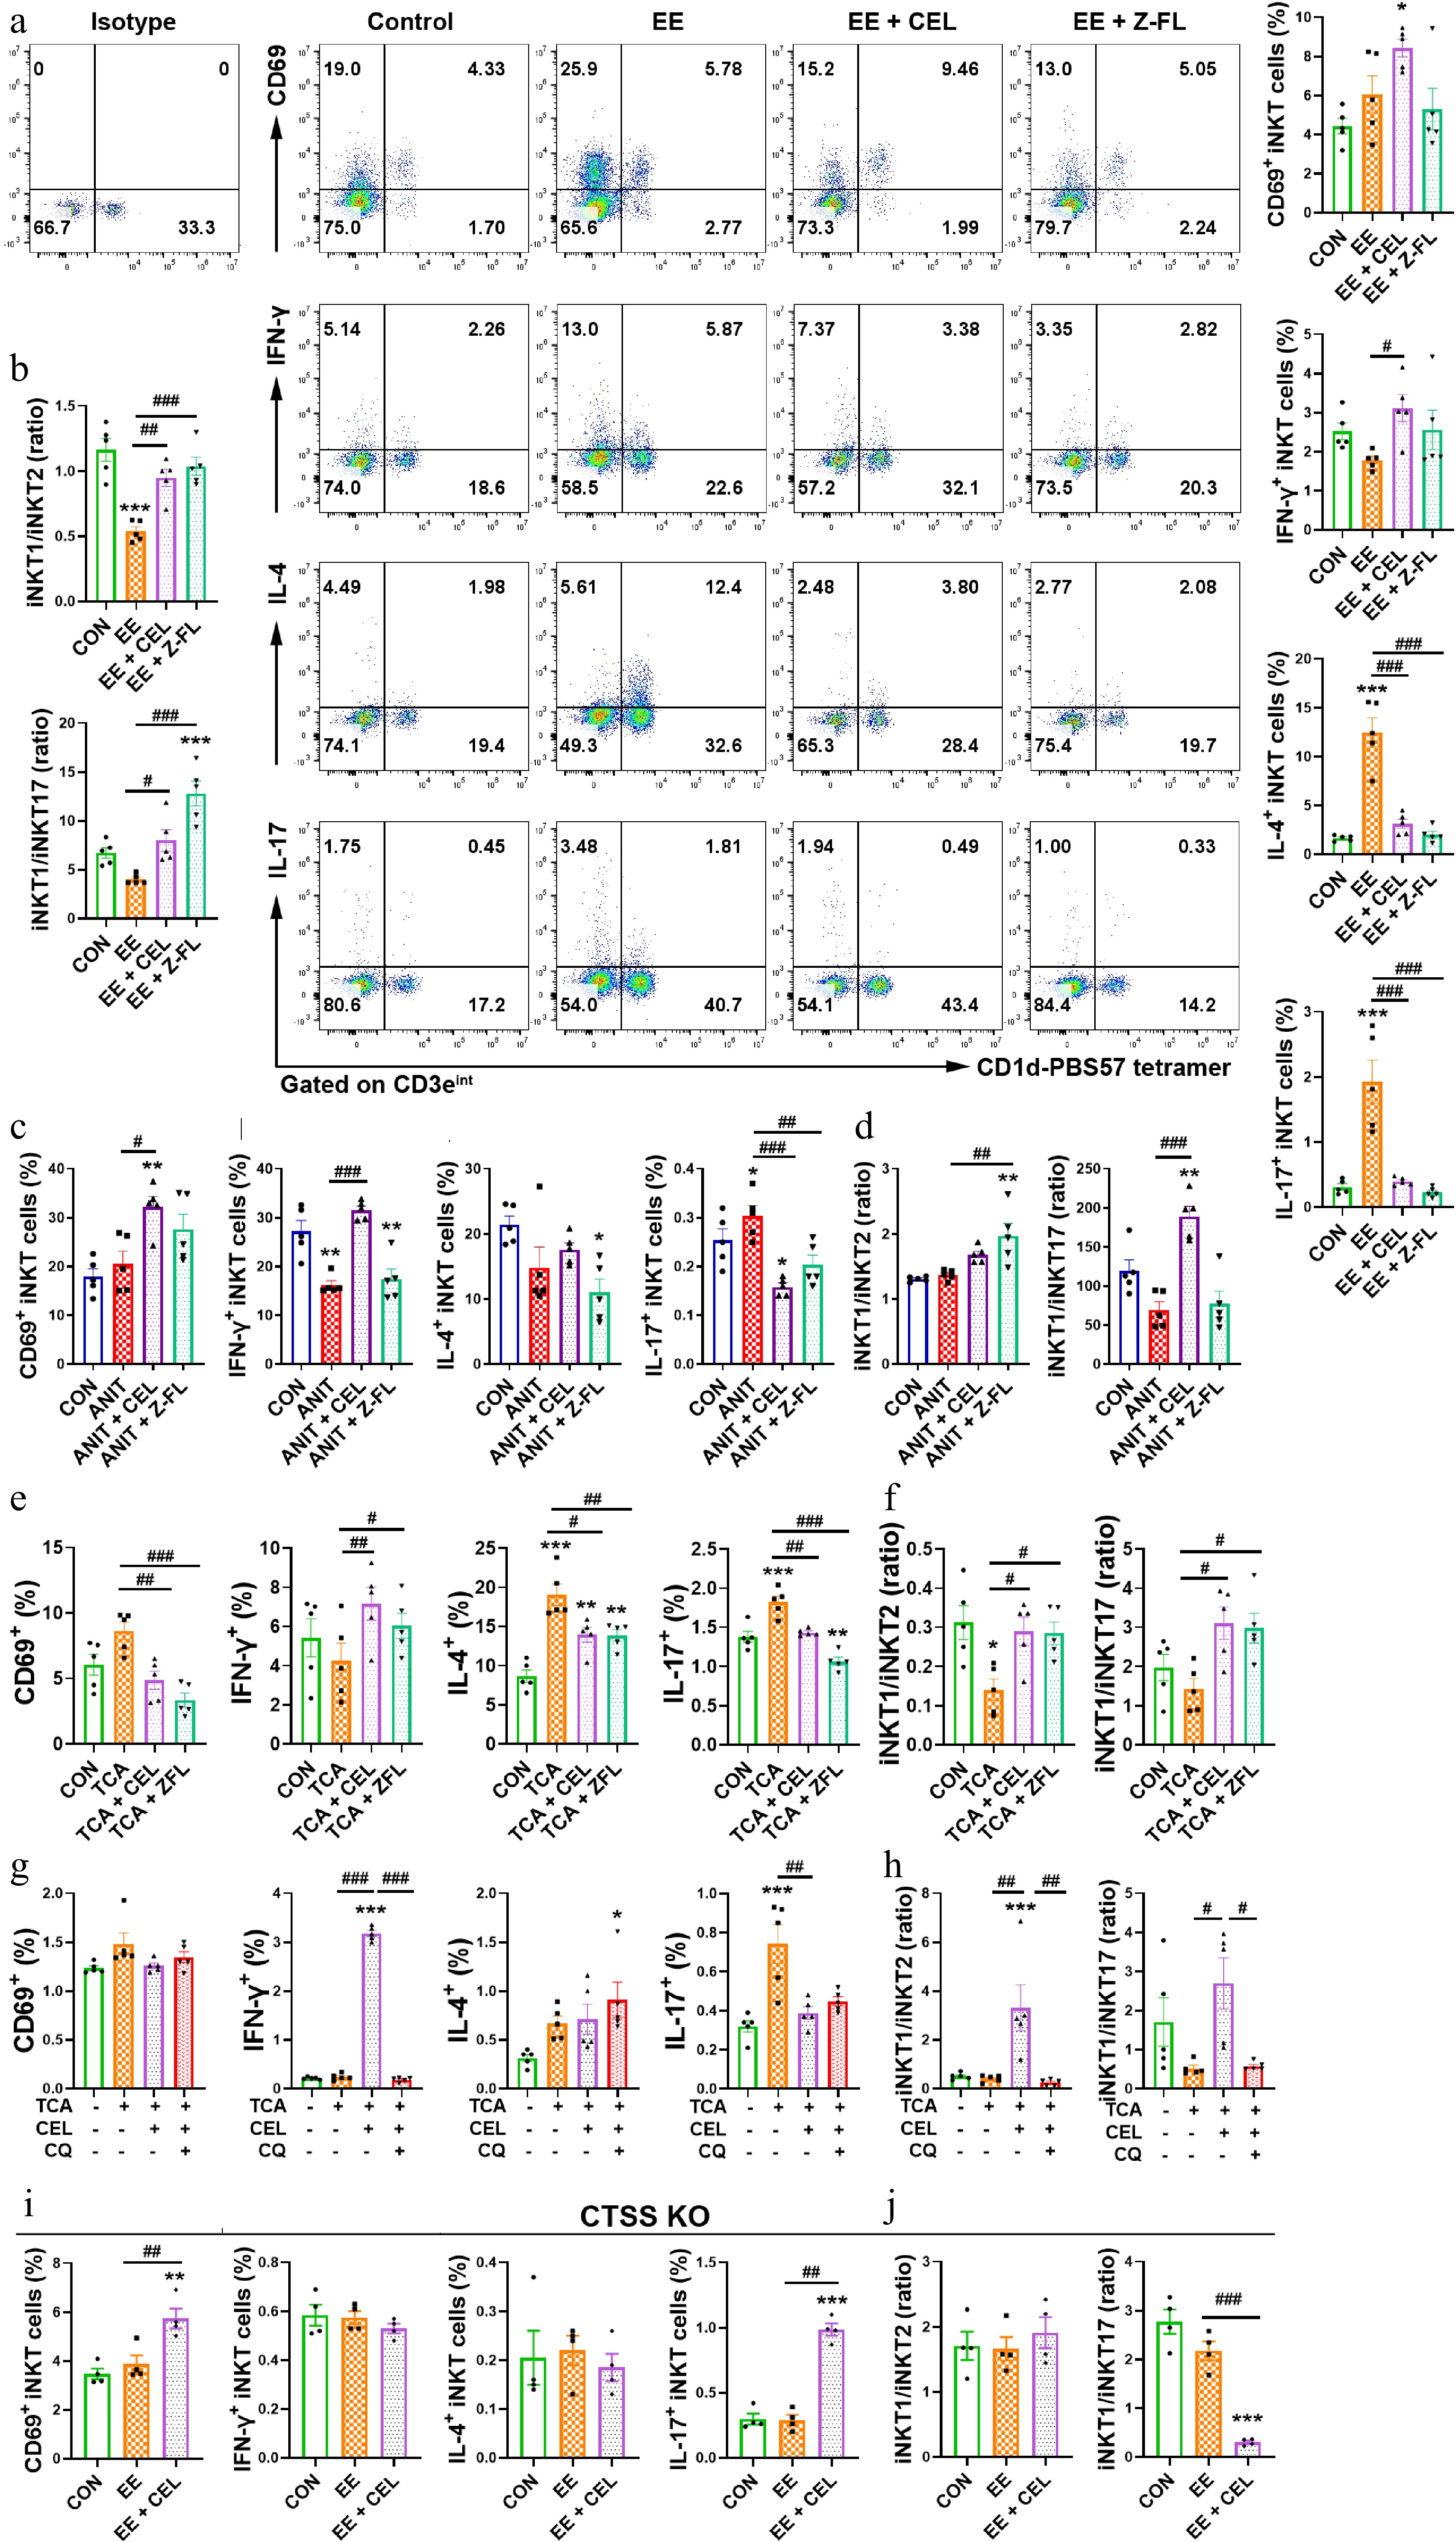
Figure 6.
CTSS inhibition promotes an iNKT1 subtype bias. (a), (c), (e), (g), and (i) The percentages of activated (CD69+) iNKT, IFN-γ+ iNKT1, IL-4+ iNKT2 and IL-17+ iNKT17 cell subsets. (b), (d), (f), (h), and (j) iNKT1/iNKT2 and iNKT1/iNKT17 ratios. Data are presented as mean ± SEM, n = 5, * P < 0.05, ** P < 0.01, *** P < 0.001 vs control group; # P < 0.05, ## P < 0.01, ### P < 0.001 vs EE, ANIT, TCA, or TCA + CEL groups.
Celastrol alleviates CCl4-induced liver fibrosis and liver injury via CTSS-autophagy-iNKT1 polarization axis
-
To evaluate the changes in the CTSS-autophagy-iNKT1 polarization axis in the treatment of other liver diseases with celastrol, we employed CCl4-induced fibrosis and acute liver injury models (Fig. 7a and o). Celastrol significantly alleviated acute and chronic liver damage, manifested by improved liver pathology (Fig. 7b and p), reduced serum AST and ALT levels in mice (Fig. 7c and q), and decreased levels of AST, ALT, and LDH in cell supernatant (Fig. 7r).
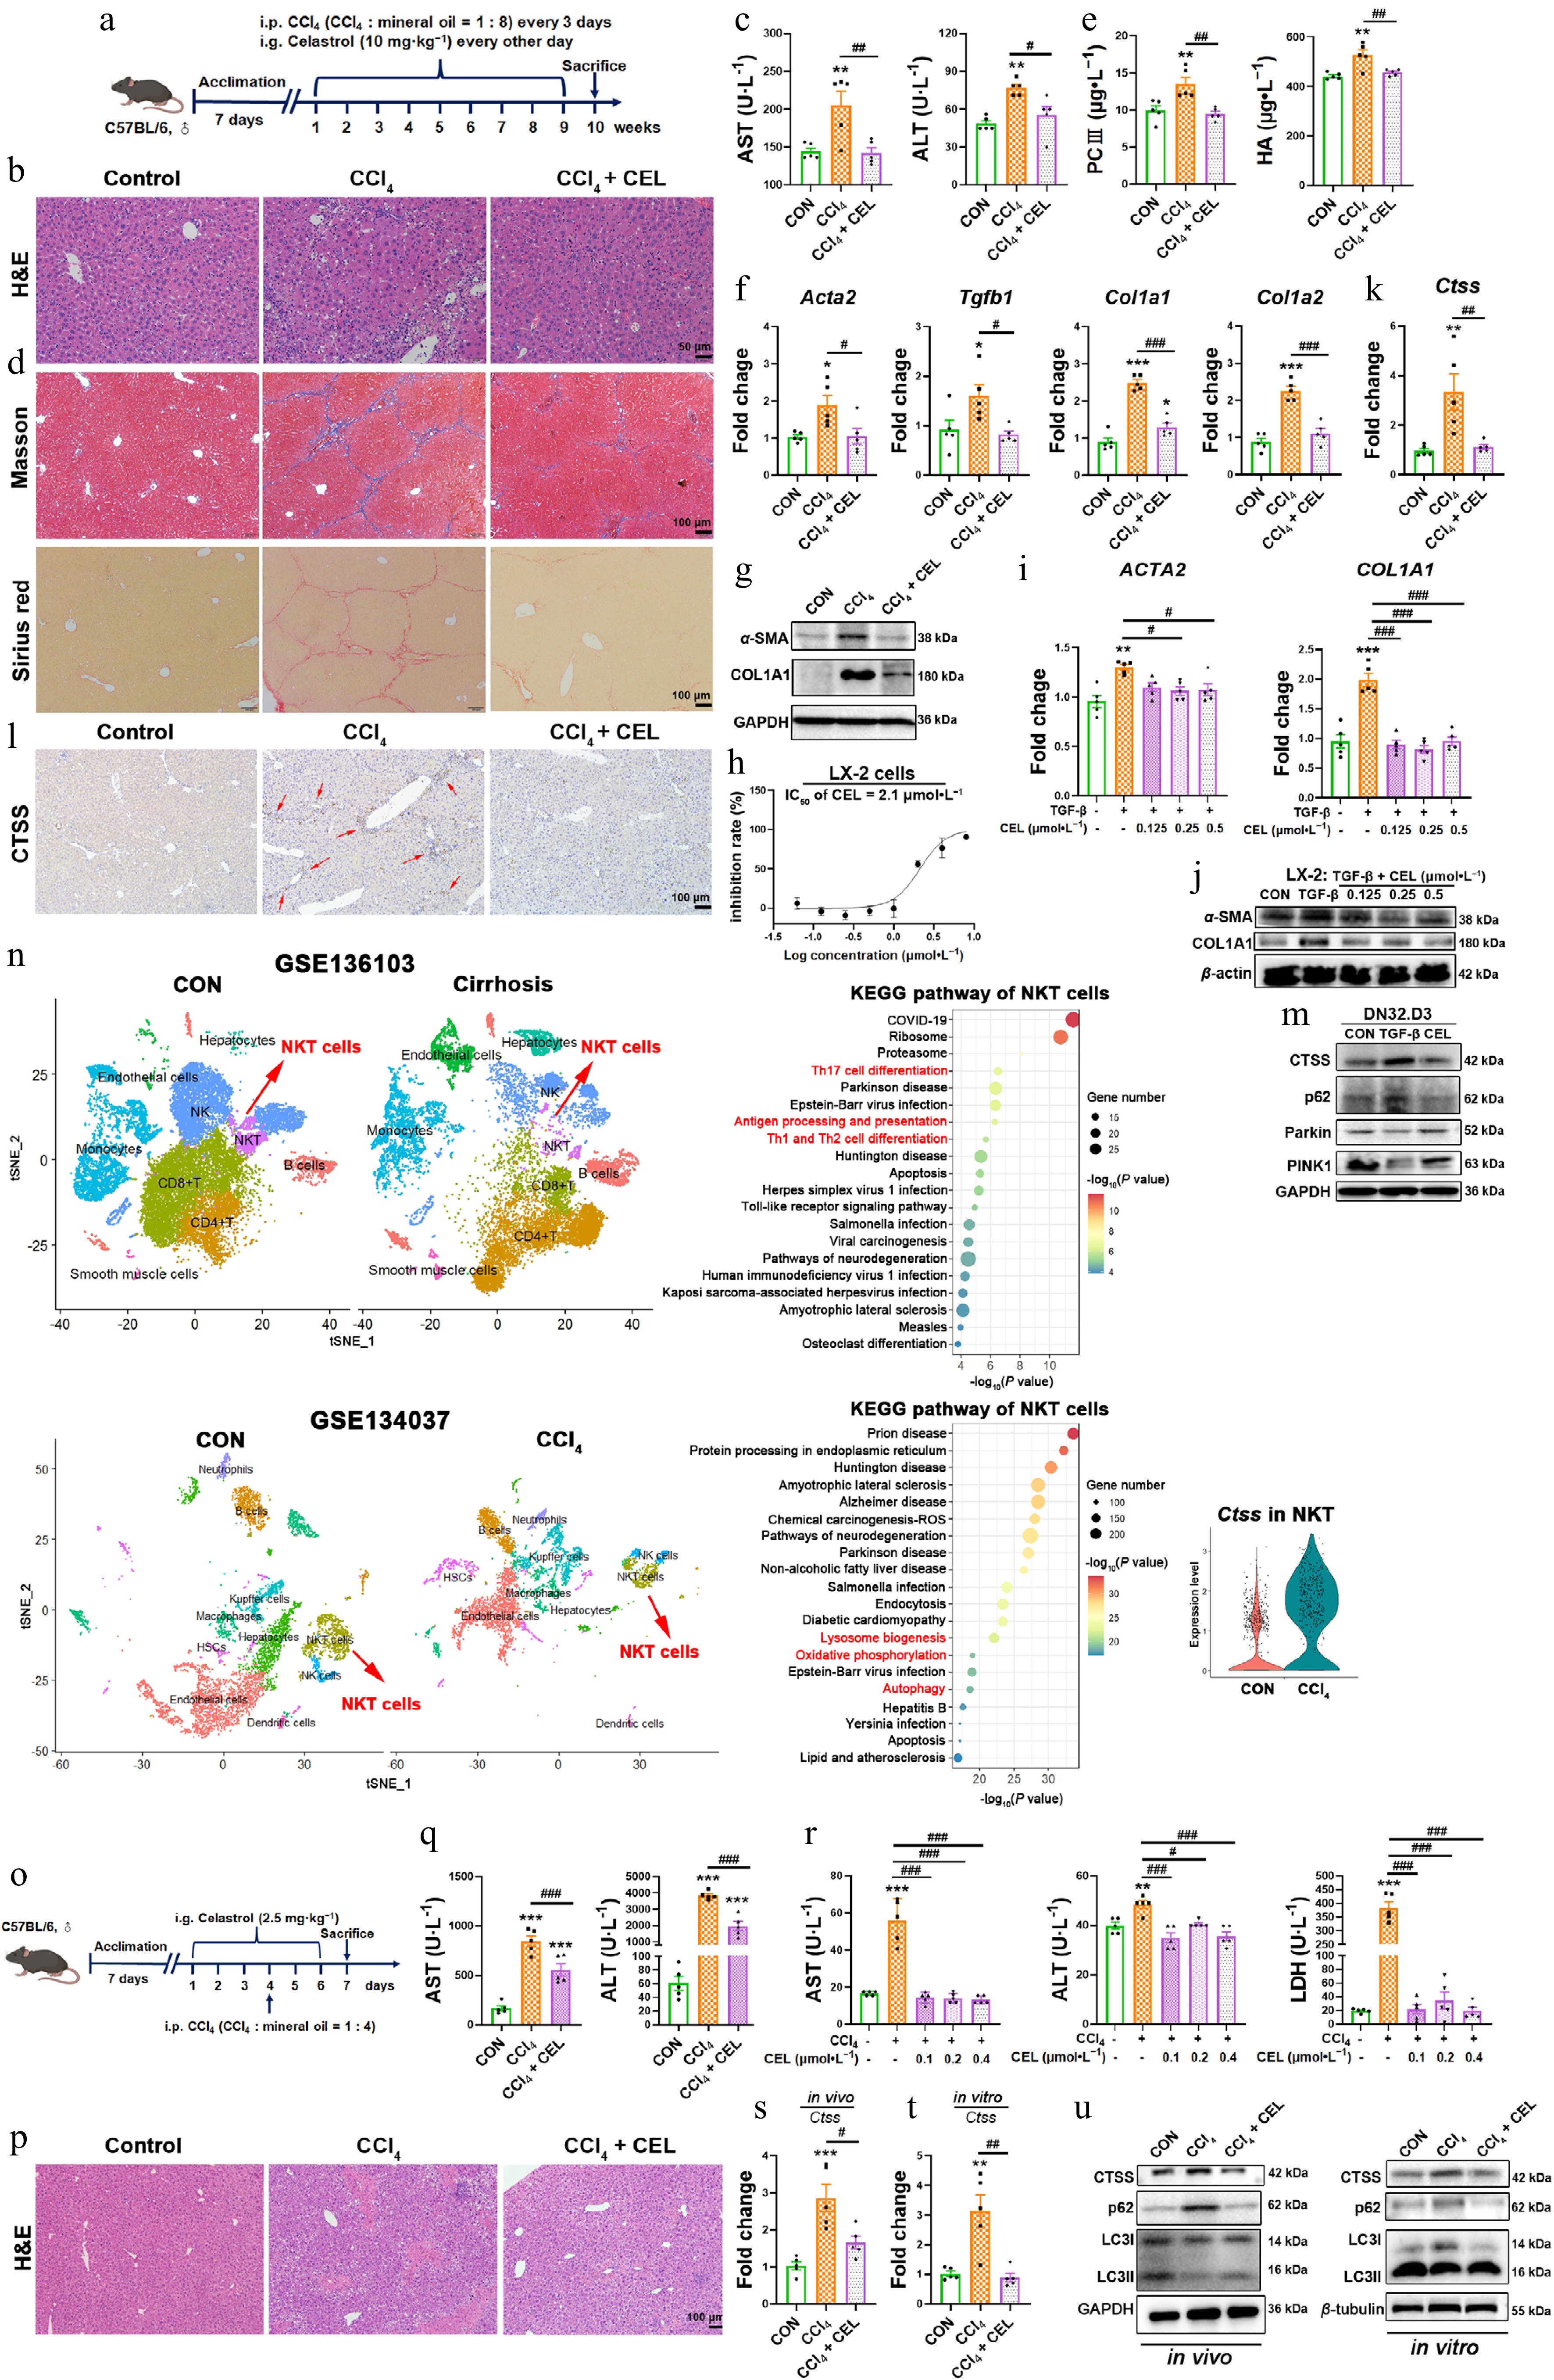
Figure 7.
Celastrol attenuates CCl4-induced liver fibrosis and liver injury via CTSS-autophagy-iNKT1 polarization axis. (a), (o) Experimental schematics. (b), (p) H&E staining of liver sections. (c), (q) Serum AST and ALT levels. (d) Masson's trichrome and Sirius Red staining of liver sections. (e) Serum PCIII and HA levels. (f) Hepatic mRNA expressions of Acta2, Tgfb1, Col1a1, and Col1a2. (g), (j) Protein levels of α-SMA and COL1A1. (h) Cytotoxicity of celastrol in LX-2 cells. The mRNA expressions of (i) ACTA2, COL1A1, and (k), (s), and (t) Ctss. (l) Immunohistochemistry, and (m) Western blotting measurement of CTSS, p62, Parkin, and PINK1 proteins. (n) UMAP analysis was performed on liver cirrhosis patients and healthy control (CON, GSE136103), or liver nonparenchymal cells from CCl4 and control (CON) mice (GSE134037). KEGG enrichment pathway analysis of NKT cells, and CTSS expression in NKT cells (GSE134037). (r) The levels of AST, ALT, and LDH in cell supernatant. (u) The protein levels of CTSS and autophagy markers in liver tissue and iNKT cells. Data are presented as mean ± SEM, n = 5, * P < 0.05, ** P < 0.01, *** P < 0.001 vs control group; # P < 0.05, ## P < 0.01, ### P < 0.001 vs CCl4 or TGF-β group.
In the liver fibrosis model, celastrol reduced collagen deposition, manifested as diminished Masson's trichrome and Sirius Red staining (Fig. 7d), and lower serum levels of PC-III and HA (Fig. 7e). Celastrol also downregulated the expressions of fibrogenic genes (Acta2, Tgfb1, Col1a1, and Col1a2) and fibrosis-related proteins (α-SMA, COL1A1) in mouse livers (Fig. 7f and g) and LX-2 cells stimulated by TGF-β (Fig. 7h–j).
Celastrol suppressed CTSS expression and promoted autophagy in mouse livers (Fig. 7k, l, s and u) and in iNKT cells of the co-culture system (Fig. 7m, t and u). Clinical single-cell RNA-seq (GSE136103) from patients with cirrhosis also shows significant alterations in NKT cells with enrichment in Th17 cell differentiation, antigen processing and presentation, and Th1 and Th2 cell differentiation (Fig. 7n upper). Another single-cell RNA-seq (GSE134037) confirmed elevated CTSS expression in NKT cells from CCl4-treated mice, with changes in NKT cells and enrichment in lysosome biogenesis, oxidative phosphorylation, and autophage pathways (Fig. 7n lower). Thus, celastrol alleviated CCl4-induced fibrosis and acute liver injury through CTSS inhibition and autophagy restoration in iNKT cells.
Celastrol promotes an iNKT1 subtype bias in CCl4-induced liver fibrosis and liver injury
-
Inflammation plays an important role in promoting the progression from cholestatic liver injury to liver fibrosis. iNKT cells have been reported to exert protective effects in CCl4-induced liver fibrosis and acute liver injury[23], but the specific changes of iNKT1, iNKT2, and iNKT17 subsets in liver fibrogenesis remain poorly defined.
In both in vivo and in vitro models of liver fibrosis and acute liver injury, celastrol also induced an iNKT1 subtype bias (Fig. 8a–d). Therefore, celastrol also promoted a protective iNKT1 subtype bias in other liver disease models. The IFN-γ secreted by iNKT1 cells can suppress HSC activation and proliferation[24]. Our results provided a new theoretical basis for the anti-fibrotic effects of celastrol.
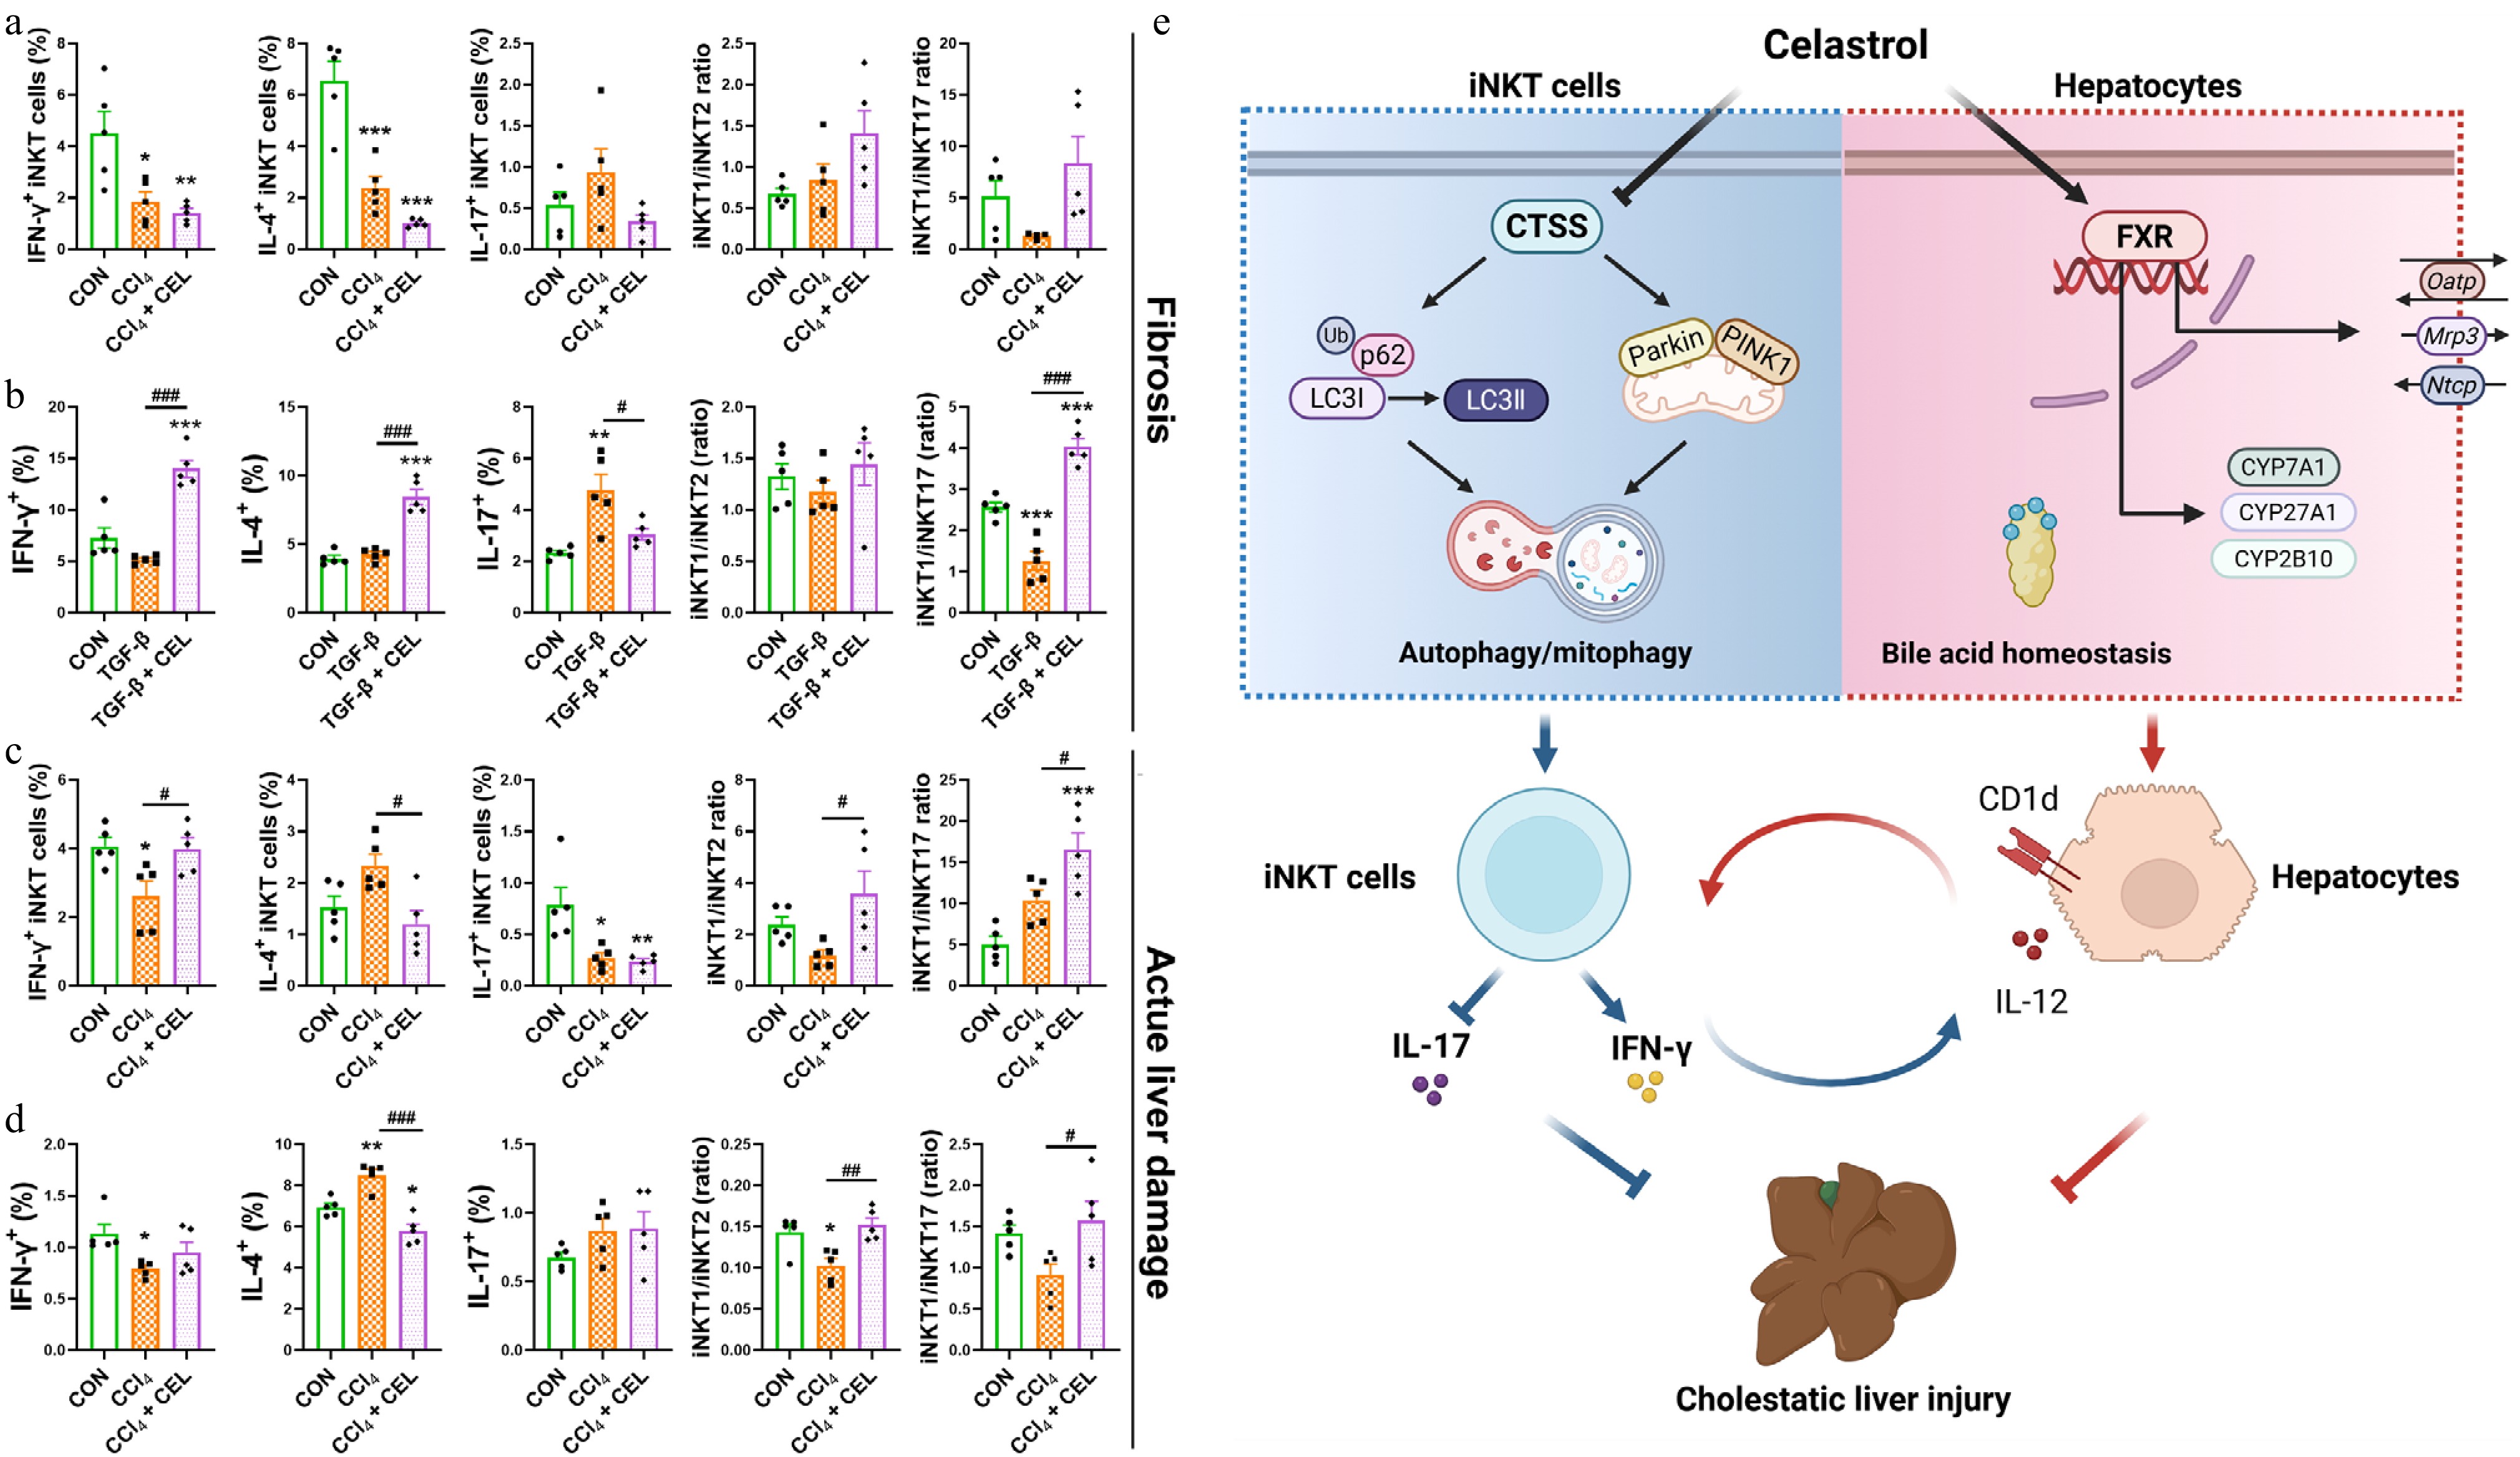
Figure 8.
Celastrol promotes an iNKT1 subtype bias in CCl4-induced liver fibrosis and liver injury models. (a) The percentages of activated (CD69+) iNKT cells, iNKT1, 2, 17 cell subsets, and iNKT1/iNKT2, iNKT1/iNKT17 ratios in the fibrosis model, and (b) in iNKT cells from the co-culture systems. (c) Corresponding iNKT cell profiles in the acute liver injury model and (d) in iNKT cells from the co-culture systems. (e) Graphical abstract. Data are presented as mean ± SEM, n = 5, * P < 0.05, ** P < 0.01, *** P < 0.001 vs control group; # P < 0.05, ## P < 0.01, ### P < 0.001 vs CCl4 or TGF-β group.
-
Liver nonparenchymal cells are critical mediators of the anti-inflammatory and hepatoprotective effects of celastrol. Celastrol induces ferroptosis in activated HSCs via direct binding to peroxiredoxins and heme oxygenase-1, exerting anti-fibrotic effects[25]. It also suppresses the Warburg effect of macrophages and induces M2 polarization through covalent modification of pyruvate kinase M2, thereby reducing lipid accumulation and fibrosis in non-alcoholic fatty liver disease[26]. However, the mechanisms of celastrol on nonparenchymal cells in the treatment of cholestatic liver injury remain unexplored.
The liver is an atypical immune organ with unique local immune features. iNKT cells are the core coordinators of liver immune homeostasis due to their rapid response to inflammatory signals and release of Th1/Th2/Th17 type cytokines. The function of iNKT1/2/17 cells differ from traditional Th1/Th2/Th17 cells: IFN-γ can reduce neutrophil accumulation by inducing their apoptosis, thereby alleviating liver injury[20]; IL-4 enhances the cytotoxicity of iNKT cells through upregulating the expression of FasL and granzyme B, which play a key role in concanavalin A-induced liver injury[21]; IL-17 promotes the infiltration of neutrophils and monocytes, thereby contributing to hepatocyte injury and cholestasis[16]. iNKT cells interact with immune (T cells, B cells, dendritic cells, and Kupffer cells) and non-immune (cholangiocytes, hepatocytes) cells to modulate the hepatic immune landscape and influence disease progression[11].
In the present study, we employed two co-culture systems (DN32.D3-RAW264.7 and DN32.D3-AML12 cells) to simulate these cellular interactions in vivo. In DN32.D3-RAW264.7 co-cultures, celastrol promoted an iNKT17 subtype bias with increased secretion of IFN-γ, IL-4, and IL-17. In contrast, in DN32.D3-AML12 co-cultures, iNKT cells exacerbated hepatotoxicity, but celastrol promoted a protective iNKT1 subtype bias, which was consistent with the in vivo results. In hepatocytes, microsomal triglyceride transfer proteins transfer lipids onto CD1d, enabling CD1d-dependent antigen presentation and subsequent activation of liver iNKT cells, which in turn modulates hepatic inflammation[27]. Upon activation by hepatocytes, iNKT cells secrete cytokines such as LIGHT, which augment steatosis and liver damage[28]. Patients with primary biliary cholangitis exhibit elevated CD1d expression on hepatocytes and increased hepatic iNKT cell numbers, suggesting that hepatocyte-iNKT cell interaction contributes to the pathogenesis of cholestasis[29].
Our results demonstrated that celastrol not only restored bile acid homeostasis of the canonical FXR-bile acid transporter pathways, but also corrected the aberrant antigen-presenting function of hepatocytes. iNKT cells can be activated through TCR-dependent mechanisms by CD1d-presented antigens and through TCR-independent mechanisms in response to IL-12[10]. In AML12 cells of the co-culture system, TCA induced prominent upregulation of Cd1d and Il12, while celastrol suppressed these elevations, indicating that hepatocytes functioned as the antigen-presenting cells to activate iNKT cells and celastrol modulated both direct (CD1d-mediated) and indirect (IL-12-mediated) activation of iNKT cells. Therefore, celastrol induced a protective iNKT1 subtype bias through the hepatocyte-iNKT cell interaction. Celastrol both modulated bile acid homeostasis and acted downstream to limit inflammation and injury.
iNKT cells can promote the myofibroblastic transition of HSCs[30], and their deficiency (Ja18−/− and CD1d−/−) attenuates fibrosis[31,32]. HSCs can also activate iNKT cells via antigen presentation[33], forming potential positive feedback. In patients with chronic hepatitis B virus infection, iNKT cells produce pro-fibrotic cytokines (IL-4, IL-13), exacerbating liver fibrosis[34]. Conversely, iNKT cells can also exert anti-fibrotic effects by directly eliminating early activated HSCs through their cytotoxicity[35] and producing IFN-γ to suppress HSC activation[24]. In CCl4-induced liver injury, naturally activated iNKT cells protects against, whereas strongly activated iNKT cells by α-GalCer aggravates acute liver injury, inflammation, and fibrosis[23]. In the present study, celastrol consistently induced a protective iNKT1 subtype bias in CCl4-induced fibrosis and acute damage. The iNKT1 cell-produced IFN-γ is a potent suppressor of HSC activation[24], a key event in fibrogenesis, indicating a new mechanism for celastrol in the treatment of liver fibrosis.
CTSS is a promising therapeutic target due to restricted distribution in immune cells[14]. Inhibition of CTSB/S reduces NF-κB-dependent hepatic inflammation by enhancing SIRT1 expression and attenuating liver fibrosis[36]. CTSB also participates in TNF- dependent hepatocyte apoptosis and liver injury[37]. Our results included sorted iNKT cell sequencing data, CD1d-deficient mice, iNKT cells from co-cultures, and public single-cell data. This evidence demonstrated that CTSS primarily exerted its effects on iNKT cells in the models of cholestasis.
Our results also indicated that celastrol not only directly binds to CTSS (enzyme inhibition), but also induces the downregulation of CTSS (inhibition at the mRNA and protein levels). These two mechanisms may be interconnected, as direct binding may initiate feedback loops (such as restoring autophagy, reducing inflammation), thereby promoting transcriptional repression[38−40]. Alternatively, celastrol may simultaneously target both CTSS and its upstream transcriptional factors. This dual mechanism leads to rapid and sustained inhibition of CTSS.
CTSS functions as an upstream regulator of autophagy[41]. Inhibition of CTSS can regulate both autophagic flux[42,43] and mitochondrial homeostasis[44]. The autophagy flux mediated by CTSS is crucial for inducing M2 polarization of tumor-associated macrophages[41]. Autophagy also plays an important role in thymic development, peripheral function, and IFN-γ production of iNKT cells[45−47]. Autophagy deficiency selectively leads to a reduction in IFN-γ+ iNKT1 cells[46]. Notably, impaired autophagy is also a characteristic of cholestasis, and the restoration of autophagy by UDCA is one of its therapeutic mechanisms[48,49]. Our results exhibited significant autophagy impairment, while celastrol enhanced autophagy/mitophagy by inhibiting CTSS.
-
In summary, celastrol targeted and inhibited CTSS, enhanced autophagy/mitophagy, promoted a protective iNKT1 cell bias, and thus alleviated cholestatic liver injury and fibrosis. Genetic ablation or pharmacological inhibition of CTSS, or pharmacological blockade of autophagic flux with CQ, abolished celastrol-induced iNKT1 polarization and hepatoprotection, confirming that CTSS-dependent autophagy/mitophagy enhancement was the crucial mechanism underlying celastrol's immunomodulatory effects. Celastrol also improved the bile acid homeostasis and downregulated the expression of Cd1d and Il12 in hepatocytes. This indicated that celastrol altered the antigen-presenting function of hepatocytes, thereby affecting iNKT-hepatocyte interactions and the downstream inflammatory responses. Our findings provide novel immune targets for the pathology of cholestasis and the treatment with celastrol (Fig. 8e).
The present study was supported by the National Natural Science Foundation of China (No. 82073948). We thank Dr. Chuan Su (Nanjing Medical University) for CD1d−/− mice, Dr. Li Bai (University of Science and Technology of China) for DN32.D3 cells, the NIH Tetramer Core Facility for tetramers, Yumeng Shen (Public platform of State Key Laboratory of Natural Medicines) for flow cytometry sorting, Jie Zhao and Zhenglin Hao (Pharmaceutical Animal Experimental Center of China Pharmaceutical University) for animal experiments support.
-
Animal procedures were approved by the Ethics Committee of China Pharmaceutical University (2021-10-003), and the research follows the 'Replacement, Reduction, and Refinement' principles to minimize harm to animals. The study protocol conforms to the ethical guidelines of the 1975 Declaration of Helsinki as reflected in a priori approval by the institution's human research committee (2021ZDSYLL022-P01, Zhongda Hospital Southeast University).
-
The authors confirm contributions to the paper as follows: study conception and design, visualization, software, funding acquisition, draft manuscript preparation: Wang X; investigation, methodology, data collection: Wang X, Wang H, Yang M, Zhang S, Mai M; analysis and interpretation of results: Wang X, Wang H, Zhang S; writing, review and editing: Wang X, Zhang Y; resources, project administration: Zhang L, Liu J, Xing M. All authors reviewed the results and approved the final version of the manuscript.
-
The datasets generated during and/or analyzed during the current study are available from the corresponding author on reasonable request.
-
The authors declare no conflicts of interest.
-
accompanies this paper online at: https://doi.org/10.48130/targetome-0026-0018.
-
#Authors contributed equally: Hongwei Wang, Mei Yang, Shenye Zhang
- Supplementary Table S1 The antibodies used for flow cytometry.
- Supplementary Table S2 The primer sequences used for qPCR assay.
- Supplementary Table S3 Information on the dataset included in the study.
- Supplementary Fig. S1 Celastrol activates DN32.D3 cells in monoculture and macrophage co-culture systems.
- Copyright: © 2026 by the author(s). Published by Maximum Academic Press on behalf of China Pharmaceutical University. This article is an open access article distributed under Creative Commons Attribution License (CC BY 4.0), visit https://creativecommons.org/licenses/by/4.0/.
-
About this article
Cite this article
Wang H, Yang M, Zhang S, Mai M, Mei Y, et al. 2026. Celastrol ameliorates cholestatic liver injury by promoting a protective iNKT1 polarization via CTSS inhibition and autophagy restoration. Targetome 2(2): e016 doi: 10.48130/targetome-0026-0018 

Celastrol ameliorates cholestatic liver injury by promoting a protective iNKT1 polarization via CTSS inhibition and autophagy restoration
- Received: 30 December 2025
- Revised: 18 April 2026
- Accepted: 20 April 2026
- Published online: 29 April 2026
Abstract: Cholestatic liver injury involves pathogenic invariant natural killer T17 (iNKT17) cell expansion with limited treatments. While celastrol shows hepatoprotective potential, its mechanisms in modulating iNKT cell-driven pathology during cholestasis and fibrosis remain unclear. We aimed to elucidate how celastrol regulates iNKT cell polarization to ameliorate cholestatic liver injury and fibrotic progression. Celastrol alleviated cholestatic liver injury and fibrosis while restoring bile acid homeostasis. It shifted hepatic iNKT cell balance from pathogenic iNKT17 cells to protective iNKT1 cells. Transcriptomic analysis of sorted hepatic iNKT cells identified cathepsin S (CTSS) as a key hub gene, linking celastrol's effects to phagosome/lysosome pathways. Celastrol bound and inhibited CTSS, which in turn enhanced autophagy and mitophagy in iNKT cells. Mechanistically, chloroquine-mediated lysosomal blockade attenuated celastrol-induced p62 degradation, autophagic flux, iNKT1 polarization, and hepatoprotection. CTSS inhibition mimicked celastrol's benefits, whereas CTSS overexpression abolished them. Critically, in CTSS-knockout mice, the hepatoprotective and iNKT1-polarizing effects of celastrol were eliminated, confirming the essential role of CTSS for celastrol. Clinical relevance was confirmed by significantly elevated CTSS mRNA levels in PBMCs from intrahepatic cholestasis of pregnancy (ICP) patients. Furthermore, using CD1d-deficient mice, we established that iNKT cells were the principal cellular source responsible for the pathogenic upregulation of CTSS in cholestasis. Our findings reveal CTSS as a pivotal molecular checkpoint in cholestasis and its fibrotic progression by governing iNKT cell polarization through autophagy/mitophagy regulation, thereby presenting a novel therapeutic target for cholestatic liver injury.
-
Key words:
- Invariant natural killer T cells /
- Cathepsin S /
- Cholestatic liver injury /
- Celastrol /
- Autophagy /
- Mitophagy