













-
Acute myeloid leukemia (AML) represents a diverse and genetically varied hematopoietic malignancy, distinguished by the impairment of myeloid cell maturation and the unchecked proliferation of immature myeloid cells[1−4]. To date, chemotherapy has been the conventional approach for treating AML[5]. Recently, innovative therapeutic strategies, such as the introduction of the Bcl-2 inhibitor venetoclax, have significantly enhanced overall response rates in AML, particularly in younger patients[6]. Despite this progress, the 5-year survival rate for younger patients remains approximately 30%, while it drops to a mere 5%−10% for older patients[7], highlighting the necessity for a deeper comprehension of the disease's biology. Consequently, it is essential to develop novel and effective anti-AML therapies.
PTPN2 is an important member of protein tyrosine phosphatases (PTPs)[8−14], and it has been identified as a potential target for tumor therapy[15−19]. PTPN2 shares a 72% genetic similarity and structural resemblance with PTP1B[20,21]. Despite the close relationship, PTP1B and PTPN2 demonstrate exceptional specificity in selecting their substrates[22−29]. PTPN2 plays a negative role in T-cell receptor (TCR) signaling by dephosphorylating and disabling LCK[30,31]. Additionally, PTPN2 also acts as an antagonist to cytokine signaling that is necessary for T-cell function, homeostasis, and differentiation[32−34]. PTPN2 deficiencies have been shown to promote PTK and STAT-3/5 signaling and tumorigenicity in cell lines, xenografts, and genetically engineered mouse models of cancer[35−38]. However, our research and recent studies have shown that PTPN2 deletion in melanoma and colon tumors promotes IFN/JAK-1/STAT-1 signaling, T cell recruitment, and antigen presentation, leading to improved anti-tumor immunity[15,39−43]. Thus, PTPN2's role in cancer is complex and context-dependent; its deletion can enhance anti-tumor immune responses and inhibit tumor growth. In our previous studies, we demonstrated that PTPN2 is a key prognostic factor of pancreatic adenocarcinoma, and with pan-cancer analysis, we also found that PTPN2 is highly expressed in AML[44]. Nevertheless, the precise mechanisms by which heightened PTPN2 levels contribute to the development of AML remain elusive.
In this study, we investigated the profound impacts and underlying mechanisms of inhibiting PTPN2 on disrupting the cancer cell cycle. By conducting a variety of screening and validation experiments, we unraveled that c-MYC is a direct acting substrate of PTPN2 and further explored the therapeutic potential of targeting PTPN2 for the treatment of AML. Moreover, we obtained a novel small-molecule inhibitor of PTPN2, WS35, which can significantly inhibit the growth of AML. This greatly expands the various possibilities for the treatment of AML.
-
To obtain the recombinant protein PTPN2. We first extracted RNA from HEK293T cells and obtained cDNA by reverse transcription, and then used cDNA as a template to obtain the target gene PTPN2 by polymerase chain reaction (PCR) using specific primers. We used homologous recombination to homologize the target gene PTPN2 and the vector pGEX6p-1 by reverse complementary pairing of homology arms. The in vitro recombination product was transformed into the DH5α strain, verified by colony PCR, and then sequenced using Sanger sequencing; the correctly sequenced single clone was extracted as a plasmid and transformed into the expression strain BL21 (DE3).
For the mutant PTPN2 C216G (1−314 AA), we designed point mutation primers, amplified the plasmid fragments by rolling-circle PCR, verified the location of the plasmid fragments by agarose gel electrophoresis, transfected DH5α after DpnI digestion, picked a single clone to be sequenced to verify the mutation site, and extracted the plasmid for transformation of BL21 (DE3) after correct sequencing.
In order to overexpress c-MYC (1−415 AA) at the cellular level, we used cDNA from HEK293T cells as a template and PCR to obtain the target gene c-MYC, which was recombined by homologous recombination with the pCDNA3.1(+) vector, and plasmid extraction was performed after sequencing. Similarly, we used site-directed mutagenesis to mutate threonine 58 of c-MYC (1–415 AA).
Mutation primers: F-PTPN2(C216G): (5'-3') ATCCACGGTAGTGCAGGCATTGGGCG; R-PTPN2(C216G): (5'-3') TGCACTACCGTGGATCACCGCAGGCC; F-c-MYC(T58A): (5'-3') TGCTGCCCACCCCGCCCCTGTCCCCTAGCC; R-c-MYC(T58A): (5'-3') GCGGGGTGGGCAGCAGCTCGAATTTCTTCC.
Protein expression and purification
-
PTPN2 and PTPN2 C216G were cloned into the pGEX6P-1 expression vector and expressed in BL21 (DE3). When bacteria reached an OD600 of about 0.6, protein expression was then induced with 0.5 mmol·L−1 isopropyl-1-thio-β-D-galactopyranoside (IPTG) for 12 h at 25 °C. Cells were harvested and resuspended in lysis buffer (50 mmol·L−1 Tris-HCl, pH 7.5, 500 mmol·L−1 NaCl, 10 mmol·L−1 imidazole, 10% glycerol), lysed by high-pressure crushing (ATS Engineering Limited, 800 bar, 15 min), and centrifuged (Beckman, 18,000 r·min−1, 30 min, twice) to remove the cell debris. The supernatant was passed through a 5 mL Ni-column (GE) pre-equilibrated with lysis buffer. The His-GST-PTPN2, His-GST-PTPN2 C216G protein was eluted with 300 mmol·L−1 imidazole, then diluted with buffer (50 mmol·L−1 Tris-HCl, pH 7.5, 500 mmol·L−1 NaCl and 10% glycerol) to remove the imidazole. Subsequently, the protease was added to cleave the N-terminal 6xHis-GST-Tag overnight at 4 °C. The target protein mixed with the protease and tag was then concentrated with an Amicon Ultra-15 centrifugal filter unit (10,000 MWCO) (EMD Millipore) at 4 °C. The target protein mixed with sumo protease and tag were then passed through a second 1 mL Ni-column and the flow-through solution containing the target protein was collected and concentrated with an Amicon Ultra-15 centrifugal filter unit (10,000 MWCO) (EMD Millipore) at 4 °C. Lastly, 1 mL protein was loaded onto the analytical size exclusion column Superdex 200 increase 10/300 GL (GE Healthcare) in running buffer (25 mmol·L−1 Tris-HCl, pH 7.5, 500 mmol·L−1 NaCl). All fractions were analyzed by SDS-PAGE.
Clinical samples
-
Bone marrow (BM) samples from AML patients and peripheral blood samples from healthy individuals were obtained from Jiangsu Province Hospital of Chinese Medicine with patients' informed consent. The human samples used in this study were approved by the Ethics Committee of Jiangsu Province Hospital of Chinese Medicine. Clinicopathologic information of these patients was listed in Supplementary Table S1.
Extraction of AML primary cells
-
Ten mL of whole blood was transferred into a 50 mL centrifuge tube, diluted with 10 mL of PBS solution, and mixed gently. Two 15 mL centrifuge tubes were prepared, and 5 mL of Ficoll solution was added. The diluted blood was then gently added to the upper layer of Ficoll in both centrifuge tubes, and the tubes were centrifuged at 2,000 r·min−1 for 20 min. The cell layer where PBMCs are located is white. At this point, the layer can be pipetted into another clean 15 mL centrifuge tube; 10−15 mL of PBS is added, and it is centrifuged at 1,500 r·min−1 for 10 min. The supernatant is removed and the medium containing cytokines is taken and used to resuspend the cells for subsequent cell culture or seeding on culture plates.
Cell culture
-
The cell lines used in the experiment were all from the cell bank of Fu Heng Biology. Human acute myeloid leukemia cell lines MOLM13, NB4, K562, and HL-60 were cultured in RPMI1640 medium containing 10% fetal bovine serum, while human bone marrow stromal cells HS-5 were grown in DMEM medium containing 10% fetal bovine serum. The cells were cultured in a 37 °C, 5% CO2 cell incubator. All cells were tested annually for mycoplasma contamination using a PCR Mycoplasma detection kit, and to prevent potential contamination, all media were supplemented with penicillin-streptomycin and a mycoplasma scavenger according to the manufacturer's instructions.
Anti-proliferation activity assay
-
The CCK8 kit was used to evaluate the antiproliferative activity of the compounds. Cells were incubated in a 37 °C, 5% CO2 thermostatic cell incubator. The cells were seeded in 96-well plates with 100 μL of culture medium containing 8% fetal bovine serum at a density of 8,000 cells/well. After 24 h of culture, the cells were treated with compound solution diluted in medium gradient (DMSO solubilization) for 72 h, and then with 10 μL of CCK8 reagent for 4 h. The absorbance value of each well at 450 nm was detected with a Synergy H1 microplate reader (BioTek), and the results were analyzed using GraphPad Prism 8 to calculate the IC50 value.
Cell growth assay
-
Five thousand tumor cells or shPTPN2 cells per well were seeded into 96-well plates and cultured for 4 d. CCK8 reagent was added daily to the wells of each 96-well plate. The treated 96-well plates were incubated for 4 h. Absorbance was then measured at 450 nm using a microplate reader, and the results were analyzed using GraphPad Prism 8 to calculate IC50 values.
Cell cycle assay
-
Cells were seeded into six-well plates, treated with test compounds for 24 h, then washed twice with PBS, removed, added to 70% ethanol, gently beaten, and fixed at 4 °C for 12−24 h. Centrifugation was performed at 1,000 × g for 5 min, and the supernatant was carefully aspirated, leaving the precipitated cells. One millilitre of PBS was added, and the cells were resuspended in 0.5 mL Krishan's buffer supplemented with 0.05 mg·mL−1 PI and 0.1% trisodium citrate. The cells were incubated at 37 °C for 30 min with 0.02 mg·mL−1 ribonuclease A and 0.3% NP-40, and then directly applied to flow cytometry (BD, USA) and analyzed with FlowJo V10 software.
Apoptosis assay
-
Cells were seeded into six-well plates and treated with test compounds for 24 h. Cells were then washed twice with cold PBS and resuspended in binding buffer (0.1 mol·L−1 HEPES, pH 7.4, 1.4 mol·L−1 NaCl, 25 mmol·L−1 CaCl2). A 100 μL volume of solution was transferred to a 5 mL flow tube. To each tube, 5 μL Annexin V-APC and 5 μL PI were added. The cell suspension was gently vortexed and incubated at room temperature in darkness for 30 min. Apoptosis was determined by flow cytometry (BD, USA) at 633 nm excitation, and the results were analyzed using FlowJo V10 software.
Real-time quantitative PCR
-
Total RNA isolated from cells with the RNA-Easy reagent was reverse transcribed using the HiScript 1st Strand cDNA Synthesis Kit. RT-qPCR reactions were performed with the ChamQ SYBR qPCR Master Mix. Relative gene expression was calculated using the relative quantification method. Human PTPN2 primers: Forward (5'-3'): ATCGAGCGGGAGTTCGA, Reverse (5'-3'): TCTGGAAACTTGGCCACTC; Human ACTIN primers: Forward (5'-3'): GTGGCCGAGGACTTTGATTG, Reverse (5'-3'): TGGAVTTGGGAGAGGCTGG; Human CDK4 primers: Forward (5'-3'): AATGTTGTACGGCTGATGGA, Reverse (5'-3'): AGAAACTGACGCATTAGATCCT; Human CDC25A primers: Forward (5'-3'): TCCATCCCAGTCTCTATCCC, Reverse (5'-3'): TCAAATCCTGATGCTTCCCAG; Human BCL2L11 primers: Forward (5'-3'): ACAGGAGCCCAGCACCCATG, Reverse (5'-3'): ACGCCGCAACTCTTGGGCGA; Human P21 primers: Forward (5'-3'): AGCAGAGGAAGACCATGTGGA, Reverse (5'-3'): AATCTGTCATGCTGGTCTGCC; Human P27 primers: Forward (5'-3'): GGCCTCAGAAGACGTCAAAC, Reverse (5'-3'): CCAACGCTTTTAGAGGCAGA.
Lentivirus production and infection
-
According to the gene sequence of PTPN2, the target sequence for RNAi was designed, and the target sequence was inserted into the corresponding lentiviral vector, which was then transformed, identified by colony PCR, sequenced, and then extracted for transfection into HEK-293T cells to obtain the virus. The lentivirus directly infected MOLM13 cells. MOLM13 cells containing lentivirus were infected at 32 °C and 1,200 r·min−1 for 90 min and cultured continuously. After 48 h of infection, 2 μg·mL−1 puromycin was added to MOLM13 cells, and finally, the successfully infected MOLM13 cells were selected. PTPN2 shRNA sequence: CCGGGATGACCAAGAGATGCTGTTTCTCGAGAAACAGCATCTCTTGGTCATCTTTTTG.
RNA-seq sequencing
-
Total RNA was extracted from PTPN2 knockdown cells using the TRIzol kit (Invitrogen, Carlsbad, CA, USA). RNA quality was assessed using an Agilent 2100 Bioanalyzer (Agilent Technologies, Palo Alto, CA, USA) and checked by electrophoresis on RNase-free agarose gels. After total RNA extraction, eukaryotic mRNA was enriched with Oligo (dT) beads, and prokaryotic mRNA was enriched by removing rRNA with the Ribo-ZeroTM Magnetic Kit (Epicentre, Madison, WI, USA). The enriched mRNA fragments were then split into short fragments using lysates and reverse transcribed into a strand of cDNA using random primers. The second strand of cDNA was synthesized by DNA polymerase I, RNase H, dNTPs, and buffer. The cDNA fragment was then purified with the QiaQuick PCR Extraction Kit (Qiagen, Venlo, Netherlands); the ends were repaired, the A-tail was added, and it was ligated to an Illumina sequencing adapter. The ligation products were screened by agarose gel electrophoresis, amplified by PCR, and sequenced by Illumina NovaSeq 6000.
High-throughput protein phosphorylation modification omics
-
Protein was extracted from each sample, and the same amount was taken for enzymatic hydrolysis. The final concentration of 20% TCA was slowly added, and the mixture was vortexed and precipitated for 2 h at 4 °C. Centrifugation was performed at 4,500 × g for 5 min; the supernatant was discarded, and the precipitate was washed with pre-cooled acetone 2–3 times. After the precipitate was dried, the final concentration of 200 mmol·L−1 TEAB was added; the precipitate was broken up by ultrasound, trypsin was added, and the precipitation was enzymolized overnight. Dithiothreitol (DTT) was added to make the final concentration 5 mmol·L−1, and then reduced at 56 °C for 30 min. Iodoacetamide (IAA) was then added to make the final concentration 11 mmol·L−1, and the mixture was incubated for 15 min at room temperature under light. The peptides were solubilized with 0.5 mol·L−1 TEAB and labeled according to the instructions of the TMT kit. Peptides were fractionated by high-pH reverse-phase HPLC. The peptides were dissolved in enrichment buffer solution (50% acetonitrile/0.5% acetic acid), and the supernatant was transferred to pre-washed IMAC material and incubated with gentle shaking on a rotary shaker. At the end of incubation, the material was washed three times with buffer solution 50% acetonitrile/0.5% acetic acid and 30% acetonitrile/0.1% trifluoroacetic acid. Finally, the phosphopeptides were eluted with 10% ammonia; the eluent was collected, vacuumed, and dried, and the phosphopeptides were used for liquid mass spectrometry analysis. The peptides were dissolved in liquid chromatography mobile phase A and separated by an EASY-nLC 1200 ultra-high-performance liquid chromatography system. The peptides were separated by a UHPLC system, injected into an NSI ion source for ionization, and then analyzed by a Q Exactive™ HF-X mass spectrometer.
Western blotting analysis
-
For the MG132 experiment, cells were treated with 5 μmol·L−1 MG132 for 12 h, and cells were collected for western blot analysis. Cells were treated with vehicle or the specified WS35 concentration for 72 h, and treated cells were harvested and lysed by sonication in receptor lysis buffer (RLB), phosphatase inhibitors and protease inhibitor mix. Lysates from cells and tumor tissues were quantitated, and 20 to 50 μg of protein lysates were boiled in an SDS sample buffer, size-fractionated by SDS-PAGE, and transferred onto a PVDF membrane (Immobilon). After blocking in 5% nonfat dry milk (or 3% BSA), membranes were incubated with the following primary antibodies overnight: PTPN2 rabbit polyclonal antibody (Proteintech, Cat#: 11214-1-AP, 1 : 1,000), Rb rabbit polyclonal antibody (Proteintech, Cat#: 10048-2-Ig, 1 : 5,000), Phospho-Rb (Ser807/811) rabbit monoclonal antibody (Cell Signaling Technology, Cat#: 8516, 1 : 1,000), CDK4 rabbit monoclonal antibody (Cell Signaling Technology, Cat#: 12790, 1 : 1,000), CDK6 mouse monoclonal antibody (Cell Signaling Technology, Cat#: 3136, 1 : 2,000), P21 rabbit polyclonal antibody (Proteintech, Cat#: 10355-1-AP, 1 : 1,000), P27 rabbit monoclonal antibody (Cell Signaling Technology, Cat#: 3686, 1 : 1,000), P53 rabbit monoclonal antibody (Cell Signaling Technology, Cat#: 2527, 1 : 1,000), XIAP rabbit polyclonal antibody (Proteintech, Cat#: 10037-1-Ig, 1 : 1,000), c-MYC rabbit polyclonal antibody (Proteintech, Cat#: 10828-1-AP, 1 : 2,000), c-MYC (phospho T58) rabbit polyclonal antibody (Abcam, Cat#: ab28842, 1 : 1,000), BCL-2 rabbit polyclonal antibody (Proteintech, Cat#: 12789-1-AP, 1 : 2,000), Vinculin rabbit polyclonal antibody (Proteintech, Cat#: 26520-1-AP, 1 : 1,000), Alpha Tubulin mouse monoclonal antibody (Proteintech, Cat#: 66031-1-Ig, 1 : 20,000). Following three washes in PBST, the blots were incubated with secondary antibody Goat Anti-Mouse IgG, H&L Chain Specific Peroxidase Conjugate (Merck, Cat#: 401215-2 ML, 1 : 5,000), or Goat Anti-Rabbit IgG, H&L Chain Specific Peroxidase Conjugate (Merck, Cat#: 401315-2 ML, 1 : 5,000). Proteins were detected by a chemiluminescent detection system (Tanon, Shanghai, China) and analyzed by ImageJ software.
Transient transfection
-
All plasmids, including PTPN2, PTPN2 C216G, c-MYC, and c-MYC T58A, were constructed. When cells reached logarithmic phase, they were spread in 6-well plates with 500,000 cells per well, transiently transfected using polyethyleneimine (PEI), and transfection complexes were prepared at a PEI : DNA = 3 : 1; the medium was changed after 18 h of staining, and the cells were collected 72 h later.
GST-c-MYC recombinant protein
-
MOLM13 cells were selected as the overexpression cell line. After MOLM13 cells reached the logarithmic stage, a 9 mL RPMI1640 cell suspension containing 10% FBS was prepared, 4 × 10⁶ cells were counted, and 10 cm dishes were seeded. The cells were divided into the Vector-pCDNA3.1(+) group and the GST-c-MYC-pCDNA3.1(+) group. 1 mL of transfection complex was prepared according to PEI : DNA = 3 : 1. The transfection complex was added drop by drop to the culture dish, and the solution was changed 18 h after transfection; the cells were collected 72 h later. Some cells were collected from each group, and overexpression was verified by western blot. The remaining cells in the GST-c-MYC-pCDNA3.1(+) group were lysed for western blot and IP lysates.
GST pull-down assay
-
Recombinant GST or GST-PTPN2 proteins were immobilized on glutathione Sepharose 4B beads in a binding buffer containing 25 mmol·L−1 HEPES, pH 7.5, 200 mmol·L−1 NaCl, and 1 mmol·L−1 EDTA for 4 h incubation at 4 °C. Whole cell lysates were prepared in mild lysis buffer containing 50 mmol·L−1 Tris-HCl, pH 7.6, 150 mmol·L−1 NaCl, 1% NP-40, 0.5% sodium deoxycholate and 0.1% SDS, supplemented with 1 mmol·L−1 PMSF, protease and phosphatase inhibitor cocktails, on ice for 30 min. Followed by ultrasonic crushing, the whole-cell lysates were centrifuged at 12,500 r·min−1 for 15 min. The supernatant was added to recombinant GST protein or GST-PTPN2 protein for overnight incubation at 4 °C. The beads were washed three times with binding buffer and eluted with the same buffer plus 10 mmol·L−1 glutathione (adjusted to pH 7.5). The eluted proteins were visualized with western blot.
Co-IP assay
-
Protein lysates were prepared from MOLM13 cells in an enhanced lysis buffer and a mixture of protease inhibitors using a Co-IP kit (ACE Biotechnology). After ultrasonic crushing, the whole-cell lysates were centrifuged at 12,500 r·min−1 for 15 min. The supernatant was added to 20 μL of Protein A/G MagPoly Beads in 1 mL enhanced lysis buffer. The lysates were then incubated with 4 μg anti-PTPN2 antibody or control IgG overnight at 4 °C. The complexes were washed three times with enhanced lysis buffer and eluted from the beads with IP elution buffer and neutralization buffer. The eluted proteins were detected by western blot.
Immunoprecipitation
-
The cells were lysed using a lysis buffer and placed on ice for 5 min. To release the nuclear proteins, the lysates were subjected to centrifugation at 13,000 × g for 10 min after thorough mixing. For the subsequent steps, 10 μL of anti-PTPN2 antibody was added to the proteins and allowed to incubate for a period of 2 h at a temperature of 4 °C. Additionally, rabbit IgG was also added to the proteins and allowed to incubate for 2 h under the same temperature conditions. Overnight co-incubation at 4 °C was carried out with 2% BSA, antibodies, and 10 mg of protein A-Sepharose beads. The proteins were then eluted three times, and the eluate was fractionated through SDS-PAGE. Subsequently, the gel pieces were incubated in the dark for 45 min at room temperature. Washing of the gel pieces was performed using 50 mmol·L−1 NH4HCO3, followed by dehydration using 100% acetonitrile. The dehydrated gel pieces were then resuspended in 50 mmol·L−1 NH4HCO3 and trypsin for 1 h on ice. After removing the excess liquid, trypsin digestion was carried out at 37 °C overnight. Further extraction of peptides was performed using 50% acetonitrile/5% formic acid and followed by 100% acetonitrile. The extracted peptides were dried completely and resuspended in 2% acetonitrile/0.1% formic acid. The tryptic peptides were dissolved in solvent A (0.1% formic acid) and directly loaded onto a reversed-phase analytical column created in-house. MS/MS analysis, utilizing Q ExactiveTM Plus (Thermo) coupled online to UPLC, was conducted subsequent to NSI source application. The full scan was performed within an m/z range of 350 to 1,800, and the intact peptides were detected at a resolution of 70,000 in the Orbitrap. Peptides were selected for MS/MS analysis, and the resulting data were processed using Proteome Discoverer 1.3.
Compound
-
WS35 was synthesized using previously reported methods[42]. WS35 characterization: 1H NMR (400 MHz, DMSO-d6) δ 9.84 (s, 1H), 8.04 (t, J = 3.6 Hz, 2H), 7.80 (s, 1H), 7.08 (dd, J = 11.3, 2.1 Hz, 1H), 6.98 (t, J = 1.5 Hz, 1H), 4.08 (s, 2H), 3.46–3.40 (m, 2H), 2.24 (s, 3H), 1.69 (dt, J = 13.3, 6.7 Hz, 1H), 1.53 (dd, J = 8.4, 6.3 Hz, 2H), 0.94 (d, J = 6.6 Hz, 6H). 13C NMR (151 MHz, DMSO-d6) δ 171.20, 161.17 (d, J = 248.1 Hz), 157.32 (d, J = 5.6 Hz), 152.09, 138.52, 136.05, 128.86, 126.49, 122.65, 112.80 (d, J = 13.6 Hz), 109.53, 104.32 (d, J = 22.3 Hz), 56.82, 40.15, 36.76, 25.30, 22.28, 16.73.
In vitro dephosphorylation assay
-
c-MYC was previously overexpressed in MOLM13 cells and purified to obtain c-MYC. Post-translational modification occurred in eukaryotic cells, and the expressed and purified c-MYC was phosphorylated at threonine 58. Naturally modified c-MYC was used as a substrate, and the phosphatases were recombinant proteins PTPN2 and PTPN2 C216G. Dephosphorylation buffer (20 mmol·L−1 Tris-HCl (pH 7.5), 100 mmol·L−1 NaCl, 0.57 mmol·L−1 EDTA, 0.033% BSA, and 1 mmol·L−1 DTT) was used. P-c-MYC (T58), different concentrations of PTPN2 (0.25, 0.5, and 1 μmol·L−1), and mutant PTPN2 C216G (1 μmol·L−1) were incubated at 30 °C for 1 h, and 4 × loading buffer was added to prepare samples. The levels of P-c-MYC (T58) were verified by western blot analysis.
In vivo anti-tumor activity
-
The Institutional Animal Care and Use Committee (IACUC) at China Pharmaceutical University granted approval for the procedures involving experiments and the care and use of animals. The animal facility maintained a temperature range of 20−26 °C and humidity levels between 40% and 70%. Each day, the mice experienced alternating periods of 12 h of light and 12 h of darkness. BALB/c nude mice were obtained from Shanghai SLAC Laboratory Animals Co. Ltd.
To establish the MOLM13 shNC group (n = 5), MOLM13 shPTPN2 group (n = 5), NB4 shNC group (n = 6), and the NB4 shPTPN2 group (n = 6), BALB/c nude mice were administered a subcutaneous injection of 1 × 10⁷ MOLM13 and NB4 cells harboring shNC and shPTPN2, respectively. Tumor volumes and body weight measurements were taken at 2-d intervals once tumors had formed. At 16 d, the mice from both groups were euthanized for ethical reasons, and tumor tissues were weighed and photographed.
BALB/c nude mice were administered a subcutaneous injection of 1 × 10⁷ NB4 cells in the right flank. Once the average tumor volumes reached 80−100 mm3, the mice were randomly assigned to either a control group or a WS35 group (20 mg·kg−1), receiving intraperitoneal treatment daily. Tumor volumes and body weights were recorded every 2 d. After a period of 16 d, the mice were euthanized, and the tumors were weighed and photographed. Tumor samples from each group were stored at −80 °C for subsequent analysis.
Statistics and reproducibility
-
In order to compare differences between the two groups, an unpaired, two-tailed Student's t-test was employed using the SPSS 22.0 software, unless otherwise specified in the figure captions. To conduct bioinformatics analysis, the Student's t-test and Mann–Whitney U test were utilized to compare continuous variables between two groups. For the assessment of variance among multiple groups, the analysis of variance (ANOVA) was employed. Relapse-free survival analysis was performed using Kaplan–Meier plots and log-rank tests. Mean ± SD values were used to express the results, and the number of replicates is specified in the figure captions. A statistically significant difference was considered when P < 0.05.
-
To investigate the role of PTPN2 in AML, the Cancer Genome Atlas (TCGA) was mined to analyze the expression of PTPN2 in normal and AML patients. We found higher expression of PTPN2 in AML patients when compared with normal controls (Fig. 1a). Furthermore, we analyzed the expression of the PTPN2 gene in GSE30029 and GSE128103 chips, and the results showed that the expression of PTPN2 in AML samples was significantly higher than that in normal samples (Fig. 1b and c). Then, as shown in Fig. 1d, the PTPN2 mRNA levels increased, which were significantly correlated with overall survival (OS) (P < 0.05). We performed receiver operating characteristic (ROC) curve analysis to evaluate the performance of PTPN2 expression as a diagnostic biomarker for AML disease status. The area under the ROC curve (AUC) for PTPN2 was 0.96, indicating that PTPN2 expression exhibits excellent discriminatory power to distinguish the presence of AML and is strongly associated with AML occurrence (Fig. 1e). Based on the findings from the TARGET database, the expression of PTPN2 was categorized into three groups: high expression, medium expression, and low expression. Subsequently, the overall survival rate was analyzed; the results revealed significant differences among these groups, indicating that the prognosis was notably worse in the high PTPN2 expression group (Fig. 1f). The results of RT-qPCR and western blot (WB) further showed that the mRNA and protein levels of PTPN2 in blood samples from AML patients were higher than those in healthy control samples (Fig. 1g and h). Similarly, in AML cell lines, the protein level of PTPN2 in NB4 and MOLM13 cells was significantly higher than that in normal cells (Fig. 1i). In conclusion, PTPN2 is highly expressed at both the mRNA and protein levels in AML patient samples and AML cell lines, and it is significantly associated with patient prognosis, suggesting that PTPN2 may serve as a promising therapeutic target for AML.
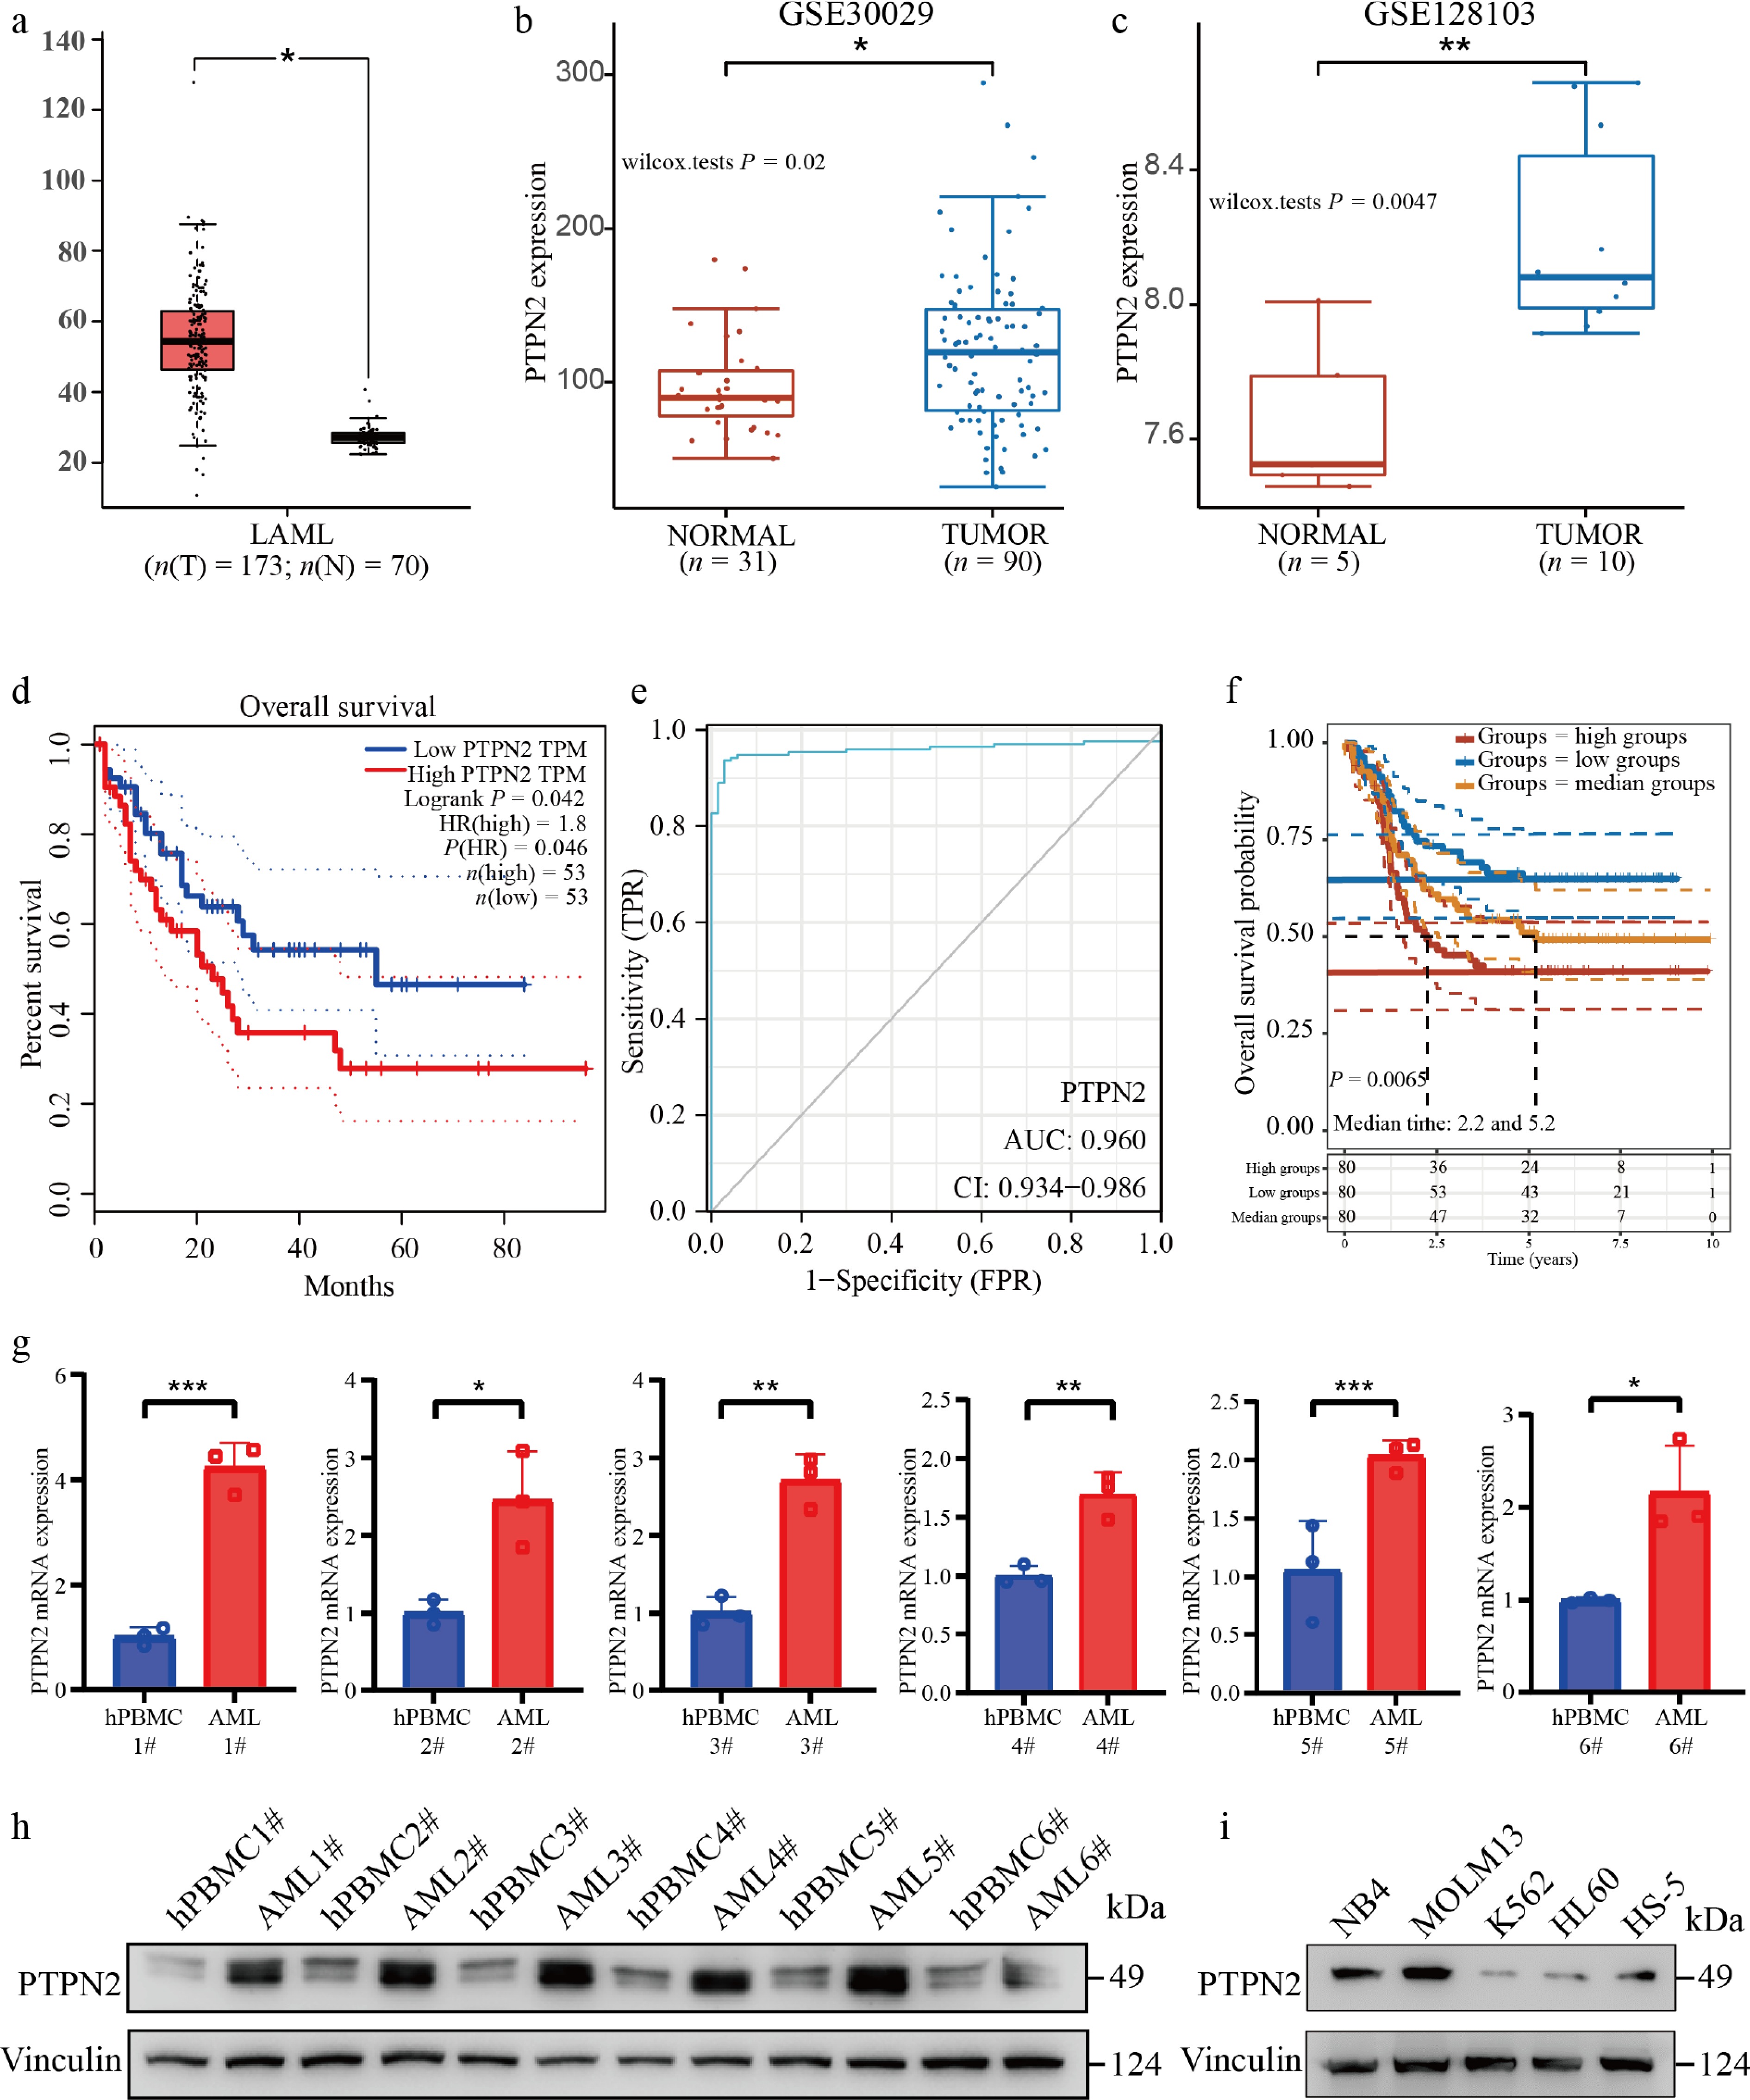
Figure 1.
PTPN2 is highly expressed in AML and associated with poor survival. (a) Comparison of PTPN2 expression between tumors (red, n = 173) and normal (gray, n = 70). (b) PTPN2 expression analysis of monocytes from 31 normal samples and 90 tumor samples from the GSE30029 chip. (c) PTPN2 expression in the sequencing results of five normal umbilical cord blood cell samples and 10 tumor samples' leukemic blasts, leukemic stem cells, and lymphocyte samples from the GSE128103 chip. The quantile percentile is illustrated by the whiskers of the box plot, where minima, 25%, median, 75%, and maxima are displayed from bottom to top, respectively. The application of a two-tailed Student's t-test was conducted without considering adjustments for multiple comparisons, specifically the false discovery rate (FDR). (d) Kaplan–Meier survival plot of high (red line, n = 53) and low (blue line, n = 53) PTPN2 expression AML patients (data from TCGA). Statistical analysis was performed using the log-rank test, P = 0.042. (e) The receiver operating characteristic curve (ROC) predicts the accuracy of PTPN2 as a diagnostic factor for AML. (f) Kaplan–Meier survival plot of high (red line), median (yellow line), and low (blue line) PTPN2 expression AML patients (data from the TARGET database). Statistical analysis was performed using the log-rank test, P = 0.0065. (g) PTPN2 mRNA level in AML patients and healthy control samples. Data represent the mean ± SD. Statistical analysis was performed using a two-tailed unpaired Student's t-test. (h) PTPN2 protein level in AML patients and healthy control samples. (i) PTPN2 protein levels of human bone marrow stromal cell line HS-5 and four different human myeloid leukemia cell lines. * P < 0.05; ** P < 0.01; *** P < 0.001.
Knockdown of PTPN2 significantly regulates the progression of AML
-
To further verify the regulatory role of PTPN2 in AML, we have separated AML primary cells from the other two blood samples from AML patients, and PTPN2 was knocked down in AML primary cells (Fig. 2a). The cell viability of AML primary cells was notably reduced when PTPN2 was knocked down, compared to AML primary cells transfected with an empty lentiviral vector (Fig. 2b), Furthermore, the cell cycle analysis indicated that AML primary cells with PTPN2 knock down were predominantly arrested in the G1 phase (Fig. 2c), Additionally, the decrease in PTPN2 expression led to increase in apoptosis of AML primary cells (Fig. 2d).
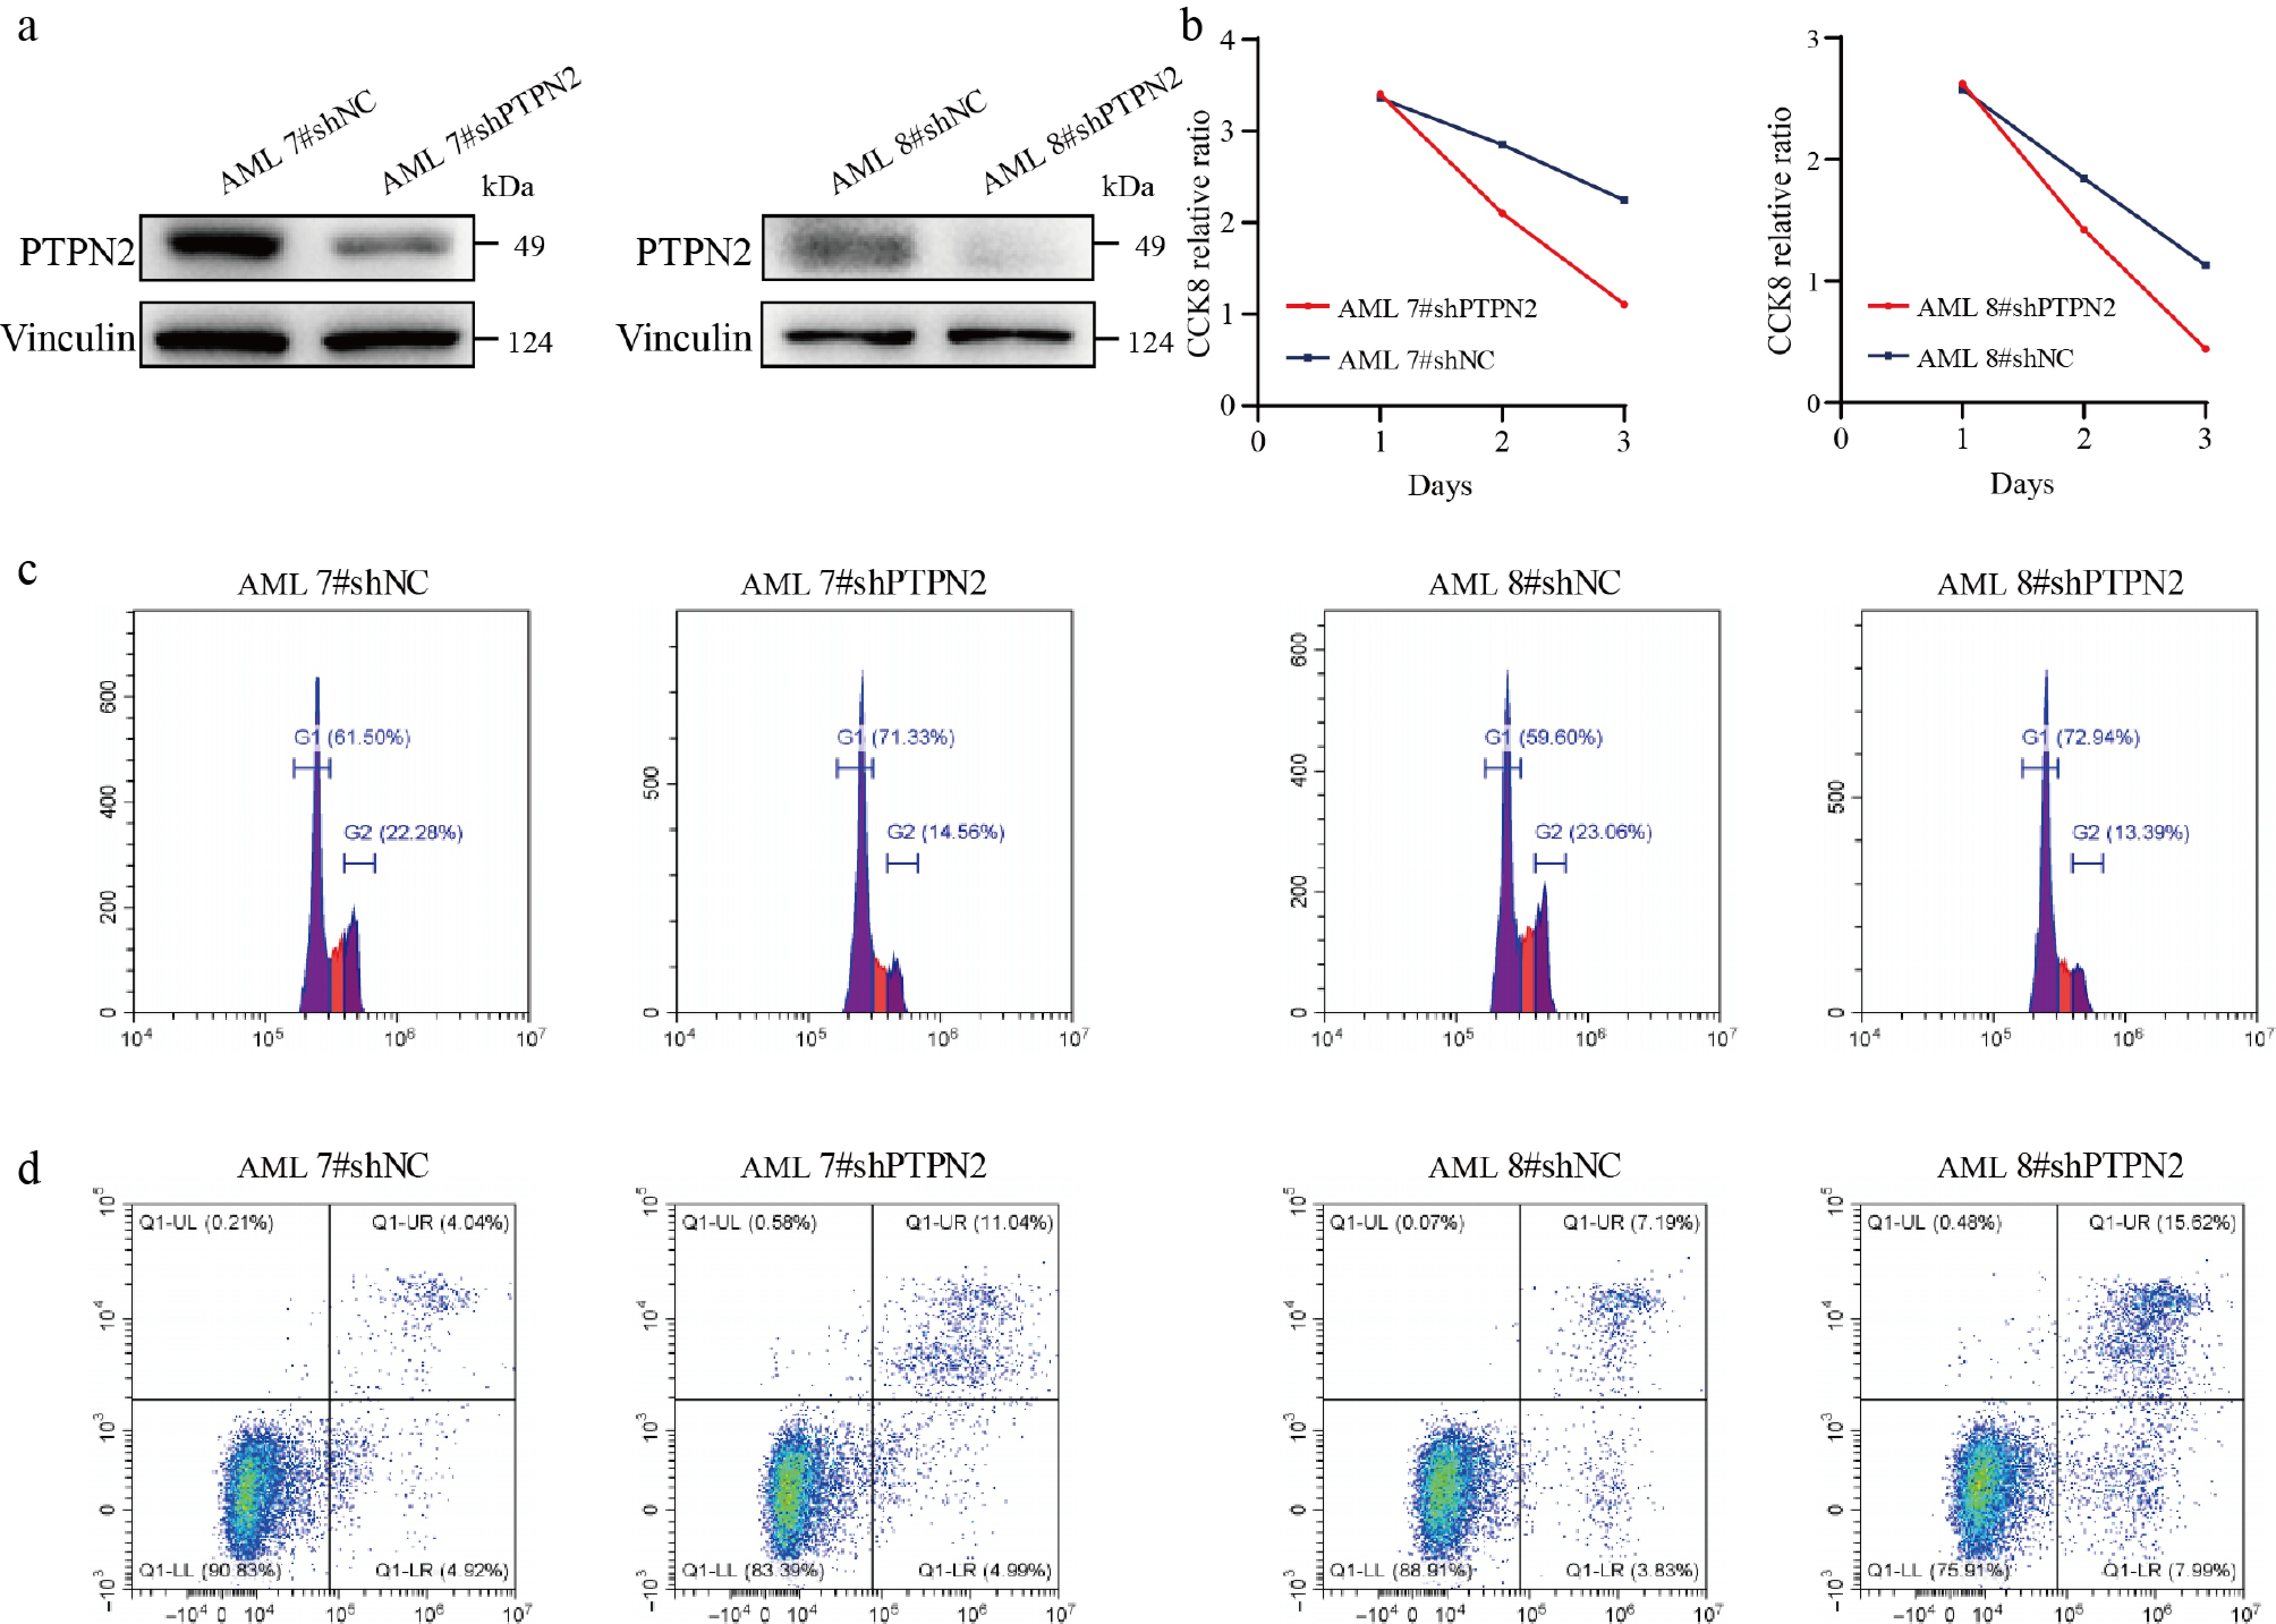
Figure 2.
Knockdown of PTPN2 significantly affects AML primary cell viability, cell cycle, and apoptosis. (a) The protein level of PTPN2 in AML primary cells that were infected with lentiviral shNC and shPTPN2. (b) Cell viability of shNC and shPTPN2 AML primary cells during a 3-d course. (c) Cell cycle phase distribution of shNC and shPTPN2 AML primary cells determined by flow cytometry. (d) Apoptotic rates of shNC and shPTPN2 AML primary cells determined by flow cytometry.
To investigate the regulatory role of PTPN2 in AML, we performed PTPN2 knockdown and subsequent rescue via overexpression in MOLM13 and NB4 cells (Fig. 3a and b; Supplementary Fig. S1a). The growth capacity of NB4 and MOLM13 cells with PTPN2 knockdown was significantly lower than that of NB4 and MOLM13 cells transfected with an empty lentiviral vector, while the overexpression of PTPN2 could rescue cell growth capacity (Fig. 3a and b). The cell cycle results showed that NB4 and MOLM13 cells with PTPN2 knockdown were arrested in the G1 phase; conversely, overexpression of PTPN2 resulted in the restoration of the cell cycle (Fig. 3c and e). Similarly, knockdown of PTPN2 could significantly increase apoptosis of NB4 and MOLM13 cells, and overexpression of PTPN2 resulted in the restoration of apoptosis (Fig. 3d and f). Then, we expressed the PTPN2 protein with a mutation of amino acid 216 (Fig. 3g) and found that PTPN2 (C216G) can indeed be inactivated (Supplementary Fig. S1b). Overexpressing the mutated PTPN2 (C216G) in knockdown NB4 and MOLM13 cells (Fig. 3h and i), the growth capacity of NB4 and MOLM13 cells with knockdown PTPN2 was significantly lower than that of cells transfected with an empty lentiviral vector, while the overexpression of the mutated PTPN2 (C216G) could not rescue cell growth capacity (Fig. 3h and i). Therefore, PTPN2 could regulate cell proliferation, cell cycle, and apoptosis of NB4 and MOLM13 cells. Moreover, we subcutaneously implanted the MOLM13 shNC and shPTPN2 cells into nude mice. Our findings demonstrated a lack of tumor formation in mice inoculated with MOLM13 cells that knocked down PTPN2, while mice inoculated with shNC cells exhibited noticeable tumor growth, and we observed no aberration in body weight among mice in comparison to the shNC group (Fig. 3j).
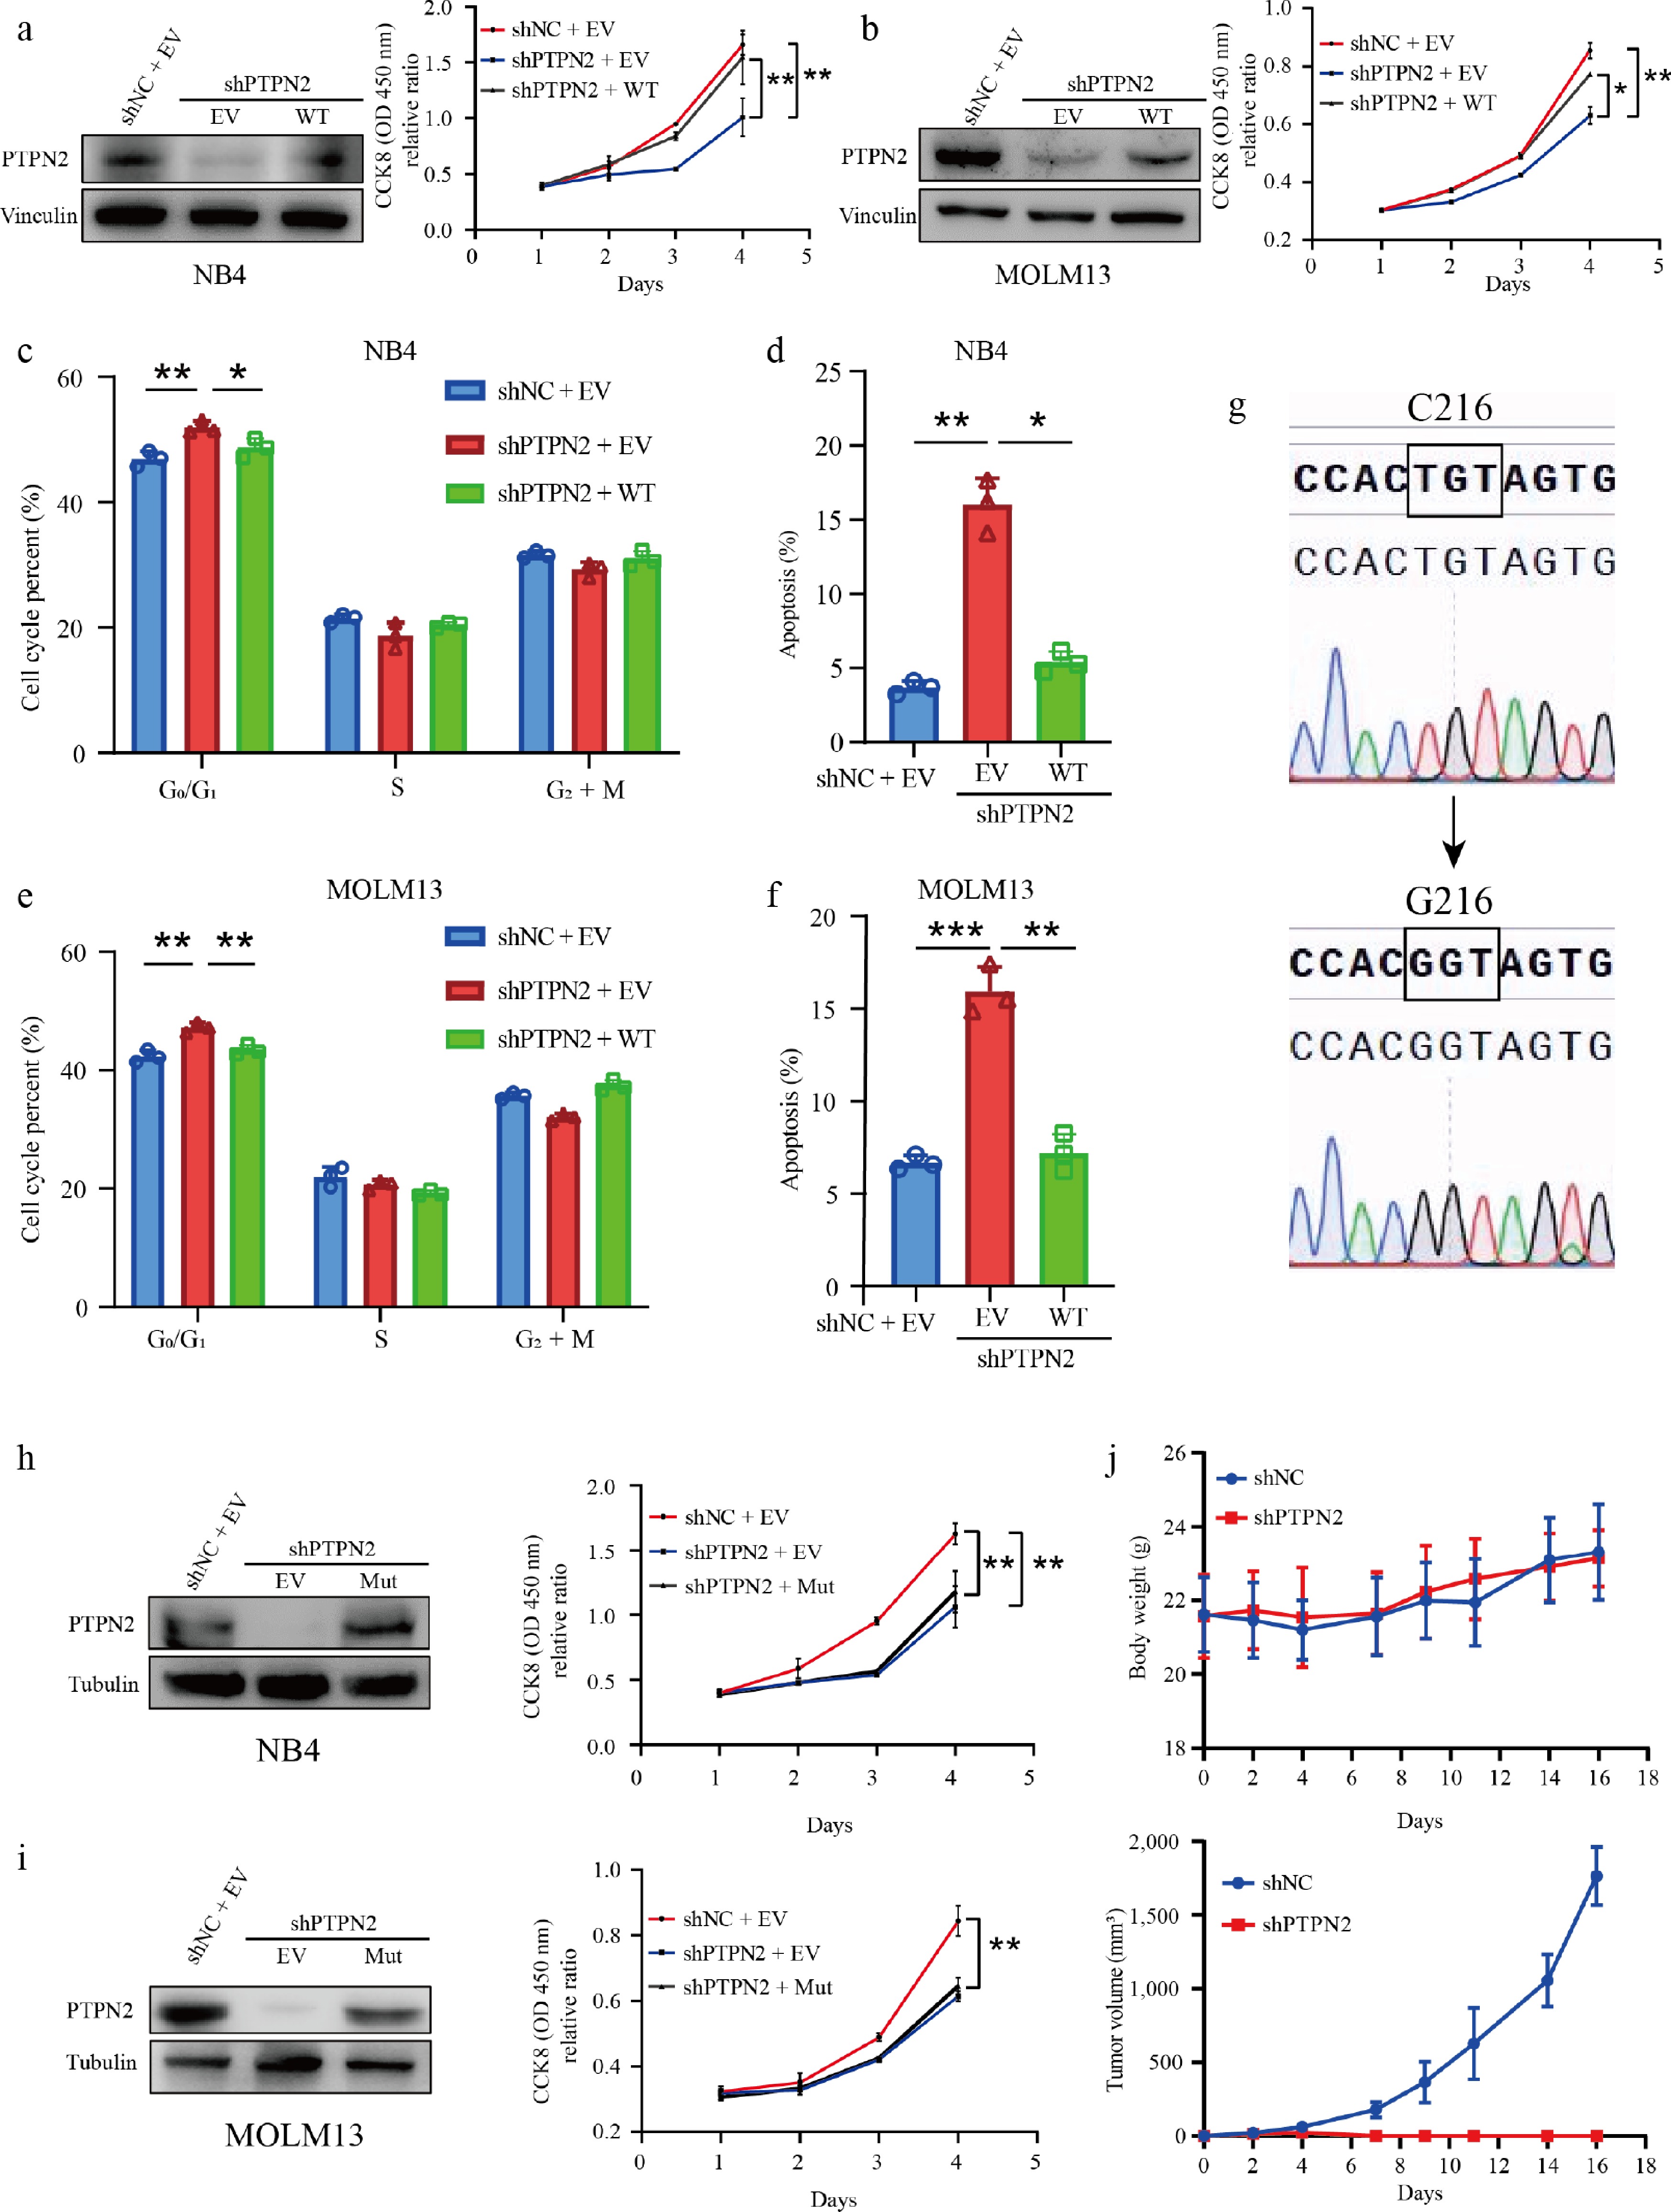
Figure 3.
Depletion of PTPN2 inhibits AML in vitro and in vivo. (a) PTPN2 protein levels in NB4 cells with PTPN2 knockdown and rescue overexpression. Cell viability of NB4 shNC, shPTPN2, and overexpression cells during a 4-d course. Data represent the mean ± SD. Statistical analysis was performed using a two-tailed unpaired Student's t-test. (b) PTPN2 protein levels in Molm13 cells with PTPN2 knockdown and rescue overexpression. Cell viability of MOLM13 shNC, shPTPN2, and overexpression cells during a 4-d course. Data represent the mean ± SD. Statistical analysis was performed using a two-tailed unpaired Student's t-test. (c), (d) Cell cycle phase distribution and apoptotic rates of NB4 shNC, shPTPN2, and overexpression cells were determined by flow cytometry. Data represent the mean ± SD. Statistical analysis was performed using a two-tailed unpaired Student's t-test. (e), (f) Cell cycle phase distribution and apoptotic rates of MOLM13 shNC, shPTPN2, and overexpression cells were analyzed by flow cytometry. Data represent the mean ± SD. Statistical analysis was performed using a two-tailed unpaired Student's t-test. (g) PTPN2 protein with mutation of amino acid 216, detected by Sanger sequencing. (h), (i) Protein level of PTPN2 in NB4 and MOLM13 shNC, shPTPN2, and overexpression PTPN2 C216G mutation (Mut) cells. Cell viability of cells during a 4-d course. Data represent the mean ± SD. Statistical analysis was performed using a two-tailed unpaired Student's t-test. (j) Male BALB/c nude mice were implanted subcutaneously with MOLM13 shNC and shPTPN2 cells (n = 5 in each group). Tumor masses were photographed and weighed after euthanizing mice. Body weights of mice were measured every 2 d. Data represent the mean ± SD. Statistical analysis was performed using a two-tailed unpaired Student's t-test. * P < 0.05; ** P < 0.01; *** P < 0.001.
We also overexpressed PTPN2 in K562 cells (Supplementary Fig. S1c); overexpression of PTPN2 in K562 cells significantly promoted the growth of K562 cells (Supplementary Fig. S1d). In summary, the significant decrease in AML burden both in vitro and in vivo was observed with the downregulation of PTPN2, underscoring its vital role in the regulation of AML.
PTPN2 knockdown modulates key signaling pathways in AML cells
-
To delineate the genes and signaling pathways modulated by PTPN2 in acute myeloid leukemia (AML), we performed RNA sequencing (RNA-Seq) on MOLM13 AML cells transduced with PTPN2 shRNA or a control empty lentiviral vector. The results showed that 479 genes were significantly upregulated and 527 genes were significantly downregulated in the PTPN2 knockdown group compared with the shNC group (Fig. 4a). Then, the Hallmark enrichment analysis showed that downregulated genes were mainly enriched in E2F targets, oxidative phosphorylation, G2M checkpoint, MYC target V1, and MYC target V2 pathways (Fig. 4b), and upregulated genes were mainly enriched in the P53 pathway etc. (Fig. 4c). Genome-wide enrichment analysis and GSEA analysis showed that PTPN2 knockdown could significantly downregulate MYC targets V1, MYC targets V2, G2M checkpoint, E2F targets, and upregulate the P53 pathway, which suggested that knockdown of PTPN2 is associated with the inhibition of the cell cycle and cell proliferation (Fig. 4d and e). The WB assay showed that knockdown of PTPN2 downregulated CDK4, CDK6, P-Rb, c-MYC, BCL-2, and XIAP. At the same time, P21, P27, and P53 were upregulated (Fig. 4f). These results suggest that knockdown of PTPN2 can inhibit cells by regulating the cell cycle, apoptosis, and proliferation.
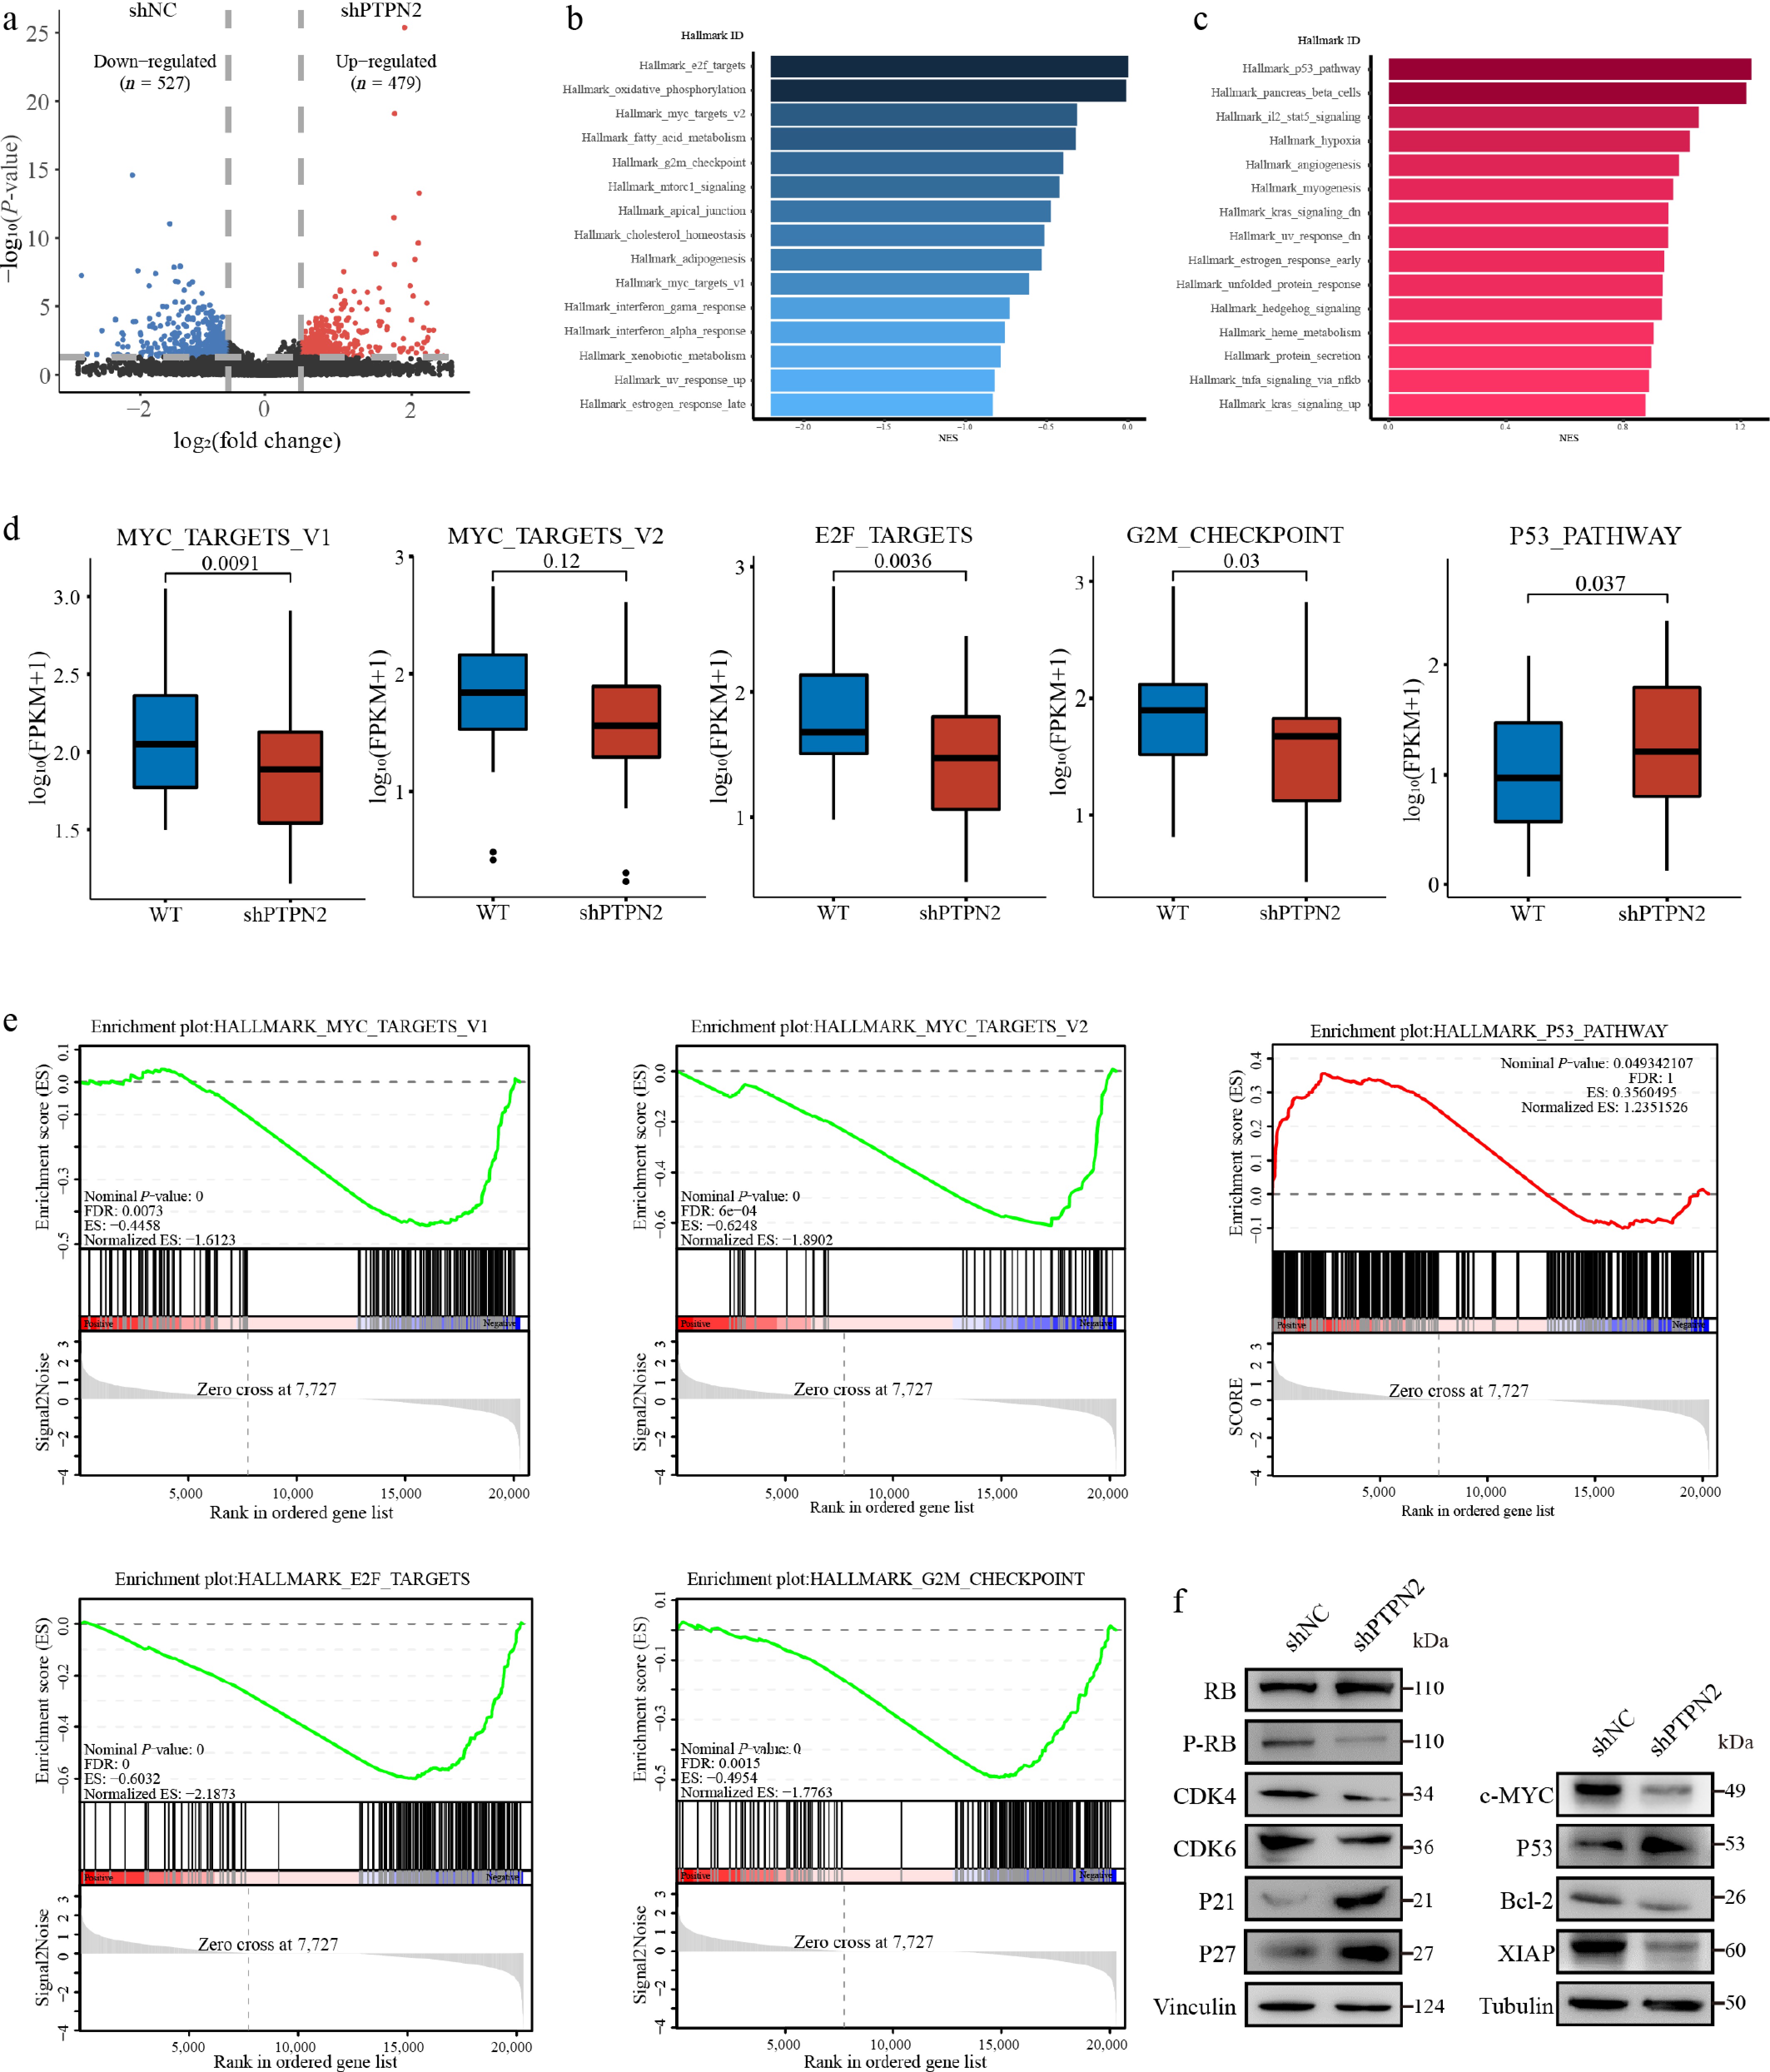
Figure 4.
RNA sequencing combined validation assays to identify affected signaling pathways of PTPN2 loss in AML cells. (a) Volcano plot of significantly affected (absolute fold change > 2, P-value < 0.05) genes in the MOLM13 shPTPN2 group relative to shNC group, as revealed by RNA-seq. P-values were calculated using R v4.0.3 software. (b), (c) Bar graphs show the core-enriched downregulated (blue) and upregulated (red) signaling pathways in shPTPN2 groups when compared with shNC groups, respectively. (d) The relative abundance of genes involved in MYC targets V1, MYC targets V2, E2F targets, G2M checkpoint, and P53 pathway in MOLM13 PTPN2 KD cells. The quantile percentile is illustrated by the whiskers of the box plot, where minima, 25%, median, 75%, and maxima are displayed from bottom to top, respectively. The application of a two-tailed Student's t-test was conducted without considering adjustments for multiple comparisons, specifically the false discovery rate (FDR). (e) The signaling pathways enriched in different groups obtained through Gene Set Enrichment Analysis (GSEA). (f) Immunoblotting analysis of protein in MOLM13 shPTPN2 and shNC cells. The experiments in (f) were repeated three times with similar results.
c-MYC is a novel PTPN2 substrate
-
To investigate the molecular mechanism of PTPN2 function and investigate the potential target of PTPN2, high-throughput quantitative phosphoryl proteomics analysis was performed on MOLM13 cells with PTPN2 knocked down (Fig. 5a). A total of 22,454 phosphoric acid sites were identified, of which 19,947 (88.83%) were serine, 2,309 (10.28%) were threonine, and 198 (0.88%) were tyrosine (Supplementary Fig. S2a). Our comprehensive analysis of significantly upregulated and downregulated phosphorylated proteins revealed major pathways in which PTPN2 might be involved (Supplementary Fig. S2b). We also analyzed the proteins binding to PTPN2 by immunoprecipitation mass spectrometry, and the results showed that 31 proteins could bind to PTPN2 (Supplementary Fig. S2c and S2d), and c-MYC appeared among the up-phosphorylated proteins and PTPN2-binding proteins (IP) (Fig. 5b). We focused on the target of c-MYC, which is involved in regulating cell proliferation, differentiation, growth, apoptosis, cell cycle progression, intracellular biomolecular metabolism, and malignant transformation of cells[45−47]. Heat maps showed that phosphorylation levels of P-c-MYC (S62) and P-c-MYC (T58) were upregulated (Supplementary Fig. 2e). The mass spectra of c-MYC proteins pT58 and pS62 are shown in Fig. 5c and Supplementary Fig. S2f. They were clearly fragmented and could be used for peptide recognition and site localization.
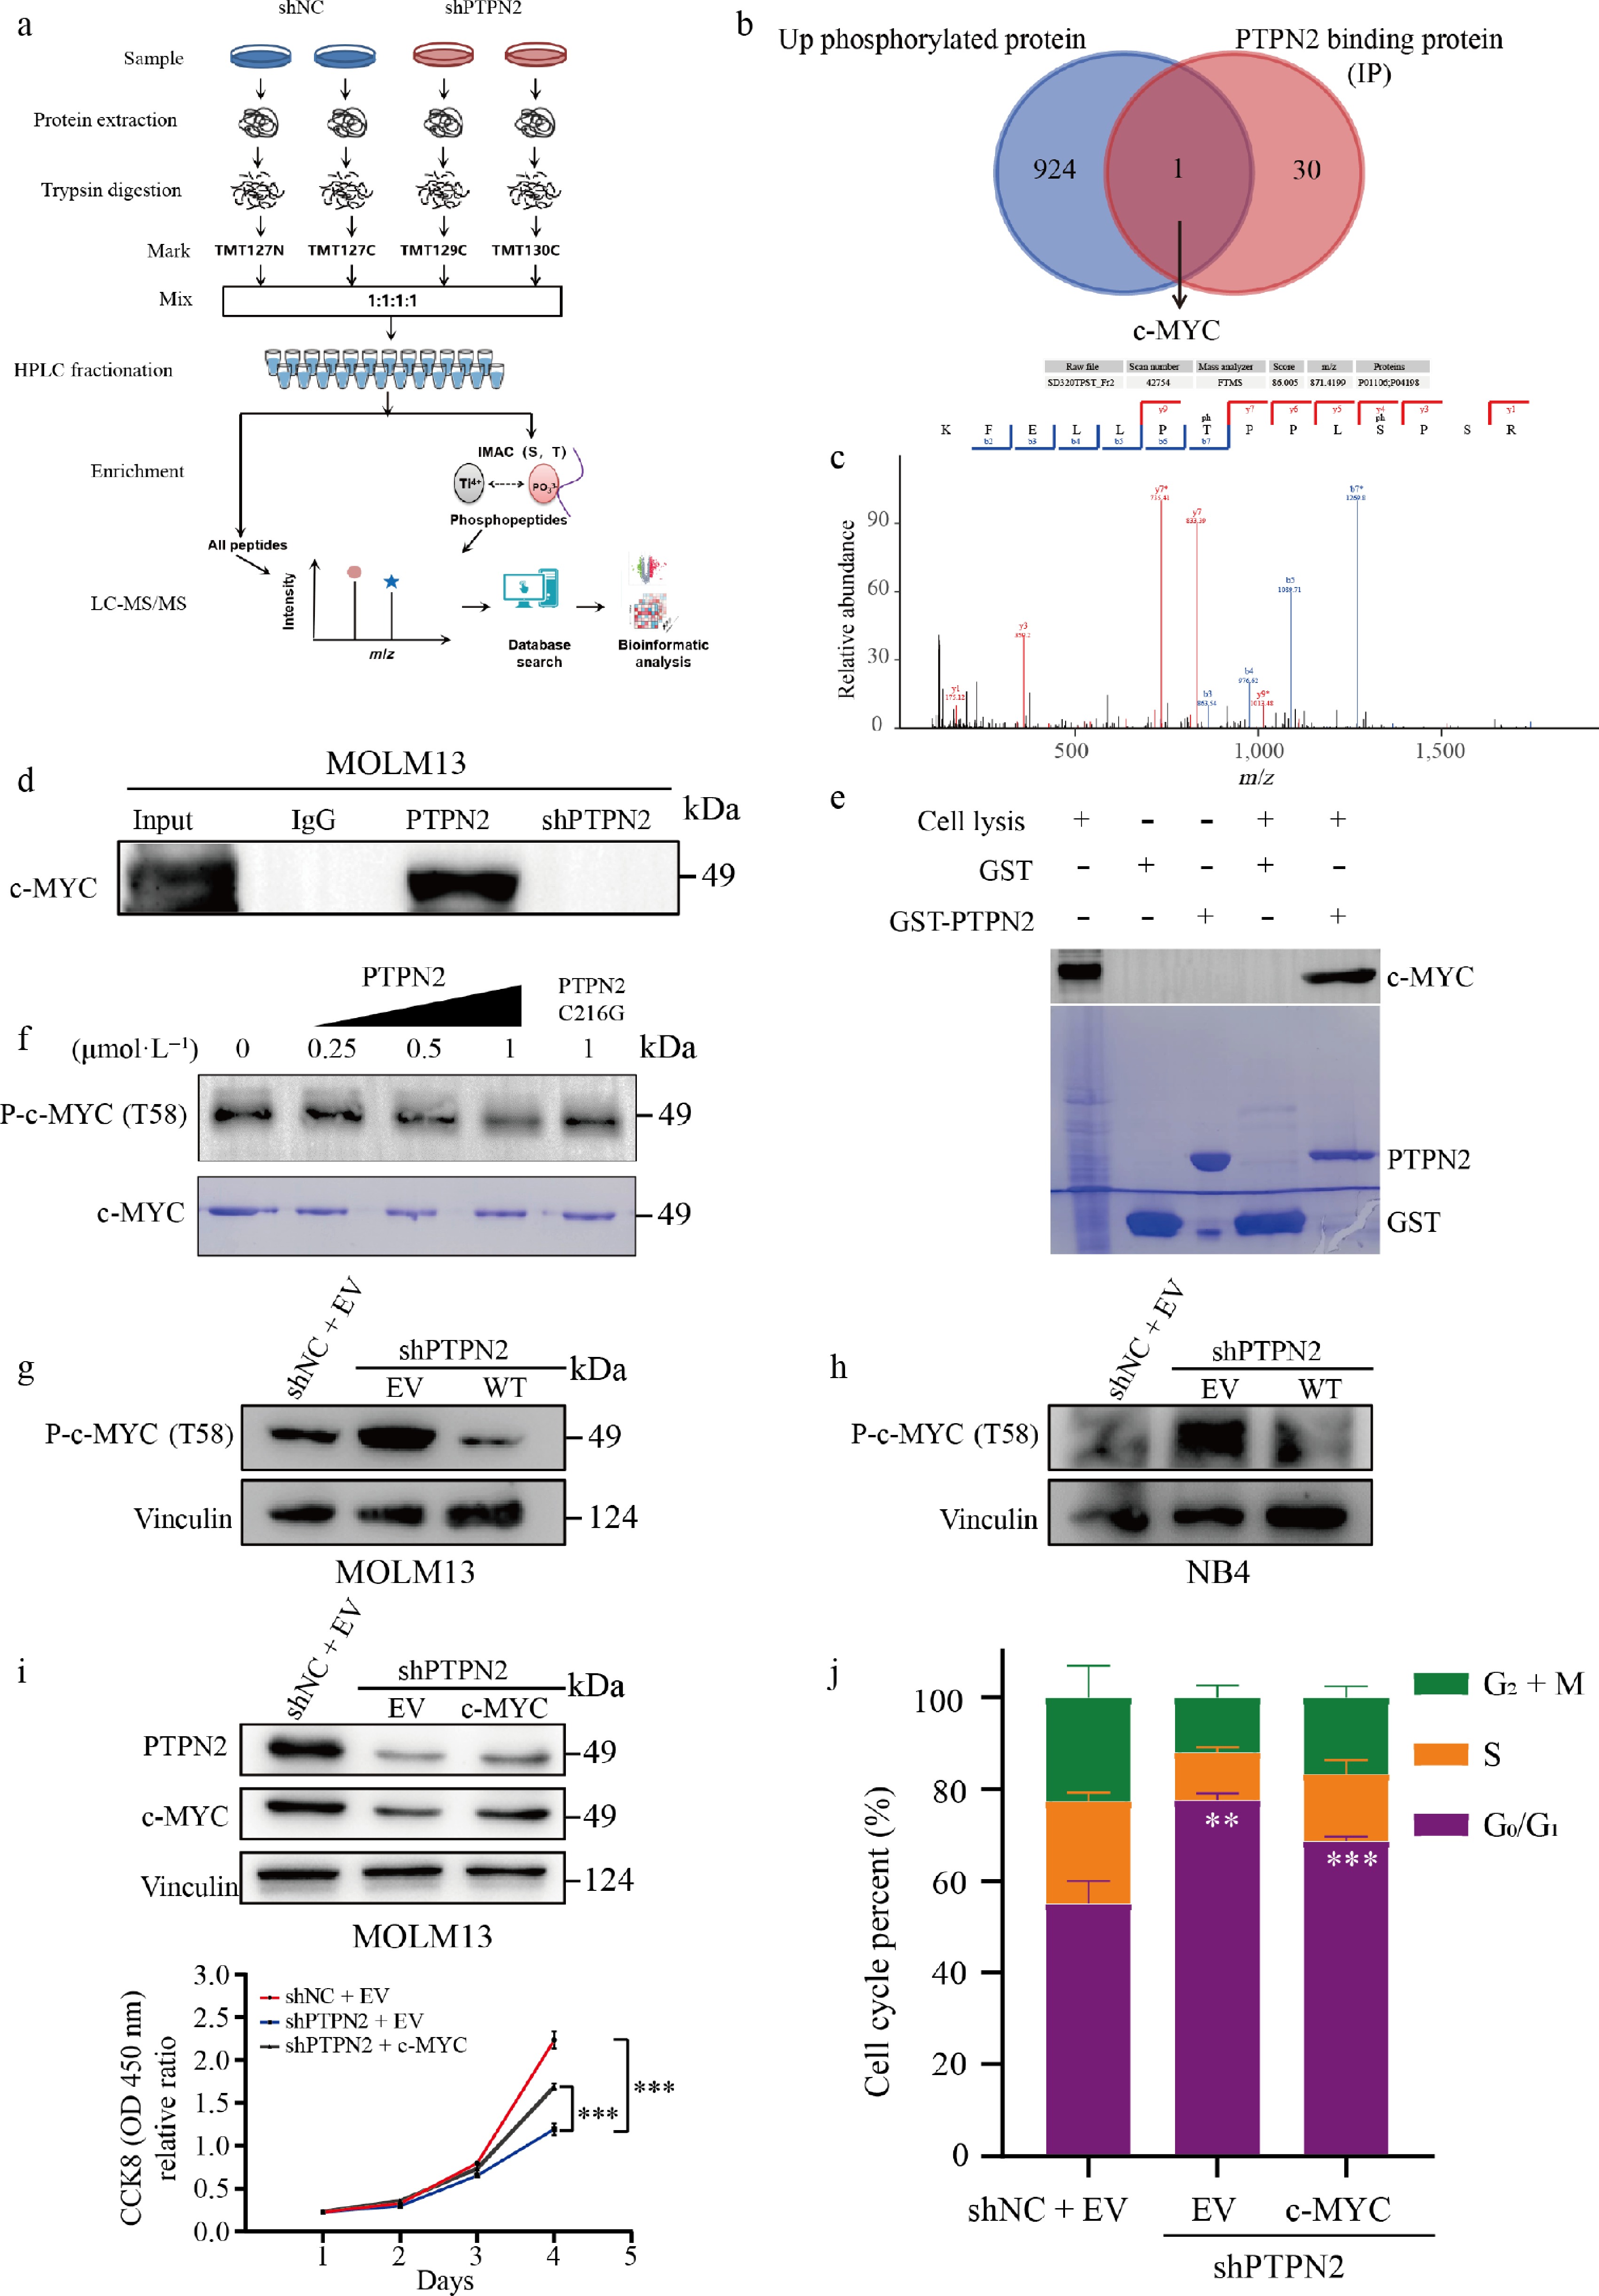
Figure 5.
Quantitative phosphoproteomic analysis of MOLM13 cells with PTPN2 knockdown and validation of PTPN2 substrates. (a) Workflow of the phosphoproteomic approach. Samples were separately lysed, digested, and TMT marked and the phosphorylated peptides were enriched by the IMAC tip and analyzed by LC-MS/MS. (b) Venn diagrams show the overlap of up-phosphorylated proteins and PTPN2-binding proteins (IP). (c) MS/MS spectra of the phosphosites of the potential PTPN2 substrates, pT58 of c-MYC. (d) Validation of interaction of c-MYC with PTPN2 by co-immunoprecipitation assay. (e) Validation of interaction of c-MYC with PTPN2 by GST pull assay. (f) Dephosphorylated c-MYC T58 levels by PTPN2 were assessed by western blot in an in vitro dephosphorylation assay. (g), (h) Protein level of P-c-MYC (T58) in MOLM13 and NB4 cells that were infected with lentiviral shNC, shPTPN2, and overexpression. (i) Protein level of PTPN2 and c-MYC in MOLM13 shNC, shPTPN2 and overexpression c-MYC cells. Cell viability of cells during a 4-d course. Data represent the mean ± SD. Statistical analysis was performed using a two-tailed unpaired Student's t-test. (j) Cell cycle phase distribution of MOLM13 shNC, shPTPN2, and overexpression c-MYC cells analyzed by flow cytometry. Data represent the mean ± SD. Statistical analysis was performed using a two-tailed unpaired Student's t-test. ** P < 0.01; *** P < 0.001.
We then detected the binding effect of PTPN2 and c-MYC using a Co-IP assay; the WB results showed that PTPN2 could bind c-MYC in MOLM13 cells, but could not bind c-MYC when PTPN2 was knocked down (Fig. 5d). The GST pull-down was used to detect the interaction between PTPN2 and c-MYC. WB results showed that the negative control GST-tagged protein could not bind c-MYC in MOLM13 cell lysate, while the GST-PTPN2 recombinant protein could bind c-MYC in MOLM13 cell lysate (Fig. 5e). These results fully confirmed that PTPN2 could interact with endogenous c-MYC. We also performed an in vitro phosphatase assay using purified PTPN2 and c-MYC proteins. As shown in Fig. 5f, PTPN2 effectively dephosphorylated c-MYC T58, while the phosphatase-deficient PTPN2 mutant (C216G) was inactive. WB results showed that knockdown of PTPN2 upregulated the expression of P-c-MYC (T58) in MOLM13 and NB4 cells, while overexpression of PTPN2 downregulated the expression of P-c-MYC (T58) in cells (Fig. 5g and h). In summary, c-MYC is the direct substrate of PTPN2.
We examined whether c-MYC would mediate PTPN2 function in AML cell lines. We overexpressed c-MYC in MOLM13 cells with PTPN2 knockdown (Fig. 5i). The growth ability of MOLM13 cells with PTPN2 knockdown was significantly lower than that of MOLM13 cells transformed into empty virus, but overexpression of c-MYC could rescue cell growth capacity (Fig. 5i). The results of the cell cycle assay showed that MOLM13 cells with PTPN2 knockdown were significantly arrested in the G1 phase, and overexpression of c-MYC in MOLM13 cells with PTPN2 knockdown could result in the restoration of cell cycle (Fig. 5j). Following PTPN2 knockdown, quantitative real-time PCR (qRT-PCR) analysis revealed altered expression of c-MYC downstream target genes (Supplementary Fig. S2g).
In order for deeper analysis of potential PTPN2 target proteins and the effects of phosphoserine on c-MYC function, we performed large-scale genomic analyses of the TCGA database and found that PTPN2 deletion and c-MYC amplification or missense mutation were found to be almost mutually exclusive in AML (Supplementary Fig. S3a). The reduction in c-MYC protein levels resulting from PTPN2 knockdown can be reversed by the proteasome inhibitor MG132, suggesting that PTPN2 knockdown influences the stability of the c-MYC protein (Supplementary Fig. S3b). The phosphorylation of c-MYC at T58 plays a crucial role in the degradation of c-MYC induced by PTPN2 knockdown, as the c-MYC T58 mutant, which cannot be phosphorylated at this site, is not as readily degraded by PTPN2 knockdown (Supplementary Fig. S3c). By combining PTPN2 knockdown with proteasome inhibitor treatment in a time-course cycloheximide (CHX) chase assay in Molm13 cells, we confirmed that PTPN2 depletion accelerates proteasome-mediated degradation of c-MYC protein (Supplementary Fig. S3d). The findings indicate that reducing PTPN2 levels enhances T58 phosphorylation of c-MYC, leading to degradation of c-MYC.
PTPN2 inhibitor WS35 significantly inhibited growth of AML in vitro and in vivo
-
The above results suggest that targeting PTPN2 may have potential clinical therapeutic significance. Therefore, we used the PTPN2 small-molecule inhibitor WS35, which was previously discovered in our research, as a molecular tool (Fig. 6a). We evaluated the inhibition of WS35 on the proliferation of AML cells using the cell counting kit-8 (CCK8) assay. WS35 inhibited MOLM13 and NB4 cells with IC50 values of 8.9 and 8.0 μmol·L−1, respectively (Fig. 6e), and WS35 significantly inhibited the growth of MOLM13 and NB4 cells in a concentration-dependent manner (Fig. 6a). In addition, WS35 could arrest the cell cycle of MOLM13 and NB4 cells in G1 phase in a concentration-dependent manner (Fig. 6b and c) and promote the apoptosis of MOLM13 and NB4 cells in a concentration-dependent manner (Fig. 6b and c). The WB assay showed that WS35 could significantly upregulate the expression of P-c-MYC (T58) and P27, while c-MYC, CDK4, and Bcl-2 were significantly downregulated in MOLM13 cells and NB4 cells (Fig. 6d). In addition, we overexpressed the c-MYC and c-MYC T58 mutant proteins in MOLM13 and NB4 cells, and examined the inhibitory activity of WS35 on them. The experimental results showed that the inhibitory activity of WS35 on the overexpressed c-MYC T58 mutant MOLM13 and NB4 cells was significantly reduced, with IC50 values of 38.7 and 166.5 μmol·L−1 respectively, while the inhibitory activity on the over-expressed c-MYC MOLM13 and NB4 cells remained basically unchanged, with IC50 values of 10.9 and 8.3 μmol·L−1 respectively (Fig. 6e). The growth ability of MOLM13 and NB4 cells with WS35 and cell overexpression of c-MYC with WS35 was significantly lower than that of cell overexpression of c-MYC T58 mutation protein with WS35 (Fig. 6f). These results indicate that WS35 can inhibit the activity of PTPN2, leading to an increase in the phosphorylation at position T58 of c-MYC and the degradation of c-MYC, thereby suppressing cell proliferation. Overexpression of PTPN2 rescues G1 phase arrest, apoptosis, and decreased c-MYC phosphorylation induced by WS35 treatment (Supplementary Fig. S4a and S4b). In summary, knockdown of PTPN2 and the use of the small-molecule inhibitor WS35 had similar effects on AML cells when tested in vitro. Both methods inhibited cell growth by causing G0/G1 arrest and inducing apoptosis.
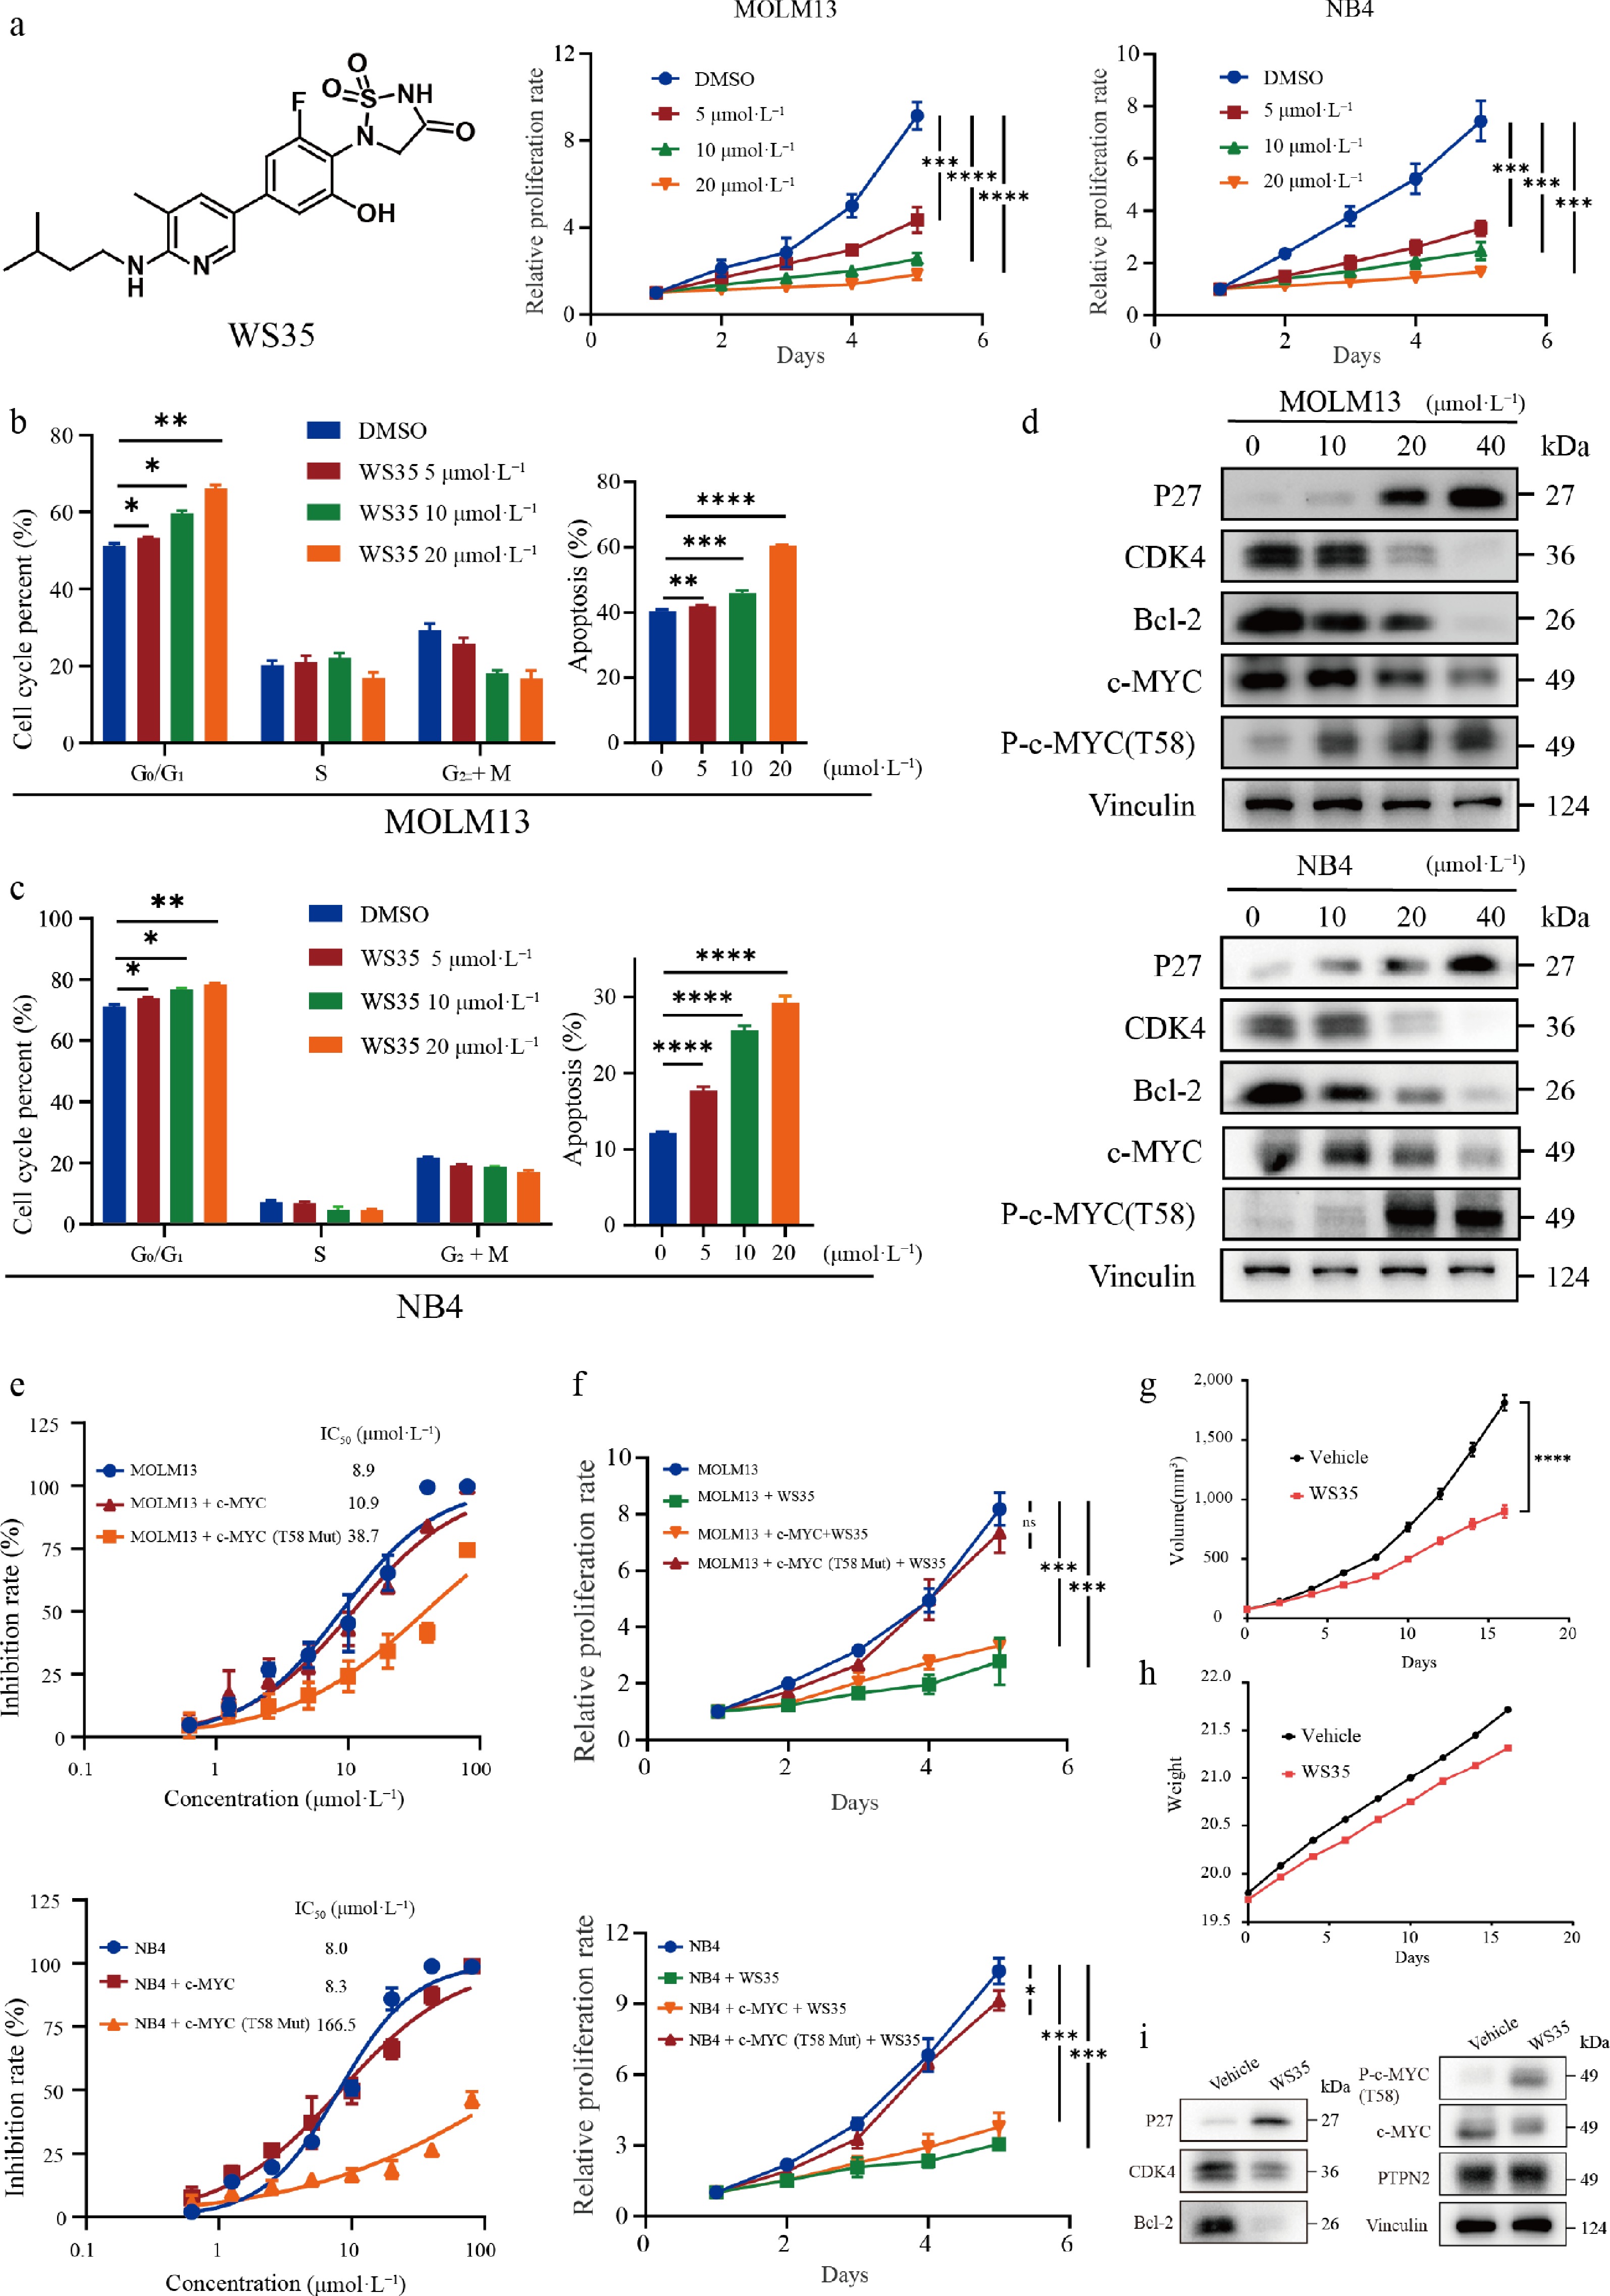
Figure 6.
The PTPN2 inhibitor WS35 suppresses AML cell proliferation both in vitro and in vivo. (a) Structure of the PTPN2 inhibitor WS35 and cell viability of MOLM13 and NB4 cells treated with DMSO or 5, 10, or 20 μmol·L−1 WS35 during a 5-d course. Data represent the mean ± SD. Statistical analysis was performed using a two-tailed unpaired Student's t-test. (b) Cell cycle phase distribution and apoptotic rates of MOLM13 cells after treatment with DMSO, WS35 (5, 10, 20 μmol·L−1) for 24 h were determined by flow cytometry. Data represent the mean ± SD. Statistical analysis was performed using a two-tailed unpaired Student's t-test. (c) Cell cycle phase distribution and apoptotic rates of NB4 cells after treatment with DMSO, WS35 (5, 10, 20 μmol·L−1) for 24 h were determined by flow cytometry. Data represent the mean ± SD. Statistical analysis was performed using a two-tailed unpaired Student's t-test. (d) The total proteins in MOLM13 and NB4 cells were extracted and used in the western blotting analysis of indicated proteins. (e) IC50 values of WS35 against the viability of MOLM13 and NB4 cells and overexpressed c-MYC and c-MYC T58 mutant proteins in MOLM13 and NB4 cells. Data represent the mean ± SD, n = 3 biological replicates. (f) Cell viability of in MOLM13 and NB4 cells and overexpressed the c-MYC and c-MYC T58 mutant proteins in MOLM13 and NB4 cells treated with 10 μmol·L−1 WS35 during a 5-d course. Data represent the mean ± SD. Statistical analysis was performed using a two-tailed unpaired Student's t-test. (g) Male BALB/c nude mice were implanted subcutaneously with NB4 cells, and they were divided into a control group and a treatment group (n = 6 in each group). Tumor volume of mice in each group. (h) Body weight of mice in each group. (i) The total proteins in tumor tissue were extracted and used in the western blotting analysis of the indicated proteins. Data represent the mean ± SD. Statistical analysis was performed using a two-tailed unpaired Student's t-test. * P < 0.05; ** P < 0.01; *** P < 0.001; **** P < 0.0001; ns, not significant.
We then evaluated the in vivo activity of WS35 in NB4 cells of nude mice. Intraperitoneal administration was performed once daily, with a dosage of 20 mg·kg−1 (Supplementary Fig. S5a). The results indicated that at an administration dose of 20 mg·kg−1, WS35 could significantly inhibit the volume (Fig. 6g; Supplementary Fig. S5b) of AML in mice. Meanwhile, at a dose of 20 mg·kg−1, WS35 did not have a significant effect on the weight of the mice (Fig. 6h). Western blot analysis of the tumor tissues showed a decrease in levels of CDK4, Bcl-2, and c-MYC, while P27 and P-c-MYC (T58) were found to be upregulated in vivo (Fig. 6i). H&E staining (Supplementary Fig. S5c) and Ki-67 immunohistochemical analysis (Supplementary Fig. S5d and S5e) of tumor tissues indicated that WS35 exhibited potent efficacy in killing tumor cells and inhibiting AML cell proliferation. This result indicated that WS35 had a good anti-AML effect.
We inferred the mechanism of action of WS35, as shown in Fig. 7. WS35 promoted the phosphorylation of c-MYC T58 by inhibiting the activity of PTPN2, thereby increasing the proteasome-mediated degradation of c-MYC, leading to the downregulation of CDK4, which arrested the cell cycle in the G1 phase, and finally achieved the effect of AML treatment.
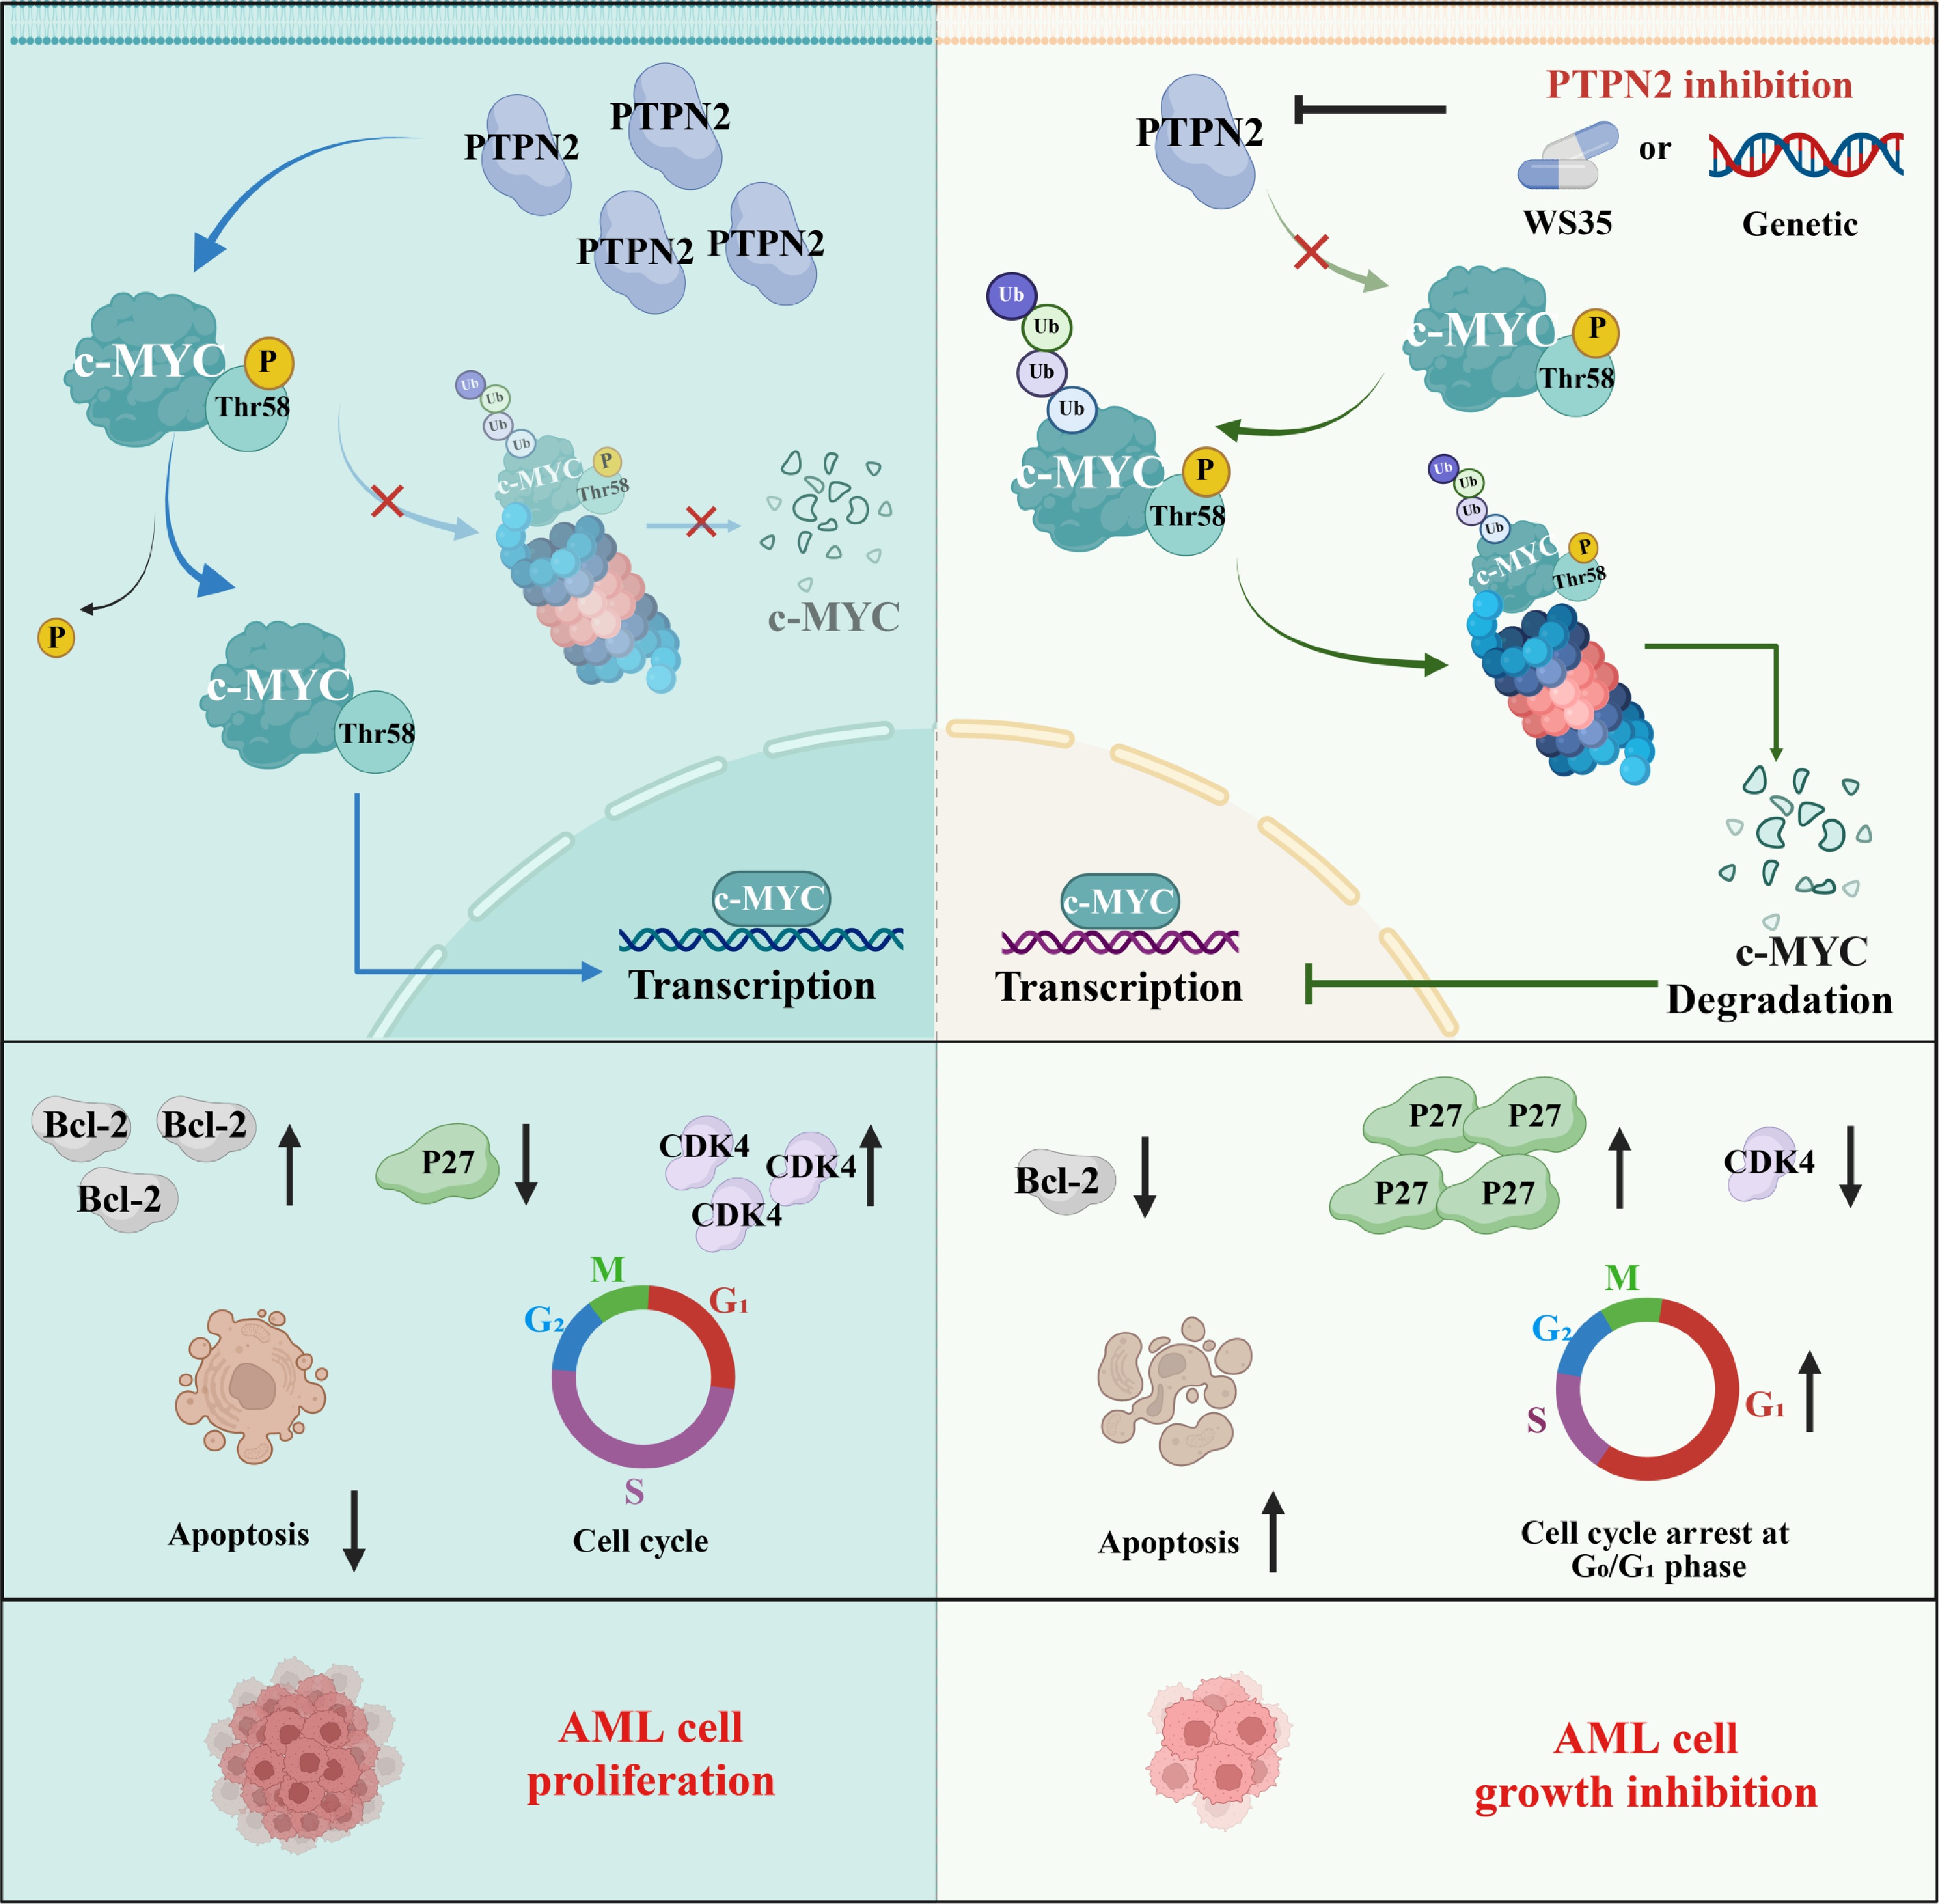
Figure 7.
A proposed working model showing the PTPN2/c-MYC/CDK4 signaling axis and its roles in contributing to AML proliferation.
-
Acute myeloid leukemia (AML) is a complex and life-threatening hematological condition that impacts the blood, bone marrow, and lymphoid systems of the body[48−50]. As our comprehension of the molecular genetic changes underlying the pathogenesis of AML has expanded, recent research has primarily focused on addressing intracellular pathways regulated by these anomalous proteins. The potential of molecular targeting as a prospective approach to treating AML is significant[51−55].
There have been remarkable developments in the progress of drugs that target the PTPN family; these medications have proven effective in treating diverse human conditions[42,43,56−59]. PTPN2 plays a key role within the PTPN family, with prior research indicating that deactivation of PTPN2 may have a role in the formation of tumors by enhancing PTK signaling[35−37]; however, it cannot be ruled out that the removal of PTPN2 within the framework of other cancer-causing incidents[60]. The response of IFNγ/JAK/STAT-1 is of utmost importance in the progression of immunotherapy in various tumors; furthermore, it plays a crucial role in anti-cancer immunity and cellular therapies that utilize T cells/CAR-T cells. Recent studies have shown that PTPN2 deletion promotes IFN/JAK-1/STAT-1 signaling, T cell recruitment, and antigen presentation in melanomas and colon tumors, thereby enhancing anti-tumor immunity[15,39,40,43]. In our prior investigations, we substantiated that PTPN2 is a key prognostic factor of pancreatic adenocarcinoma; in addition, pan-cancer analysis showed that PTPN2 is highly expressed in AML[44]. Thus, the role of PTPN2 in cancer is complex and context-dependent. Taking into consideration the crucial role of PTPN2 in cancers, we conducted data mining utilizing TCGA and gene chip approaches. The analysis revealed that PTPN2 exhibited high expression levels in AML, which displayed a positive correlation with both clinical prognosis and mortality (Fig. 1a–e). Furthermore, we observed a heightened expression of PTPN2 in both AML patient samples and cells (Fig. 1g–i). Furthermore, we isolated AML primary cells from two additional blood samples obtained from patients with AML, and the knockdown of PTPN2 significantly impacts the viability, cell cycle, and apoptosis of these AML primary cells (Fig. 2a–d).
To further verify the regulatory effect of PTPN2 on AML cells, genetic inhibition of PTPN2 significantly reduced the burden of AML (Fig. 3a–f). In addition, PTPN2 knockdown resulted in the loss of tumorigenicity in mice (Fig. 3j). These findings collectively suggest that PTPN2 represents a promising therapeutic target for combating AML. Then, we conducted transcriptome sequencing analysis (RNA-Seq) on MOLM13 cells. The Hallmark enrichment analysis results showed that downregulated genes were mainly enriched in the E2F targets pathway, etc., which suggested that knockdown of PTPN2 is associated with inhibition of cell cycle and cell proliferation (Fig. 4b–f). Then, high-throughput protein phosphorylation and omics analysis identified c-MYC as a direct substrate of PTPN2 (Fig. 5a–j). Therefore, PTPN2 has significant potential as a target for the development of drugs to effectively address AML.
Subsequently, we employed the small-molecule inhibitor WS35 targeting PTPN2, which was identified in prior research conducted by our team, as a molecular tool (Fig. 6a). In vitro experimental results indicated that WS35 exerted a pronounced inhibitory effect on AML cells, subsequently blocking the cell cycle in the G1 phase and facilitating apoptosis in AML cells (Figs. 6a–c). Furthermore, WS35 exhibited a notable anti-AML efficacy in vivo (Fig. 6g and h). It is worth acknowledging that WS35 has limited selectivity between PTPN2 and its highly homologous paralog PTP1B, a feature that could theoretically confer potential off-target-associated toxicity in further translational development. Despite this, our current in vivo studies have demonstrated that WS35 is generally well tolerated in animal models, with no overt severe toxicities observed. This imperfect selectivity constitutes a limitation of the present compound, and targeted optimization to enhance PTPN2 isoform selectivity will be a central focus of our follow-up medicinal chemistry work. Additionally, we observed a discrepancy in tumor growth inhibitory efficacy between WS35 pharmacological treatment and PTPN2 genetic knockdown, with genetic ablation of PTPN2 exerting a more pronounced anti-tumor effect. This phenotypic gap strongly indicates that PTPN2 possesses non-enzymatic functions independent of its phosphatase catalytic activity. Systematic dissection of these non-enzymatic roles and their relevance to AML progression will be an important focus of our follow-up mechanistic investigations. c-MYC, when phosphorylated at T58, is identified by the E3 ubiquitin ligase FBXW7 and subsequently undergoes degradation via the 26S proteasome. The findings indicate that WS35 promoted the phosphorylation of c-MYC at T58 by inhibiting the activity of PTPN2. This action enhanced the proteasomal degradation of c-MYC, which ultimately led to the downregulation of CDK4/6 and induced a halt in the cell cycle during the G1 phase, thus achieving the intended therapeutic effect for AML (Fig. 7).
-
In summary, our findings reveal a previously unrecognized activity of PTPN2 and its mechanism of action on AML regulation. Additionally, we used the PTPN2 small-molecule inhibitor WS35 as a tool molecule to verify that WS35 can significantly inhibit the proliferation of AML, and WS35 can be used as a small-molecule probe for further biological studies. Furthermore, since PTPN2 is involved in critical processes in various types of human cancers, targeting this protein could potentially benefit patients with other refractory cancers as well.
-
All animal procedures were approved by the Animal Ethics Committee of China Pharmaceutical University (Nanjing, China; approval no. YSL-202505008). The research followed the "Replacement, Reduction, and Refinement" principles to minimize harm to animals. The use of human samples complied with the Measures for Ethical Review of Life Science and Medical Research Involving Humans (2023) and was determined by the Ethics Committee of Jiangsu Province Hospital of Chinese Medicine to be exempt from ethical review, as the samples were used solely for scientific research, posed no harm to participants, and involved no sensitive personal information or commercial interests.
-
The authors confirm their contributions to the paper as follows: conceived the project: Kuang W, Wang D, Song M, Liu J, Li J, Gu W, Xiao Y, Wang X, Yang P; contributed to data analysis, manuscript writing, review, and editing: Kuang W, Wang D, Song M, Liu J, Li J, Wang W, Chen A, Chen Y, Ding J, Wang L, Gu W, Xiao Y, Wang X, Yang P; contributed to cancer database analysis: Kuang W, Wang D, Wang X, Ding J, Li J; contributed to biological experiments, including protein expression and purification, cell proliferation assays, lentivirus production and infection, real-time quantitative PCR, immunoprecipitation, western blotting, colony formation assays, migration and invasion assays, cell cycle and apoptosis assays, RNA-seq sequencing, GST pull-down, etc.: Kuang W, Song M, Liu J, Wang D, Wang X, Chen A, Xiao Y; contributed to structure-based virtual docking: Kuang W, Wang W, Song M; Kuang W, Song M, Wang W, Liu J, Wang L, and Yang P contributed to the design and synthesis of PTPN2 inhibitors; contributed to the in vivo acute toxicity properties and anti-tumor activity in vitro and in vivo: Kuang W, Wang D, Yang P. All authors reviewed the results and approved the final version of the manuscript.
-
The raw RNA-seq data generated in this study have been deposited in the Genome Sequence Archive for Humans (https://ngdc.cncb.ac.cn/gsa-human) under the accession number: HRA006552. The mass spectrometry proteomics, as well as identified and significantly regulated phosphosite data, have been deposited in the ProteomeXchange Consortium (https://proteomecentral.proteomexchange.org) via the iProX partner repository with the dataset identifier PXD048854.
-
The authors declare that they have no conflict of interest.
-
accompanies this paper online at: https://doi.org/10.48130/targetome-0026-0052.
-
#Authors contributed equally: Wenbin Kuang, Dawei Wang, Mingge Song, Jianing Liu, Jiaxing Li
- Supplementary Table S1 Clinicopathologic information of eight AML patients.
- Supplementary Fig. S1 Knockdown or over-expression of PTPN2 significantly affect AML in vitro and in vivo.
- Supplementary Fig. S2 IP and quantitative phosphoproteomic analysis of PTPN2 knock down MOLM13 cells.
- Supplementary Fig. S3 Analysis of potential PTPN2 target proteins and the effects of phosphoserine on MYC protein expression.
- Supplementary Fig. S4 Analysis of WS35-induced phenotypic alterations in cells with ectopic PTPN2 overexpression.
- Supplementary Fig. S5 In vivo antitumor efficacy of WS35.
- Copyright: © 2026 by the author(s). Published by Maximum Academic Press on behalf of China Pharmaceutical University. This article is an open access article distributed under Creative Commons Attribution License (CC BY 4.0), visit https://creativecommons.org/licenses/by/4.0/.
-
About this article
Cite this article
Kuang W, Wang D, Song M, Liu J, Li J, et al. 2026. Targeting PTPN2-mediated dephosphorylation destabilizes c-MYC and suppresses acute myeloid leukemia survival. Targetome 2(5): e053 doi: 10.48130/targetome-0026-0052 

Targeting PTPN2-mediated dephosphorylation destabilizes c-MYC and suppresses acute myeloid leukemia survival
- Received: 12 June 2026
- Revised: 01 September 2026
- Accepted: 07 September 2026
- Published online: 16 October 2026
Abstract: Acute myeloid leukemia (AML) is a fatal disease characterized by a bleak prognosis. For over four decades, treatment options for AML have been constrained to administering high-dose cytotoxic chemotherapy. However, the emergence of drug resistance and the resultant toxic side effects have created an urgent necessity for identifying novel therapeutic targets. In this study, non-receptor protein tyrosine phosphatase type 2 (PTPN2) is highly expressed in AML. Remarkably, knockdown of PTPN2 expression markedly mitigated AML burden both in vitro and in vivo. Additionally, we unveiled the direct interaction between PTPN2 and c-MYC, establishing c-MYC as a direct acting substrate of PTPN2. Then, we obtained a small-molecule inhibitor, WS35, which has good inhibitory activity against PTPN2. Moreover, WS35 shows a strong therapeutic effect in vivo for AML. In conclusion, these results indicate the carcinogenic mechanism of PTPN2, and the therapeutic strategies targeting PTPN2 have significant potential for treating AML.
-
Key words:
- Acute myeloid leukemia;
- Cell cycle;
- c-MYC;
- PTPN2;
- Small-molecule inhibitor