


-
In agricultural systems, the population density of cultivated plants tends to remain relatively stable, while weed abundance can vary significantly. These variations are influenced by factors such as the composition of the soil seedbank, the density and distribution of existing infestations, management practices, and environmental conditions. Such fluctuations alter the proportion of crops to weeds, making it essential to understand how these dynamics affect the competitive performance of coexisting species within a plant community[1,2].
To properly characterize competitive interactions between weed species and crop genotypes, specific experimental approaches are required. Among them, replacement series experiments are widely used, which assess competition based on the performance of biometric or ecophysiological parameters[1,3,4]. In general, well-established crops tend to be more competitive than weeds because they are sown uniformly, at optimal densities, and often emerge earlier than weed species[4,5]. However, when competition occurs between species with similar ecological traits and simultaneous emergence, they exploit the same ecological niche. In such cases, their interference can negatively affect the growth and development of the entire plant community[4,6].
Within a single crop species, cultivars can differ significantly in their ability to compete with weeds. These differences may arise from variation in environmental adaptability, growth rates, and efficiency in resource use[4,7−9]. More vigorous genotypes tend to suppress weed growth more effectively. Therefore, selecting genotypes with superior competitive ability can serve as an important strategy within integrated weed management (IWM), potentially reducing reliance on chemical controls and promoting more sustainable cropping systems[6,7,9].
Quinoa (Chenopodium quinoa Willd.) has gained increasing agricultural interest due to its high nutritional value and its adaptability to a wide range of environmental conditions[10,11]. However, its productivity can be adversely affected by weed competition, particularly from species such as wild radish (Raphanus raphanistrum L.), and ryegrass (Lolium multiflorum Lam.). These weeds are widespread in several economically important crops and are recognized for their high competitive ability[12−16], especially under conditions favorable to quinoa cultivation.
Wild radish is an annual species known for its prolific seed production and vigorous growth, while ryegrass is characterized by its high tillering capacity, natural reseeding ability, and extensive root system. These traits contribute to their aggressive competition for essential resources such as water, light, and nutrients[12,13,17].
Replacement series experiments are effective for evaluating interactions at specific crop-to-weed ratios. This methodology provides valuable insights for optimizing management strategies that enhance crop competitiveness while suppressing weed development[3,4,13]. Furthermore, it allows researchers to determine whether competition is intra- or inter-specific, supporting the development of more sustainable and ecologically sound weed management practices. Such practices align with the principles of integrated weed management (IWM)[1,5], helping to reduce herbicide use, delay the onset of herbicide resistance, and limit the spread of tolerant biotypes in agricultural fields.
Therefore, this study was based on the hypothesis that quinoa genotypes differ in their competitive ability against the weed species wild radish and ryegrass. The objective was to compare the competitive ability of different quinoa genotypes in the presence of these weeds, with the aim of supporting both cultural and chemical strategies for managing these infestations effectively.
-
A total of 11 experiments were conducted in the greenhouse of the Federal University of Fronteira Sul (UFFS), Erechim Campus, RS, Brazil, during the 2018 growing season. The experimental units consisted of plastic pots (8 dm3), filled with soil collected from the surface layer of a typical aluminoferric Red Latosol[18]. The soil exhibited the following physicochemical properties: pH(H2O) = 4.8; organic matter = 35 g·dm−3; available P = 4.0 mg·dm−3; exchangeable K = 117.0 mg·dm−3; Al3+ = 0.6 cmolc·dm−3; Ca2+ = 4.7 cmolc·dm−3; Mg2+ = 1.8 cmolc·dm−3; effective CEC [CEC(t)] = 7.4 cmolc·dm−3; total CEC [CEC(T)] = 16.5 cmolc·dm−3; potential acidity (H++Al3+) = 9.7 cmolc·dm−3; base saturation = 6.8 cmolc·dm−3; base saturation percentage (V) = 41%; clay = 60%, sand = 15%, and silt = 25%. A randomized complete block design (RCBD) with four replicates was used.
Species used in experiments, preliminary tests, and evaluated variables
-
The quinoa genotypes (Chenopodium quinoa Willd.) used in the experiments were Q 1303, Q 1331, and Q 1324, grown in competition with the weed species wild radish (Raphanus raphanistrum L.) and ryegrass (Lolium multiflorum Lam.), as illustrated in Supplementary Fig. S1.
To determine the appropriate plant density for subsequent experiments, preliminary additive series experiments (monocultures) were conducted for quinoa and the weed species. These trials aimed to identify the plant density at which shoot dry matter accumulation stabilized for each species[3].
Plant densities tested were 1, 2, 4, 8, 16, 24, 32, 40, 48, 56, and 64 plants per pot, corresponding to 25, 49, 98, 196, 392, 587, 784, 980, 1,176, 1,372, and 1,568 plants per square meter, respectively. Fifty days after emergence (DAE), aboveground plant parts of quinoa and the weeds (wild radish and ryegrass) were harvested at soil level for shoot dry matter (DM) determination. Plant material was oven-dried at 65 °C until constant weight and then weighed. Based on the mean dry matter values, a stable plateau was observed at a density of 20 plants per pot for all quinoa genotypes and the two weed species (Fig. 1).
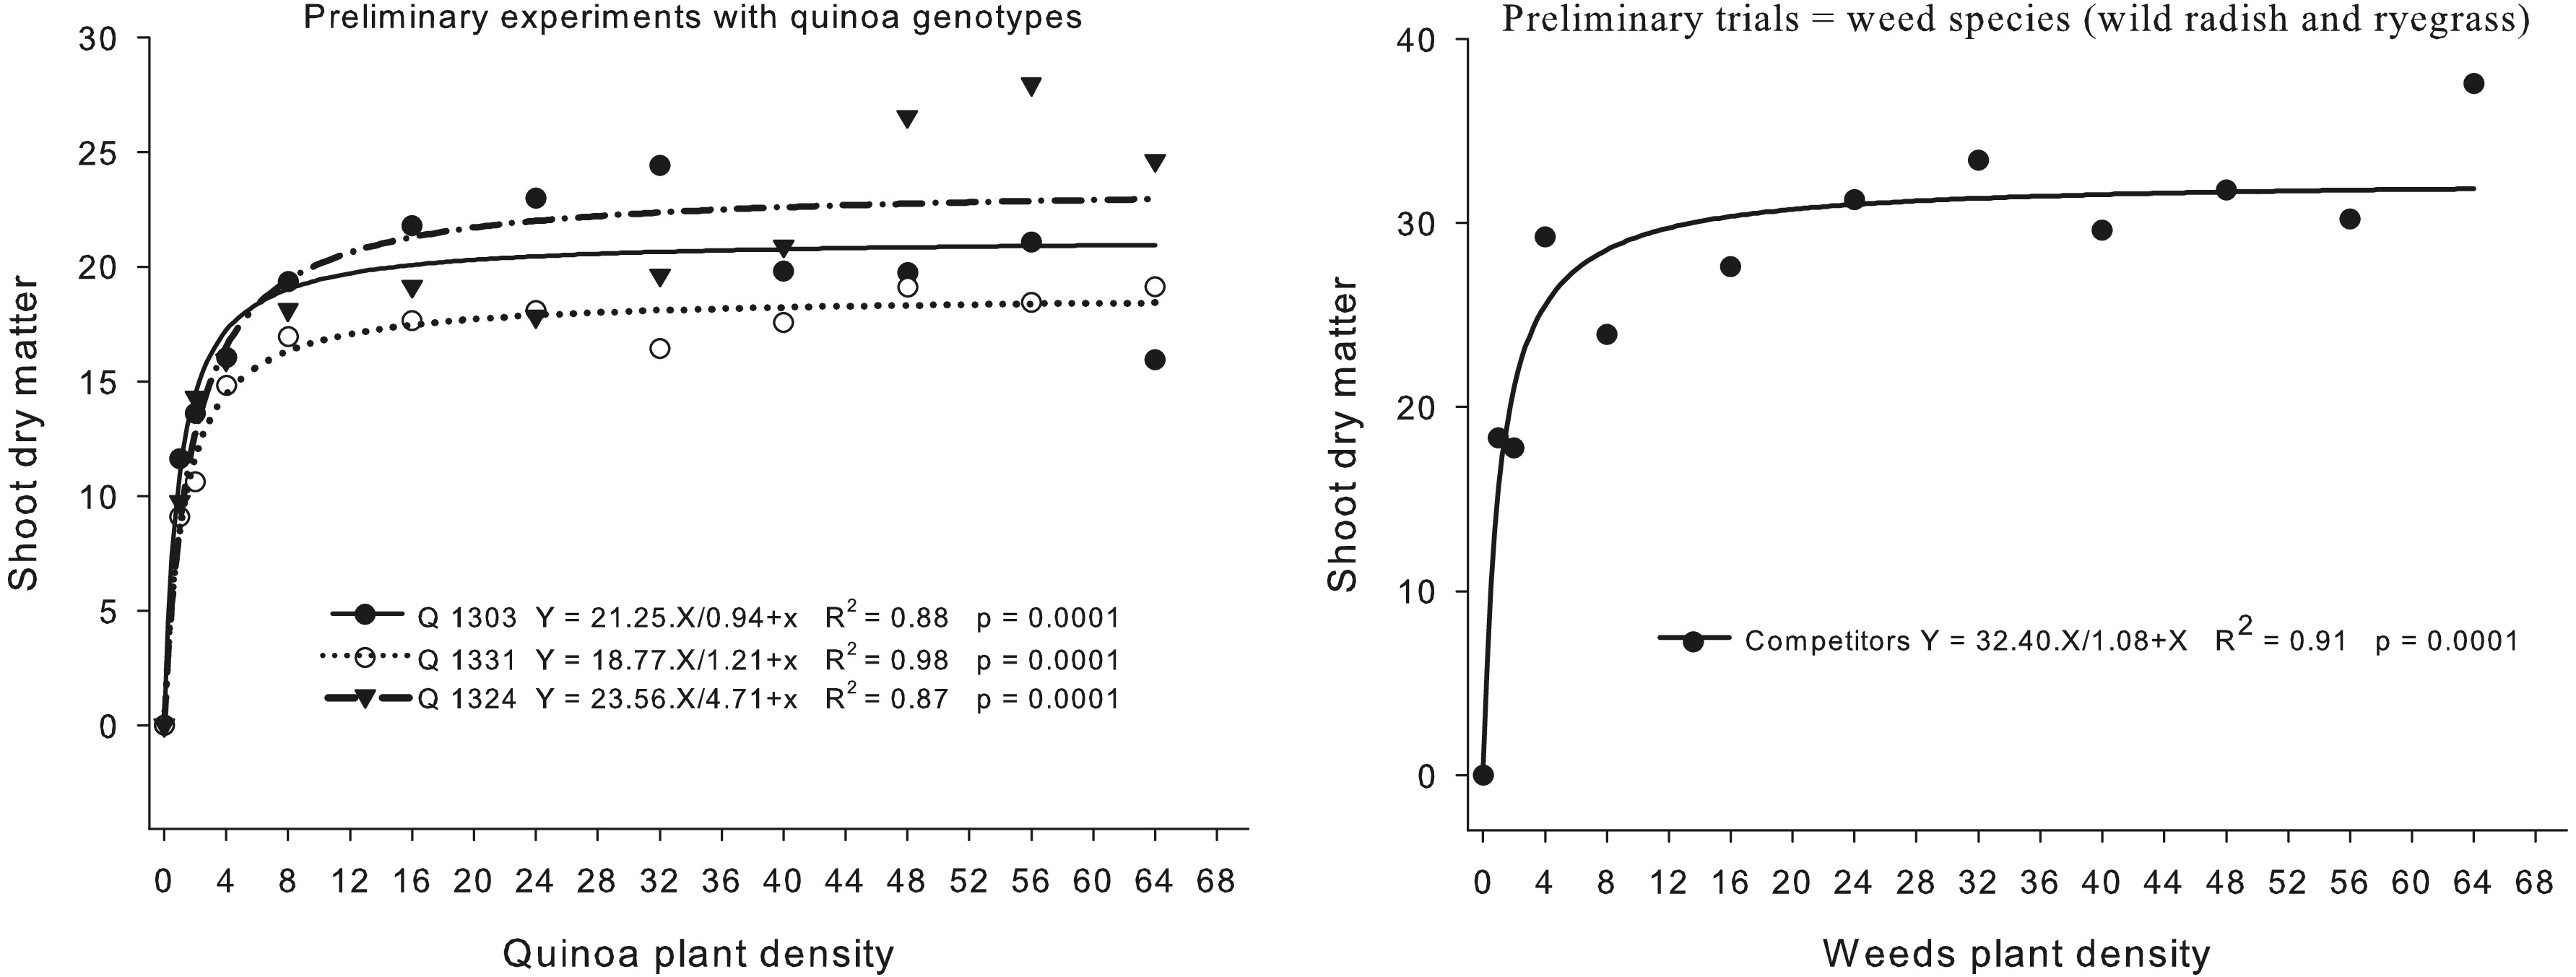
Figure 1.
Final shoot dry matter production of quinoa genotypes (Q 1303, Q 1331, and Q 1324) and weeds (wild radish and ryegrass) as a function of plant density per pot.
Replacement series experimental design
-
To evaluate the competitive ability of the quinoa genotypes (Q 1303, Q 1331, and Q 1324) against the weeds, replacement series experiments were carried out using varying proportions of quinoa and either wild radish or ryegrass. Plant ratios per pot were 20:0, 15:5, 10:10, 5:15, and 0:20, maintaining a constant total density of 20 plants per pot. Seeds were pre-germinated in plastic trays, and seedlings were transplanted into the final experimental pots 5 d after emergence to ensure uniform establishment of each treatment's plant ratios.
Fifty days after emergence, the following traits were evaluated: plant height, stem or culm diameter, number of leaves (quinoa and wild radish) or tillers (ryegrass), chlorophyll index, leaf area, shoot dry matter, foliar nitrogen (N), and phosphorus (P) contents. Leaves/tillers counts were done manually; plant height was measured from the soil surface to the tip of the highest fully expanded leaf using a ruler (cm); and stem diameter was measured 5 cm above the soil surface using a digital caliper (mm). The chlorophyll index was measured at five points per plant (lower, middle, and upper canopy) using a portable chlorophyll meter (SPAD 502-Plus, Beijing, China). Measurements were performed between 07:30 and 11:00 to minimize diurnal variation.
Leaf area was measured using a portable leaf area meter (Licor 3100C, LI-Cor Environmental, Lincoln, NE, USA), including all leaves from each plant in the treatment. Plant material was then placed in kraft paper bags and oven-dried at 65 °C until constant weight to assess shoot dry matter. For nutrient analysis, dried plant samples were ground using a Willye-type mill (Star FT-50 model, Fortinox, Piracicaba, SP, Brazil) and sieved to 0.5 mm. Foliar nitrogen and phosphorus contents were determined according to the methodology described by Tedesco et al.[19].
Data analysis
-
Data were analyzed using the graphical method of relative yield and total relative yield[3−5], a conventional approach for interpreting replacement series experiments. Diagrams were constructed based on relative productivity (RP), and total relative productivity (TRP). A straight RP line indicates equivalent competitiveness between species. A concave RP curve implies reduced growth for one or both species, while a convex RP curve suggests enhanced growth. TRP values equal to 1 (straight line) indicate direct competition for the same resources; TRP values greater than 1 (convex line) indicate niche differentiation or facilitation; TRP values below 1 (concave line) imply mutual suppression.
Additionally, the following competitive indices were calculated: relative competitiveness (RC), relative crowding coefficient (K), and aggressiveness (AG). The RC quantifies the relative growth of quinoa genotypes (X) compared to weeds (Y); K indicates the dominance of one species over another; and AG shows which species is more aggressive. Together, these indices offer a more comprehensive understanding of species competitiveness[3-5]. Quinoa (X) is considered more competitive than weeds (Y) when RP > 1, Kx > Ky, and AG > 0. In contrast, weeds (Y) are more competitive when RP < 1, Kx < Ky, and AG < 0. All indices were calculated using the 50:50 species proportion, based on the following formulas[20]:
$ \mathrm{RC=RPx/RPy} $ $ \mathrm{Kx=RPx/(1-RPx)} $ $ \mathrm{Ky=RPy/(1-RPy)} $ $ \mathrm{AG=RPx-RPy} $ Statistical analysis of RP and TRP included testing deviations from expected values at species proportions of 25%, 50%, and 75%, using t-tests to compare against theoretical straight-line expectations (0.25, 0.50, and 0.75, respectively). Null hypotheses were: for RP and AG, H0 = 0; for TRP and RC, H0 = 1; and for K, H0 : (Kx – Ky) = 0. RP and TRP curves were considered significantly different from the expected line when significant differences (p ≤ 0.05) were found at least at two species proportions[3]. Likewise, competitiveness differences were considered significant when at least two of the indices (RC, K, and AG differed significantly by the t-test.
Trait means for plant height, stem/culm diameter, number of leaves or tillers, chlorophyll index, leaf area, shoot dry matter, and foliar N and P were subjected to analysis of variance (ANOVA) using the F-test. When significant differences were detected, means were compared using Dunnett's test, with monocultures serving as controls. A significance level of p ≤ 0.05 was adopted for all statistical analyses.
-
The analysis of variance showed significant effects of quinoa genotype proportions in mixtures with wild radish (Raphanus raphanistrum), and/or ryegrass (Lolium multiflorum) on plant height, stem diameter, leaf/tiller number, leaf area, chlorophyll index, shoot dry matter, nitrogen (N), and phosphorus (P) content.
Morphophisiological traits
-
RP and TRP for plant height (Fig. 2) decreased in all quinoa genotypes (1331, 1324, and 1303) as weed proportion increased. Wild radish and ryegrass RP trends varied; genotype 1324 suppressed ryegrass height effectively but was most sensitive to wild radish. TRP patterns indicated stronger competition from wild radish than ryegrass, consistent with higher niche overlap among broadleaf species. Quinoa height declined progressively with increasing weed density, reflecting resource competition for light and nutrients[21]. The varied weed RP suggests quinoa weakly suppresses wild radish and ryegrass growth. Genotype 1324 strongly suppressed ryegrass but was more sensitive to wild radish, indicating distinct competitive interactions. Luo et al.[2] also observed differences in competitive interactions when working with leguminous and grass species in mixtures or monocultures. The similarity in TRP between wild radish and quinoa reinforces that both species compete intensely for the same environmental resources[1].
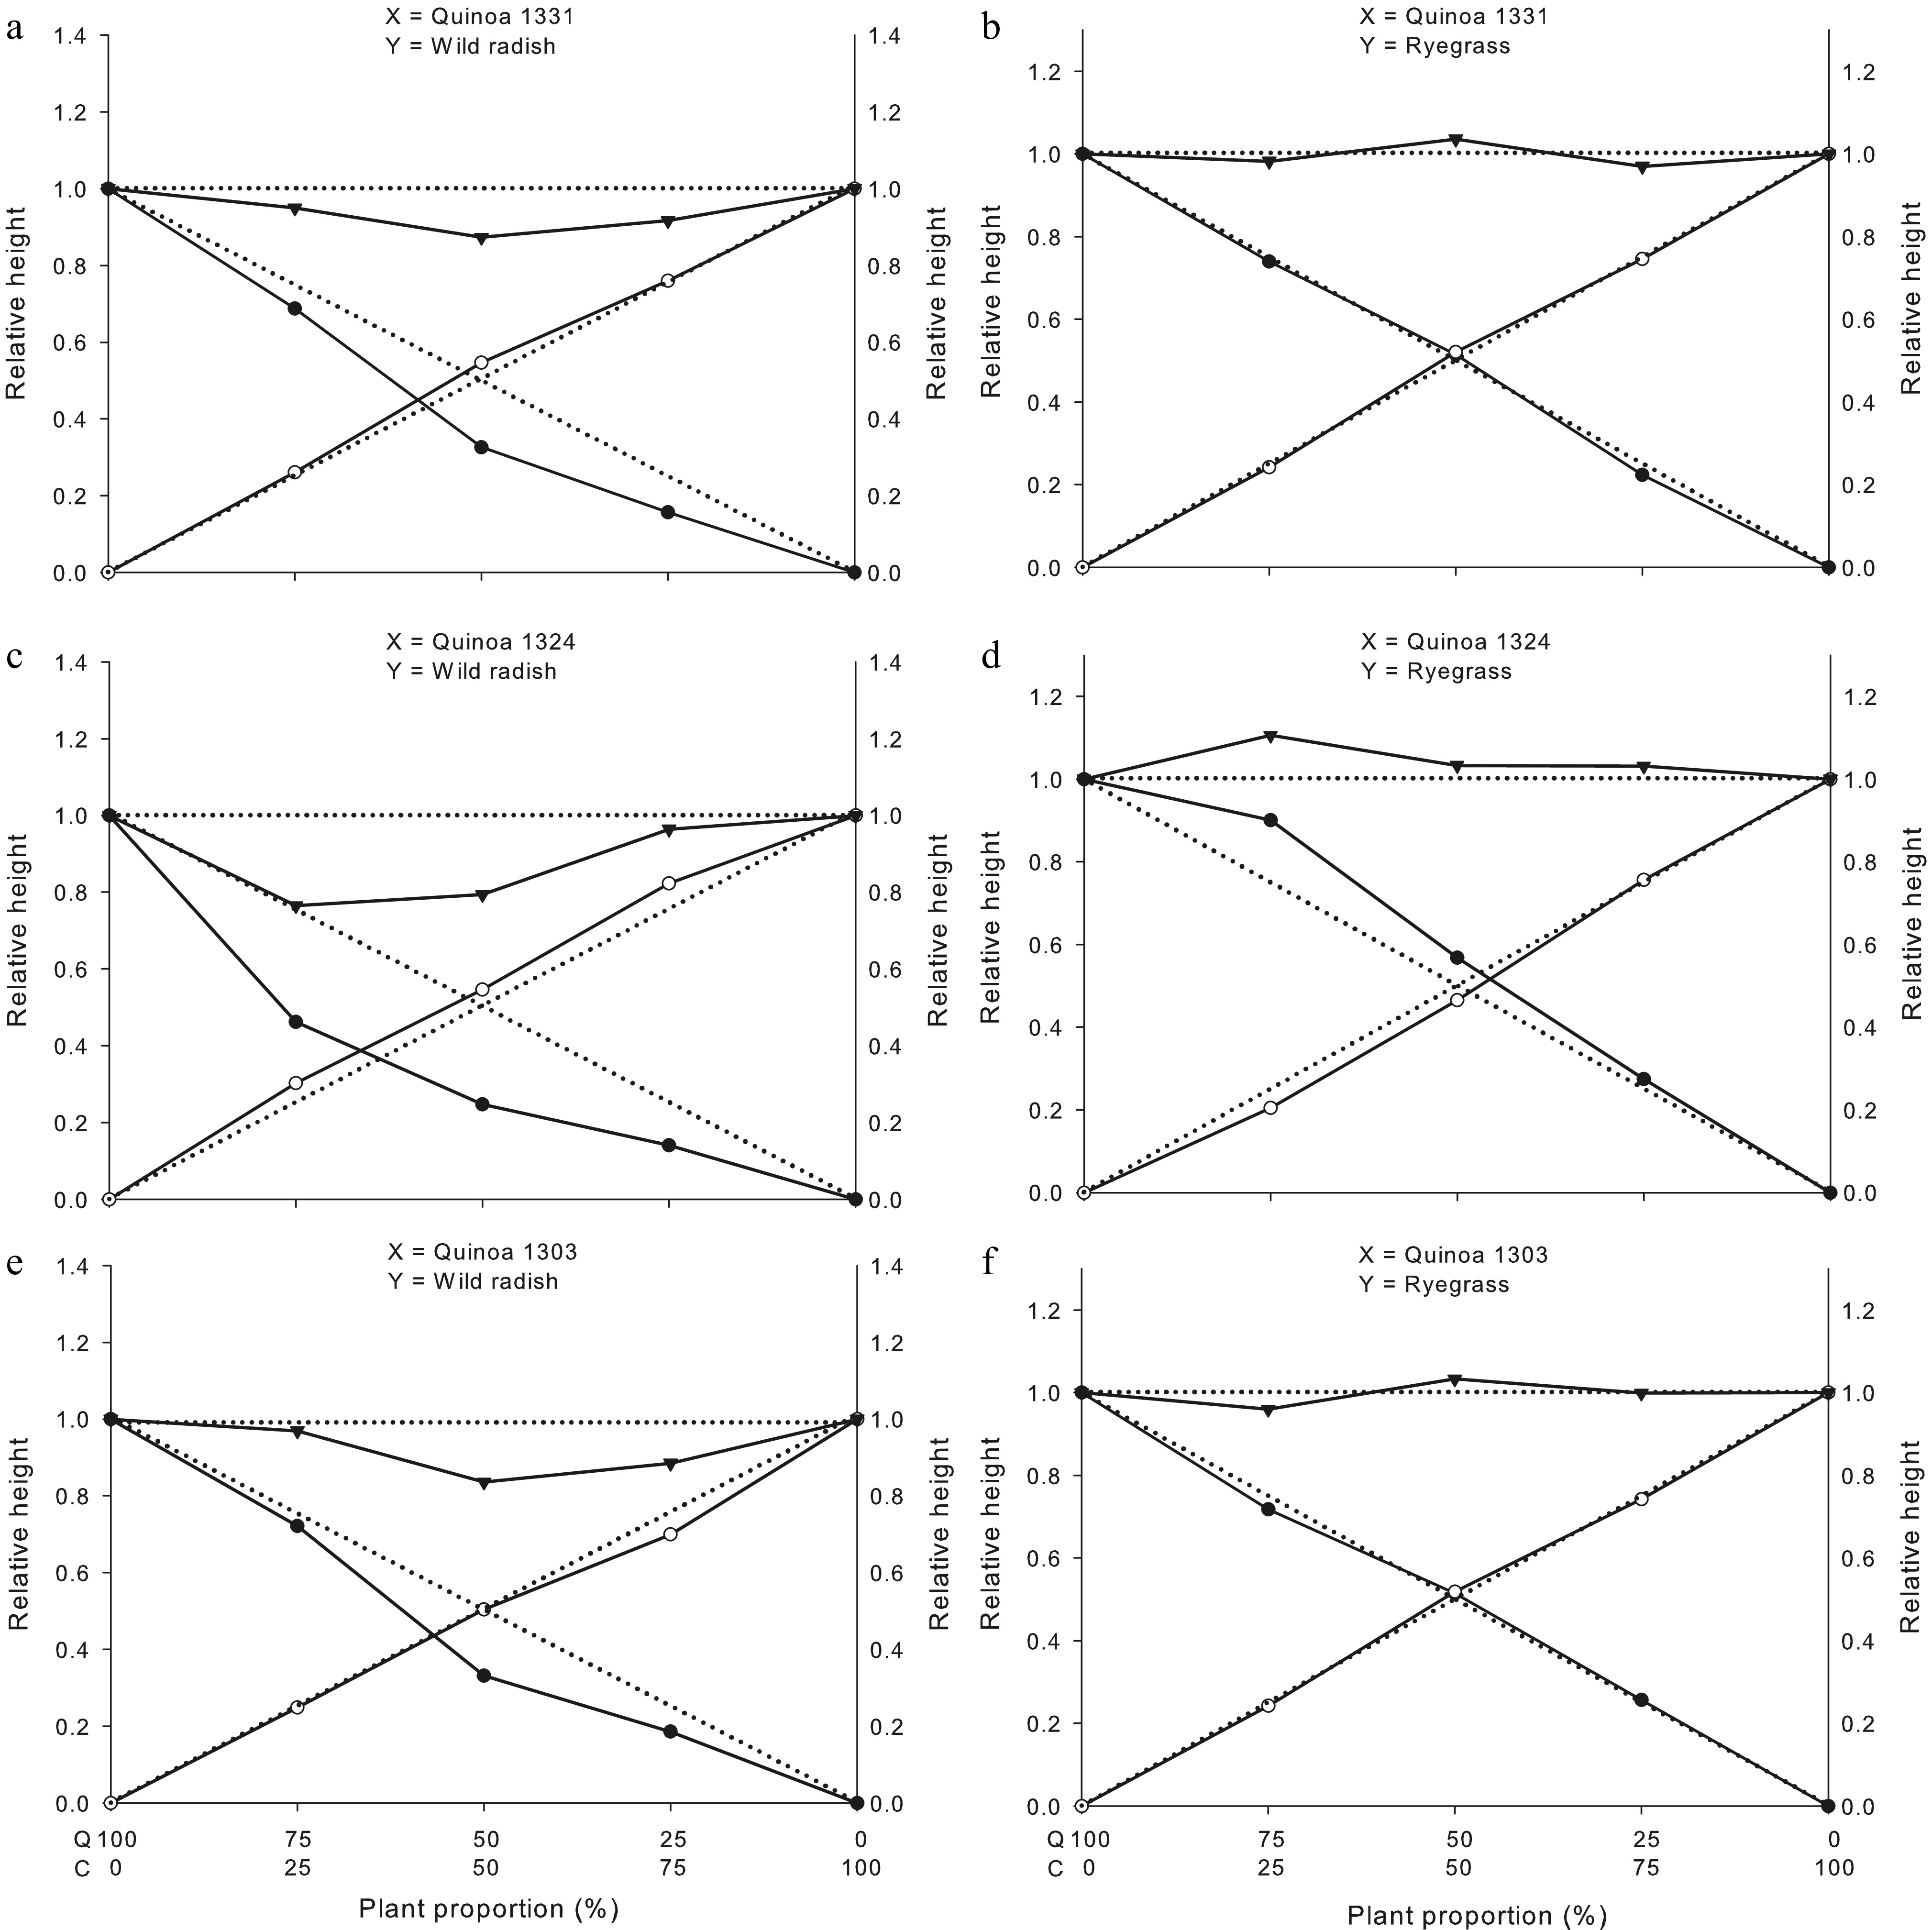
Figure 2.
Total relative productivity (TRP), and relative productivity (RP) for plant height of quinoa genotypes 1331, 1324, and 1303. Quinoa (●); wild radish (o: a, c and e) or ryegrass (o: b, d and f), and community (crop + weed) yields (▼). Dashed lines (- - -) represent the expected yields in the absence of interspecific competition, whereas solid lines (―) represent the observed values under interspecific competition. UFFS, Erechim, RS, Brazil. Q: quinoa and C: competitor.
Stem diameter (Fig. 3) showed the greatest RP quinoa reduction at 25:75 and 50:50 crop:weed ratios with wild radish, while ryegrass had a weaker impact, reflecting less overlap between a grass weed and a broadleaf crop. This explains why grass-selective herbicides control ryegrass in quinoa without crop injury, unlike wild radish. Quinoa poorly suppressed weed stem thickening (Fig. 3). The TRP mirrored plant height trends (Fig. 2), confirming resource competition with wild radish (Fig. 3).
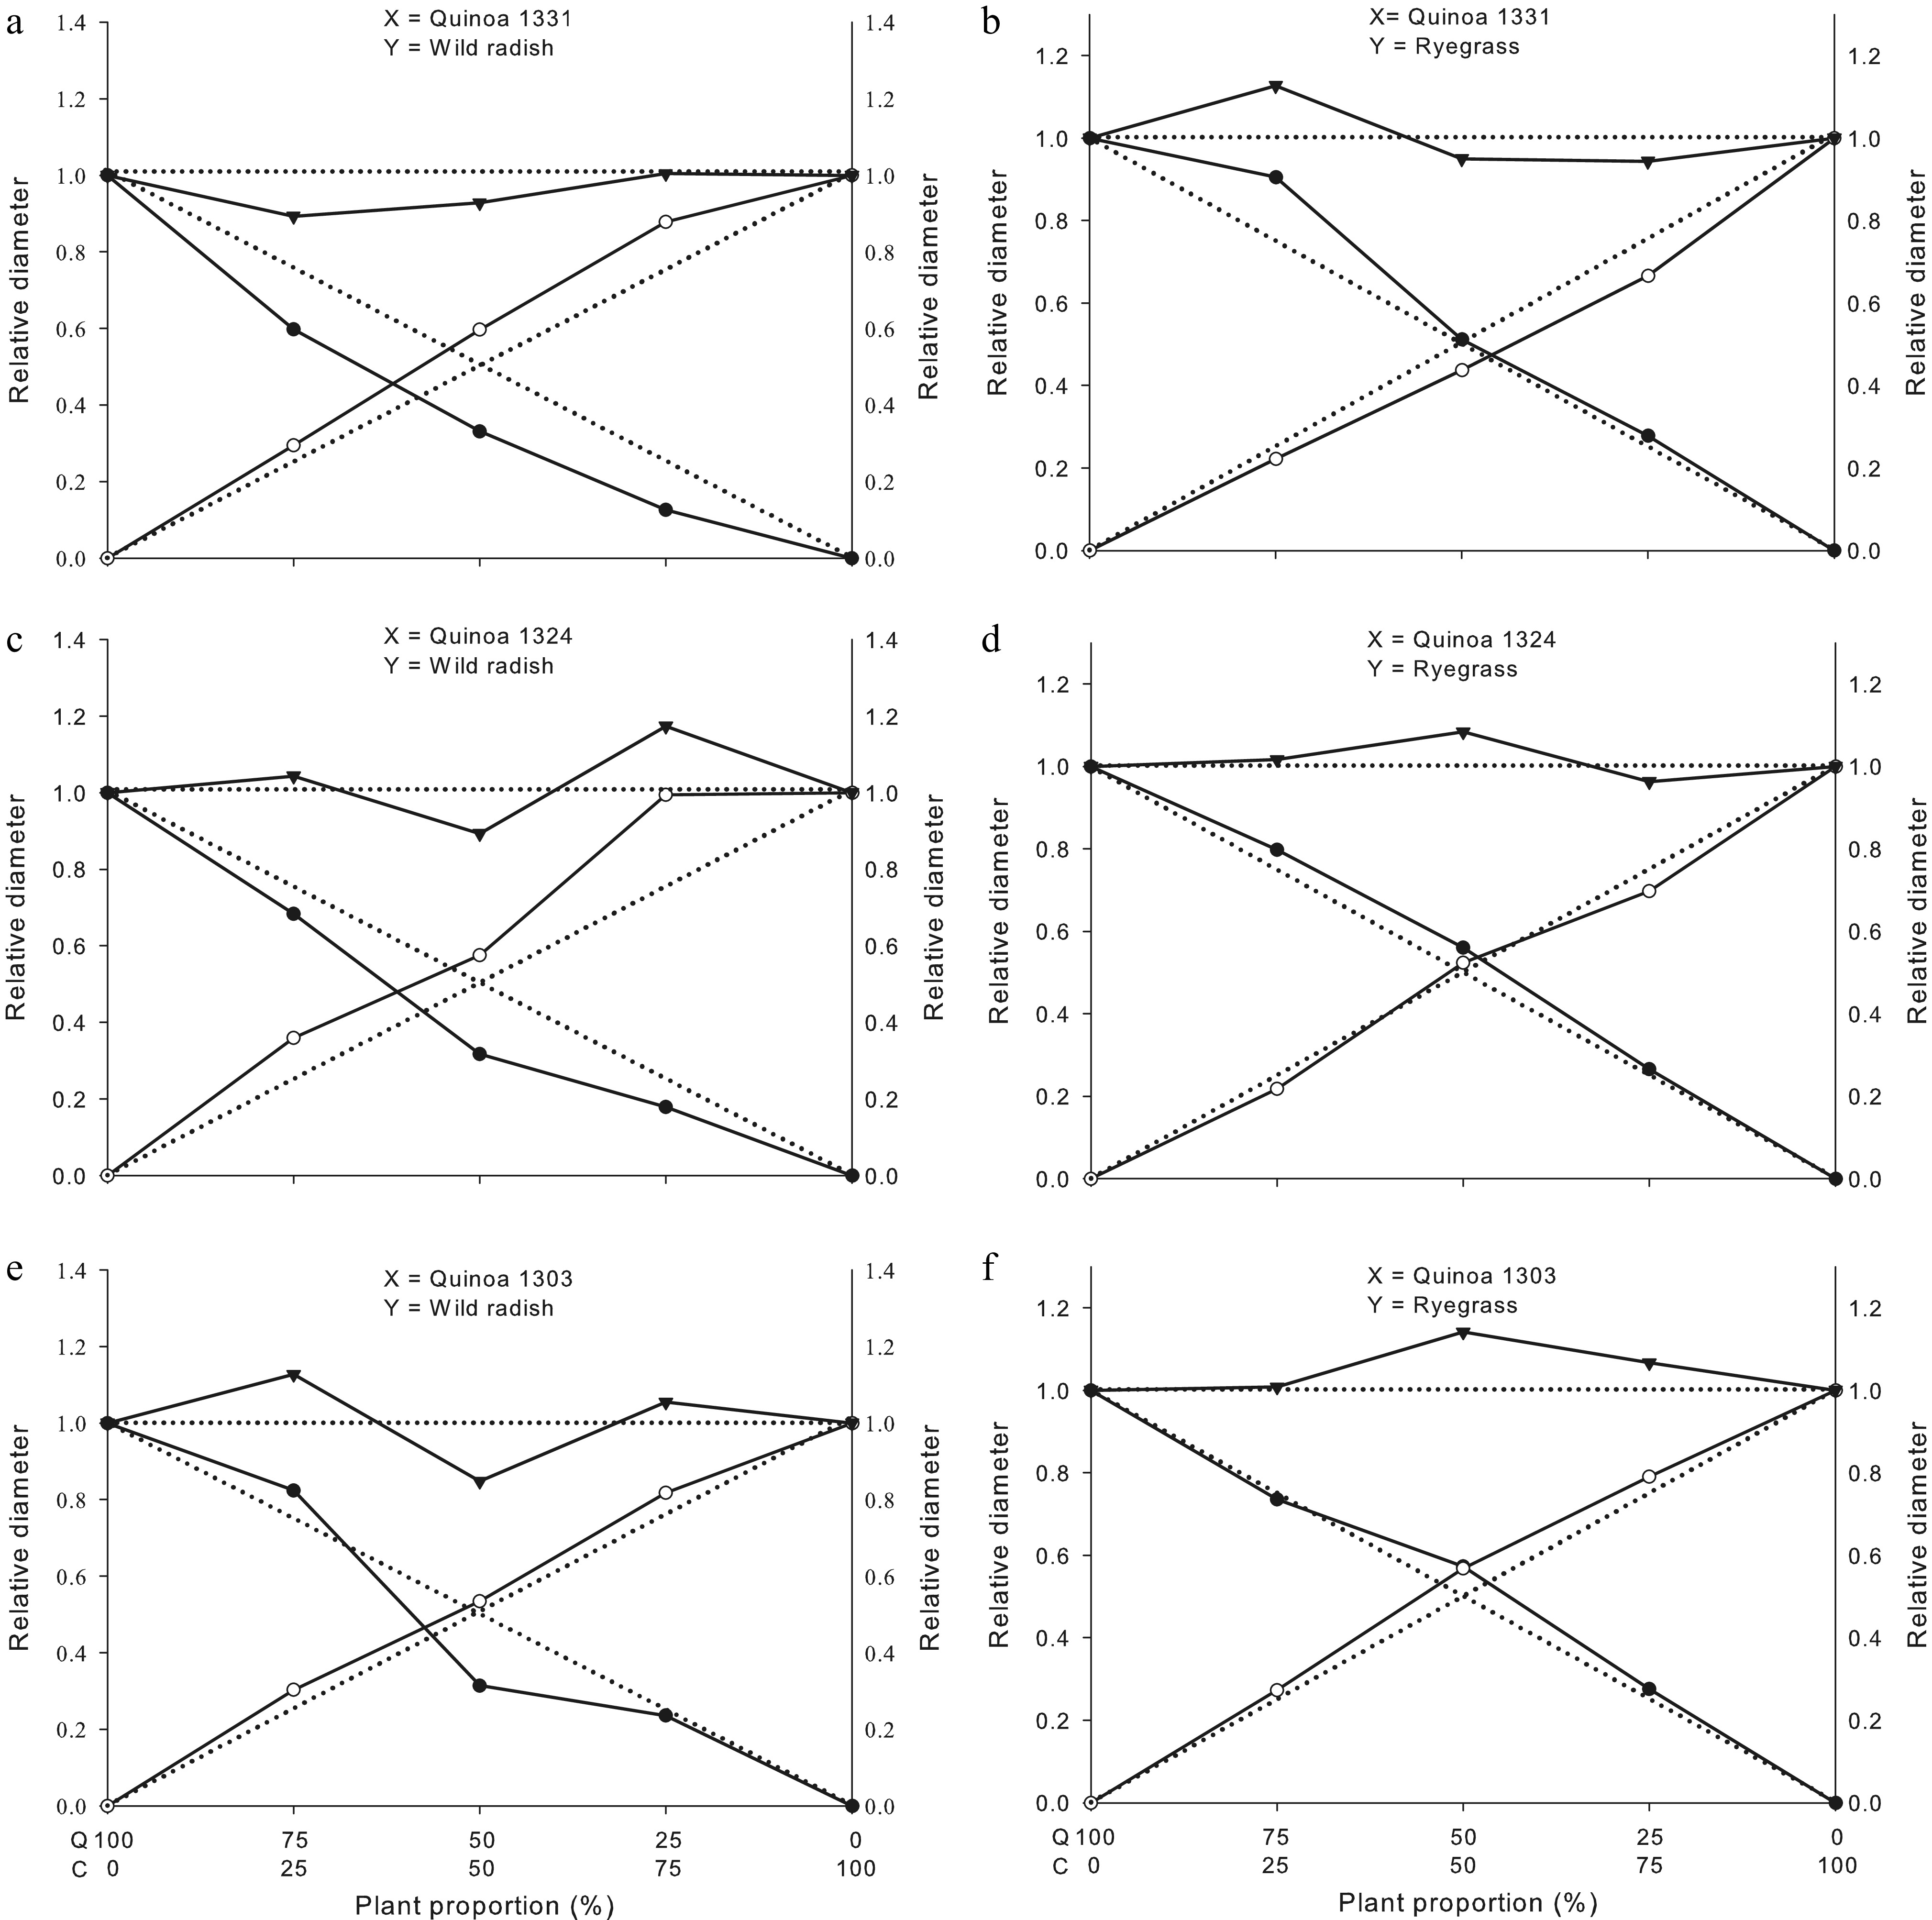
Figure 3.
Total relative productivity (TRP), and relative productivity (RP) for stem diameter of quinoa genotypes 1331, 1324, and 1303. Quinoa (●); wildradish (o: a, c and e) or ryegrass (o: b, d and f), and community (crop + weed) yields (▼). Dashed lines (- - -) represent the expected yields in the absence of interspecific competition, whereas solid lines (―) represent the observed values under interspecific competition. UFFS, Erechim, RS, Brazil. Q: quinoa and C: competitor.
RP quinoa stem diameter reduction, especially with wild radish at 25:75 and 50:50 (Fig. 3), indicates strong competition, as also reported by Jastrzębska et al.[9] when studying weed management practices in crop competition. Such reduction is likely related to the limitation of environmental resources such as water and nutrients[21]. Quinoa's low competitiveness against ryegrass aligns with Brunetto et al.[7]. TRP for stem diameter patterns further affirm direct competition between quinoa and wild radish[1].
Leaf/tiller number RP decreased in quinoa as competitor plants increased, showing weed interference with leaf production (Supplementary Fig. S2). Wild radish RP tended to increase with quinoa proportion, while ryegrass RP decreased, indicating species-specific competition. TRP declined with wild radish but varied with ryegrass, affirming wild radish's greater competitive aggressiveness. Asato et al.[22] noted stress can alter plant morphology, consistent with these results. These stress effects may be associated to environmental, soil, or management factors that influence leaf and organ production, either positively or negatively[22]. This observation partially aligns with the present findings, as weed competition (wild radish and ryegrass) negatively affected quinoa leaf production. In contrast, wild radish RP tended to increase with higher quinoa proportions, whereas ryegrass exhibited the opposite trend, indicating that species interactions depend on specific competitive conditions[1,22]. The reduction in TRP in the presence of wild radish confirms its higher competitive aggressiveness compared to quinoa. Similar patterns were observed when wild radish competed with canola hybrids, with crop TRP decreasing as the proportion of the competitor increased[13].
Chlorophyll index (Supplementary Fig. S3) results fluctuated without clear trends in either crop or weeds, suggesting photosynthesis remained stable despite morphological effects of competition, possibly due to quinoa's physiological adaptations. Gasparetto et al.[23], studying common bean cultivars in competition with horseweed, found similar results to those observed in the present study. This suggests that although competition affected morphological and productive traits, the photosynthetic capacity of quinoa was not severely compromised. This may be due to physiological adaptations of the crop, as also reported by Bernardi et al.[24] and Gasparetto et al.[23].
Leaf area effectively differentiated genotypes' competitive potential (Fig. 4). Genotypes 1331 and 1303 were less impacted by wild radish (3%−10% RP reduction) than 1324 (up to ~30% at 25:75 and 50:50). Ryegrass had little effect on genotype 1324 RP for leaf area, while 1331 and 1303 increased RP for leaf area at higher ryegrass proportions. TRP indicated better competitive responses by 1303 and 1331 than 1324, possibly due to greater plasticity in response to competition. Similarly, Lima et al.[25] observed that plants can adapt to adverse environmental conditions to overcome stress.
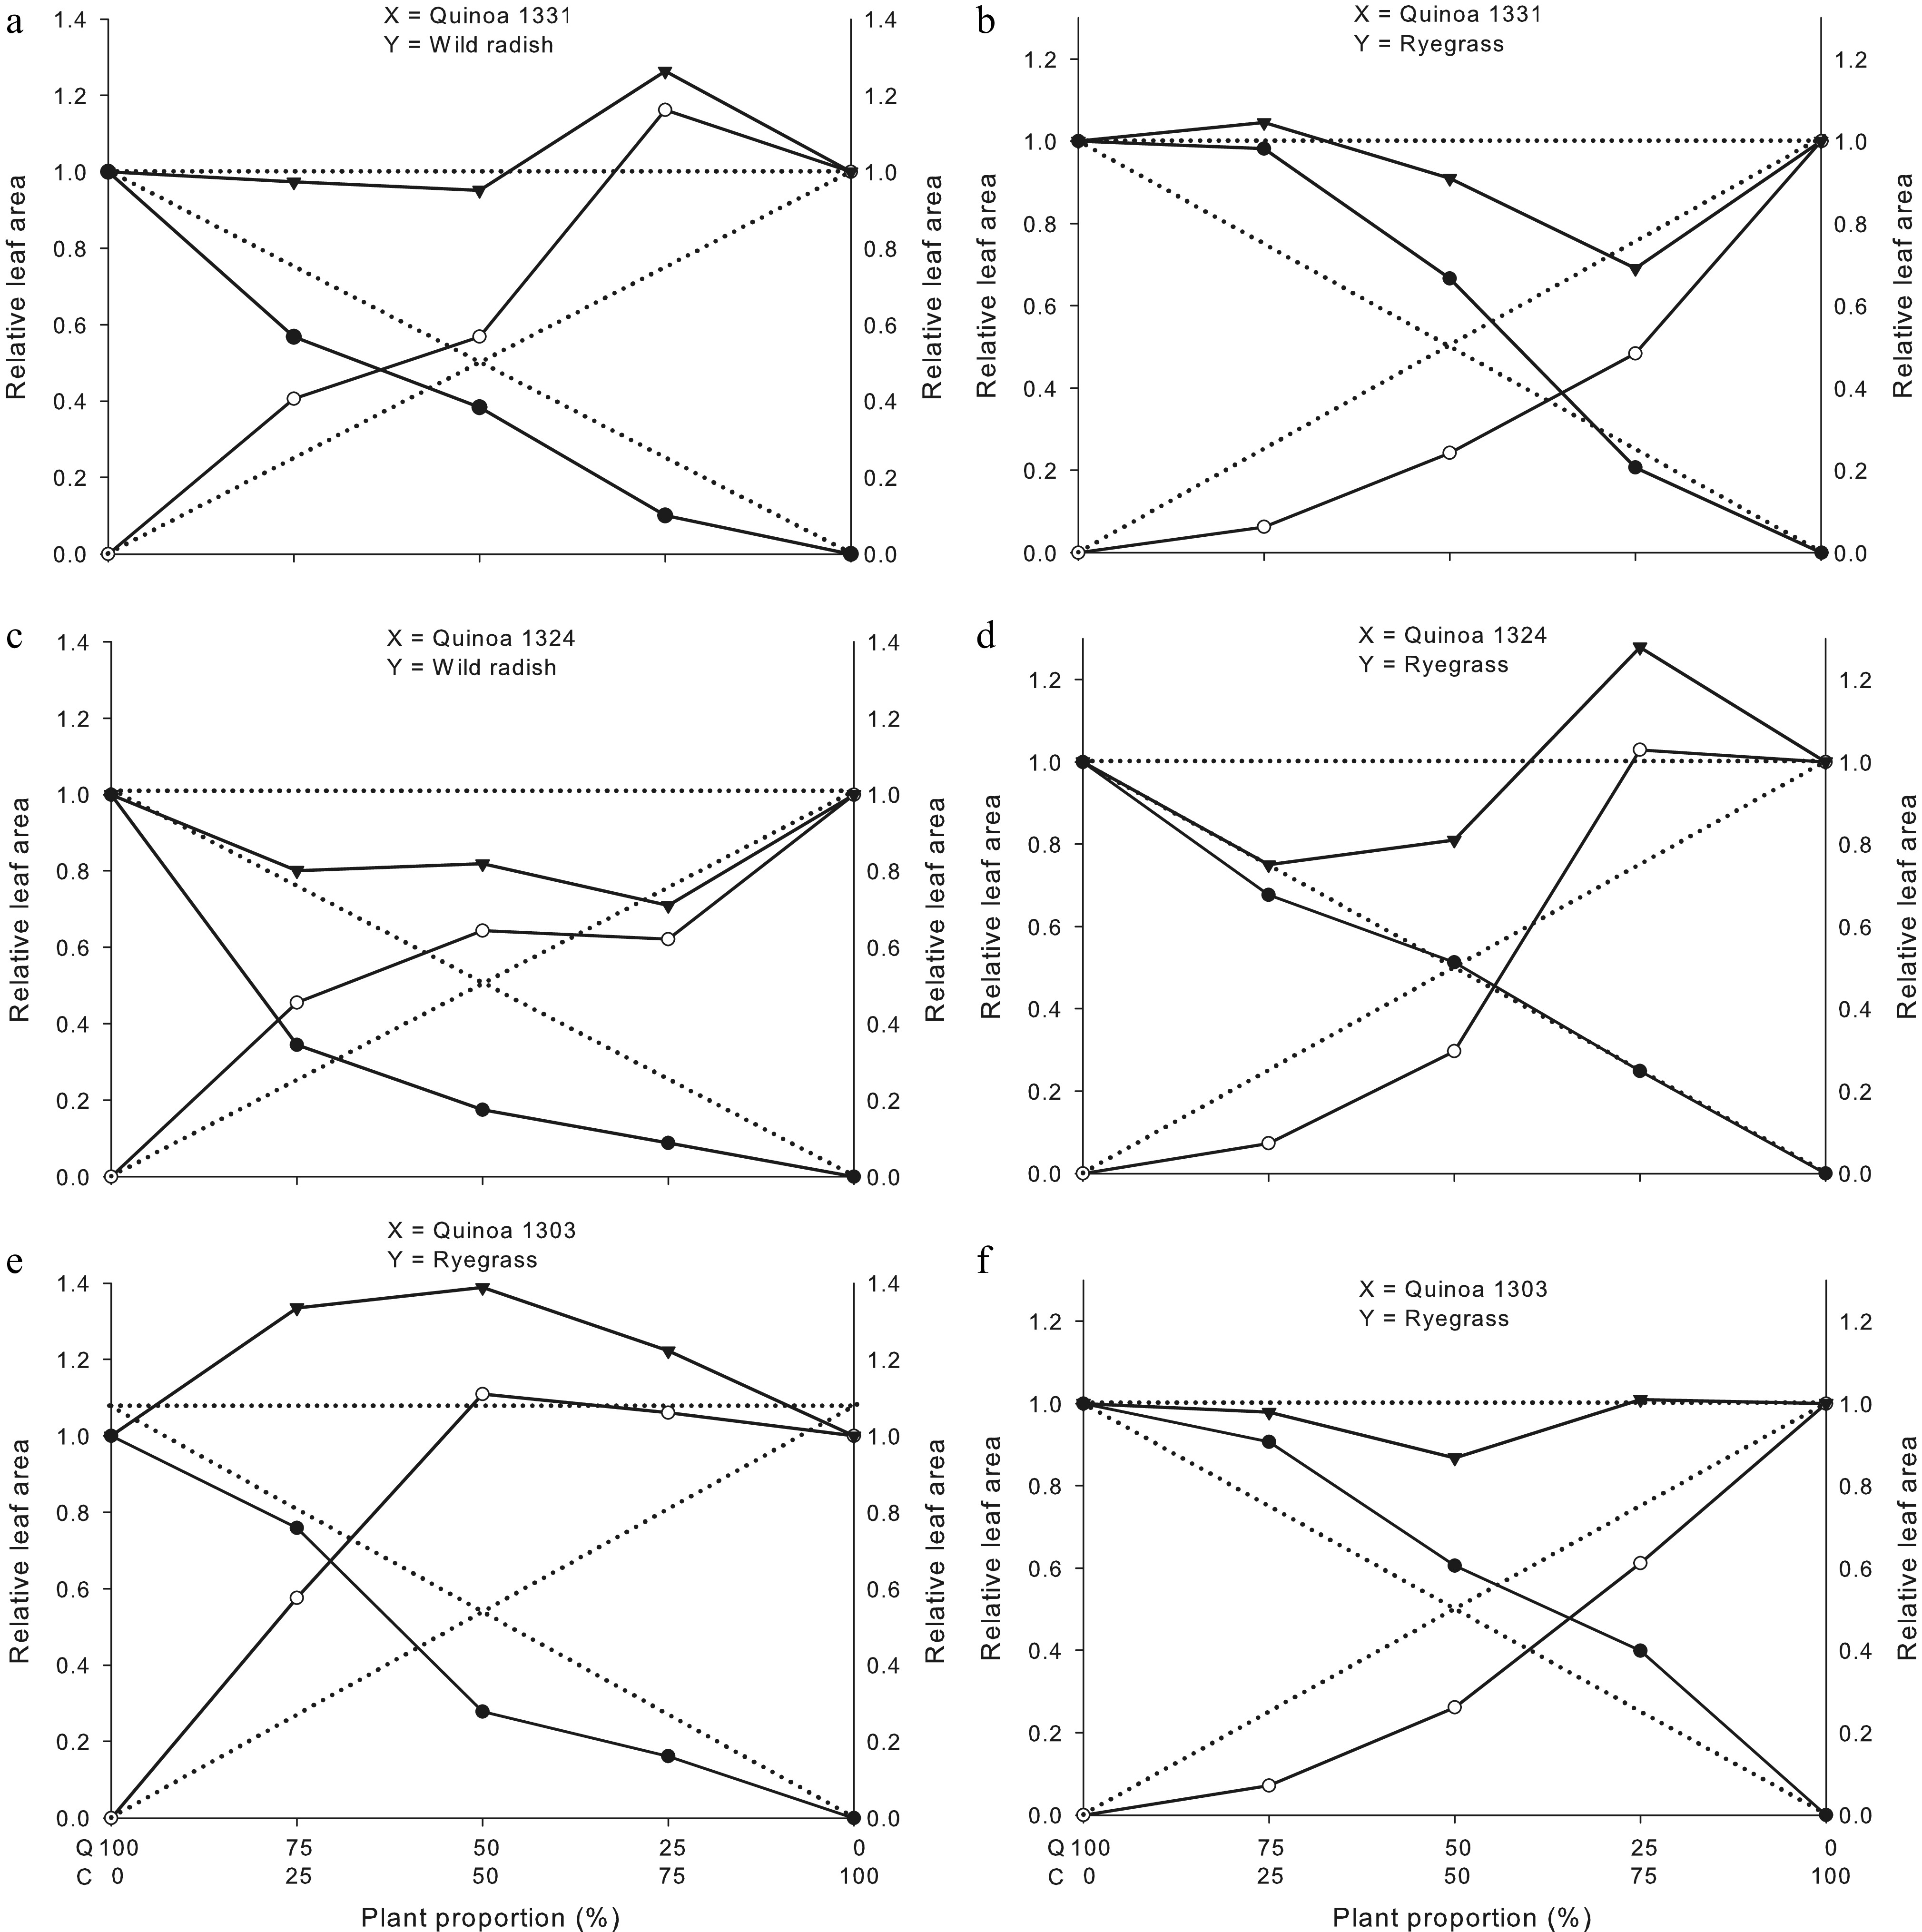
Figure 4.
Total relative productivity (TRP), and relative productivity (RP) for leaf area of quinoa genotypes 1331, 1324, and 1303. Quinoa (●); wild radish (o: a, c and e) or ryegrass (o: b, d and f), and community (crop + weed) yields (▼). Dashed lines (- - -) represent the expected yields in the absence of interspecific competition, whereas solid lines (―) represent the observed values under interspecific competition. UFFS, Erechim, RS, Brazil. Q: quinoa and C: competitor.
Dry matter RP (Fig. 5) showed wild radish reduced quinoa biomass (~40%), ryegrass less so (~25%). Quinoa suppressed ryegrass more than wild radish, confirming wild radish's competitive dominance. Despite unchanged leaf area, biomass accumulation dropped substantially (~50% TRP reduction) for all species, demonstrating significant community-level growth losses. Quinoa's weak early growth may underlie its low competitive ability and the need for weed-free conditions initially. Galon et al.[13] also observed that wild radish had a stronger negative impact than ryegrass on certain canola hybrids in competition. Interestingly, quinoa suppressed ryegrass more effectively than wild radish, suggesting some suppressive ability against ryegrass but limited effectiveness against wild radish. TRP was reduced by approximately 50% across all species, indicating substantial biomass losses within the entire plant community. Similarly, Gasparetto et al.[23] reported reductions in the shoot dry matter of bean cultivars competing with horseweed under mixed planting. Overall, quinoa demonstrates limited competitive ability against both weed species, particularly wild radish. Previous studies have attributed this to quinoa's slow initial growth and development, which makes weed-free conditions critical during early stages to avoid yield losses[7,26].
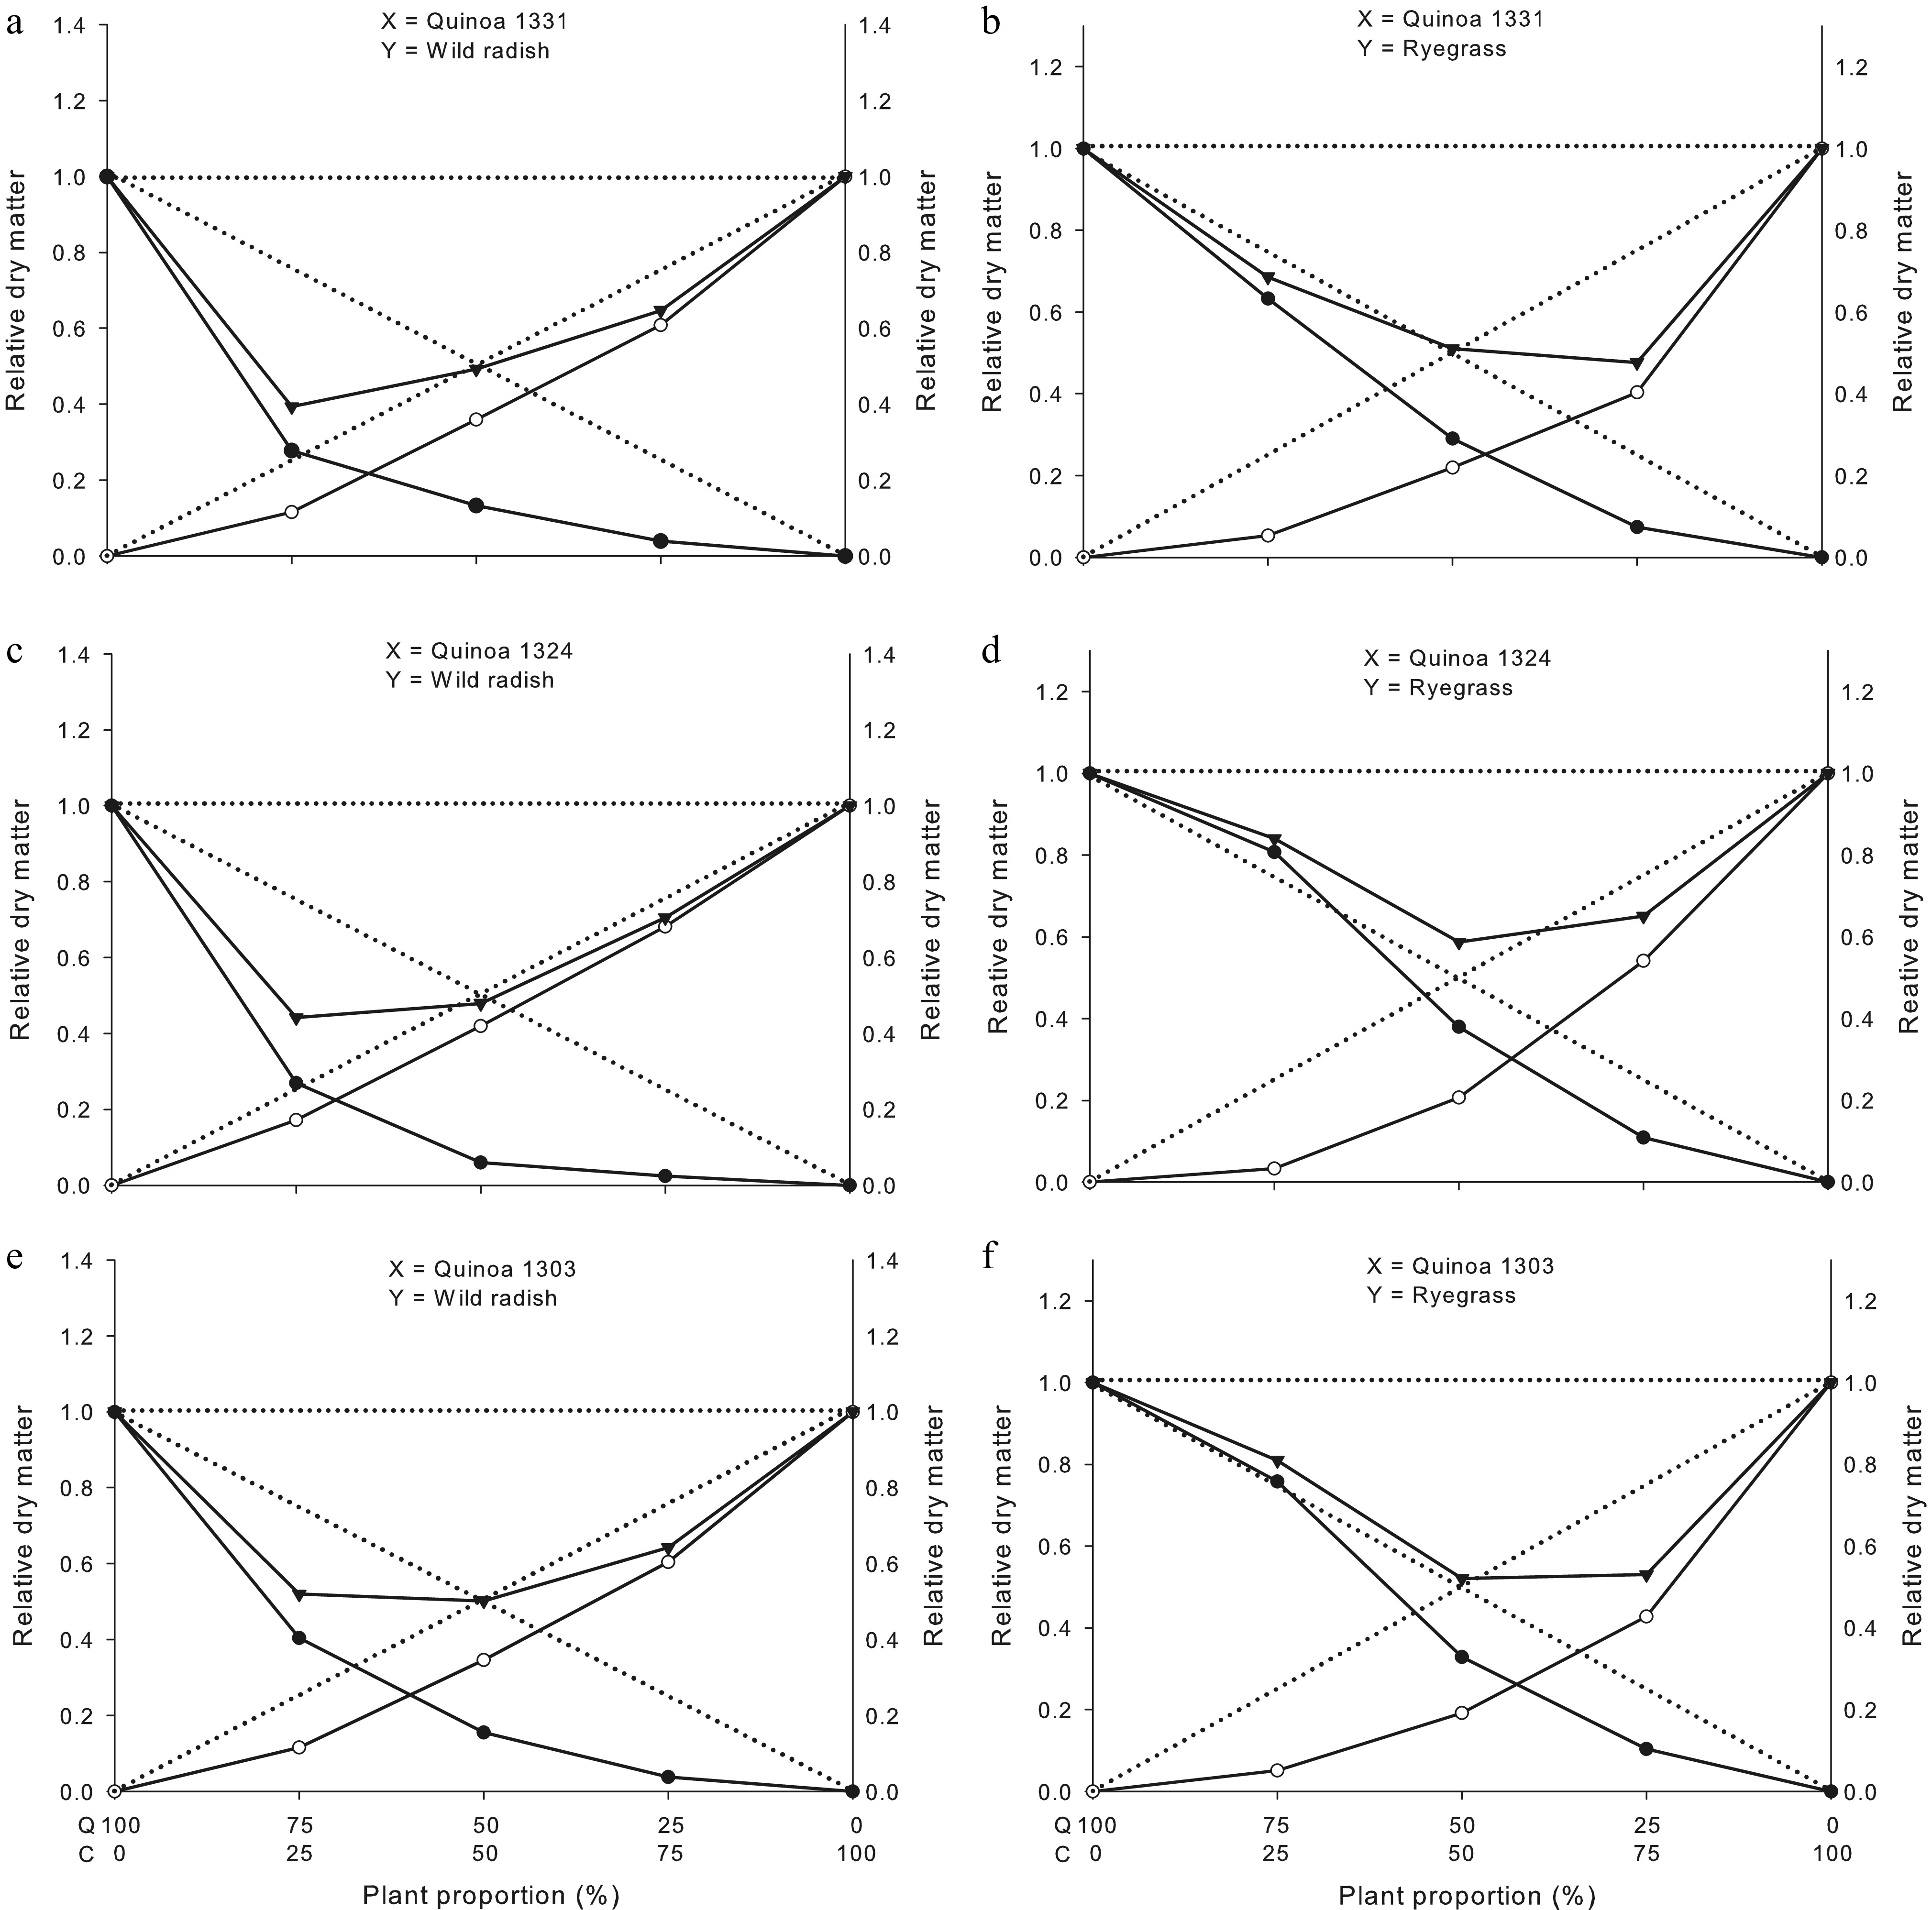
Figure 5.
Total relative productivity (TRP), and relative productivity (RP) for shoot dry matter of quinoa genotypes 1331, 1324, and 1303. Quinoa (●); wild radish (o: a, c and e) or ryegrass (o: b, d and f), and community (crop + weed) yields (▼). Dashed lines (- - -) represent the expected yields in the absence of interspecific competition, whereas solid lines (―) represent the observed values under interspecific competition. UFFS, Erechim, RS, Brazil. Q: quinoa and C: competitor.
Tables 1 and 2, and Supplementary Tables S1 and S2 detail impacts in quinoa growth traits under wild radish and ryegrass competition at ratios 25:75, 50:50, and 75:25 compared to weed-free controls. Genotypes showed significant declines in height, stem diameter, leaf number, chlorophyll index, leaf area, and shoot dry matter (Table 1). Wild radish leaf number increased at intermediate ratios, highlighting its competitive advantage. The decline in chlorophyll index in quinoa 1303, contrasted with its increase in wild radish, suggests adaptive responses to competition stress. Shoot dry matter reductions in both species confirm that resource competition constrained growth, with quinoa possibly allocating more resources to stem growth to capture light.
Table 1. Differences in plant height (PH), stem diameter (SD), leaf area (LA), number of leaves (NL), chlorophyll index (CI), and shoot dry matter (SDM) of quinoa genotypes 1331, 1324, and 1303 under competition and in the absence of competition (C, control) with wild radish. UFFS, Erechim, RS, Brazil.
Plant proportion (Quinoa : wild radish) PH (cm) SD (mm) NL CI (SPAD) LA (cm2·pot−1) SDM (g·pot−1) Genotype 1331 100:0 (C) 65.84 8.19 56.25 58.11 1008.45 77.41 75:25 60.42 6.52 47.25 56.44 763.05* 28.70* 50:50 42.97* 5.42* 38.00* 50.00* 773.11* 20.55* 25:75 41.15* 4.13* 36.75* 46.26* 407.86* 12.02* CV (%) 5.95 16.99 10.67 6.54 10.87 16.06 Wild radish 0:100 (C) 72.62 8.22 24.75 45.28 1,035.34 91.68 25:75 73.63 9.62 27.00 46.61 1,603.86* 74.37* 50:50 79.39 9.81* 25.50 42.94 1,178.12 65.95* 75:25 75.80 9.70 28.00 43.64 1,681.76* 42.36* CV (%) 5.20 6.64 8.52 5.03 10.96 6.03 Genotype 1324 100:0 (C) 67.16 6.84 62.00 60.98 1,241.30 73.18 75:25 41.35* 6.23 37.00* 59.15 570.71* 26.29* 50:50 33.18* 4.34* 36.25* 48.31* 435.48* 8.76* 25:75 37.85* 4.91* 32.50* 51.93* 437.80* 6.99* CV (%) 9.02 11.16 5.85 5.44 16.53 8.68 Wild radish 0:100 (T) 75.24 7.67 20.25 43.69 846.08 82.42 25:75 82.55* 10.17 23.50 39.54 700.88 74.83* 50:50 82.23* 8.82 26.00* 43.73 1,088.85 69.10* 75:25 91.20* 11.03* 36.51* 37.43* 1,542.49* 56.69* CV (%) 4.34 14.34 10.14 7.58 18.79 5.47 Genotype 1303 100:0 (C) 71.11 6.11 52.00 59.94 853.00 68.22 75:25 68.34 6.71 43.25* 58.25 863.07 36.75* 50:50 47.10* 3.84* 35.75* 49.25* 475.62* 21.23* 25:75 52.88* 5.77 41.50* 51.99* 552.26* 10.41* CV (%) 9.83 7.21 6.34 6.12 11.88 10.95 Wild radish 0:100 (C) 81.86 8.16 20.00 34.46 648.72 85.92 25:75 76.35* 8.90 22.00 45.95* 917.49* 69.20* 50:50 82.61 8.72 26.75 39.69* 1,438.82* 59.51* 75:25 81.29 9.89* 25.00 41.40* 1,495.88* 39.86* CV (%) 3.39 7.46 16.92 5.64 6.93 5.55 * Mean differs from the respective control (C) by Dunnett's (p ≤ 0.05). Table 2. Differences in plant height, stem diameter, leaf area, number of leaves, chlorophyll index, and shoot dry matter of quinoa genotypes 1331, 1324, and 1303 under competition and in the absence of competition (C, control) with ryegrass. UFFS, Erechim, RS, Brazil.
Plant proportion (Quinoa : ryegrass) Plant height (cm) Stem diameter (mm) Number of leaves/tillers Chlorophyll index (SPAD) Leaf area
(cm2·pot−1)Dry mass
(g·pot−1)Genotype 1331 100:0 (C) 30.11 4.52 54.19 49.74 371.64 18.18 75:25 29.70 5.46* 65.25* 56.11* 486.73 15.33* 50:50 31.04 4.63 56.44 54.51* 495.49 10.57* 25:75 26.95 5.02* 43.44* 57.27* 307.85 5.35* CV (%) 5.87 5.09 4.98 3.58 16.34 5.95 Ryegrass 0:100 (C) 44.95 2.13 14.88 43.63 2,125.67 17.99 25:75 44.73 1.89 13.19 41.30 1,371.26* 9.68* 50:50 46.85* 1.86 10.56* 43.14 1,031.97* 7.91* 75:25 43.58 1.89 13.13 45.28 535.78* 3.81* CV (%) 2.64 10.76 11.82 3.67 12.82 9.02 Genotype 1324 100:0 (C) 27.05 4.66 50.50 57.15 433.53 14.34 75:25 32.50* 4.96 42.25* 59.08* 391.13 15.44 50:50 30.72* 5.22* 52.19 56.10 444.70 10.89* 25:75 29.73 4.96 44.63* 54.92* 431.57 6.24* CV (%) 4.15 3.65 6.30 1.53 9.90 7.08 Ryegrass 0:100 (C) 47.77 1.89 17.38 43.89 1,361.84 17.27 25:75 48.21 1.76 17.00 44.99 1,870.01* 12.47* 50:50 44.44 1.98 15.06* 43.62 809.19* 7.16* 75:25 39.19* 1.65 9.25* 40.73 398.93* 2.27* CV (%) 5.36 7.60 7.96 4.05 3.67 3.71 Genotype 1303 100:0 (C) 29.78 4.66 52.25 56.27 283.56 15.30 75:25 28.49 4.57 54.13 54.75 342.82* 15.47 50:50 30.66 5.34* 54.25 53.53 343.93* 10.60* 25:75 30.53 5.15* 49.56 50.49* 452.08* 6.32* CV (%) 3.39 4.31 10.18 5.12 7.00 3.72 Ryegrass 0:100 (C) 43.53 1.79 14.34 43.68 2,190.73 19.12 25:75 46.49 1.88 15.00 42.23 1,785.58* 10.89* 50:50 44.41 2.03 12.18 35.74* 1,145.49* 7.34* 75:25 44.85 1.95 13.25 43.10 626.78* 3.94* CV (%) 3.30 6.66 9.92 4.31 8.07 8.45 * Mean differs from the respective control (C) by Dunnett's (p ≤ 0.05). Comparison to controls (Tables 1 and 3) confirmed negative impacts on quinoa, especially at balanced or wild radish-dominated ratios, as also reported by Franz et al.[15]. Wild radish was less affected, showing increases in stem diameter, chlorophyll index, and leaf area, likely linked to its efficiency in light interception and resource use. This species exhibits strong competitiveness due to its sparse and highly branched canopy[15]. Previous studies have shown that, when competing with barley and canola, wild radish dominates the environment[13,15], rapidly suppressing crop growth and development. In general, when one species is more competitive than another, it demonstrates a superior ability to capture the available resources[4]. The reduction in plant height and stem diameter of quinoa genotypes, particularly at the 50:50 crop-weed ratio, indicates that competition was more intense in this configuration, restricting structural growth. Biomass accumulation was most severely reduced in quinoa genotypes 1331 and 1303 (Table 1). Quinoa plants may have prioritized stem growth to compete for light, a limiting resource during early development, whose scarcity under competition can reduce yield potential[27]. Similarly, Galon et al.[28] reported that increasing wild radish density led to greater reductions in leaf area and shoot mass in barley. The lower impact on the chlorophyll index suggests that this trait may be less sensitive to competition, except at the 50:50 ratio, where stress was greatest. Interestingly, wild radish competition also reduced its own shoot dry mass, indicating that the interaction can be limiting for both species, although quinoa experienced more severe impacts. Other studies have also reported negative effects on wheat and barley when infested with wild radish, including detrimental impacts on the weed itself[12,27,29]. According to Leon et al.[1], when crops and weeds occur at similar densities, weeds are typically more competitive, often supported by higher population densities than cultivated plants[3,4].
Table 3. Competitiveness indices between quinoa genotypes and wild radish expressed by relative competitiveness (RC), relative crowding coefficient (K), and aggressiveness (AG) in replacement series experiments. UFFS, Erechim, RS, Brazil.
Genotype and species RC Kx (quinoa) Ky (wild radish) AG Plant height Quinoa 1331 × Wild radish 0.60 (± 0.02)* 0.49 (± 0.02)* 1.21 (± 0.04)* −0.22 (± 0.01)* Quinoa 1324 × Wild radish 0.45 (± 0.01)* 0.33 (± 0.01)* 1.20 (± 0.007)* −0.30 (± 0.01)* Quinoa 1303 × Wild radish 0.66 (± 0.03)* 0.50 (± 0.04)* 1.02 (± 0.02)* −0.17 (± 0.01)* Stem diameter Quinoa 1331 × Wild radish 0.56 (± 0.07)* 0.51 (± 0.09)* 1.51 (± 0.17)* −0.27 (± 0.04)* Quinoa 1324 × Wild radish 0.56 (± 0.03)* 0.47 (± 0.009)* 1.38 (± 0.13)* −0.26 (± 0.03)* Quinoa 1303 × Wild radish 0.59 (± 0.06)* 0.46 (± 0.05)* 1.15 (± 0.05)* −0.22 (± 0.06)* Number of leaves Quinoa 1331 × Wild radish 0.65 (± 0.06)* 0.53 (± 0.08)* 1.06 (± 0.02)* −0.18 (± 0.03)* Quinoa 1324 × Wild radish 0.46 (± 0.01)* 0.41 (± 0.01)* 1.80 (± 0.08)* −0.35 (± 0.01)* Quinoa 1303 × Wild radish 0.55 (± 0.09)* 0.52 (± 0.02) 2.94 (± 1.14)* −0.33 (± 0.01)* Chlorophyll index Quinoa 1331 × Wild radish 0.91 (± 0.06) 0.76 (± 0.07) 0.90 (± 0.03) −0.04 (± 0.03) Quinoa 1324 × Wild radish 0.80 (± 0.04)* 0.66 (± 0.03)* 1.01 (± 0.06)* −0.10 (± 0.02)* Quinoa 1303 × Wild radish 0.72 (± 0.03)* 0.70 (± 0.01)* 1.38 (± 0.12)* −0.17 (± 0.02)* Leaf area Quinoa 1331 × Wild radish 0.57 (± 0.04)* 0.20 (± 0.01)* 0.41 (± 0.01)* −0.13 (± 0.02)* Quinoa 1324 × Wild radish 0.44 (± 0.05)* 0.25 (± 0.01)* 0.87 (± 0.01)* −0.26 (± 0.04)* Quinoa 1303 × Wild radish 1.01 (± 0.11)* 0.26 (± 0.02) 0.26 (± 0.02) −0.002 (± 0.02)* Shoot dry matter Quinoa 1331 × Wild radish 0.37 (± 0.05)* 0.15 (± 0.02)* 0.56 (± 0.03)* −0.23 (± 0.03)* Quinoa 1324 × Wild radish 0.14 (± 0.01)* 0.06 (± 0.005)* 0.72 (± 0.03)* −0.36 (± 0.01)* Quinoa 1303 × Wild radish 0.45 (± 0.02)* 0.18 (± 0.01)* 0.53 (± 0.02)* −0.19 (± 0.01)* * Significant difference by the t-test (p ≤ 0.05). Values between brackets are the standard error mean. In quinoa, the critical period for weed control generally occurs between 30 and 50 d after crop emergence, during which the crop should remain free from competition to avoid irreversible yield losses. However, this period may shift depending on environmental conditions such as rainfall, solar radiation, drought stress, soil fertility, cultivar, and management practices. The crop cycle of quinoa, an annual species, typically ranges from 80 to 150 d, depending on the variety. Among the weeds tested, wild radish proved to be more competitive than ryegrass, and it is also more difficult to manage because both quinoa and wild radish are dicotyledonous species, which restricts the range of selective herbicides available. Ryegrass, in contrast, is more easily controlled by grass-specific herbicides that are selective to quinoa, as the crop possesses enzymes insensitive to graminicides. Considering these constraints, increasing plant density to promote faster canopy closure may be recommended as a potential integrated weed management strategy, provided that soil fertility and water availability are adequate to minimize the risk of intraspecific competition within the quinoa crop.
Competitiveness indexes
-
Table 3 shows that quinoa genotypes have lower RCs and AG than wild radish, which was generally more aggressive. Genotype 1303 had the highest RC for height (0.66) and stem diameter (0.59), with 1331 showing the highest crowding coefficient (Kx). The relative crowding coefficients (Kx) reflect differences in growth strategies among genotypes, with 1331 demonstrating greater relative efficiency in biomass allocation. All quinoa genotypes exhibited negative AG, confirming wild radish's superiority in competition. Similar patterns were seen for leaf number, chlorophyll index, leaf area, and shoot dry matter. Thus, wild radish holds a competitive advantage due to greater aggressivity and potentially more efficient resource acquisition mechanisms[1,22].
Table 2 and Supplementary Table S2 compare quinoa vs ryegrass. Genotype 1331 was generally taller, though ryegrass was less affected. Genotypes 1324 and 1303 showed greater stem diameter and leaf/tiller stability. Ryegrass had significant reductions in tiller number and biomass, while quinoa leaf area remained stable, indicating a more balanced competition compared to wild radish. The observed reduction in leaf number in quinoa and in tiller number in ryegrass suggests that competition negatively affected plant architecture, as similarly reported by Leon et al.[1] and Asato et al.[22]. Chlorophyll index increased in 1331 but decreased in ryegrass, suggesting differential physiological adjustments, as reported in common bean cultivars under competition with horseweed[24].
Competitiveness indices (Table 4) indicate that genotype 1324 was the most competitive for height and biomass, 1331 for leaf/tiller number and leaf area, and 1303 for chlorophyll index and shoot dry matter. All genotypes maintained competitive capacity against ryegrass, though resource competition still limited biomass accumulation. Table 4 also highlights the effects of varying species ratios on growth and developmental traits, showing that as the proportion of weeds increased, significant reductions in crop growth were observed, corroborating findings from wheat and barley studies competing with ryegrass[12,27,30]. These reductions are mainly attributed to competition for critical resources such as light, water, and nutrients, which are central to interspecies interactions. Relative competitiveness coefficients further demonstrate that weeds have a greater capacity to exploit environmental resources than quinoa, leading to reduced biomass and potential yield losses. These results align with Pies et al.[30], who reported decreased barley productivity under intensified ryegrass competition.
Table 4. Competitiveness indices between quinoa genotypes (1331, 1324, and 1303) and the competitor (ryegrass), expressed as relative competitiveness (RC), relative crowding coefficient (K), and aggressiveness (AG) in replacement series experiments. UFFS, Erechim, RS, Brazil.
Genotype and species RC Kx (quinoa) Ky (ryegrass) AG Plant height Quinoa 1331 × Ryegrass 0.99 (± 0.02) 1.07 (± 0.05)* 1.09 (± 0.02) −0.01 (± 0.01) Quinoa 1324 × Ryegrass 1.22 (± 0.02)* 1.32 (± 0.05)* 0.87 (± 0.03)* 0.10 (± 0.01)* Quinoa 1303 × Ryegrass 0.99 (± 0.02) 1.06 (± 0.04) 1.08 (± 0.01) −0.001 (± 0.01) Stem diameter Quinoa 1331 × Ryegrass 1.19 (± 0.10) 1.05 (± 0.02)* 0.79 (± 0.1) 0.07 (± 0.03) Quinoa 1324 × Ryegrass 1.07 (± 0.02)* 1.28 (± 0.09) 1.11 (± 0.01) 0.04 (± 0.01)* Quinoa 1303 × Ryegrass 1.01 (± 0.03) 1.35 (± 0.06) 1.32 (± 0.05) 0.01 (± 0.02) Number of leaves/tillers Quinoa 1331 × Ryegrass 1.54 (± 0.22) 1.10 (± 0.09)* 0.57 (± 0.1)* 0.17 (± 0.06) Quinoa 1324 × Ryegrass 1.19 (± 0.04)* 1.08 (± 0.1)* 0.77 (± 0.06)* 0.08 (± 0.02)* Quinoa 1303 × Ryegrass 1.23 (± 0.06)* 1.08 (± 0.04)* 0.74 (± 0.04)* 0.10 (± 0.02)* Chlorophyll index Quinoa 1331 × Ryegrass 1.11 (± 0.01)* 1.21 (± 0.04)* 0.98 (± 0.03)* 0.05 (± 0.01)* Quinoa 1324 × Ryegrass 0.99 (± 0.01) 0.96 (± 0.001)* 0.99 (± 0.01) −0.01 (± 0.001) Quinoa 1303 × Ryegrass 1.16 (± 0.03)* 0.91 (± 0.02)* 0.69 (± 0.03)* 0.07 (± 0.01)* Leaf area Quinoa 1331 × Ryegrass 2.85 (± 0.38)* 2.12 (± 0.34)* 0.33 (± 0.05)* 0.42 (± 0.04)* Quinoa 1324 × Ryegrass 1.73 (± 0.06)* 1.06 (± 0.08)* 0.42 (± 0.002)* 0.22 (± 0.02)* Quinoa 1303 × Ryegrass 2.33 (± 0.10)* 1.58 (± 0.19)* 0.36 (± 0.03)* 0.34 (± 0.02)* Shoot dry matter Quinoa 1331 × Ryegrass 1.34 (± 0.12) 0.41 (± 0.03)* 0.28 (± 0.02)* 0.07 (± 0.02) Quinoa 1324 × Ryegrass 1.83 (± 0.06)* 0.62 (± 0.04)* 0.26 (± 0.004)* 0.17 (± 0.01)* Quinoa 1303 × Ryegrass 1.72 (± 0.09)* 0.49 (± 0.03)* 0.24 (± 0.03)* 0.14 (± 0.01)* * Significant difference by the t-test (p ≤ 0.05). Values into brackets are the standard error of the mean. Competition for nutrients between species
-
Table 5 and also Supplementary Tables S3 and S4 summarize the nitrogen (N) and phosphorus (P) content, extraction, and efficiency of quinoa genotypes under competition with wild radish and ryegrass. Under wild radish competition, genotype 1324 maintained or increased N content at the 75:25 ratio but showed marked reductions at higher weed densities, especially for P. Genotype 1303, despite a 46.14% biomass reduction and 42.94% decrease in N extraction at the 75:25 ratio, demonstrated greater N use efficiency and soil exploration capacity. In contrast, genotype 1324 suffered the greatest biomass (90.46%) and P extraction (90.68%) reductions at the 25:75 ratio, highlighting the strong suppressive effect of wild radish.
Table 5. Responses of quinoa genotypes (Q) in competition with wild radish (Raphanus raphanistrum) and/or ryegrass (Lolium multiflorum), expressed by nitrogen (N) and phosphorus (P) contents (dag·kg−1) in replacement series experiments. UFFS, Erechim, RS, Brazil.
Plant proportion (Quinoa : wild radish) Plant proportion (Quinoa : ryegrass) Q 1303 × Wild radish Q 1324 × Wild radish Q 1331 × Wild radish Q 1303 × Ryegrass Q 1324 × Ryegrass Q 1331 × Ryegrass N P N P N P N P N P N P 100:0 (C) 14.12 0.56 15.92 0.61 10.61 0.52 9.30 1.16 8.78 1.15 9.70 1.23 75:25 14.97* 0.54 15.44 0.51* 14.91* 0.55 9.05 1.17 8.60 1.22* 9.85 1.24 50:50 12.81* 0.52 16.43 0.50* 16.72* 0.52 8.90 1.12 8.31* 1.25* 9.23 1.13* 25:75 15.21* 0.60 15.56 0.60 12.26* 0.47 8.94 1.11 9.28* 1.19 8.34* 1.12* CV (%) 2.81 5.15 6.47 4.56 3.81 5.84 4.11 2.38 2.57 2.98 6.65 3.35 * Mean differ from the respective control (C) by Dunnett's (p ≤ 0.05). Under ryegrass competition, genotypes 1303 and 1324 were more efficient in maintaining nutrient acquisition than 1331, especially at higher competition intensities. At the 25:75 ratio, reductions in N extraction were 60.30% (1303) and 56.40% (1324), while 1331 showed losses of 74.77%. Phosphorus extraction followed the same trend, with 1331 again showing the highest reductions (73.12%). Interestingly, at the 75:25 ratio, quinoa maintained P acquisition, suggesting possible rhizospheric interactions favoring nutrient uptake.
Overall, N and P extraction decreased with increasing competition, directly reflecting biomass reduction. These results confirm the strong negative impact of weeds on quinoa performance and the genotypic variation in competitive ability. The RC (Table 1) indicates quinoa is generally less efficient in resource acquisition than weeds. In line with Agostinetto et al.[4], Galon et al.[13], and Brunetto et al.[7], this study highlights the importance of evaluating competitive indices to guide integrated weed management and supporting sustainable quinoa production.
-
The quinoa genotypes (1303, 1324, and 1331) primarily compete for the same environmental resources as ryegrass and wild radish. While these genotypes exhibited some variations in specific traits, their overall competitive capacity against a given weed species was similar. Variations in the RC, K, and AG across morphological, physiological, and nutritional traits indicate that the intensity of competition is strongly species-dependent.
Across the evaluated traits, quinoa showed greater relative growth in the presence of ryegrass and lower growth under wild radish interference, confirming that wild radish is the more competitive weed species in quinoa systems. This difference may be explained by the greater morphological and physiological similarity between quinoa and wild radish (both broadleaf species), which increases niche overlap and intensifies competition.
From a management perspective, these results reinforce the importance of early-season weed control, particularly against wild radish, during the critical weed-free period of quinoa establishment. Future studies should validate these findings under field conditions, evaluate the integration of competitive genotypes with other cultural practices, such as optimized plant density and row spacing, and assess their compatibility with selective herbicide programs. Such research would contribute to the development of integrated weed management strategies aimed at reducing yield losses, improving crop competitiveness, and promoting sustainable quinoa production.
This study was supported by the National Council for Scientific and Technological Development (CNPq; process number 312652/2023-2) and the Federal University of Fronteira Sul (UFFS; process number PES-2018-0059). The authors thank the National Council for Scientific and Technological Development (CNPq), the Foundation for Research Support of the State of Rio Grande do Sul (FAPERGS), the Federal University of Fronteira Sul (UFFS), and the Funding Agency for Studies and Projects (FINEP) for their support.
-
The authors confirm their contributions to the paper as follows: study conception and design: Galon L, Perin GF, Castamann A; data collection: Bampi L, Cavaletti DC, Brunetto L, Cechet EHS; analysis and interpretation of results: Concenço G, Galon L, Perin GF; draft manuscript preparation: Bagnara MAM, Munareto JD, Brunetto L. All authors reviewed the results and approved the final version of the manuscript.
-
The data that support the findings of this study are available from the corresponding author upon reasonable request.
-
The authors declare that they have no conflict of interest.
- Supplementary Table S1 Relative differences in plant height, stem diameter, leaf area, number of leaves, chlorophyll index, and shoot dry matter of quinoa genotypes 1331, 1324, and 1303 under competition with wild radish. UFFS, Erechim, RS, Brazil.
- Supplementary Table S2 Relative differences in plant height, leaf area, stem diameter, number of leaves/tillers, and shoot dry matter of quinoa genotypes 1331, 1324, and 1303 under competition with ryegrass. UFFS, Erechim, RS, Brazil.
- Supplementary Table S3 Responses of quinoa genotypes (Q) in competition with wild radish (Raphanus raphanistrum) and/or ryegrass (Lolium multiflorum), expressed by the amount of nitrogen (N) and phosphorus (P) (mg·pot−1) in replacement series experiments. UFFS, Erechim, RS, Brazil.
- Supplementary Table S4 Responses of quinoa genotypes (Q) in competition with wild radish (Raphanus raphanistrum) and/or ryegrass (Lolium multiflorum), expressed as the percentage reduction in nitrogen (N) and phosphorus (P) in replacement series experiments. UFFS, Erechim, RS Campus.
- Supplementary Fig. S1 Experiments on quinoa crop under competition with ryegrass (a) and/or wild radish (b). UFFS, Campus Erechim/RS.
- Supplementary Fig. S2 Total relative productivity (TRP), and relative productivity (RP) for leaf number of quinoa genotypes 1331, 1324, and 1303. Quinoa (●); wildradish (o: a, c and e) or ryegrass (o: b, d and f), and community (crop + weed) yields (▼). Dashed lines (- - -) represent the expected yields in the absence of interspecific competition, whereas solid lines (―) represent the observed values under interspecific competition. UFFS, Erechim, RS, Brazil. Q: quinoa and C: competitor.
- Supplementary Fig. S3 Total relative productivity (TRP), and relative productivity (RP) for chlorophyll index of quinoa genotypes 1331, 1324, and 1303. Quinoa (●); wildradish (o: a, c and e) or ryegrass (o: b, d and f), and community (crop + weed) yields (▼). Dashed lines (- - -) represent the expected yields in the absence of interspecific competition, whereas solid lines (―) represent the observed values under interspecific competition. UFFS, Erechim, RS, Brazil. Q: quinoa and C: competitor.
- Copyright: © 2025 by the author(s). Published by Maximum Academic Press, Fayetteville, GA. This article is an open access article distributed under Creative Commons Attribution License (CC BY 4.0), visit https://creativecommons.org/licenses/by/4.0/.
-
About this article
Cite this article
Galon L, Bampi L, Cavaletti DC, Brunetto L, Concenço G, et al. 2025. Competitive outcomes of quinoa genotypes with wild radish and ryegrass at increasing levels of infestation. Technology in Agronomy 5: e014 doi: 10.48130/tia-0025-0009 

Competitive outcomes of quinoa genotypes with wild radish and ryegrass at increasing levels of infestation
- Received: 19 June 2025
- Revised: 18 August 2025
- Accepted: 22 August 2025
- Published online: 13 October 2025
Abstract: The weed species wild radish (Raphanus raphanistrum) and ryegrass (Lolium multiflorum) exhibit high competitive ability for resources such as water, light, and nutrients when infesting quinoa crops. The present study aimed to compare the competitive ability of three quinoa genotypes (Q 1303, Q 1331, and Q 1324) in the presence of wild radish and ryegrass. The experiments were conducted under greenhouse conditions using a randomized complete block design with four replicates. Initially, the optimal plant density for quinoa genotypes and competing weeds was determined based on the point at which shoot dry matter production stabilized (20 plants per pot). Subsequently, five replacement series experiments were established to assess the competitive interactions between quinoa and the weeds, combining species in relative proportions of 100:0, 75:25, 50:50, 25:75, and 0:100, corresponding to 20:0, 15:5, 10:10, 5:15, and 0:20 plants per pot, respectively. Competitiveness was analyzed using replacement series diagrams and relative competition indices. Variables evaluated included plant height, stem diameter, number of leaves/tillers, chlorophyll index, leaf area, shoot dry matter, and nutrient content in both quinoa and competing plants. The quinoa genotypes competed for the same environmental resources as the weeds and showed similar competitive ability against each weed species. Overall, quinoa exhibited greater relative growth in the presence of ryegrass and reduced growth when infested with wild radish, which proved to be a more competitive weed species.
-
Key words:
- Competitive ability /
- Replacement series /
- Weed competition