














-
Recent studies indicate a rising global prevalence of diabetic retinopathy (DR), which is a leading cause of visual impairment among the working-age population[1,2]. Vision-threatening diabetic retinopathy (VTDR), an advanced stage of DR, often progresses asymptomatically until irreversible damage occurs, with a worldwide prevalence of approximately 6.17% among diabetic patients[1]. Untreated VTDR can lead to irreversible vision loss, imposing substantial economic burdens on healthcare systems and severely compromising the quality of life of patients[3]. Consequently, early detection of VTDR is crucial for initiating timely interventions, optimizing long-term therapeutic outcomes, and reducing healthcare costs[4].
The cornerstone of VTDR monitoring and management remains timely ophthalmic screening via regular fundus examinations. However, the translation of this guideline into effective practice remains challenging in achieving high patient compliance and efficient referrals between specialties, particularly in rural and remote areas with limited access to ophthalmological services[5]. This issue is exacerbated by a global shortage of ophthalmologists, especially in developing countries[6]. Consequently, effective interdepartmental management of DR between endocrinology and ophthalmology is essential yet often difficult to implement, creating an urgent need for a paradigm shift in our screening approach[7].
A wealth of evidence has implicated numerous systemic factors, including diabetes duration, glycemic control, lipid profiles, renal function, hypertension, cardiovascular history, and medication, in VTDR development[8−11]. Assessing systemic risk factors for VTDR is crucial for monitoring disease progression from an overall condition of the body; however, findings across studies have been inconsistent. While previous studies have proposed VTDR risk assessment models, they have several limitations, including small sample sizes, lack of external validation, suboptimal discriminatory power, or reliance on variables or examination equipment not readily available in routine practice[12−17]. These limitations restrict their clinical implementation, particularly in primary care and resource-limited settings.
Therefore, there is an urgent need to develop a simple, rapid, accurate, and cost-effective screening tool to evaluate the risk of VTDR in community-based settings, utilizing easily accessible systemic variables rather than relying on specialized ophthalmic expertise or equipment. This study aims to develop and validate a practical VTDR risk prediction model for patients with T2DM using readily obtainable systemic variables that can be collected by non-ophthalmic healthcare providers. In contrast to prior models that either required more numerous or less accessible variables and lacked independent external validation, our model was designed to be parsimonious and rigorously validated across independent multicenter cohorts, with all predictors derived from standard laboratory tests and clinical parameters universally available in primary care settings. By facilitating early detection and management by non-ophthalmic healthcare providers, this model is expected to bridge the gap between research and real-world clinical application and assist in reducing costs in healthcare systems, improving patient outcomes, and enhancing the efficiency and accessibility of VTDR screening.
-
This study comprised a meta-analysis of VTDR predictors, followed by the development and external validation of four clinical prediction nomograms based on the findings of the meta-analysis and regression analysis. The whole study design is illustrated in Fig. 1. The effectiveness of these four predictive models was verified through the receiver operating characteristic (ROC) curve, calibration curve, and decision curve analysis (DCA). The workflow of the model development and validation is summarized in Fig. 2.
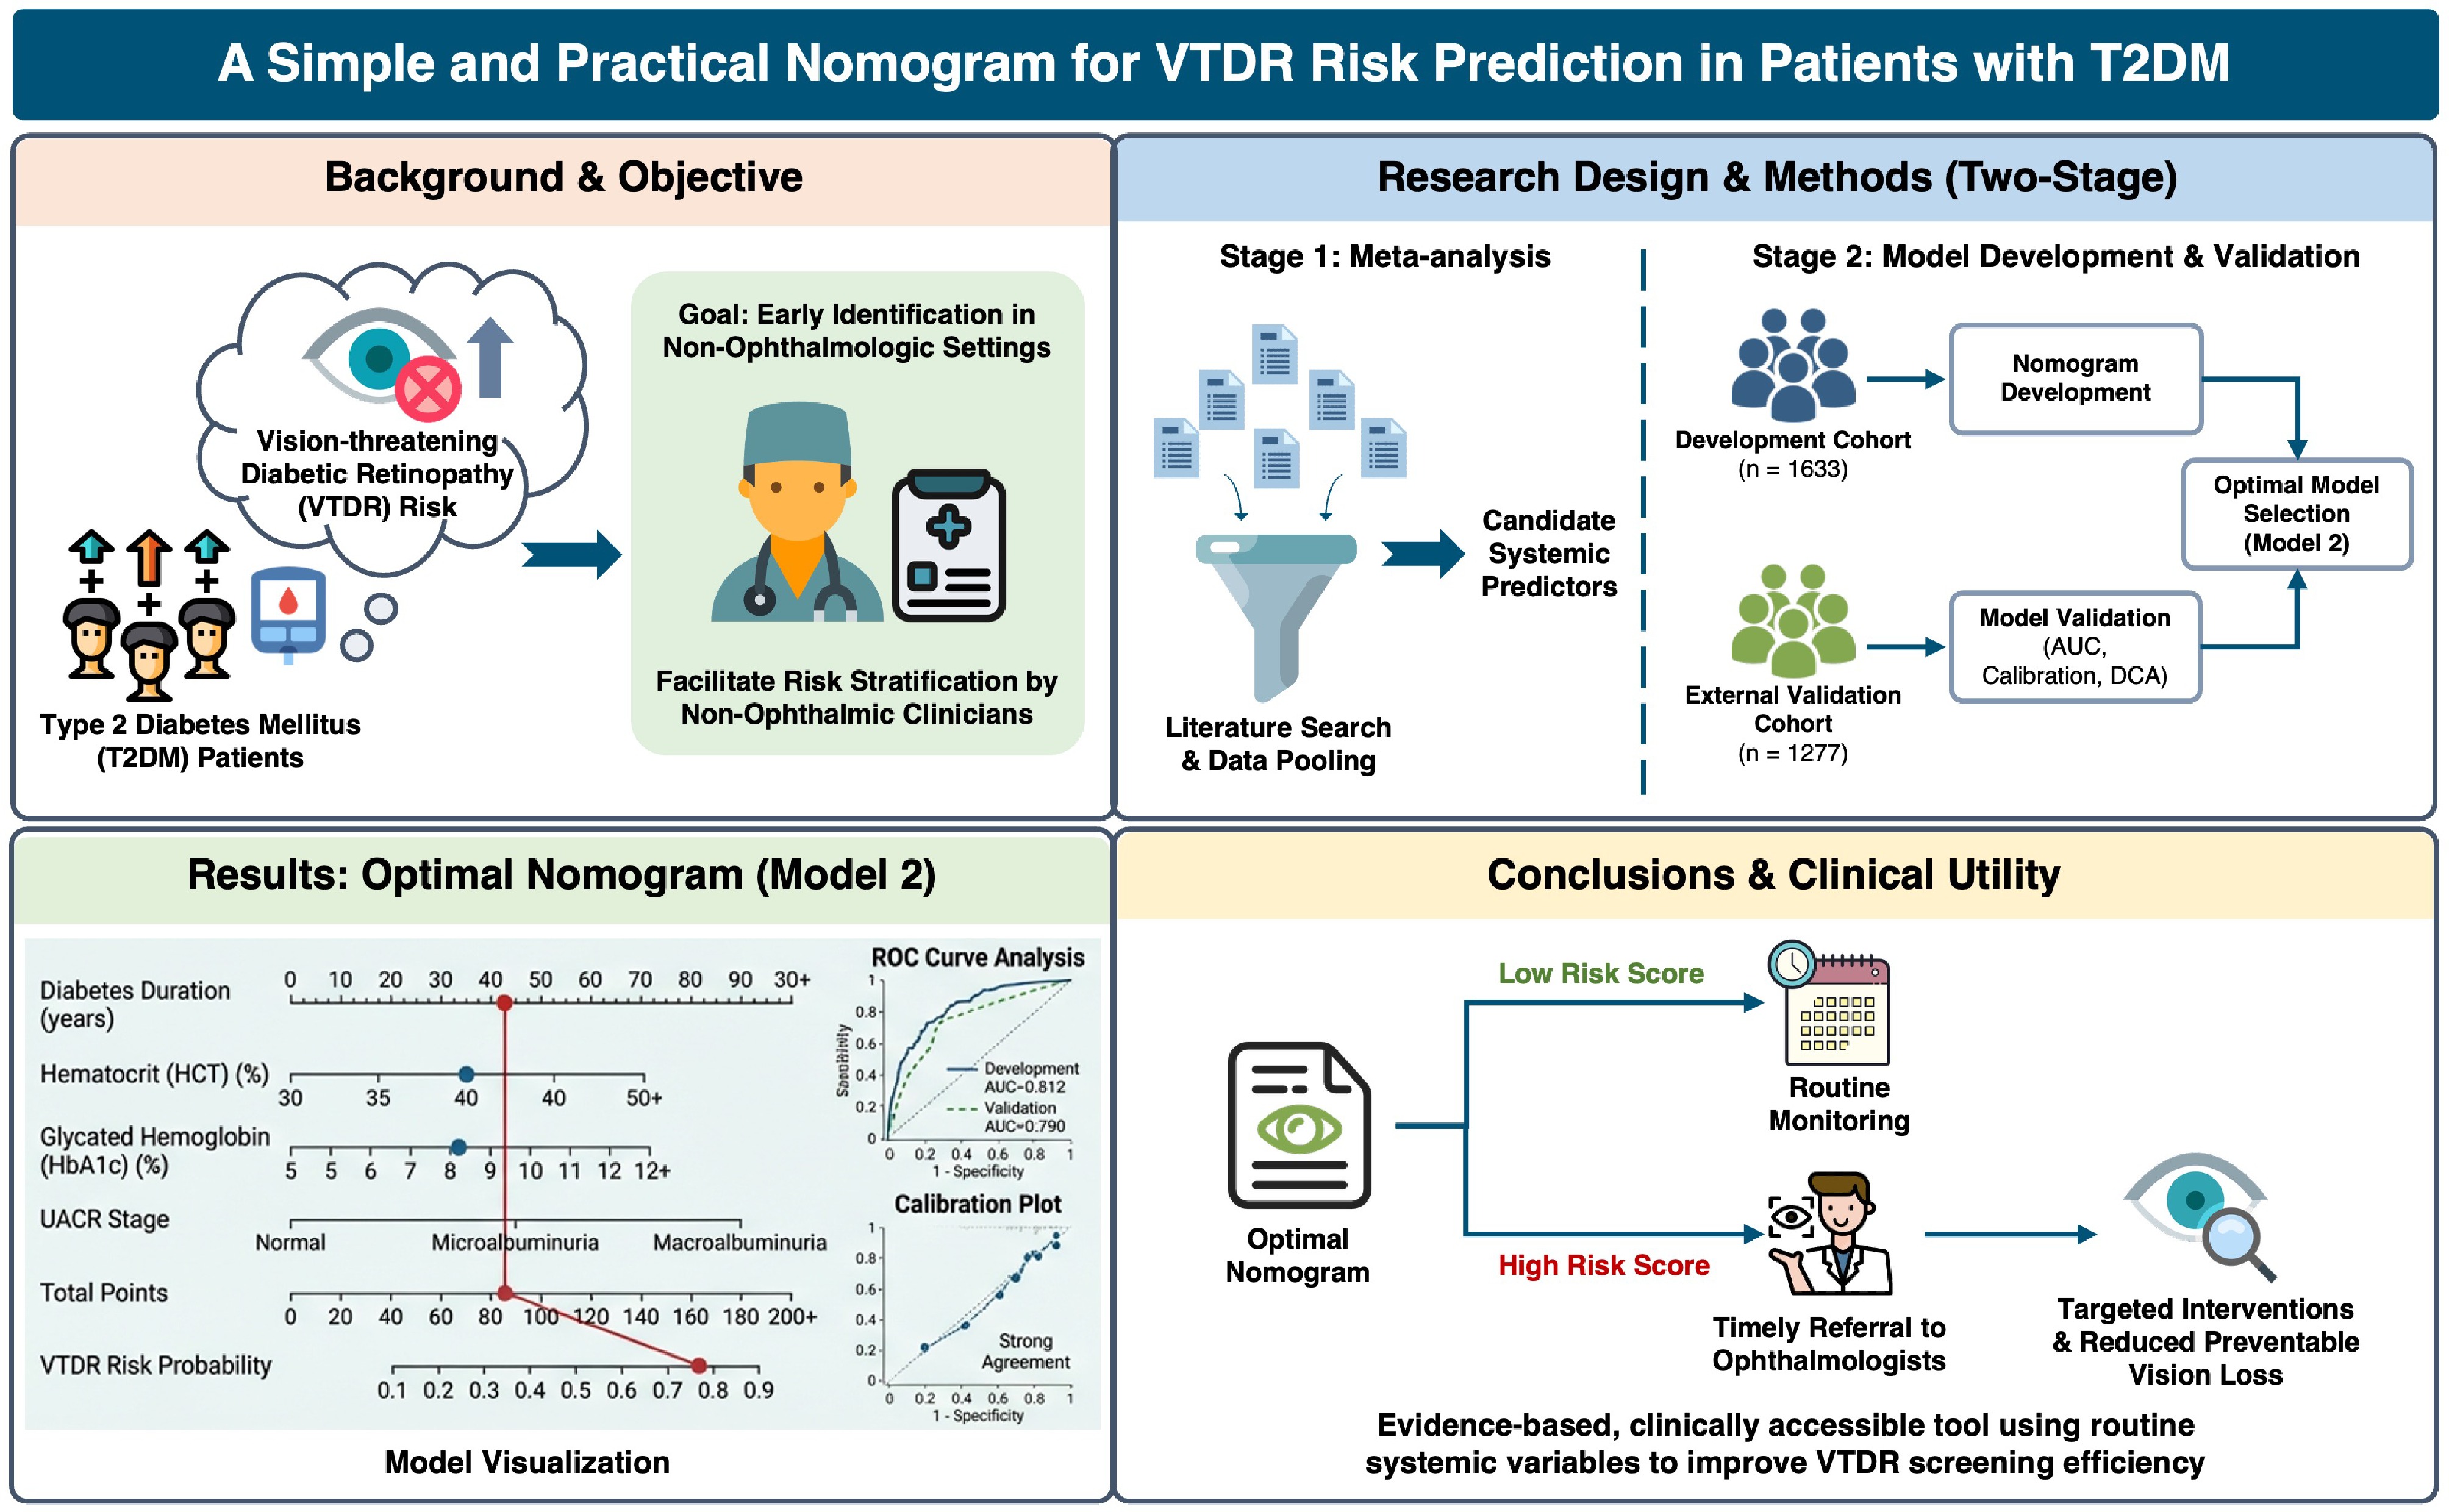
Figure 1.
Illustration of the whole study design.
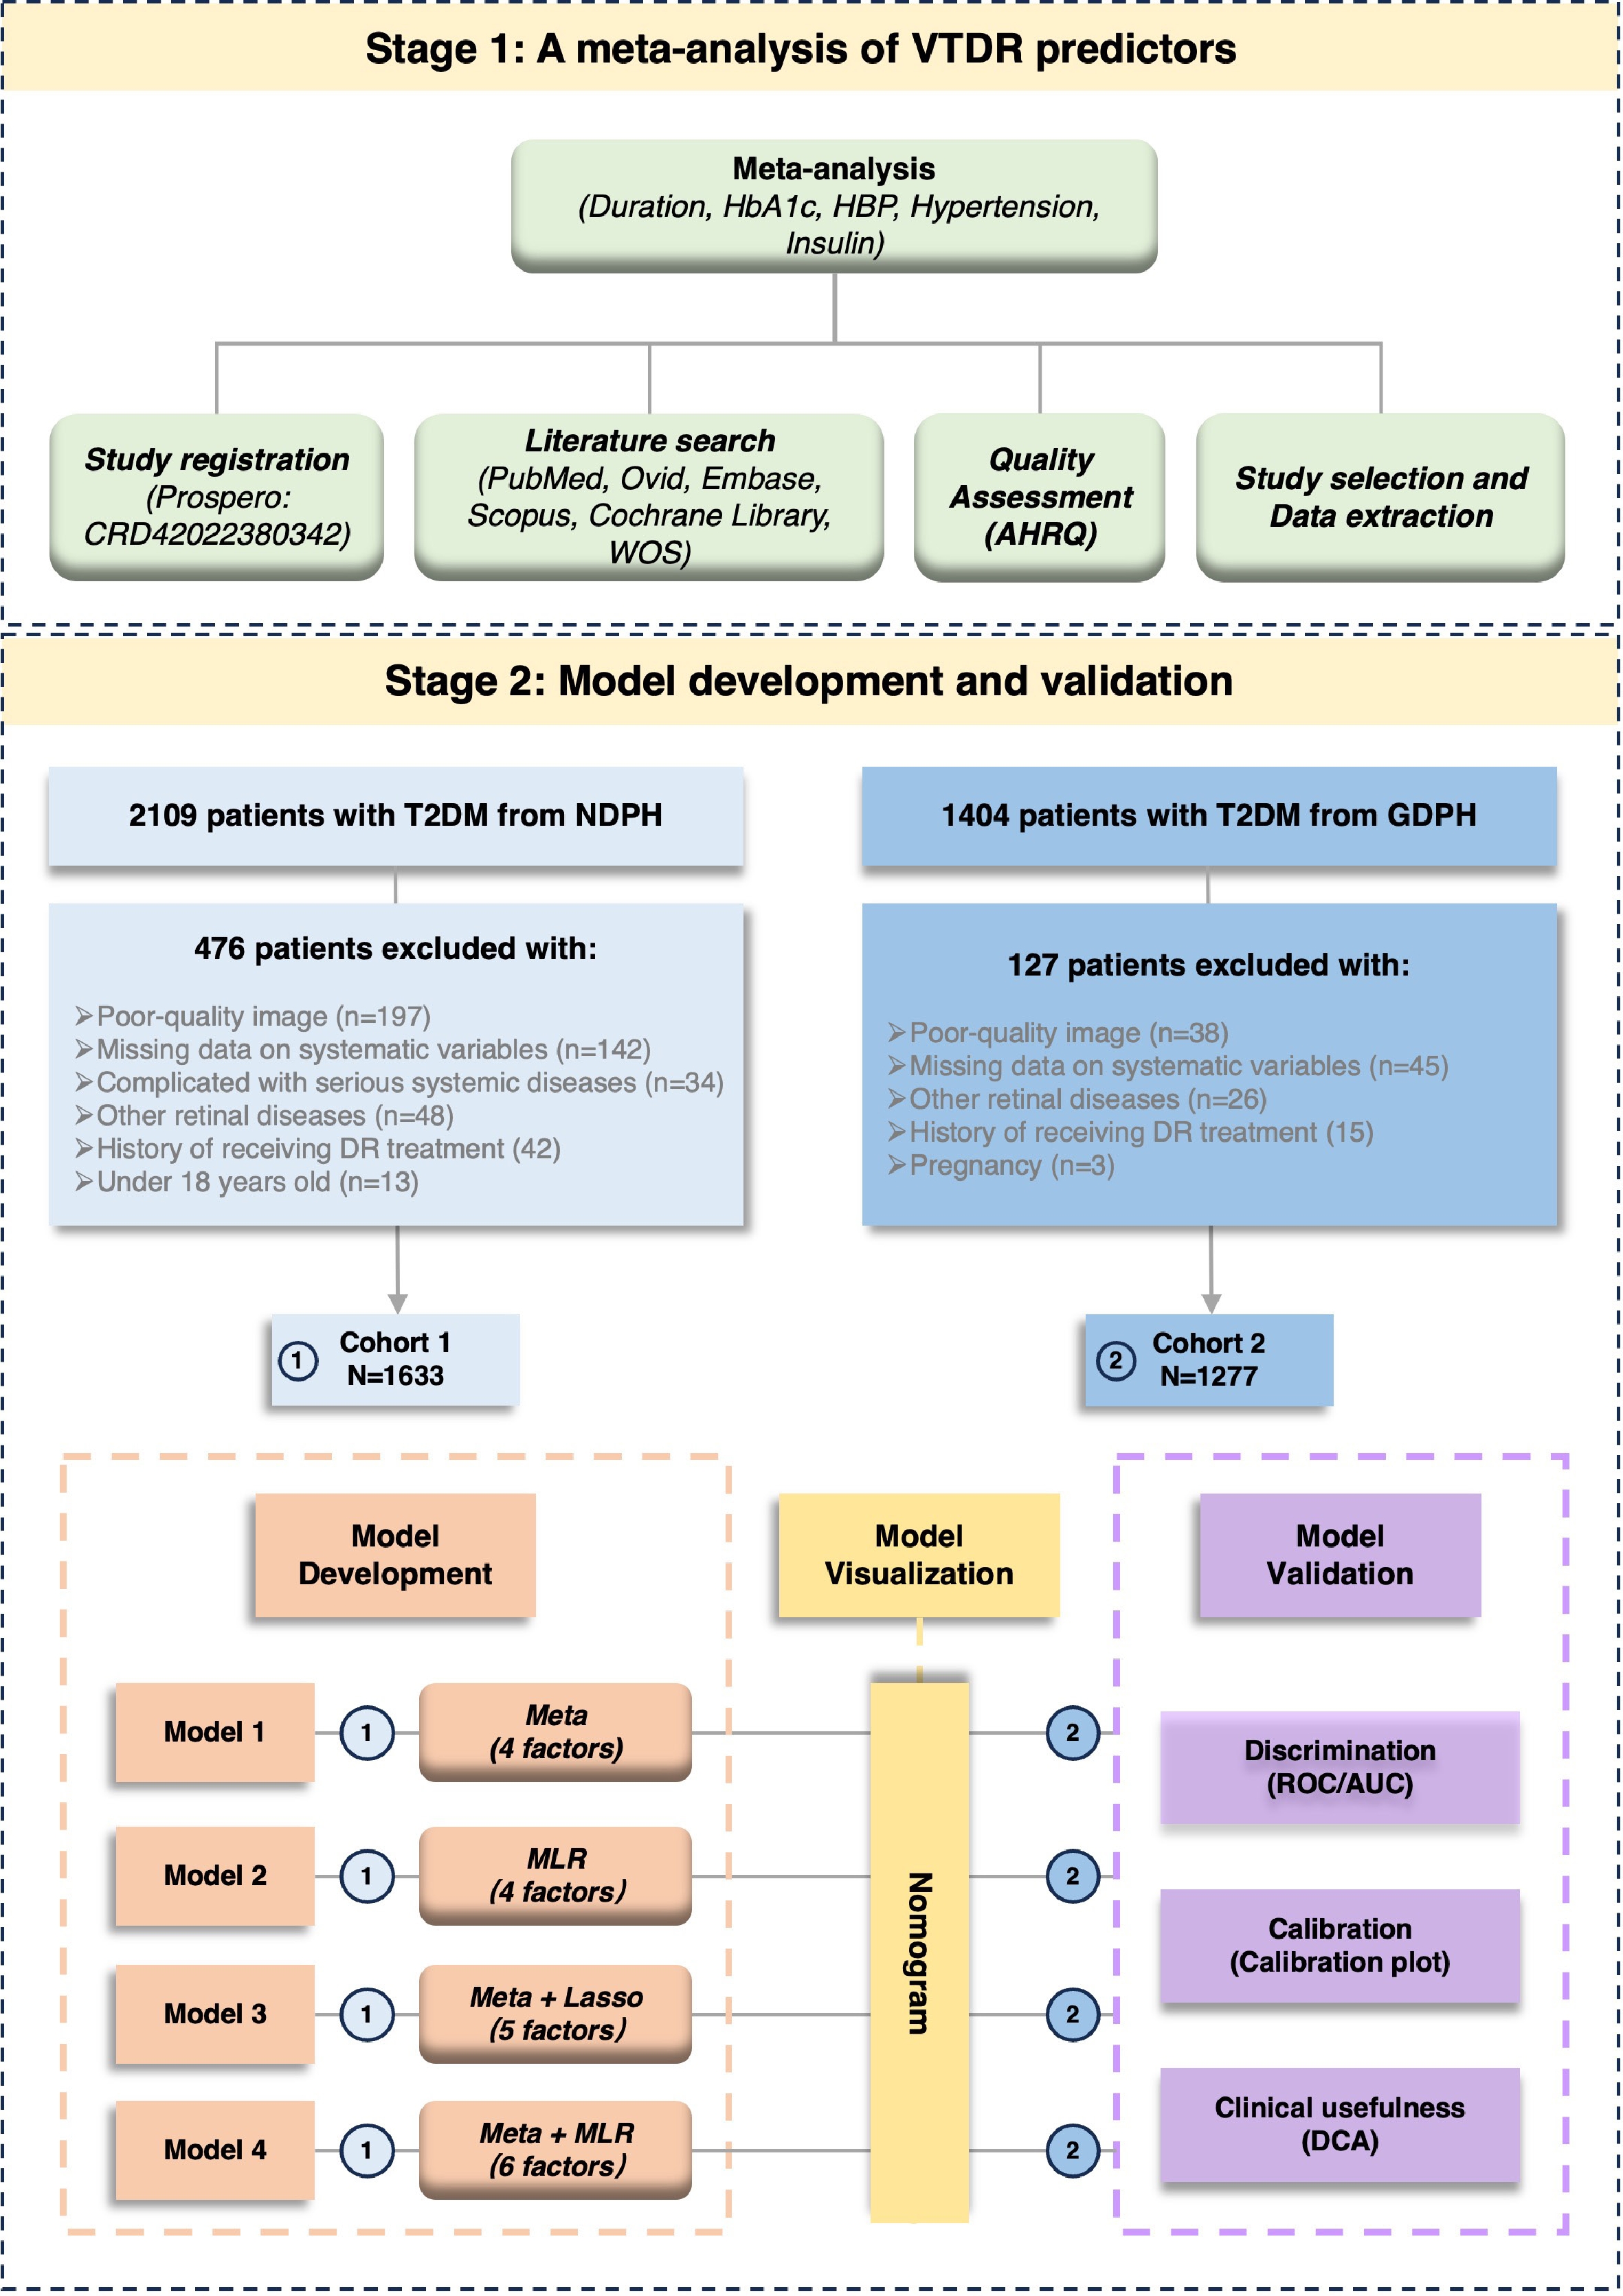
Figure 2.
Flowchart to show the development and validation of the VTDR prediction models. Abbreviations: HBP, hypertension; NDPH, Nanhai District People's Hospital; GDPH, Guangdong Provincial People's Hospital; MLR, multivariate logistic regression; LASSO, least absolute shrinkage and selection operator; ROC, receiver operating characteristic; AUC, area under the ROC curve; DCA, decision curve analysis.
Meta-analysis of VTDR predictors
-
This review was conducted in accordance with the Preferred Reporting Items for Systematic Review and Meta-analysis (PRISMA) criteria[18]. This study was registered on PROSPERO with the unique identifier CRD42023488736.
For literature searching and study selection, six major electronic databases, including PubMed, Ovid, Embase, Scopus, Cochrane Library, and Web of Science, were searched from inception until April 2024 for studies on VTDR predictors. All included studies enrolled T2DM patients exclusively, and the populations represented East Asian, South Asian, Southeast Asian, Middle Eastern, African, European, Australian, and North American ethnic groups. The detailed search strategy is shown in Supplementary Table S1. Duplicates, reviews, meta-analyses, animal studies, non-English articles, guidelines, letters, editorials, book chapters, conference abstracts, case reports, and trial protocols were excluded. Titles and abstracts were screened, and full texts of potentially eligible studies were assessed carefully against predefined inclusion and exclusion criteria. The detailed eligibility criteria are shown in Supplementary Table S2.
Study quality was assessed using the Agency for Healthcare Research and Quality (AHRQ) tool[19]. The AHRQ contains 11 items: source of information, inclusion/exclusion criteria, time period for identification, subjects consecutive, evaluators masked, quality assurance assessments, patient exclusions, confounding assessed/controlled, missing data, response rates, and follow-up. There are three options for each AHRQ item: yes, no, or not reported. The response 'yes' received a score of 1, while the responses 'no' and 'not reported' received a score of 0. Total scores of 8–11 indicated high quality, while 4–7 indicated moderate quality. Two researchers (YH L, W M) independently performed literature screening, selection, data extraction, and quality assessment. Discrepancies were resolved through consultation with senior investigators (HH Y, YJ H).
As for data extraction and meta-analysis, a database was created by extracting data, including study design, location, publication year, patient demographics (age, sex), number of patients with T2DM and VTDR, fundus examination results, identified risk factors with their odds ratios (ORs) with 95% confidence intervals (CIs), and other information. The variables reported in more than two studies were included in the meta-analysis. Pooled ORs were calculated using fixed- or random-effects models based on heterogeneity. The heterogeneity between studies was estimated using the Cochrane Q test and I2 statistic. A fixed-effect model was applied if I2 < 50%, while a random-effect model was used for I2 ≥ 50%. When a predictor included both continuous and categorical variables, subgroup analyses were performed according to the type of variable. Statistical significance was set at p < 0.05 (two-tailed). The analyses were conducted using Stata software v15.0 (StataCorp, College Station, TX, USA).
Assembly of development and validation cohorts
-
This was a retrospective multicenter prognostic study. The development cohort was identified from the Metabolic Management Center (MMC) of Nanhai District People's Hospital (NDPH) between January 2018 and April 2023. The external validation cohort was selected from patients in the Department of Endocrinology who underwent ophthalmic consultation at the Department of Ophthalmology, Guangdong Provincial People's Hospital (GDPH) between January 2017 and August 2022. This study was conducted in accordance with the principles of the Declaration of Helsinki and was approved by the Ethics Committees of both participating institutions (Nanhai District People's Hospital: No. 2023266, dated May 01, 2023; Guangdong Provincial People's Hospital: No. KY-H-2022-055-02, dated November 16, 2022). The requirement for informed consent was waived by the ethics committees due to the retrospective nature of the study. The inclusion criteria for the study population were: (1) patients with T2DM who met the 2015 American Diabetes Association (ADA) criteria, age ≥ 18 years[20]; (2) patients who completed the required ophthalmic examinations. The exclusion criteria were: (1) age < 18 years; (2) with poor-quality fundus images; (3) missing systemic variable data; (4) had serious systemic diseases (e.g., immunodeficiency, malignancies); (5) had complicated with other retinal diseases (e.g., age-related macular degeneration, other retinal vascular diseases); (6) history of DR treatments (e.g., anti-vascular endothelial growth factor [VEGF], laser, intraocular surgery); (7) pregnancy; (8) inability to obtain fundus photographs due to nondiagnostic images caused by media opacity (e.g., cataract).
Collection of systemic data
-
Systemic data of the cohorts were extracted and collected from medical records and are shown in Table 1. Basic data included age, sex, diabetes duration, systolic blood pressure (SBP), diastolic blood pressure (DBP), body mass index (BMI), history of cardiovascular disease, hypertension, and hypoglycemic medications. BMI was calculated as weight(kg)/height(m)2. Laboratory tests included: routine blood tests (red blood cells [RBC], hemoglobin [Hb], hematocrit [HCT], white blood cells [WBC], platelet count [PLT]); blood glucose (glycated hemoglobin [HbA1c], fasting blood glucose [FBG], 2-h postprandial blood glucose [2hPBG]); blood lipids (triglycerides [TG], total cholesterol [TC], low-density lipoprotein cholesterol [LDL-C], high-density lipoprotein cholesterol [HDL-C]); renal function (uric acid [UA], serum creatinine [SCr], urine albumin-to-creatinine ratio [UACR], estimated glomerular filtration rate [eGFR]). UACR was staged according to the US National Kidney Foundation guidelines: Stage 1 (normal or low albuminuria with a UACR < 30 mg/g), Stage 2 (microalbuminuria with a UACR of 30–300 mg/g), and Stage 3 (macroalbuminuria with a UACR ≥ 300 mg/g)[21]. eGFR was calculated based on the Chronic Kidney Disease Epidemiology Collaboration (CKD-EPI) creatinine equation[22].
Table 1. Clinical characteristics of the development and validation cohorts.
Variables Development cohort Validation cohort No VTDR (n = 1,559) Yes VTDR (n = 74) p value No VTDR (n = 1,100) Yes VTDR (n = 177) p value Sex (n, %) 0.344 1.000 Male 871 (55.9%) 46 (62.2%) 666 (60.5%) 107 (60.5%) Female 688 (44.1%) 28 (37.8%) 434 (39.5%) 70 (39.5%) Age (years) 57.0 [48.0, 64.5] 56.5 [45.8, 63.8] 0.670 56.0 [48.0, 65.0] 57.0 [50.0, 64.0] 0.647 Diabetes duration (years) 3.33 [0.00, 9.50] 8.62 [1.44, 13.0] < 0.001 5.88 [0.50, 11.4] 10.2 [6.67, 17.0] < 0.001 SBP (mm Hg) 126 [120, 138] 132 [121, 145] 0.021 129 [117, 141] 141 [125, 153] < 0.001 DBP (mm Hg) 78 [72.0, 83] 79 [72, 86] 0.066 76 [68, 84] 78 [71, 87] 0.004 FBG (mmol/L) 8.01 [6.24, 10.70] 9.47 [7.02, 12.60] 0.009 7.44 [5.81, 9.45] 8.17 [5.95, 10.7] 0.063 PG-2h (mmol/L) 14.5 [11.4, 18.0] 14.4 [10.7, 17.0] 0.529 12.2 [8.93, 15.4] 11.0 [8.52, 15.5] 0.106 Scr (μmol/L) 65.0 [53.0, 79.0] 66.5 [57.2, 106] 0.028 70.6 [57.8, 84.6] 81.0 [65.4, 123] < 0.001 eGFR (mL/min/1.73 m2) 101 [77.9, 130] 87.4 [67.5, 110] 0.009 96.5 [78.3, 108] 83.6 [52.5, 100] < 0.001 UA (μmol/L) 368 [298, 452] 402 [342, 481] 0.006 365 [296, 434] 387 [326, 467] 0.001 TG (mmol/L) 1.63 [1.06, 2.65] 1.54 [1.06, 2.58] 0.65 1.54 [1.09, 2.26] 1.41 [0.97, 2.31] 0.223 TC (mmol/L) 4.99 [4.20, 5.80] 4.80 [4.17, 5.81] 0.646 4.89 [4.06, 5.70] 5.00 [4.20, 6.30] 0.008 HDLc (mmol/L) 1.23 [1.05, 1.46] 1.23 [1.02, 1.51] 0.895 0.99 [0.85, 1.15] 1.02 [0.88, 1.28] 0.05 LDLc (mmol/L) 2.75 [2.06, 3.46] 2.74 [1.99, 3.42] 0.749 3.20 [2.59, 3.81] 3.40 [2.75, 4.18] 0.022 RBC (1012/L) 4.76 [4.38, 5.23] 4.54 [4.21, 4.91] 0.002 4.66 [4.27, 5.04] 4.29 [3.86, 4.75] < 0.001 WBC (109/L) 7.16 [5.97, 8.49] 7.46 [6.53, 8.85] 0.052 7.05 [5.92, 8.38] 7.47 [6.17, 8.71] 0.064 PLT (109/L) 247 [208, 290] 242 [206, 297] 0.949 236 [197, 281] 232 [185, 301] 0.721 HCT (%) 41.7 [38.6, 44.9] 39.3 [35.9, 42.8] < 0.001 40.6 [38.0, 43.0] 36.0 [32.0, 41.0] < 0.001 Hb (g/L) 138 [126, 150] 131 [118, 145] < 0.001 136 [126, 147] 122 [109, 137] < 0.001 HbA1c (%) 8.80 [6.90, 11.3] 10.80 [8.83, 12.20] < 0.001 9.50 [7.70, 11.3] 9.80 [8.20, 11.5] 0.03 UACR (mg/g) < 0.001 < 0.001 < 30 1,193 (76.5%) 25 (33.8%) 834 (75.8%) 61 (34.5%) 30−300 309 (19.8%) 23 (31.1%) 190 (17.3%) 44 (24.9%) ≥ 300 57 (3.66%) 26 (35.1%) 76 (6.91%) 72 (40.7%) BMI (kg/m2) 0.254 0.126 < 24 629 (40.3%) 37 (50.0%) 448 (40.7%) 85 (48.0%) 24−28 618 (39.6%) 25 (33.8%) 443 (40.3%) 67 (37.9%) ≥ 28 312 (20.0%) 12 (16.2%) 209 (19.0%) 25 (14.1%) CVD 0.269 0.955 No 1,482 (95.1%) 68 (91.9%) 958 (87.1%) 155 (87.6%) Yes 77 (4.94%) 6 (8.11%) 142 (12.9%) 22 (12.4%) Hypertension 0.972 < 0.001 No 976 (62.6%) 47 (63.5%) 647 (58.8%) 77 (43.5%) Yes 583 (37.4%) 27 (36.5%) 453 (41.2%) 100 (56.5%) Hypoglycemic therapy < 0.001 < 0.001 No 76 (4.87%) 1 (1.35%) 351 (31.9%) 24 (13.6%) Oral drugs 943 (60.5%) 22 (29.7%) 421 (38.3%) 77 (43.5%) Insulin 79 (5.07%) 4 (5.41%) 71 (6.45%) 17 (9.60%) Oral drugs and insulin 461 (29.6%) 47 (63.5%) 257 (23.4%) 59 (33.3%) Continuous variables are presented as median [interquartile range], and categorical variables as frequency (percentage). p-values < 0.05 were considered statistically significant, indicating a significant difference between the No-VTDR and Yes-VTDR groups. Bold values represent key outcome-related indicators. Ophthalmic examinations and diagnosis of VTDR
-
All participants underwent a comprehensive ophthalmic examination, including best-corrected visual acuity (BCVA, logMAR), autorefraction, intraocular pressure measurement, slit-lamp examination, and fundus photography (non-mydriatic 45° retinal camera; Topcon TRC, Tokyo, Japan). DR was graded by two skilled ophthalmologists (YH L, W M), with discrepancies adjudicated by a retinal specialist (YJ H). VTDR was defined as the presence of severe non-proliferative DR (NPDR), proliferative DR (PDR), and/or diabetic macular edema (DME) according to the International Clinical Diabetic Retinopathy Disease Severity Scale of the American Academy of Ophthalmology (AAO)[23]. For patients with unilateral gradable images, the final diagnosis was determined by the gradable eye and images. For bilateral gradable eyes and images, the final diagnosis was determined by the eye with the more severe DR stage.
Model development and external validation
-
Model 1 was constructed using predictors with statistically significant pooled ORs from the meta-analysis. In the development of Model 2, variables significantly associated with VTDR with p < 0.10 in univariate logistic regression (ULR) were entered into a multivariable logistic regression (MLR) model. This relatively liberal threshold was chosen, as recommended in standard epidemiological methodology, to avoid prematurely excluding variables that might exhibit confounding effects or become statistically significant only after adjustment for other covariates in the multivariable context[24]. Predictors with p < 0.05 in the final MLR model were used to build Model 2. As for Model 3, the least absolute shrinkage and selection operator (LASSO) regression was applied to the development cohort to select the optimal features, and Model 3 was developed by combining the LASSO-selected variables and meta-analysis significant predictors. Model 4 is the combination of variables from the significant predictors from both the meta-analysis and the MLR model. All models were visualized as nomograms. Since the outcome was the presence of VTDR at baseline, model discrimination was evaluated using the area under the receiver operating characteristic curve (AUC). Performance was externally validated by assessing discrimination (AUC), calibration (calibration plot), and clinical usefulness (DCA).
Statistical analysis
-
Statistical analyses were conducted using R software (v4.4.0). Baseline characteristics of the development and validation cohorts were summarized using the 'compareGroups' package; p < 0.05 was considered statistically significant. Models were established and evaluated using different packages. The 'glmnet' package was used for the feature selection process in LASSO regression. The 'rms' package was used for logistic regression, nomograms, and calibration. The 'pROC' package was used for ROC curve plotting and AUC calculation. The Delong test was utilized for AUC comparison. The 'ResourceSelection' package was used for the Hosmer–Lemeshow test. The 'rmda' package was used for DCA. The 'car' package was used for calculating the variance inflation factors (VIFs) of the variables.
-
A total of 2,169 articles were identified after the initial search of the six databases. After screening, 29 studies met the inclusion criteria. A flowchart of the study selection process is shown in Supplementary Fig. S1. The characteristics of all the studies are shown in Supplementary Table S3. After quality assessment, four studies with AHRQ scores < 5 were excluded from the meta-analysis. The details of the AHRQ scores were displayed in Supplementary Table S4.
In the meta-analysis, eleven predictors reported in ≥ 2 studies were analyzed, including age, sex, diabetes duration, HbA1c, BMI, hypertension, SBP, DBP, diabetes treatment, high-sensitivity reactive protein (Hs-CRP), and C-reactive protein (CRP) (Supplementary Table S5). Five of the eleven predictors were found to be significantly associated with VTDR (p < 0.05) and were analyzed in the meta-analysis, including diabetes duration, HbA1c, hypertension, SBP, and diabetes treatment (Supplementary Table S6).
Characteristics of the development and validation cohorts
-
The characteristics of the development and validation cohorts are presented in Table 1. For model development cohort, a total of 2,109 patients with T2DM were selected from NDPH, among which 1,633 patients were eligible for model development after excluding patients with poor-quality images (n = 197), missing data on systematic variables (n = 142), complicated with serious systemic diseases (n = 48), with other retinal diseases (n = 48), history of receiving DR treatment (n = 42), and age < 18 years (n = 13) (Fig. 2). Seventy-four (4.53%) of the 1,633 patients with T2DM were diagnosed as VTDR. The VTDR group had significantly longer diabetes duration, higher SBP, higher HbA1c, higher UACR stage, and greater use of oral and insulin therapy, but lower RBC, HCT, and Hb levels (all p < 0.05) (Table 1).
For model validation cohort, a total of 1,404 patients with T2DM were selected from GDPH, among which 1,277 patients were eligible for model validation after patients exclusion due to poor-quality image (n = 38), missing data on systematic variables (n = 45), with other retinal diseases (n = 26), history of receiving DR treatment (n = 15), and pregnancy (n = 3) (Fig. 2). One hundred and seventy-seven (13.86%) of the 1,277 patients with T2DM were diagnosed as VTDR. The VTDR group had significantly longer diabetes duration, higher SBP, DBP, FBG, SCr, UA, TC, LDL-C, higher UACR stage, higher hypertension prevalence, and greater use of oral and insulin therapy, but lower eGFR, RBC, HCT, and Hb levels (all p < 0.05) (Table 1).
The notable disparity in VTDR prevalence between the development cohort (4.53%) and the validation cohort (13.86%) reflects their distinct clinical settings. The development cohort was selected from the hospital-based MMC, which predominantly serves patients with early-stage T2DM undergoing routine metabolic surveillance, and thus exhibited a lower VTDR prevalence. In contrast, the validation cohort was selected from the Department of Endocrinology at a tertiary referral hospital, comprising patients who received ophthalmology consultation, thereby enriching for more complex cases with a higher prevalence of advanced retinal complications.
Model development and visualization
-
In Model 1, four of the five predictors that were derived from the meta-analysis and significantly associated with VTDR were involved, including diabetes duration, HbA1c, SBP, and diabetes treatment. Hypertension was excluded in favor of the continuous variable SBP, considering they both reflect the blood pressure level, and SBP is a timely indicator of the state at that time.
In Model 2, 12 variables with statistical significance were identified in the ULR analysis, including diabetes duration, SBP, DBP, diabetes treatment, RBC, Hb, HCT, FBG, HbA1c, UA, eGFR, and UACR stage (p < 0.10) (Table 2). These variables were then analyzed using MLR analysis, and variables reported to be statistically significant were used for the development of Model 2 (p < 0.05), including diabetes duration, HCT, HbA1c, and UACR stage.
Table 2. Univariate and multivariable logistic regression analyses for risk of VTDR in the development cohort.
Variables Univariate analysis Multivariate analysis OR (95% CI) p value OR (95% CI) p value Sex (n, %) Male Reference Female 0.77 (0.48–1.25) 0.291 Age (years) 1.00 (0.98–1.02) 0.642 Diabetes duration (years) 1.07 (1.04–1.10) < 0.001 1.04 (1.00–1.08) 0.051# SBP (mm Hg) 1.03 (1.01–1.04) < 0.001 1.02 (1.00–1.03) 0.091# DBP (mm Hg) 1.03 (1.00–1.05) 0.042 FBG (mmol/L) 1.04 (0.99–1.08) 0.103 PG-2h (mmol/L) 0.98 (0.93–1.03) 0.392 Scr (μmol/L) 1.00 (1.00–1.00) 0.233 eGFR (mL/min/1.73 m2) 0.99 (0.99–1.00) 0.042 1.01 (1.00–1.01) 0.072# UA (μmol/L) 1.00 (1.00–1.00) 0.030 1.00 (1.00–1.00) 0.091# TG (mmol/L) 0.96 (0.87–1.07) 0.492 TC (mmol/L) 1.01 (0.85–1.21) 0.890 HDLc (mmol/L) 0.96 (0.58–1.61) 0.880 LDLc (mmol/L) 1.03 (0.84–1.26) 0.790 RBC (1012/L) 0.57 (0.40–0.82) < 0.001 WBC (109/L) 1.00 (0.98–1.02) 0.942 PLT (109/L) 1.00 (1.00–1.00) 0.673 HCT (%) 0.90 (0.86–0.94) < 0.001 0.94 (0.89–0.99) 0.020#, * Hb (g/L) 0.98 (0.97–0.99) < 0.001 HbA1c (%) 1.16 (1.07–1.26) < 0.001 1.16 (1.05–1.28) < 0.001#, * BMI (kg/m²) 0.98 (0.92–1.04) 0.542 UACR (mg/g) < 30 30−300 3.55 (1.99–6.34) < 0.001 2.81 (1.53–5.15) < 0.001#, * ≥ 300 21.77 (11.83–40.04) < 0.001 11.69 (5.67–24.09) < 0.001#, * CVD No Reference Yes 1.70 (0.71–4.04) 0.231 Hypertension No Reference Yes 0.96 (0.59–1.56) 0.873 Hypoglycemic therapy No Reference Reference Oral drugs 1.77 (0.24–13.32) 0.582 2.59 (0.29–22.88) 0.392 Insulin 3.85 (0.42–35.18) 0.231 3.75 (0.34–40.95) 0.281 Oral drugs and insulin 7.75 (1.06–56.87) 0.043 7.83 (0.92–66.61) 0.062# # represents variables with p < 0.10 in the MRL that were used to construct Model 1, including duration, SBP, eGFR, UA, HCT, HbA1c, UACR, and hypoglycemic therapy. * represents variables with p < 0.05 in the MRL that were used to construct Model 2, including duration, HCT, HbA1c, and UA. Bold values indicate key outcome-related indicators. In Model 3, LASSO regression analysis was used to select predictive variables from those shown in Table 1, and UACR stage was selected as the optimal feature (Supplementary Fig. S2). Hence, UACR stage and four variables selected in Model 1 (diabetes duration, HbA1c, SBP, and diabetes treatment) were combined to develop Model 3.
In Model 4, six variables derived from the meta-analysis and MLR analysis were combined to develop Model 4, including diabetes duration, HCT, HbA1c, UACR stage, SBP, and diabetes treatment. Moreover, nomograms were constructed to visualize all models and are shown in Fig. 3 (Fig. 3a for Model 1; Fig. 3b for Model 2; Fig. 3c for Model 3; Fig. 3d for Model 4).
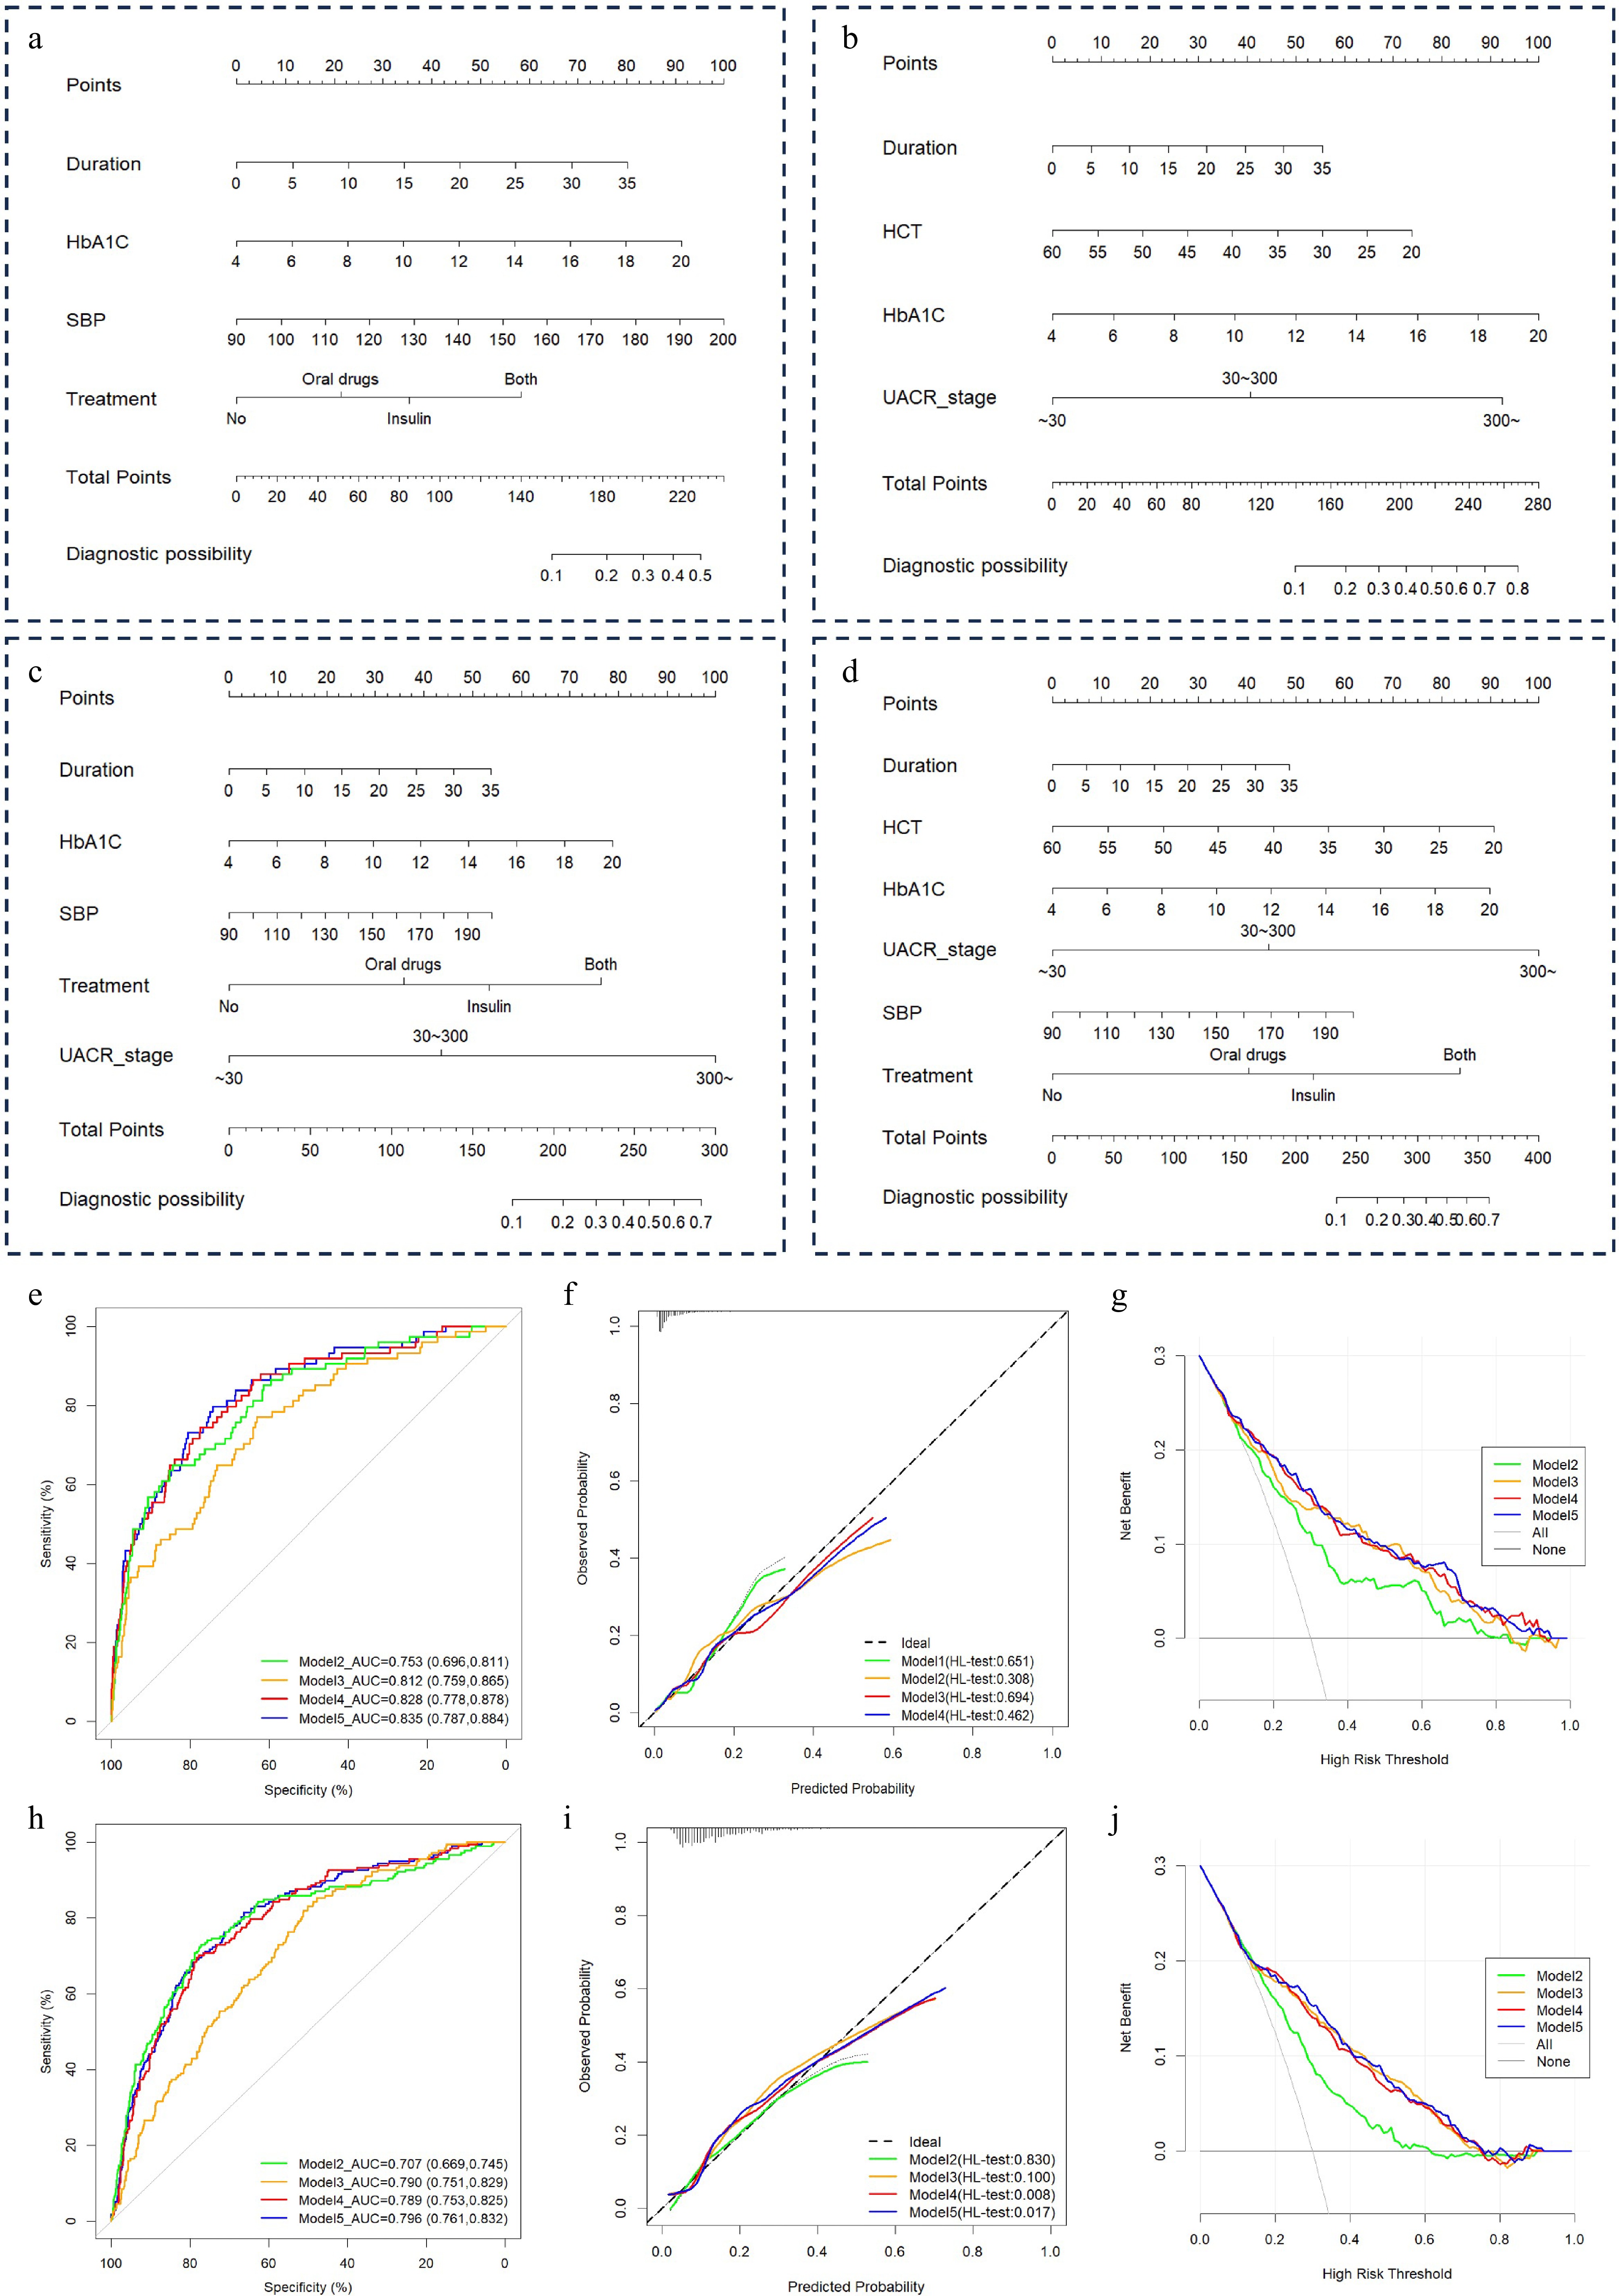
Figure 3.
Nomograms were established to predict VTDR in patients with T2DM. Nomograms of (a) Model 1, (b) Model 2, (c) Model 3, and (d) Model 4 are from the development cohort. 'Points' refers to points for the individual variable and adds to the 'Total points'. 'VTDR risk of T2DM' was calculated according to the 'Total points'. ROC curves of the nomograms of Models 1, 2, 3, and 4 are derived from (e) development and (h) validation cohorts. The x-axis represents the false positive rate of the risk prediction. The y-axis represents the true positive rate of the risk prediction. Calibration curves of the nomograms generated from (f) development and (i) validation cohorts. The ordinate represents the actual probability of VTDR, while the abscissa represents the nomogram-predicted probability of VTDR. The diagonal dashed line means that the predicted probability is equal to the actual probability, and the greater the deviation from the diagonal, the greater the error of prediction. Decision curve analysis for nomograms established in (g) development and (j) validation cohorts. The abscissa shows the threshold probability, while the ordinate shows the net benefit. The gray line represents the assumption of all VTDR-positive cases, and the black line represents the assumption of all VTDR-negative cases.
Validation of the nomograms for VTDR prediction
-
Performance of the nomograms was evaluated via their capabilities in discrimination, calibration, and clinical usefulness.
As for discrimination, AUC was used to evaluate the performance of nomograms in discriminating between VTDR-negative and positive cases (Fig. 3e, h). In the development cohort, AUCs for Model 1, 2, 3, and 4 were 0.753, 0.812, 0.828, and 0.835, respectively (Fig. 3e). In the validation cohort, AUCs for Models 1, 2, 3, and 4 were 0.707, 0.790, 0.789, and 0.796, respectively (Fig. 3h). In both the development and validation cohorts, Model 1 had the lowest AUC. While Model 4 had the highest AUC, the DeLong test revealed no statistically significant AUC differences: in the development cohort, Model 4 versus Model 2 (p = 0.063), Model 4 versus Model 3 (p = 0.226); in the validation cohort, Model 4 versus Model 2 (p = 0.548), Model 4 versus Model 3 (p = 0.050) (Supplementary Table S7). VIFs for all variables in all models were < 2, indicating no significant multicollinearity (Supplementary Table S8).
Calibration curves for the four models are presented for both the development cohort (Fig. 3f) and the validation cohort (Fig. 3i). The Hosmer–Lemeshow test indicated good fit between the predicted and actual probability for Model 1 (p = 0.830) and Model 2 (p = 0.100), but poor fit for Model 3 (p = 0.008) and Model 4 (p = 0.017). These findings showed good calibration of Model 1 and Model 2 and poor calibration of Model 3 and Model 4.
Clinical usefulness of the four nomograms was assessed by DCA. In the development cohort, DCA showed that all four nomograms provided net benefit within a threshold probability range of 0.15–0.80 for VTDR prediction when compared to both the 'treat all' and 'treat none' strategies (Fig. 3g). In the validation cohort, Model 1 provided net benefit within a threshold probability range of 0.15–0.60, while Models 2, 3, and 4 provided greater net benefit than Model 1 at thresholds > 0.6, indicating superior clinical utility for Models 2, 3, and 4 at higher risk probabilities (Fig. 3j).
In summary, Model 2 (MLR model) demonstrated an optimal balance of high discrimination, good calibration, and clinical applicability with the fewest predictors.
-
This multicenter study developed and externally validated four VTDR prediction models. Among them, the MLR-based Model 2, incorporating diabetes duration, HCT, HbA1c, and UACR stage, was identified as the optimal tool due to its robust performance, simplicity, and reliability. The nomogram based on Model 2 enables endocrinologists, primary care physicians, and other non-ophthalmologists to stratify patients with T2DM at high risk for VTDR without specialized ophthalmic equipment. This facilitates a more proactive and efficient healthcare pathway via timely referral to ophthalmologists and allows for intervention on modifiable risk factors like glycemic control (HbA1c) and renal status (UACR), potentially reducing the incidence of VTDR.
Previous studies have largely focused on identifying risk factors related to the development of VTDR[10,11,25]. Few of them have developed prediction models, but they often faced limitations such as small sample sizes, lack of external validation, reliance on complex or inaccessible variables, or suboptimal discriminatory power. For example, a study established a multivariate support vector machine classification model for VTDR prediction using specific adipokines, which were not easily accessible[12]. Another cross-sectional study developed a VTDR screening model in patients with DR but required a specialized electrophysiological device[16]. In a study involving 7,716 diabetic patients, which was a large number of subjects, in constructing a comprehensive VTDR screening model, however, an external validation was not performed[14]. A recent study developed a non-imaging clinical data-based nomogram for VTDR prediction in patients with T2DM using training and testing datasets from the same population without independent external validation, and its reported AUCs of 0.72 and 0.69 indicated moderate discrimination[15]. Compared with these existing tools, our Model 2 offers three distinct advantages: first, it is parsimonious, requiring only four routinely available variables, making it more practical for rapid risk stratification in clinical settings; second, it was rigorously validated in an independent external cohort, addressing the critical lack of external validation in prior studies; and third, all its predictors are derived from routine blood tests and standard clinical assessments that are universally accessible in primary care and community-based settings, without the need for specialized devices or assays. Our study overcomes these limitations by employing a large, multicenter cohort, rigorous external validation, and a model based solely on readily available systemic variables, achieving superior predictive performance (AUC > 0.79).
The inclusion of diabetes duration and HbA1c in our MLR model aligns with the findings of the meta-analysis and the established pathophysiology that these two factors are important risk factors for VTDR. Longer disease duration correlates with cumulative retinal exposure to hyperglycemia, contributing to vascular and neuronal damage[26,27]. While HbA1c reflects long-term glycemic control, suboptimal glucose management is a well-documented driver of DR onset and progression, with intensive blood glucose control proven to slow DR progression[28−30].
Notably, while our meta-analysis did not identify albuminuria or UACR stage as a significant independent predictor of VTDR, which was potentially due to our stringent inclusion criteria (only variables reported in two or more studies were included) and variable reporting across studies (only variables with the same grading or stratification were combined), we cannot conclude that albuminuria or UACR stage was not significant. In fact, two studies included in our meta-analysis showed a higher risk of VTDR with albuminuria[31,32]. Our previous study also found that UACR stage was associated with DME and was the most important factor with the highest weighting in the DME prediction model[33]. This finding, however, should be interpreted with caution and is most likely attributable to the substantial heterogeneity in albuminuria definitions and UACR cut-off thresholds across the included studies rather than a true absence of association. Studies variably reported albuminuria as a continuous variable, used disparate cut-offs for micro- and macroalbuminuria, or employed qualitative proteinuria measurements, which precluded a reliable pooled estimate. In contrast, our large and homogeneous development cohort employed the standardized UACR staging system recommended by the National Kidney Foundation guidelines, which classifies patients into three consistent and well-defined strata that revealed a robust dose–response relationship with VTDR risk. In our study, UACR stage was shown to share the highest weighting in the ULR and MLR models, and our LASSO regression analyses also consistently highlighted its importance as the optimal contributing feature. This underscores not only the clinical significance of renal impairment in VTDR pathogenesis but also the critical advantage of employing standardized, reproducible variable definitions in the construction of generalizable prediction models. The pathophysiological link may involve VEGF upregulation associated with renal impairment, which can increase systemic and retinal vascular permeability, contributing to both albuminuria and PDR or DME[33−35]. Additionally, proteinuria-induced reductions in plasma oncotic pressure may exacerbate fluid retention and DME via the Starling mechanism[36].
A novel finding was the significance of HCT as an important risk factor for VTDR, which had not been identified in any previous literature or in our meta-analysis. In our previous study that developed a model for early detection of DME, HCT was reported as an important risk factor and was involved in the predictive model for DME[33]. HCT reflects the proportion of RBC and is linked to anemia and oxygen-carrying capacity[37]. Prolonged retinal hypoxia due to reduced oxygen delivery is a key driver of microvascular damage and increased permeability during the development of DR[38−40]. Indeed, anemia or low HCT also compromises systemic and retinal oxygen supply, resulting in compensatory upregulation of VEGF, which exacerbates retinal ischemia, vascular leakage, and pathological neovascularization. The Early Treatment Diabetic Retinopathy Study (ETDRS) identified low HCT as an independent risk factor for progression to high-risk proliferative diabetic retinopathy and severe visual loss, providing direct epidemiological evidence linking anemia to advanced DR outcomes[41]. Furthermore, a cross-sectional study in patients with T2DM demonstrated that lower hemoglobin and HCT levels were significantly associated with greater DR severity and the presence of retinal ischemia, with hemoglobin showing an independent inverse association with both DR severity and retinal ischemia[42]. These lines of evidence, derived from diabetic populations, support the contributions of low HCT-induced retinal hypoxia to the development and progression of VTDR via VEGF-mediated mechanisms.
Additionally, lower HCT observed in VTDR may not solely reflect a reduced oxygen-carrying capacity of erythrocytes, causing relative retinal hypoxia. In the context of elevated UACR, it is plausible that low HCT is also a secondary manifestation of diabetic nephropathy. Renal impairment in diabetic kidney disease can impair erythropoietin production, leading to anemia and a further decline in HCT. This renal anemia adds to the retinal hypoxic burden, in which anemia-driven retinal hypoxia upregulates VEGF, a key driver of vascular hyperpermeability and pathological neovascularization in VTDR. This mechanistic link is consistent with the strong independent weighting of UACR in our prediction model and is supported by previous studies that lower Hb concentration is associated with retinal ischemia and increased severity of DR[37]. Further prospective studies and basic research are warranted to elucidate the precise role of HCT in DR and VTDR pathogenesis.
Regarding the calibration performance of our models, we found that although Models 3 and 4 yielded slightly higher AUCs in the development cohort, their calibration performance dropped in the external validation cohort (Hosmer–Lemeshow p = 0.008 and 0.017). This underscores the risk of overfitting when incorporating additional variables such as SBP and hypoglycemic therapy. These variables exhibit substantial heterogeneity across cohorts owing to measurement variability and differing treatment, which can compromise model calibration in new populations. By contrast, Model 2 retained only four stable, clinically independent predictors that are objectively measurable and consistently documented, thereby maintaining excellent calibration (p = 0.100), robust discrimination, and superior generalizability across cohorts. Moreover, DeLong tests confirmed no statistically significant difference between the AUCs of Models 2, 3, and 4, reinforcing that Model 2 achieves the optimal balance between predictive performance and external generalization, being more practical in real-world applications.
Our study has several strengths. First, a meta-analysis of VTDR predictors was conducted before model development, which provided a comprehensive evidence base for predictor selection. Second, large, multicenter cohorts were used with rigorous external validation in our study. Despite the disparity in VTDR prevalence between the development (4.53%) and validation (13.86%) cohorts, our model maintained robust discrimination and good calibration in the external validation cohort, confirming its stability and generalizability across heterogeneous clinical populations. Third, multi-methods were utilized for model development (meta-analysis, MLR, and LASSO analyses), and multi-faceted validation (discrimination, calibration, clinical usefulness) was performed in our study, which was more comprehensive and multidimensional compared to previous studies. Fourth, our preferred model (Model 2) incorporated only four easily accessible variables and was visualized via a user-friendly nomogram, enhancing applicability and generalizability in a real-world setting. Moreover, our model achieved a superior discrimination performance compared to several previous models. These advantages overall make our study and model preferable. However, our study also has limitations. The model, while externally validated, has not yet been prospectively tested in a real-world implementation study. This model was developed and validated using two Chinese cohorts, representing an East Asian population, and validation in other ethnic groups is warranted. Its performance across diverse ethnic populations and healthcare settings also requires further confirmation. Future research should focus on such pragmatic trials and explore the integration of this nomogram into electronic health records to automate risk assessment and referral.
-
In conclusion, we have developed and validated a simple, practical, and effective nomogram for the early detection of VTDR in patients with T2DM. By empowering non-ophthalmic healthcare providers with a reliable risk stratification tool, this model holds significant promise to transform community-based diabetes care. It enables the prioritization of ophthalmological resources towards those high-risk individuals, paving the way for earlier intervention and a tangible reduction in the burden of preventable blindness.
-
This retrospective study was conducted in accordance with the principles of the Declaration of Helsinki. The study protocol was approved by the Ethics Committee of Nanhai District People's Hospital (Approval No. 2023266, approval date: 2023-05-01) and the Ethics Committee of the Guangdong Provincial People's Hospital (Approval No. KY-H-2022-055-02, approval date: 2022-11-16). The requirement for informed consent was waived by the ethics committees due to the retrospective nature of the study.
-
The authors confirm their contributions to the paper as follows: conceptualization: Liang Y, Yu H, Hu Y; methodology: Liang Y, Zheng C, Mei W; formal analysis and investigation: Liang Y; writing − original draft preparation: Liang Y, Zheng C; writing − review and editing: Yu H, Hu Y; funding acquisition: Yu H; resources: Liang Y, Huang G, Mei W, Liang C, Li N; supervision: Yu H, Hu Y. All authors commented on previous versions of the manuscript. All authors read and approved the final manuscript. Prof. Yijun Hu and Prof. Honghua Yu are the guarantors of this work and, as such, had full access to all the data in the study and take responsibility for the integrity of the data and the accuracy of the data analysis.
-
All data generated or analyzed during this study are included in this published article and its supplementary information files.
-
The authors declare that there are no conflicts of interest.
-
accompanies this paper online at: https://doi.org/10.48130/vns-0026-0036.
-
# Authors contributed equally: Yanhua Liang, Chunwen Zheng
- Supplementary Table S1 Literature search strategy.
- Supplementary Table S2 Eligibility criteria.
- Supplementary Table S3 Baseline characteristics of the 29 studies after study screening.
- Supplementary Table S4 Agency for Healthcare Research and Quality (AHRQ) of the 29 cross-sectional studies.
- Supplementary Table S5 Eleven predictors included in the systematic review and meta-analysis.
- Supplementary Table S6 Pooled RRs of the 11 predictors.
- Supplementary Table S7 The AUC of nomograms of three models for predicting VTDR.
- Supplementary Table S8 The GVIF of variables in Models 1-4.
- Supplementary Fig. S1 Flowchart of study selection for predictors of VTDR in patients with T2DM.
- Supplementary Fig. S2 Variable selection used the LASSO regression model in the development group.
- Copyright: © 2026 by the author(s). Published by Maximum Academic Press, Fayetteville, GA. This article is an open access article distributed under Creative Commons Attribution License (CC BY 4.0), visit https://creativecommons.org/licenses/by/4.0/.
-
About this article
Cite this article
Liang Y, Zheng C, Mei W, Huang G, Liang C, et al. 2026. Empowering non-ophthalmic clinicians in risk stratification of vision-threatening diabetic retinopathy in patients with type 2 diabetes mellitus: from routine blood tests to ophthalmology referral. Visual Neuroscience 43: e040 doi: 10.48130/vns-0026-0036 

Empowering non-ophthalmic clinicians in risk stratification of vision-threatening diabetic retinopathy in patients with type 2 diabetes mellitus: from routine blood tests to ophthalmology referral
- Received: 26 February 2026
- Revised: 05 June 2026
- Accepted: 15 June 2026
- Published online: 31 August 2026
Abstract: Early identification of vision-threatening diabetic retinopathy (VTDR) is critical to prevent visual impairment in patients with type 2 diabetes mellitus (T2DM). This multicenter prognostic study first conducted a meta-analysis of published VTDR predictors and subsequently developed and externally validated logistic regression-based nomograms to stratify VTDR risk using readily available systemic variables that can be collected by non-specialists. A meta-analysis of 29 published studies involving diverse populations with T2DM identified candidate predictors. Using a development cohort of 1,633 T2DM patients without baseline VTDR and an independent external validation cohort of 1,277 patients, four nomograms were constructed and evaluated by area under the curve (AUC), calibration plots, and decision curve analysis. The optimal model incorporated four routinely available variables, including diabetes duration, hematocrit (HCT), glycated hemoglobin (HbA1c), and urinary albumin-to-creatinine ratio (UACR) stage, and demonstrated robust discrimination, with an AUC of 0.812 (95% CI, 0.785–0.839) in the development cohort and 0.790 (95% CI, 0.756–0.824) in the validation cohort. Calibration plots showed strong agreement between predicted and observed risk, and decision curve analysis confirmed superior clinical net benefit. The optimal model (Model 2) achieved this predictive performance with only four routinely accessible predictors, highlighting its parsimony and practicality for broad implementation in primary care and resource-limited settings. This evidence-based nomogram, derived from a meta-analysis of 29 studies and rigorously validated in two independent Chinese cohorts, enables reliable VTDR risk stratification using only routine systemic variables. Without requiring specialized ophthalmic examinations, it may assist non-ophthalmic clinicians in identifying high-risk individuals, facilitating timely referral and targeted interventions to reduce preventable vision loss.