


-
Saccharomyces cerevisiae is the main fermenting agent that is primarily responsible for wine alcoholic fermentation[1−3]. This crucial step involves not only the biochemical conversion of sugar into ethanol but also the release of flavor compounds that are attributed to a pleasant organoleptic outcome[2,4]. Whilst alcoholic fermentation is essential and confers desirable flavor benefits to wine, it can be difficult for yeast to initiate and complete, due to the inhibition of abiotic stressors on cell viability and, in turn, fermentation kinetics.
Among the inhibitory stressors, hyperosmotic stress generated by high grape sugar content exerts great influence on yeast, in particular, the slow onset of alcoholic fermentation. Notedly, this problem is becoming progressively more exacerbated, given the trend of rising sugar accumulation in ripe grape berries due to climate warming and increased pursuit of flavor ripeness by consumers[5,6]. Meanwhile, premature sluggish or even stuck fermentation may easily occur when certain levels of ethanol are produced far before the completion of sugar consumption[7]. In addition, yeast growth can also be eliminated by frequently being exposed to SO2. This chemical is often supplemented to grape juice or must before fermentation to suppress the growth of spoilage microbes, thereby reducing the formation of off-flavors that are detrimental to wine equality[8]. The influence of these individual abiotic stressors on the physiological features of yeast has been widely investigated. For example, high sugar (over 240 g/L in grape juice) causes osmotic stress, leading to water loss, cell shrinkage, and death[9,10]. Response of S. cerevisiae to such hyperosmotic stress has been well documented, which involves enhanced intracellular glycerol production guided by the HOG pathway to counter-balance the hyperosmotic pressure, changes in cell cycles, and modulation of transcription and translation efficiency[11]. Not only sugar but its main product, ethanol, also suppresses yeast growth, and such inhibition depends on the severity of the stress level from 4% v/v to 12.5% v/v and above. Under high ethanol stress, yeast cells trigger certain biochemical and physiological reactions, including larger cell sizes, reduced cell wall integrity, increased concentration of reactive oxygen species, alterations in membrane lipid composition, changes in nutrient uptake and the corresponding metabolic pathways, etc.[12−14]. Empirically, SO2 less than 60 mg/L is believed to have a subtle impact on the growth of S. cerevisiae, and some strains can still grow in the presence of hundreds of mg/L SO2. However, reduced growth of several commercial wine yeast was observed with only 50 mg/L SO2, which can be partly a result of compromised energy metabolism[13,15]. Sulfite directly reduces the activity of core enzymes involved in the glycolytic degradation of glucose, which ultimately decreases ATP production to support cell growth[15].
To date, most studies have focused mainly on the response of yeast to a single stressor rather than combined stressors, and yeast viability was strain-specific in most cases. Given the complex matrix of the grape juice or must, investigations into how multi-stressors impact yeast survival are clearly needed. Compared to a single stressor, a combination of abiotic stressors commonly present in the complex wine fermentation matrix can impose even more severe inhibitory impacts on S. cerevisiae growth.
Further to the phenotypic analysis of yeast under abiotic stressors, research focusing on the underlying basis at the gene or protein level has also been conducted. Genome-wide techniques like RNA-seq and proteomics have revealed multiple genes and proteins are involved in the adaptation to single stressors. For example, ethanol toxicity alters genes related to amino acid metabolism and synthesis of trehalose and ergosterol[16]. Soufi et al. found hyperosmotic stress changes Hog1, Ald3, Rad9, and Hos4 proteins, which are crucial for the activation of the HOG pathway, regulation of cell cycle progression, and carbon metabolism[17]. With regard to SO2 stress tolerance, besides Ssu1, which encodes the sulfite efflux pump, key genes required for the sulfate reduction pathway, lysine, and arginine biosynthesis are also involved[18]. Again, those recent advances mainly illustrate mechanisms associated with single-stressor tolerance. Whether these genes/proteins or any yet unidentified ones, play a role in sustaining yeast growth under combined ethanol-hyperosmotic-SO2 stressors still remains poorly understood and thus invites further investigation.
As stated above, tolerance to single stressors of ethanol, SO2, and hyperosmotic stress shares common features of a quantitative trait, which includes the trait being controlled by multiple genes and the phenotype occurring as a continuous range of variation. Thus, this study hypothesizes that tolerance to combinations of these three stressors also belongs to a quantitative trait. Recently, genetic determinism of such traits in S. cerevisiae, such as yeast-bacteria interactions[19], malic acid production[3], consumption[20], and near-freezing temperature tolerance[21] have been successfully revealed by quantitative trait locus (QTL) mapping. The latter one identified a major QTL and selected a quantitative trait gene (QTG) in a rapid manner by genotyping two pools from the F2 segregants showing contrasting phenotypes, known as the BSA (bulked segregant analysis) approach. Compared to the three former ones that used a marker-assisted approach, QTL mapping via the BSA method is simpler and more cost-effective.
This study aimed to investigate the influence of combined ethanol-hyperosmotic-SO2 stressors on S. cerevisiae and identify the genetic basis of the multi-stressor tolerance. First, the growth of 118 Chinese indigenous haploid yeasts under combined stressors was evaluated via tolerance assays. Strains showing opposite tolerance were selected to construct the F1 hybrid and the F2 segregants. The BSA approach was applied to identify major QTLs associated with the multi-stressor tolerance by genotyping two pools of segregants (15 individuals each) with divergent multi-stressor tolerance. Two QTLs containing 20 genes in total were identified on Chromosomes III and XIV. Based on GO-enrichment analysis, seven genes associated with nucleotide binding, methylation, and sterol synthesis were finally selected as potential QTGs. This study expands current knowledge on the genetic basis of yeast tolerance under combined ethanol-hyperosmotic-SO2 stressors.
-
The ten diploid S. cerevisiae strains used in this work were randomly chosen from yeast collections previously isolated from un-inoculated wine fermentations from the main wine regions of China, including Shaanxi, Ningxia, and Xinjiang. The diploid yeasts were further sporulated to allow the generation of 118 haploid S. cerevisiae strains, which were further tested for their tolerance to combined ethanol-hyperosmotic-SO2 stressors. All strains used in this study are listed in Supplementary Table S1.
The cryogenically preserved (−40 °C in 25% glycerol) yeast strains were revived on a YPD agar medium containing 10 g/L yeast extract, 20 g/L peptone, 20 g/L glucose, and 20 g/L agar. Overnight yeast cultures were prepared by individually inoculating single yeast colonies into 50 mL liquid YPD medium and incubated at 28 °C for 24 h with shaking at 120 rpm.
The multi-stressor tolerance assays were performed in filter sterilized (0.22 μm) growth medium (pH 4.0) containing 50 g/L fructose, 20 g/L peptone, and 10 g/L yeast extract and various levels of stressors, which was determined by using an orthogonal test. Analytical reagent grade ethanol, NaCl, and H2SO3 were used to adjust ethanol, hyperosmotic, and SO2 stressors to the indicated levels. McClary medium (2.5 g/L yeast extract, 1.8 g/L KCl, 8.2 g/L CH3COONa, and 20 g/L agar), Kleyn's medium (2.5 g/L peptone, 0.62 g/L NaCl, 5 g/L CH3COONa, and 20 g/L agar), SPM medium (2.5 g/L yeast extract, 10 g/L CH3COOK, 1 g/L KH2PO4, and 20 g/L agar), and ACK medium (10 g/L potassium acetate, 20 g/L agar) was used to evaluate yeast sporulation efficiency. A dose of 200 mg/L G418 was added to YPD for the selection of yeast strains with the KanMX drug-resistant marker.
E. coli strain DH5α was used for amplification of the plasmid pUG6. This strain was grown at 37 °C in Luria-Bertani (LB) medium, which was prepared with 5 g/L yeast extract, 10 g/L tryptone, and 10 g/L NaCl at pH 7.5.
Evaluation of yeast tolerance to combined ethanol-hyperosmotic-SO2 stressors
-
To investigate the impact of combined ethanol-hyperosmotic-SO2 stressors on yeast growth, as well as determine the appropriate levels of stressors for QTL mapping, a three-factor, three-level orthogonal test with eight randomly selected haploid yeast strains was performed. Given the multi-stressor environment and their stronger inhibitory effect on yeast growth compared to any single stressor, levels of stressors for stress tolerance assays need to be adjusted to an appropriate level. Based on previous studies[22−24], and our preliminary experiment, the corresponding levels of each factor in the growth medium were adjusted as follows. Factor A (hyperosmotic stress, expressed as fructose) = 200–300 g/L; Factor B (ethanol) = 6%–10% v/v; Factor C (SO2) = 300–500 mg/L (Supplementary Tables S2 and S3). The tolerance of S. cerevisiae strains to the multiple stressors was examined by the maximum specific growth rate or spot growth on YPD agar plates.
Overnight yeast cultures were inoculated into the growth medium at 1 × 10⁶ cells/mL using 24-deep well plates with 2 mL medium filling in each well. Yeast growth was determined by measuring the optical density of the samples at 600 nm (OD600) every 4 h for 120 h after 30 s pre-shaking. Replicate plates (30 copies) were used to allow sacrificial sampling at the required intervals. All experiments were performed with four biological replicates.
Growth-related parameters were deduced from each treatment by directly fitting OD600 values and time to the reparametrized Gompertz equation[25].
$ \rm y=D \times exp\left\{-exp\left[\dfrac{{\text μ}_{max} \times e}{D}(\lambda -t)+1\right]\right\}$ where, y = ln (ODt / OD0), OD0 is the OD600 value at inoculation whilst ODt is the OD600 value at time t; D = ln (OD∞ / OD0) is the OD600 value reached with OD∞ as the asymptotic maximum, μmax refers to the maximum specific growth rate (h−1), and λ refers to the lag phase period (h).
Construction of the haploid parental strains and the F1 hybrid
-
One copy of the HO gene was disrupted by inserting the KanMX cassette from pUG6 in the potential parent strains[26]. Transformants were preliminarily selected on YPD agar plates containing 200 mg/L G418 and were further verified by PCR[21,27]. The mating type of the haploid strains was confirmed by PCR amplification across the HMR region[28]. The F1 hybrid was constructed by mating the haploid MATα and MATa strains with divergent tolerance to the combined stressors on YPD plates and grown overnight[29]. Actively mating yeasts were isolated using a micromanipulator, and their ploidy was further verified via PCR.
Generation of the F2 segregant population and construction of two pools
-
The diploid hybrid was sporulated, and the spores were collected to allow the generation of the segregant population. After analysis of the maximum growth rate of each spore under combined stressors, two pools, namely the 'high tolerance pool' and the 'low tolerance pool', were obtained by selecting individuals with extreme phenotypes from the segregant population. In specific, the high tolerance pool was composed of superior segregants that were tolerant to combined ethanol-osmotic-SO2 stressors. By contrast, segregants that were sensitive to the multiple stressors were assembled in the low tolerance pool.
Sporulation and spore isolation
-
Sporulation broth was first optimized based on sporulation efficiency. Overnight cultures of a diploid yeast were plated on Kleyn's, SPM, McClary, and ACK medium, respectively, and incubated at 25 °C in a water bath for up to 10 d. Samples were collected on day 3 to determine the sporulation rate, and this was assessed again on day 5, day 7, and day 10. The sporulation rate was evaluated by methylene blue staining and counting the spores under a microscope using a hemocytometer[30]. Four replicate spore counts were performed for each diploid strain.
The high-density spore culture obtained using the optimized sporulation condition was washed twice with sterile de-ionized water. The pellet was first re-suspended in 700 μL Tris-HCl (0.01 mol/L at pH 8.0), followed by being digested using 500 μL cytohelicase (10 mg/mL) for 12 h with shaking at 120 rpm at 37 °C. The suspension was further sonicated for 30 min to improve the release of spores. The spores were then purified by incubation at 58 °C in a water bath for 12 min to kill un-sporulated cells. Next, a ten-fold dilution series (10−1 to 10−5) was made, and 100 μL of culture was spread onto the surface of YPD plates containing 200 mg/L G418, which were incubated at 30 °C for 48 h. Single colonies were passaged in liquid YPD medium for ten generations prior to analyzing of ploidy and mating type using PCR.
Preparation of DNA Samples
-
Extraction of genomic DNAs from the parent strains, as well as the superior and inferior segregants, was performed using the BioFlux Yeast Genomic DNA Extraction Kit (Thermo ScientificTM, USA). The concentration and purity of the DNA samples were measured using a Nanodrop 3000 UV-Vis spectrophotometer (Wilmington, USA). Two DNA pools were made by separately pooling the DNA of superior and inferior segregants in equimolar concentrations. At least 3 μg of the genomic DNA were then provided to Genedenovo Biotechnology Co., Ltd (Guangzhou, China) for whole-genome sequencing using the Illumina HiSeq 4000 platform.
Genome analysis and QTL mapping
-
Paired-end sequence reads of ~150 bp were generated, and low-quality ends of the paired reads were trimmed using TRIMMOMATIC with a quality threshold of 20[31]. The clean reads were then aligned to a reference genome, the S288c genome sequence, using BWA. Once the clean reads were mapped, the alignment files were converted to BAM files with SAMtools software[32].
GATK v3.3-0 software with the default setting was applied to identify single nucleotide polymorphisms (SNPs). QTL analysis was carried out based on the distribution of SNP-index and ∆(SNP-index) over the yeast chromosomes[33]. Both the SNP-index and ∆(SNP-index) were calculated according to Feng et al.[21]. Putative SNPs were selected when their SNP-index values were more than 0.3 in only one of the two pools. SNP-index value less than 0.3 in both pools indicated the SNPs were false, possibly due to sequencing and/or alignment errors. If the Δ(SNP-index) value was high, this implied that a one-sided SNP was preferentially inherited from the stress-tolerant parent. Sliding window analysis was then performed with a 20 Kb window size and 1 Kb increment. The average of Δ(SNP-index) of the putative SNPs located in each window in the genome was calculated and used for the sliding window plot. If the number of SNPs within each window was less than two, the interval was then skipped for QTL analysis. The peak regions above the threshold value (95% confidence interval) were considered as the QTLs relevant to combined ethanol-hyperosmotic-SO2 stress tolerance in yeast. Next, GO and KEGG enrichment analysis were conducted on genes in defined QTLs, and candidate QTGs and potential metabolic pathways responsible for multi-stressor tolerance were finally obtained.
Statistical analysis
-
Data on μmax, SNP index, and Δ(SNP-index) were first processed with Microsoft Excel 2016 and were expressed as mean values with standard deviation. GraphPad Prism 9.0 (GraphPad Software, USA) was used to plot graphs. SPSS 19.0 (IBM, USA) was used to perform statistical analysis, including Student's t-test and one-way ANOVA coupled with Tukey's honest significant difference (HSD) post hoc tests to compare μmax between haploid strains.
-
Spore production was first evaluated using four different broths, including McClary, Kleyn's, SPM, and ACK agar media, and incubated at 25 °C. The spore production rate using the corresponding media is displayed in Table S4. For all tested sporulation media, only a handful of sporulation was observed until incubation for 5 d (< 3%). The spore production rate was higher with a longer incubation period; however, it was still less than 20% even with a 10-day incubation (Supplementary Table S4). Kleyn's agar medium resulted in the highest spore production with rapid sporulation observed between days 5–7 (Fig. 1a). Sporulation was therefore further optimized using liquid Kleyn's medium and incubated at 22 °C with 150 rpm agitation, which induced a sporulation rate of over 50% on day 7 (Supplementary Fig. S1). All ten wild diploid S. cerevisiae strains were sporulated under this condition, and a total number of 118 haploid strains were collected for QTL mapping (Supplementary Table S1).
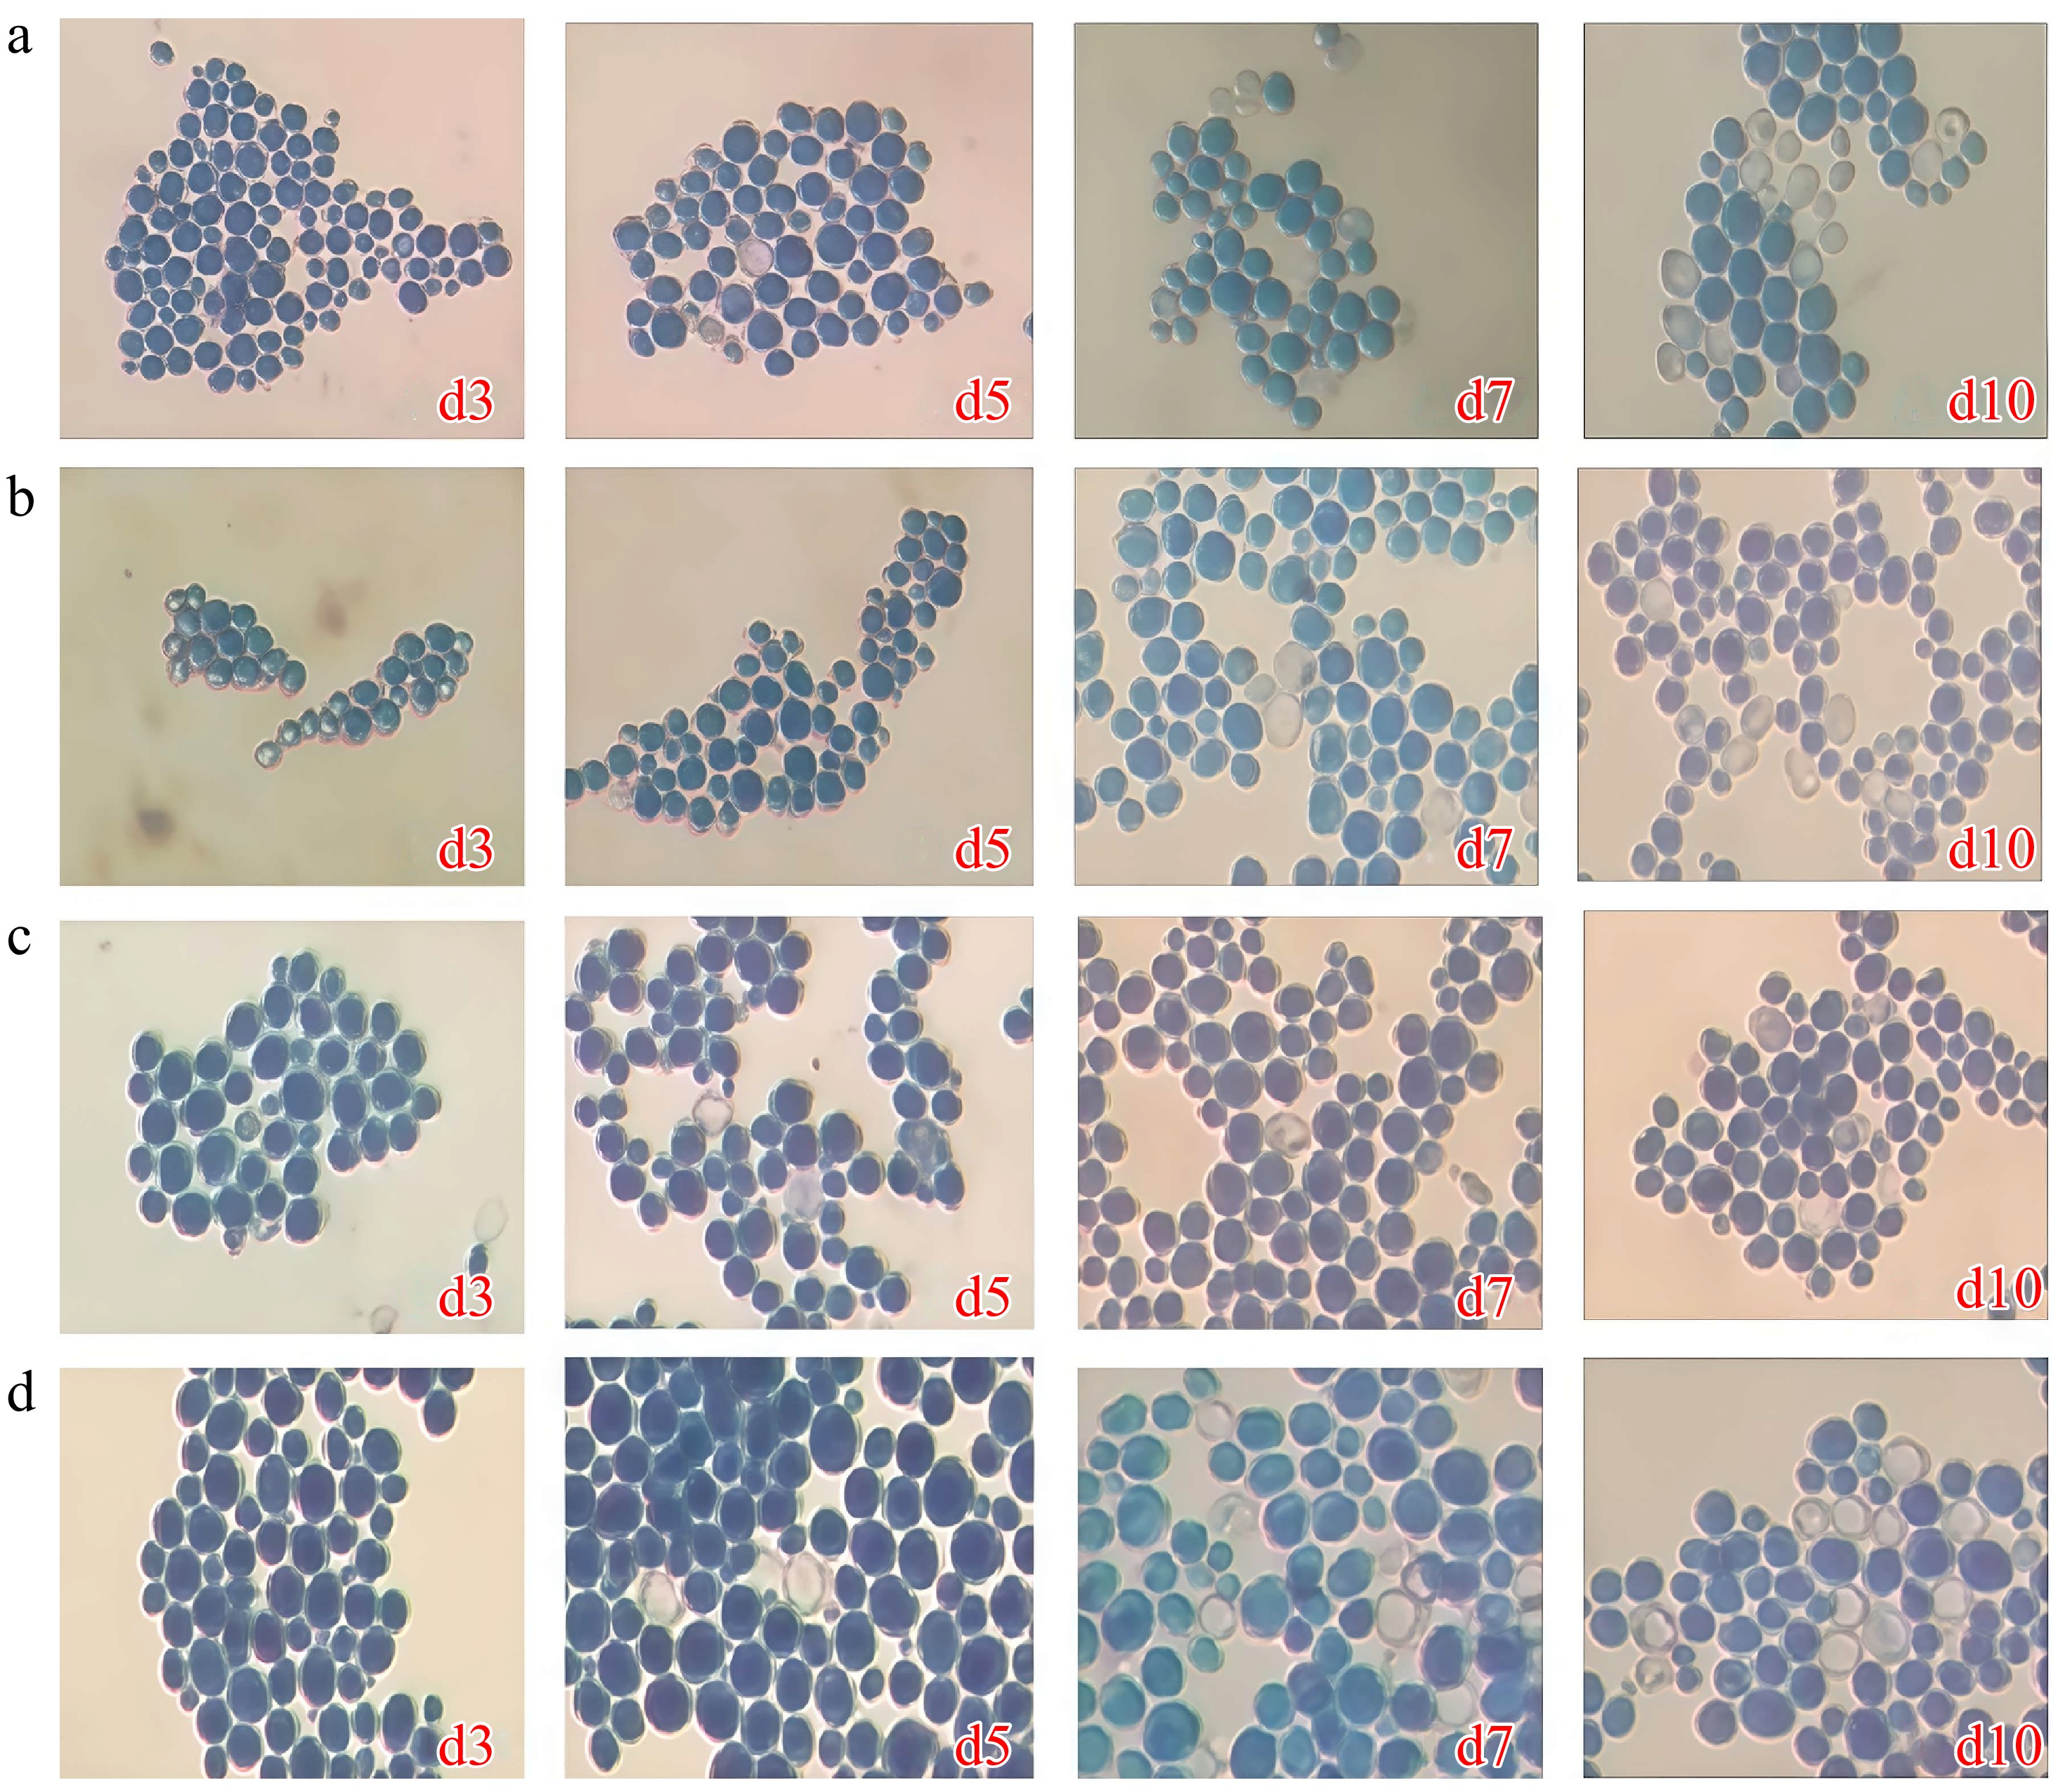
Figure 1.
Microscopic examination of S. cerevisiae 31y3 with methylene blue staining (× 400). (a) Kleyn's medium. (b) McClary medium. (c) SPM medium. (d) ACK medium.
Selection of haploid parental strains for genetic mapping
-
This study explored the impact of combined stressors on yeast growth and determined the levels of the stressors that cause growth inhibition in yeast strains by conducting a three-factor, three-level orthogonal test with eight haploid strains (Supplementary Table S5). Results show that the greatest inhibition was induced by ethanol, followed by osmotic and SO2 stressors (Supplementary Table S6). The highest total variance on the maximum specific growth rate (μmax) was observed in a medium with 6% ethanol, 300 mg/L SO2, 50 g/L fructose, 48.6 g/L NaCl (equivalent to 150 g/L fructose) (Supplementary Table S6), which was therefore taken as the high stressful medium. Compared with the high-stressful medium, the levels of stressors for the low-stress reference were set by a 50% decrease correspondingly.
All haploid S. cerevisiae strains derived from ten diploids from different origins were evaluated for their ability to grow under both high and low-stress conditions. The growth parameter μmax was used to select strains with distinguished growth in high stressful medium whilst having comparable growth performance in low stressful medium. The level of μmax ranged between 0 and 0.046 for all haploids tested in the high-stress medium (Fig. 2a). Strains LFN520-45, 31y10-9, 31y10-30, 31y10-27, 31y3-32 exhibited higher μmax (Fig. 2a) and were assessed again in medium with even higher levels of stressors, including 8% v/v ethanol, 400 mg/L SO2, and osmotic stress equivalent to 250 g/L fructose. Strains 31y10-9 and 31y10-27 showed much better growth compared to the other three strains (Fig. 2d) and were therefore considered as potential superior parent strains. Under high levels of stressors, 75 haploids were preliminarily screened with a lower μmax less than 0.005, and their distribution is shown in Fig. 2b. Among them, strains 112y-46, 112y14-23, 114y1-3, 174y-27, LFN520-42, 31y3-37, 44y7-25, 44y7-12, LFE1504-15, NX9412-4 outcompeted others with much lower μmax (Fig. 2a). When evaluated for growth in low-stress medium, strains 31y3-37 and NX9412-4 were comparable in μmax with the superior strains (Fig. 2c) and were therefore chosen as the inferior strains.
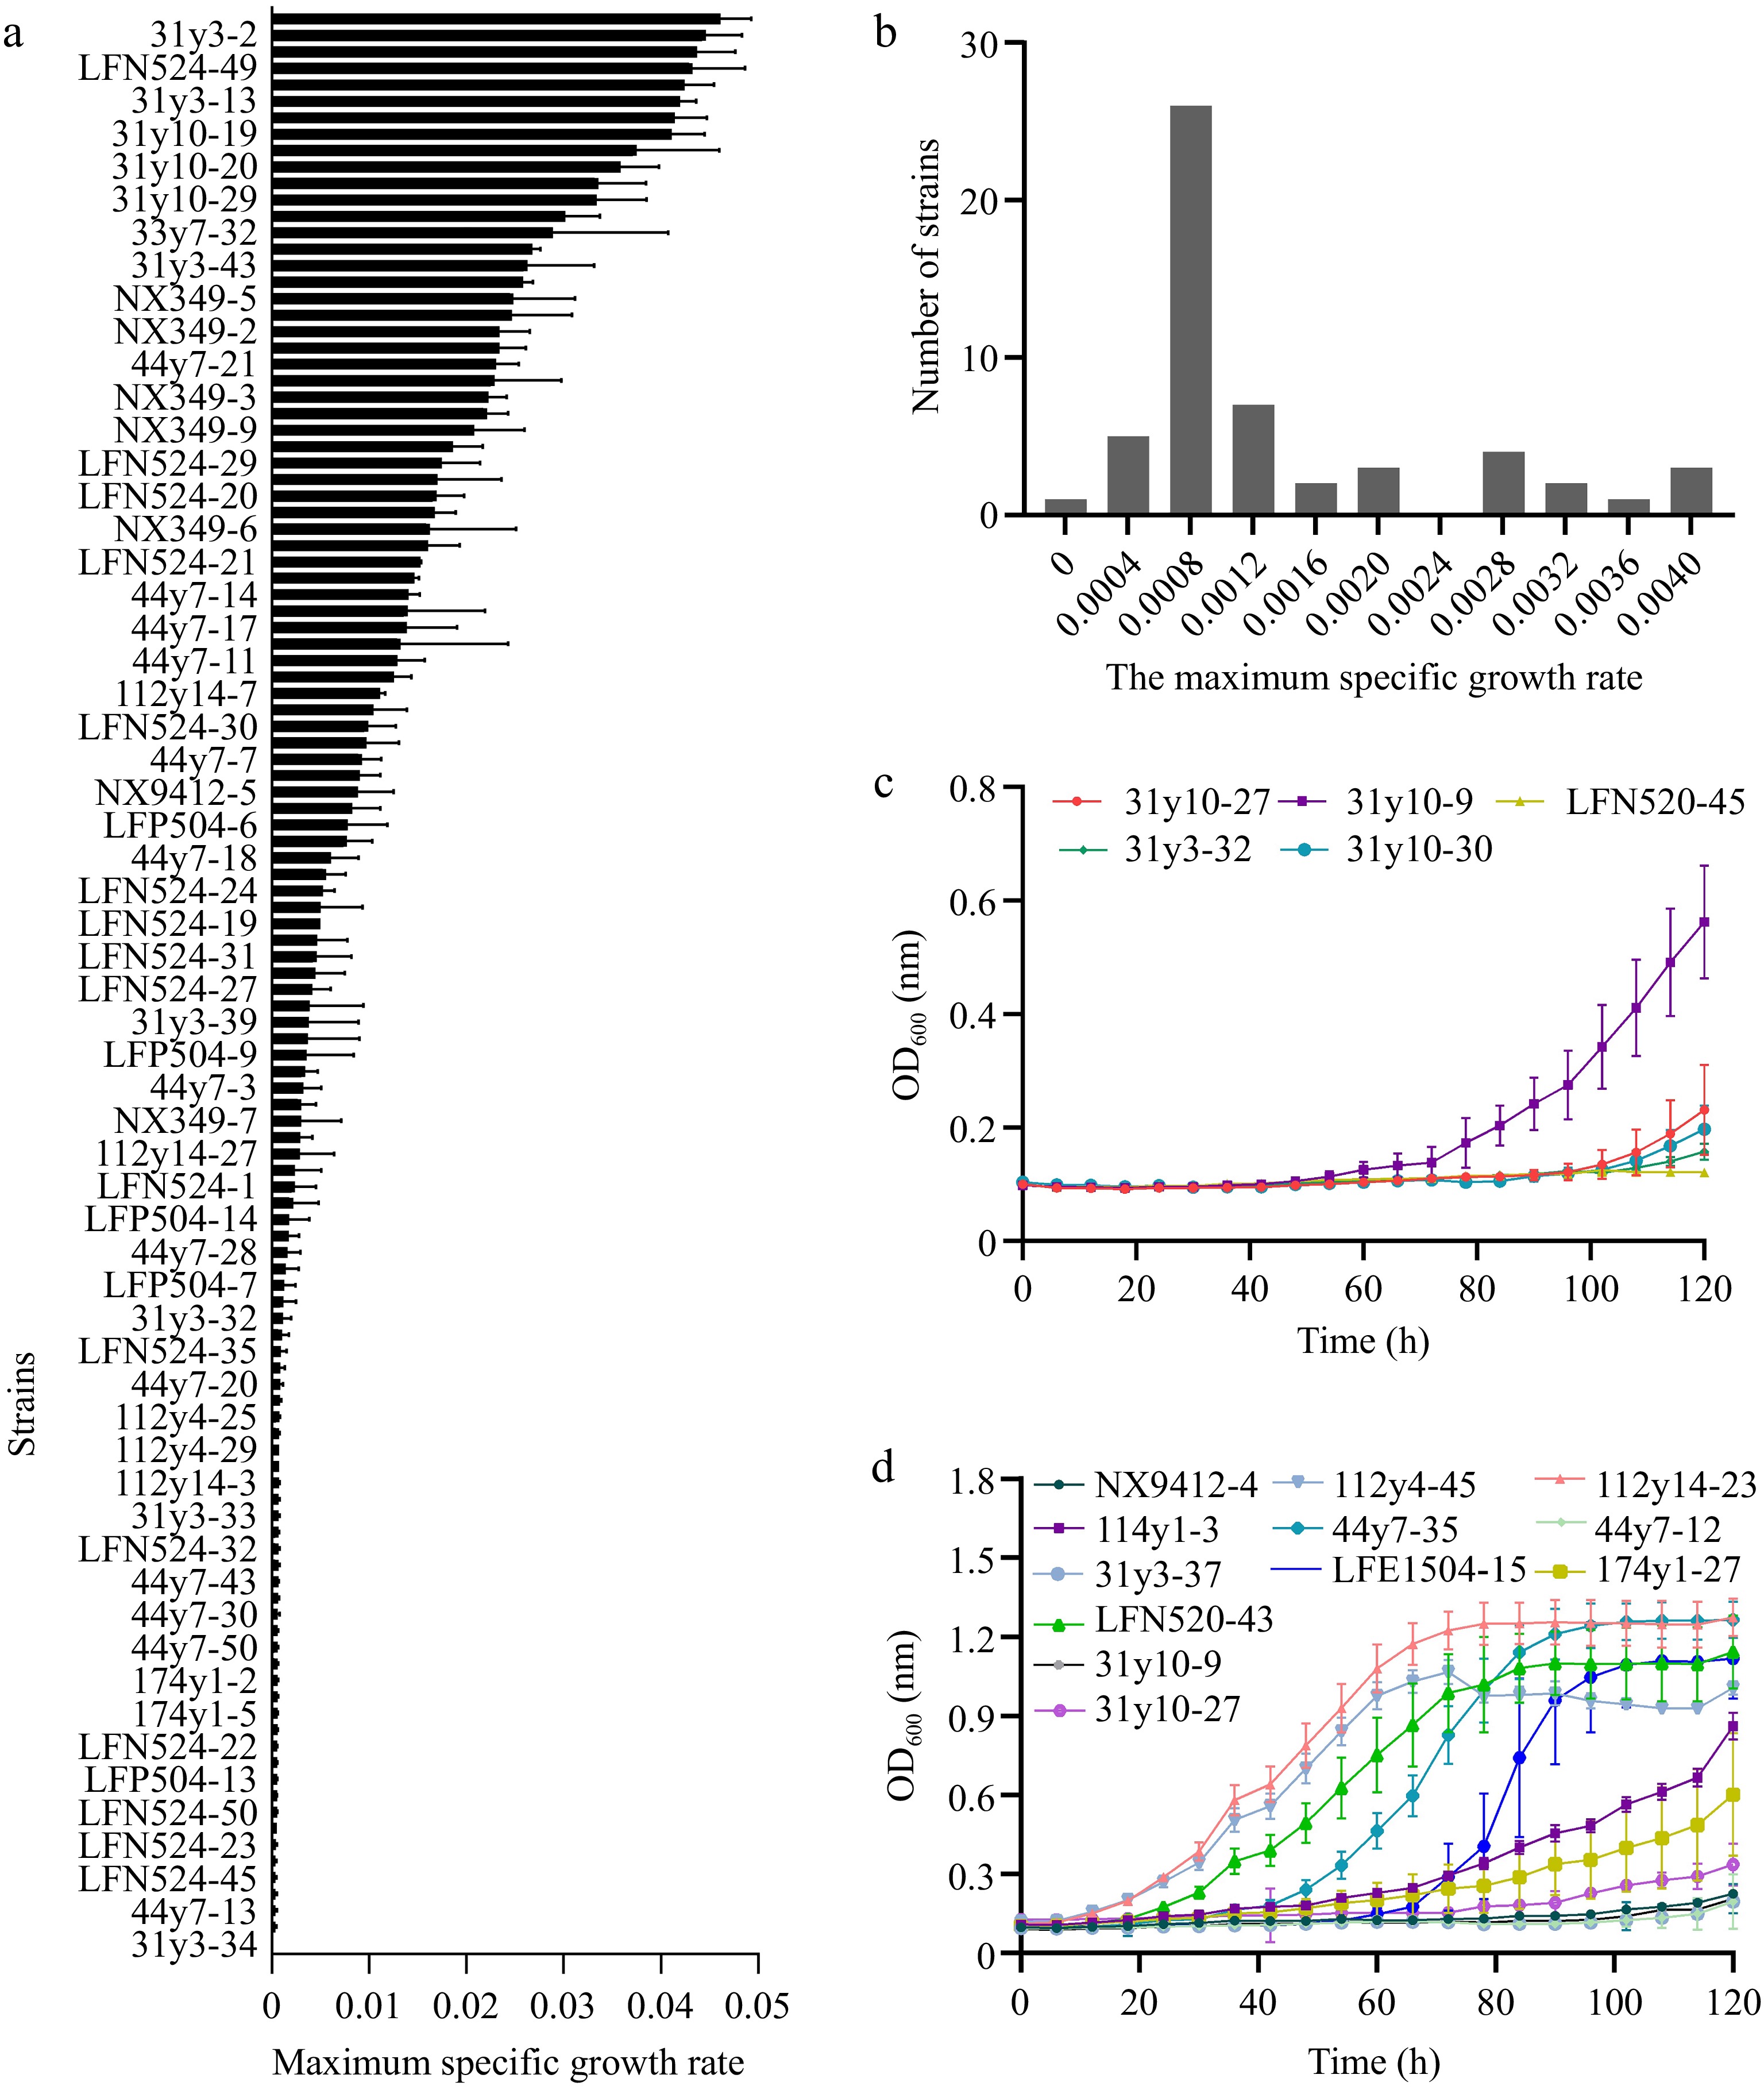
Figure 2.
Selection of haploid S. cerevisiae strains with different growth under combined ethanol-osmotic-SO2 stressors. (a) Maximum specific growth rate under combined ethanol-osmotic-SO2 stressors of the parental haploids. (b) Distribution of μmax in the stress-sensitive haploid S. cerevisiae strains. (c) Growth of stress-sensitive haploids in high-stress medium. (d) Growth of stress-tolerant haploids in low-stress medium.
The superior haploids 31y10-9 (MATα, Δho::KanMX), 31y10-27 (MATα, Δho::KanMX) and the inferior haploids NX9412-4 (MATa, Δho::KanMX), 31y3-37 (MATa, Δho::KanMX) were successfully constructed (Supplementary Fig. S2). However, only 31y10-9 (MATα, Δho::KanMX) and NX9412-4 (MATa, Δho::KanMX) were successfully crossed with each other to obtain the F1 hybrid.
Generation of F2 segregant population and two pools with extreme tolerance to combined stressors
-
The F1 hybrid was sporulated, and 206 F2 haploid segregants were obtained. The latter were examined for growth under high levels of stressors. The distribution of the μmax in the 206 F2 haploid segregants was shown in Supplementary Fig. S3, which, in general, was close to the Gaussian distribution, except that large numbers of strains were observed with little or no growth. This deleterious effect was mainly due to the sensitivity of the strains to multiple stressors. Among them, 20 inferior segregants were further screened in the low-stress medium along with the parental haploids, and a total of 15 haploids were finally chosen to construct the low tolerance pool (Fig. 3b). Similarly, a number of 20 haploids with higher levels of μmax was preliminarily selected from the F2 population (Supplementary Fig. S3). These strains were further evaluated under slightly higher levels of ethanol, hyperosmotic, and SO2 stressors to allow the assembly of the high tolerance pool consisting of 15 superior segregants (Fig. 3a).
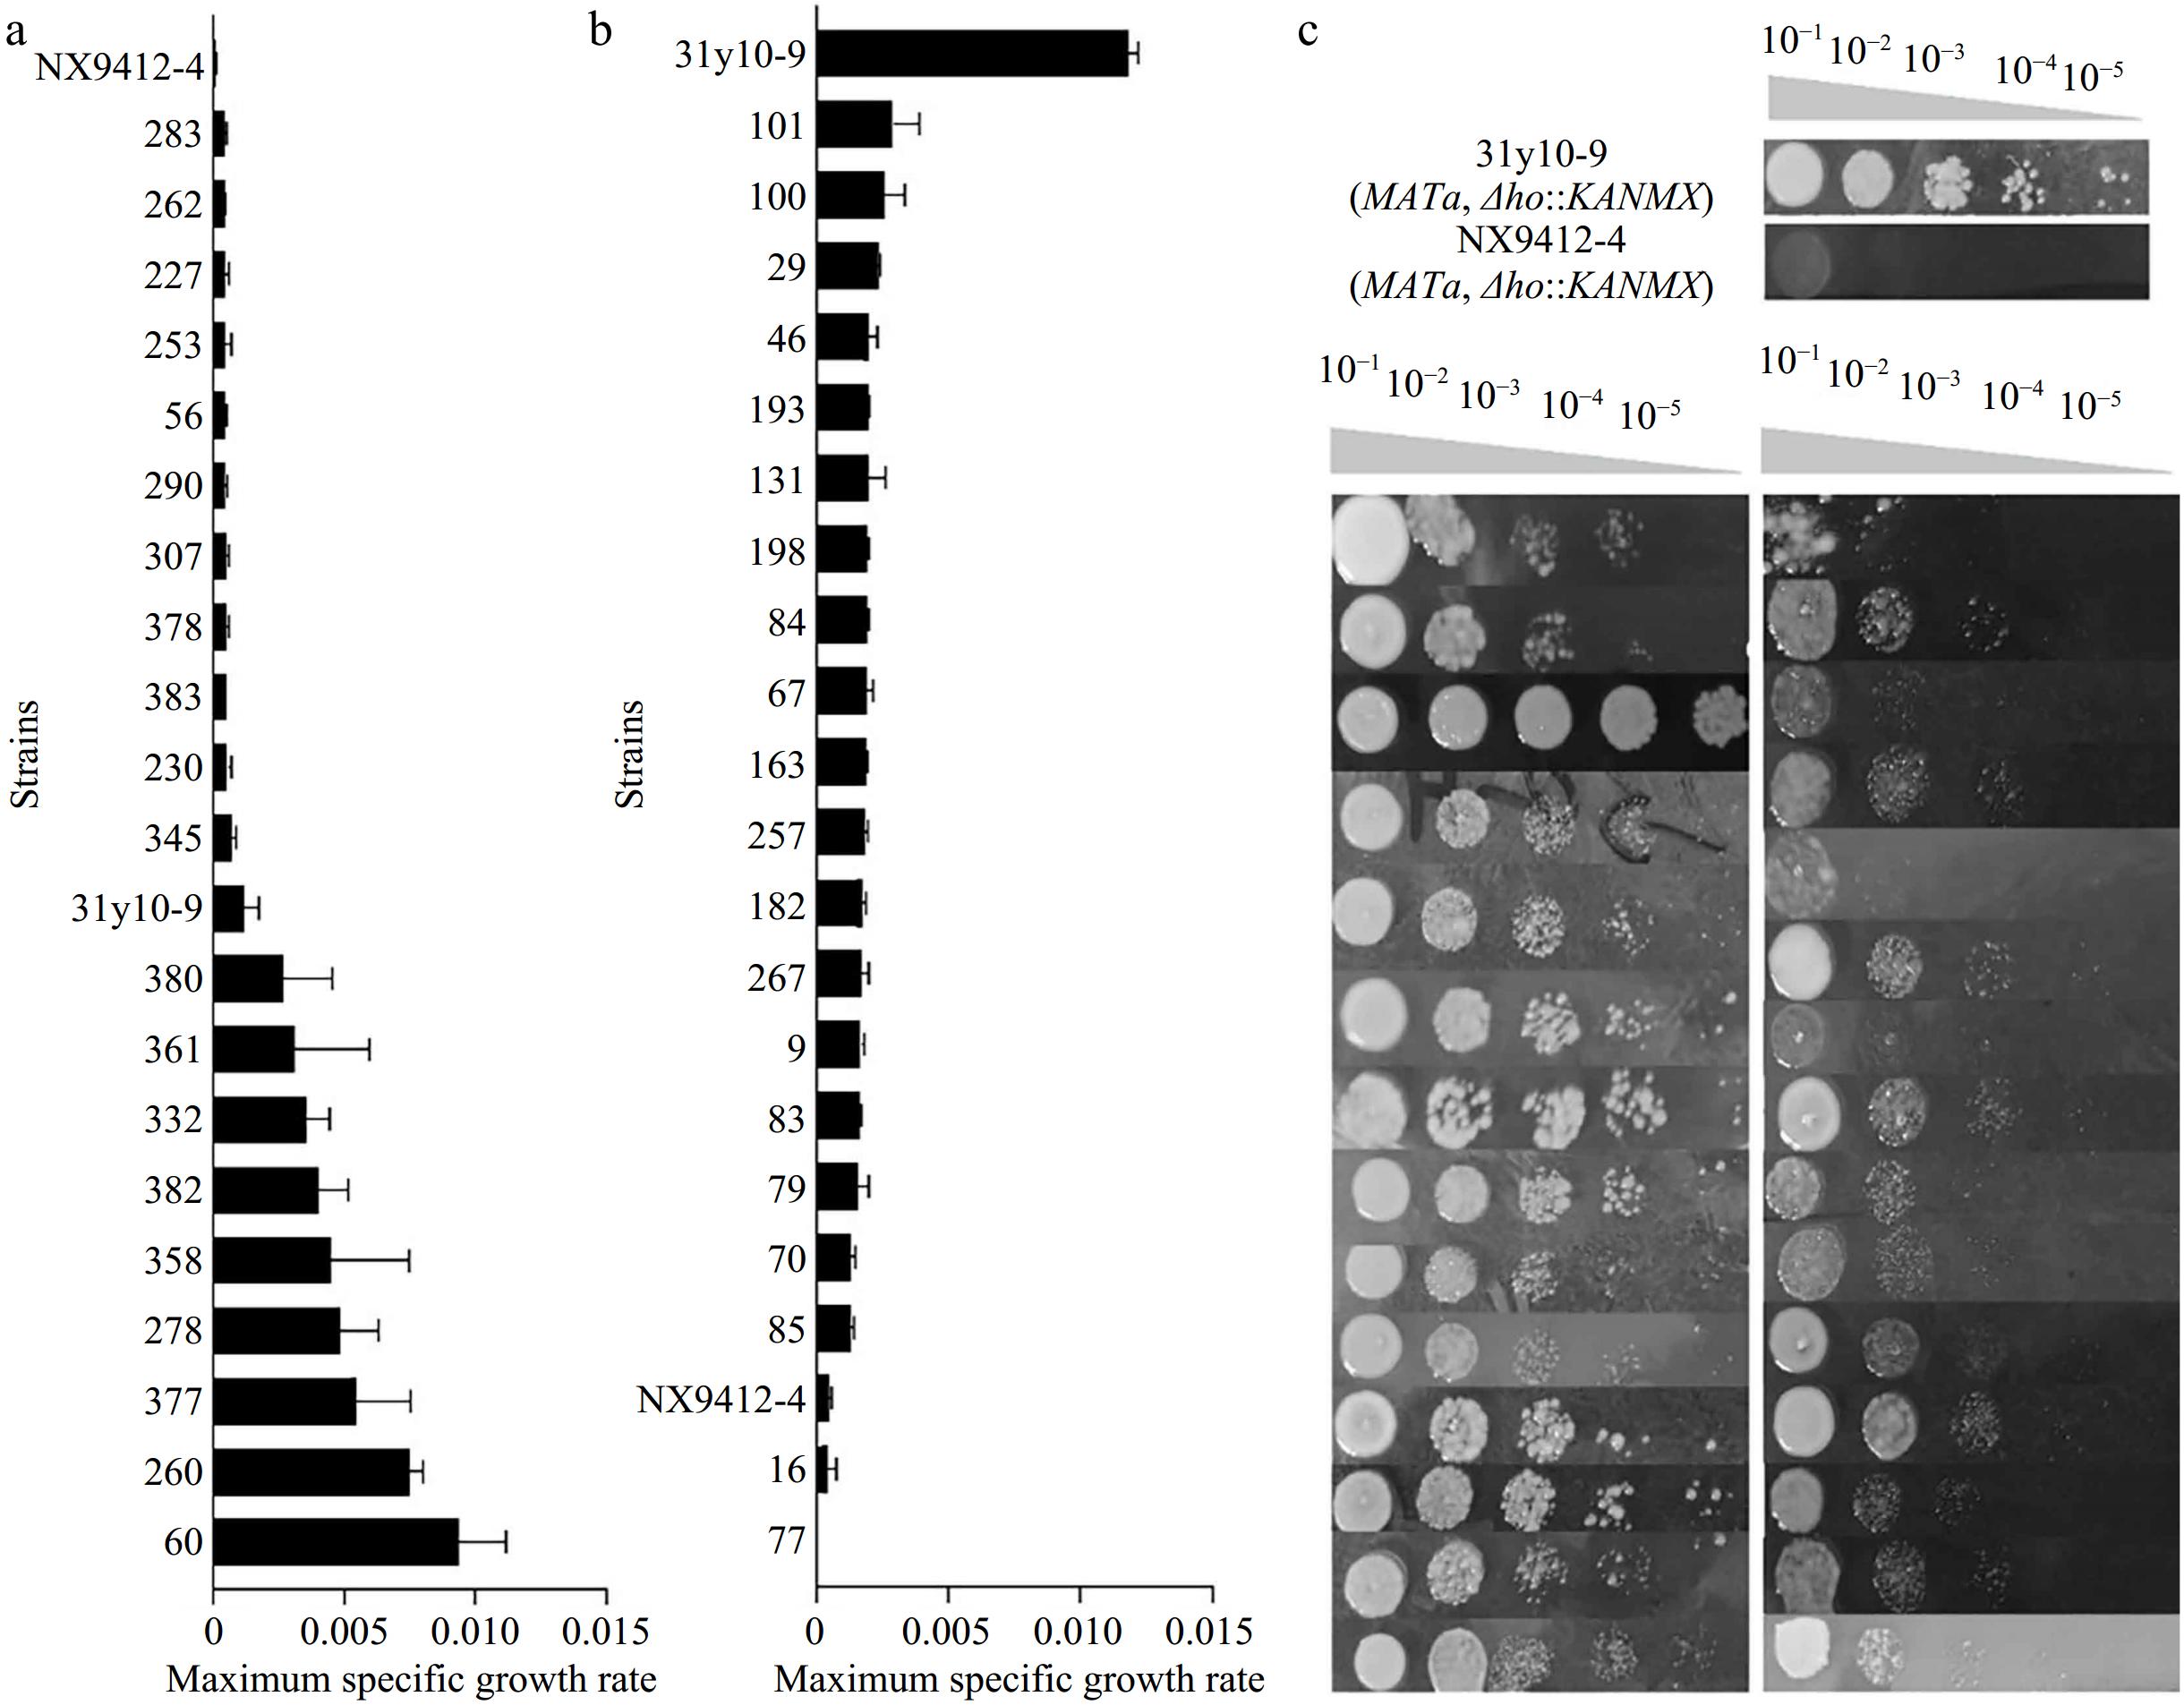
Figure 3.
The distribution of the μmax in the F2 segregants and construction of the two extreme pools. (a) Re-screening of the high-tolerance extreme pool. (b) Re-screening of the low tolerance extreme pool. (c) Spot growth of the superior segregants and inferior segregants from the two pools.
The construction of the two pools was further verified via spot assays of all the selected superior and inferior segregants, along with the haploid parents on plates containing high levels of stressors (Fig. 3c). The inferior parent NX9412-4 displayed a significant decrease in viability compared to the stress-tolerant parent 31y10-9. All segregants belonging to the high tolerance pool showed remarkably better colony-forming ability compared to the segregants from the low tolerance pool (Fig. 3c), indicating the two pools were successfully assembled.
Identification of QTLs by pooled-segregant whole-genome re-sequencing analysis
-
Genomic DNA from four samples, including that of strains 31y3-37, NX9412-4, and DNA mixtures from both pools, was subjected to whole-genome sequencing analysis with the Illumina HiSeq 4000 platform. The paired reads from the parent strains and the two bulked segregants were first mapped to the reference genome sequence of S. cerevisiae S288c. General sequence features were evaluated and summarized in Supplementary Table S7. The sequence of these four samples was approximately 101–143 Mb in size with 37.7%–40.0% GC content (Supplementary Table S7). The data that support the findings of this study have been deposited into the CNGB Sequence Archive (CNSA)[34] of China National GeneBank DataBase (CNGBdb)[35] with accession number CNP0006972.
A total of 8,843 highly credible SNPs between 31y3-37 and NX9412-4 genomes were identified for QTL analysis, which had been quality filtered. The SNP-index and Δ(SNP-index) were calculated for each SNP. Figure 4a presents the relationship between Δ(SNP-index) and positions on yeast chromosomes by a sliding window analysis with a 20 Kb window size and 1 Kb increment. The peak regions above the threshold value were considered as the candidate QTL regions. Two regions with significantly higher Δ(SNP-index) mean values were located in the 95% confidence interval. The first candidate region comprised of 11 genes was located between 197,001~225,000 bp on Chromosome III, whilst the second candidate region included nine genes and was found between 159,001~185,000 bp on Chromosome XIV. A detailed zoom-in of the 20 genes on the two chromosomes is shown in Fig. 4b and c. For these 20 genes, at least one non-synonymous mutation was found in the open reading frame between the two parental haploids (Supplementary Table S8).
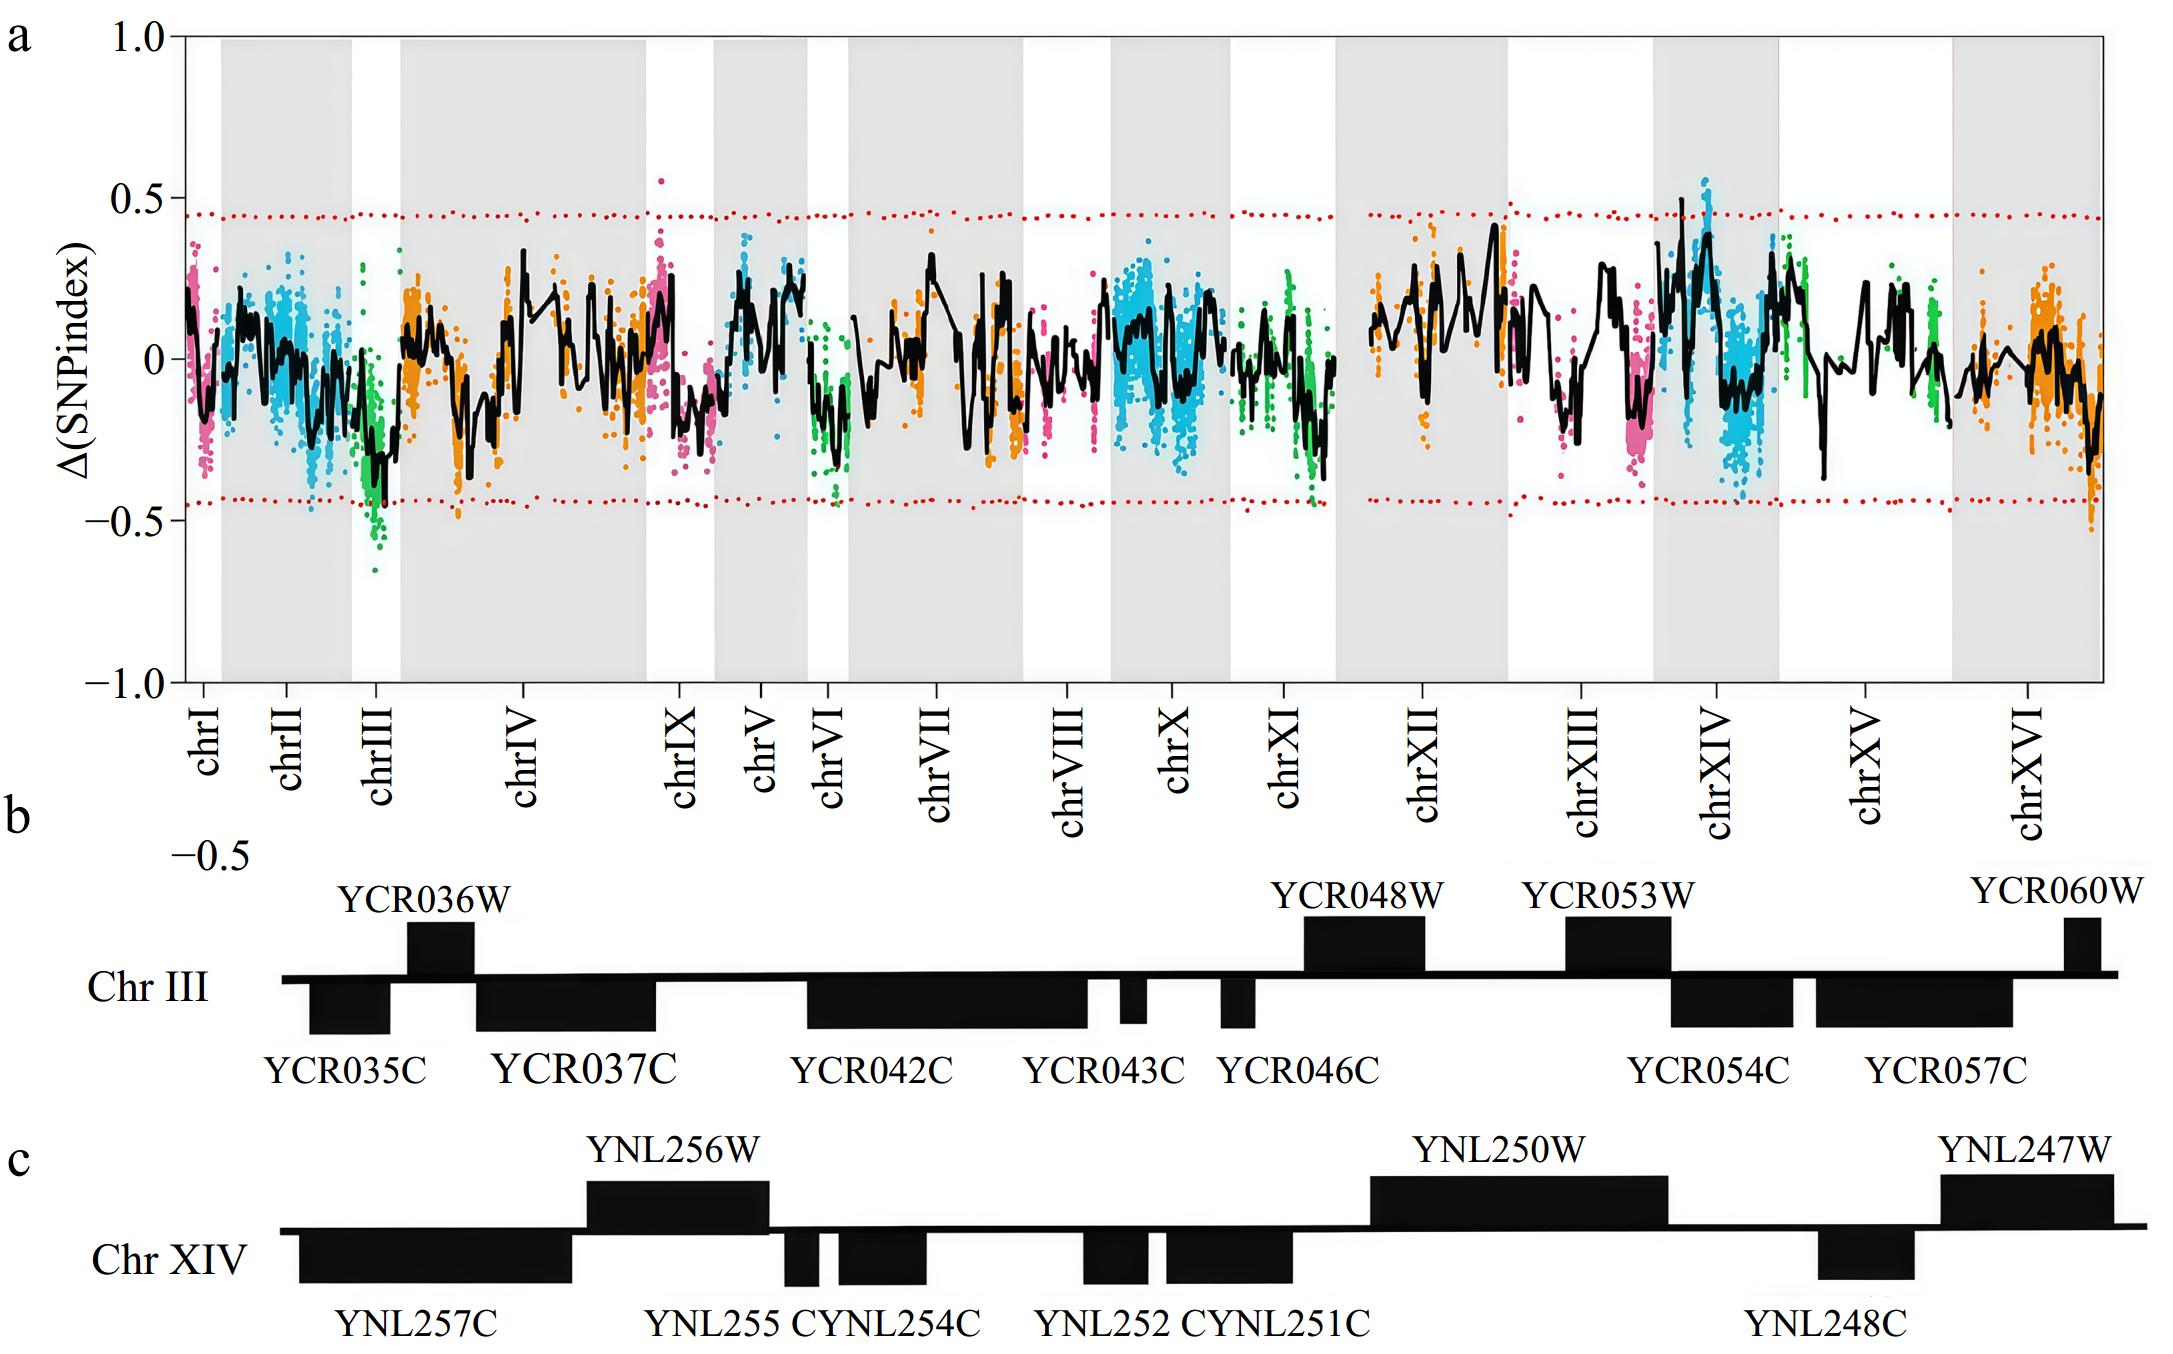
Figure 4.
Identification of QTLs by whole-genome re-sequencing analysis. (a) Mapping of the QTLs associated with multi-stress tolerance by pooled-segregant whole-genome sequencing analysis. The X-axis indicates the position of the chromosomes, whilst the Y-axis shows the Δ(SNP-index) values. (b) Overview of genes in the QTL on Chromosome III. (c) Overview of genes in the QTL on Chromosome XIV.
GO and KEGG pathway enrichment analysis
-
GO enrichment analysis was performed to better understand the effect of candidate genes on physiological activities in yeast cells (Fig. 5a). Results show that the function of the candidate genes mainly involves RNA binding in regulatory regions, sterol O-acyltransferase activity, carboxylase activity acting on phosphate, poly(A)RNA binding, rRNA methyltransferase activity, single-stranded DNA binding, receptor binding, phosphotransferase activity, and transcription factor activity. Based on GO enrichment analysis, a total of seven genes within the QTLs that were possibly associated with combined ethanol-hyperosmotic-SO2 stress tolerance were finally selected and annotated as QTGs (Table 1).
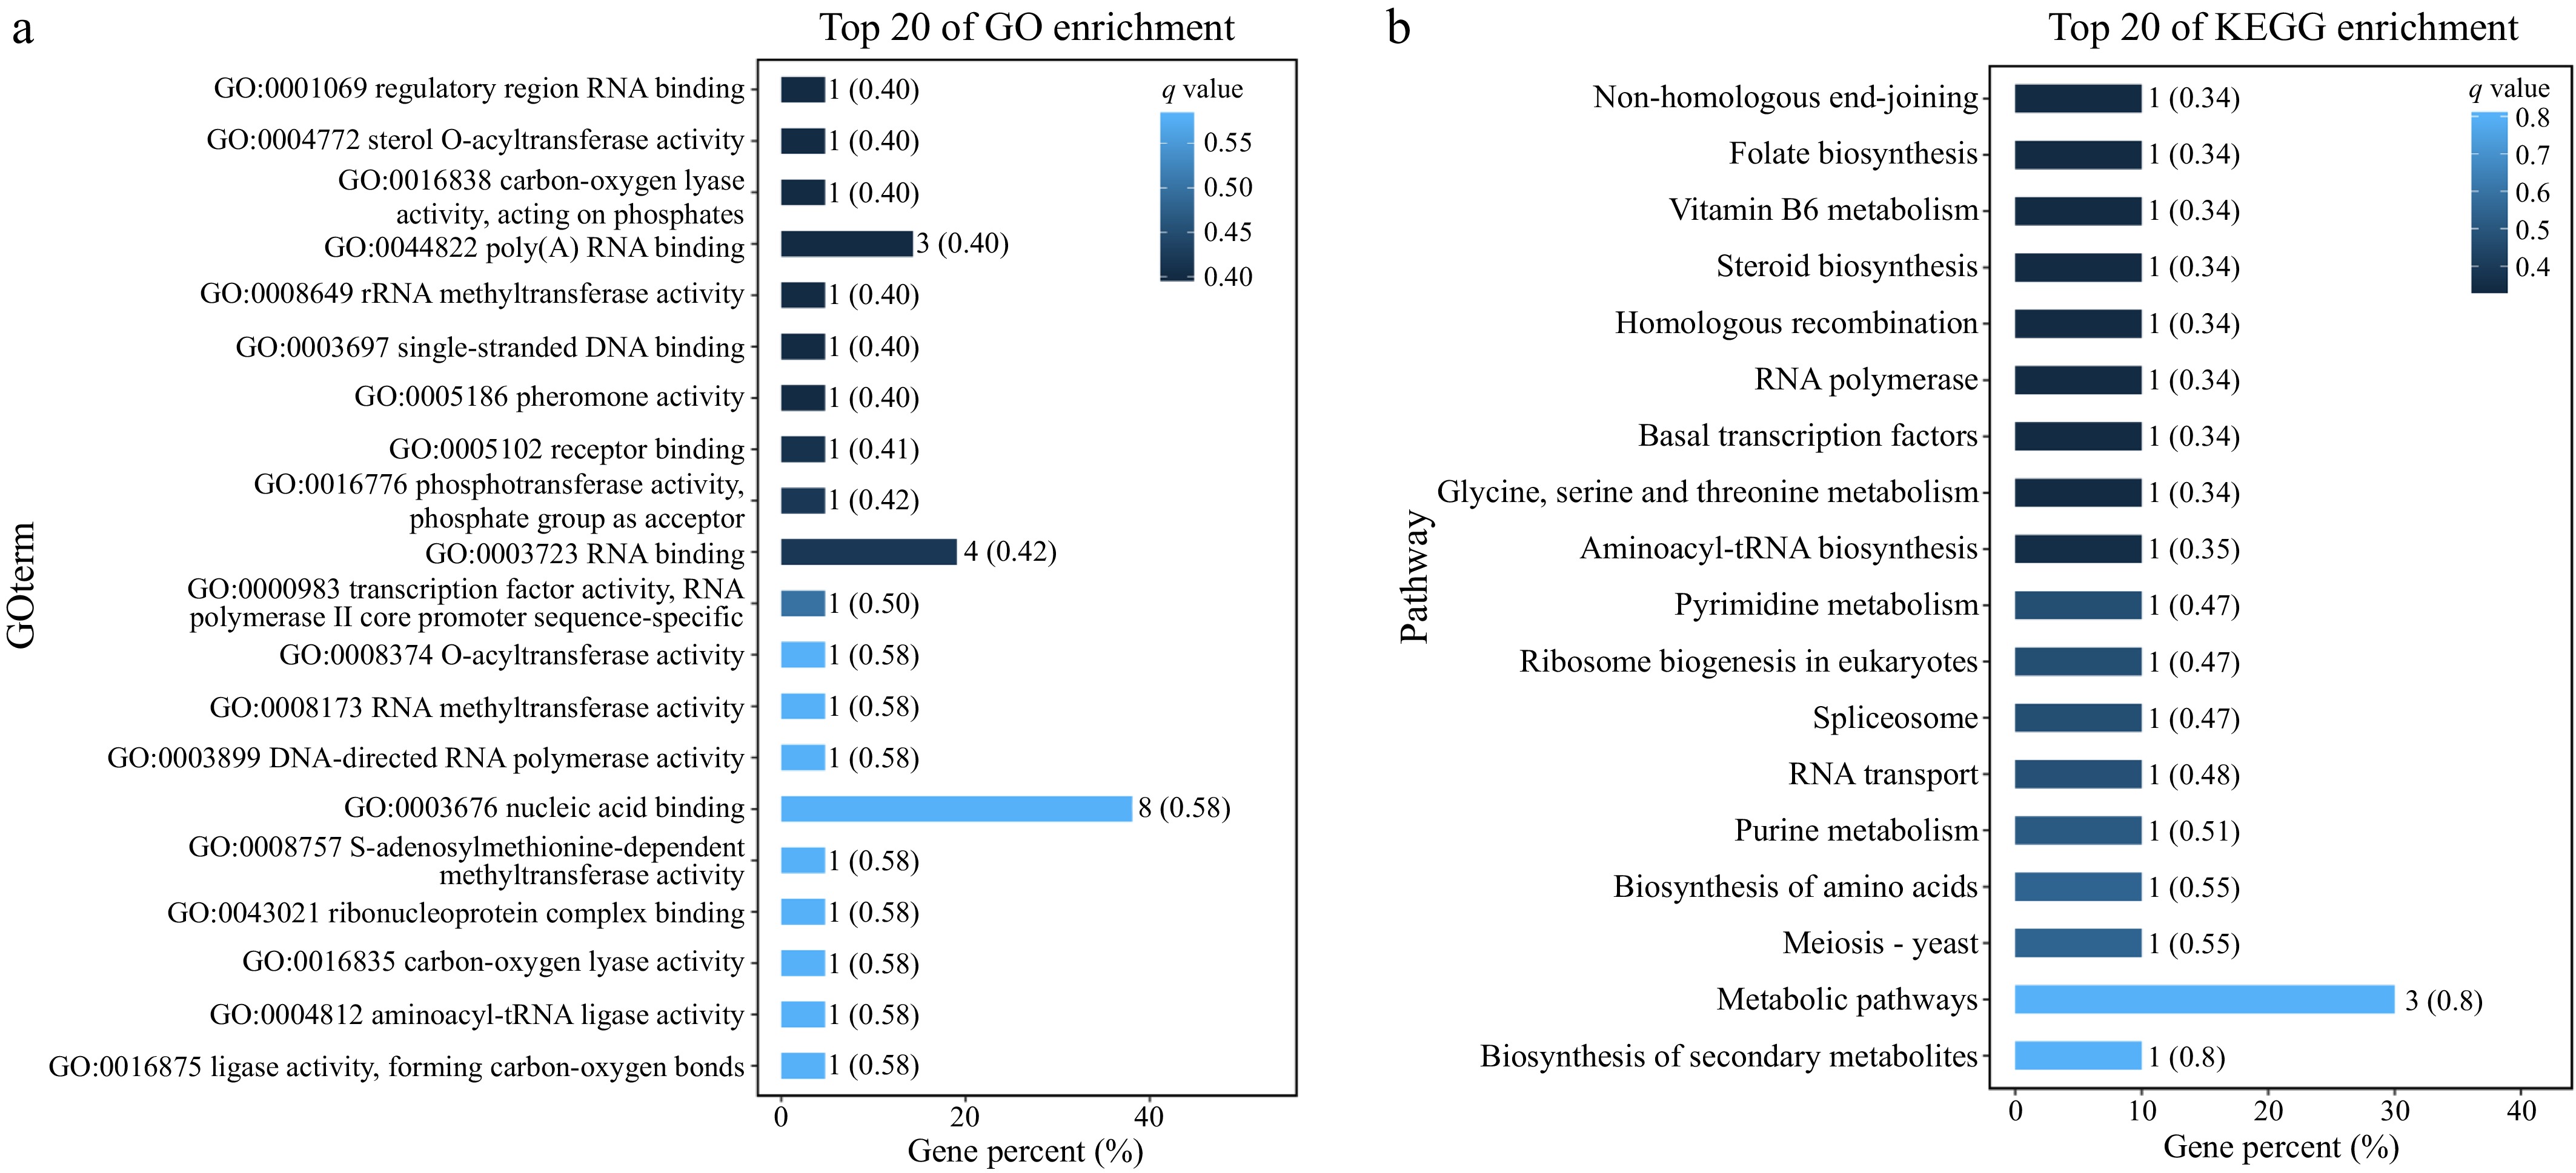
Figure 5.
(a) GO enrichment analysis of the genes in the two QTLs. (b) KEGG enrichment analysis of the genes in the two QTLs.
Table 1. Candidate genes and their functions.
Classification of gene function Gene ID Name Gene functions RNA binding YNL251C NRD1 Regulatory region RNA binding; protein binding YCR057C PWP2 RNA binding YNL255C GIS2 Poly(A) RNA binding; transition metal ion binding DNA binding YNL250W RAD50 Phosphotransferase activity, phosphate group as acceptor; nucleoside-triphosphatase activity; purine ribonucleoside binding; cation binding; sequence-specific DNA binding rRNA methyltransferase activity YCR047C BUD23 rRNA methyltransferase activity sterol O-acyltransferase activity YCR048W ARE1 rRNA methyltransferase activity YCR053W THR4 Anion binding KEGG analysis reveals the biological pathways and functional mechanisms that are potentially involved in the response of S. cerevisiae to combined ethanol-hyperosmotic-SO2 stressors. Based on KEGG enrichment analysis, certain pathways, such as non-homologous end-joining, folate biosynthesis, vitamin B6 metabolism, steroid biosynthesis, homologous recombination, RNA polymerase, basal transcription factors, glycine, serine, and threonine metabolism, and aminoacyl-tRNA biosynthesis, are likely to participate in the survival and function of S. cerevisiae under combined stressors (Fig. 5b).
-
During wine fermentation, ethanol, SO2, and hyperosmotic stress are common inhibitors of S. cerevisiae. Their individual impact on yeast growth has been widely studied[36]; however, such information on combined stressors was lacking. In this study, the effect of combinations of ethanol, SO2, and hyperosmotic stress on eight haploid S. cerevisiae strains derived from wild diploid yeasts was first investigated by using an orthogonal test. The assays showed that 6% v/v ethanol, 300 mg/L SO2, and hyperosmotic stress equivalent to 200 g/L fructose induced the greatest variance on μmax of yeast, indicating a strong inhibition caused by the stressors (Supplementary Table S6). A previous study shows that the minimum concentration to cause growth inhibition of Chinese indigenous S. cerevisiae was 16% v/v ethanol, or up to 400 g/L sugar[27], which was much higher than in this study. This could be mainly due to the synergistic effect of combined stressors compared to individual ones. Besides, different strains and mediums used between the two studies can also impact experimental outcomes.
Many approaches, including transcriptomic strategies, were adopted to identify a number of genes (e.g., RPOB, SSK1, ASG1) responsible for stress tolerance in yeast[16]. Though thoughtful, the candidate-gene identification via high-throughput omics approaches is quite limited to fully explain genetic differences between S. cerevisiae strains that are responsible for multi-stress tolerance. Among the abiotic stressors that are of interest, tolerance of S. cerevisiae to ethanol stress has been proven to be a quantitative trait[37]. Similarly, under multiple stressors, the continuous variation and frequency distribution of μmax of the F2 segregants was generally close to the normal distribution (Supplementary Fig. S4). This implies that the multi-stressor tolerance also shares common features of a quantitative trait, and the related genetic basis can thus be explained by QTL mapping.
In this study, to illustrate such genetic basis by QTL mapping, the parental haploid yeast strains with divergent growth performance under combined ethanol-hyperosmotic-SO2 stressors were first screened. The haploids were obtained via direct sporulation of the indigenous diploid S. cerevisiae. A higher yield of sporulation was observed in Kleyn's medium (Supplementary Table S4, Fig. 1), particularly in the liquid Kleyn's medium, which was different from Bilinsky et al.[38], where ACK medium led to greater spore production. The sporulation efficiency of S. cerevisiae can be highly dependent on the sporulation medium and yeast strains[39]. To improve spore yield from wild S. cerevisiae for QTL mapping, it is of great importance to evaluate and/or optimize sporulation using various media. Alternatively, Feng et al.[21] reported obtaining stable haploids of S. cerevisiae for QTL mapping by knocking out the HO gene of the diploid strains prior to sporulation. Since the existence of the HO gene allows haploids to change mating type, self-diploidization may easily occur in the haploids containing the HO gene[40]. Such characteristic of wild S. cerevisiae leads to haploid instability so that phenotypic detection of parental zygosis and segregation of the F2 population can be negatively affected for subsequent QTL localization. Nonetheless, we successfully generated 118 stable haploid yeasts (Supplementary Table S1), and their ploidy was repeatedly verified via PCR (Supplementary Fig. S5). The superior haploids 31y10-9, 31y10-27, and the inferior haploids NX9412-4, 31y3-37 were successfully screened (Fig. 2), and one copy of the HO gene was disrupted by inserting the KanMX cassette from pUG6 in these strains to ensure the generation of stable F1 hybrids and the F2 haploids.
The BSA approach, which is efficient in identifying major QTLs by genome-wide comparison of Δ(SNP-index) between two populations from offspring with divergent phenotypes[41−43], was adopted in this study. The same approach has also been widely used to investigate the genetic basis of other quantitative traits in S. cerevisiae[21]. After genotyping, two genomic regions located on chromosomes III and XIV were successfully detected (Fig. 4). Due to the fact that these two regions contain a high number of genes with non-synonymous mutations, GO enrichment analysis was then performed (Fig. 5). Based on GO enrichment analysis, seven genes were shortlisted as the candidate QTGs involved in multiple stress tolerance in yeast. Previous studies have reported that several of the seven genes are involved in stress response in yeast and other organisms; they, however, used media supplemented with stressors other than ethanol, SO2, and osmotic stress, so it is hard to make a direct comparison.
Among the seven QTGs, the gene ARE is involved in sterol synthesis[44], which is essential for the maintenance of cell membrane integrity and optimal functionality. To survive harsh conditions, particularly under ethanol stress, yeast cells reduce membrane fluidity by sterols homeostasis adjustment[45,46]. Findings regarding KEGG enrichment analysis further highlighted the potential role of ARE and steroid biosynthesis in multiple stress adaptation in S. cerevisiae (Fig. 5b). Nonetheless, there still lacks direct evidence on whether ARE is involved in ethanol-hyperosmotic-SO2 stress tolerance via modulation of cell membrane architecture.
Genes GIS2 and NRD1 are related to RNA binding and modification, indicating that transcriptional regulation plays an important role in ethanol-hyperosmotic-SO2 stress tolerance in yeast. GIS2 is involved in the regulation of coding sequences with hundreds of mRNAs and acts as an RNA regulator in S. cerevisiae. Rojas et al.[47] reported that GIS2 and its homologous genes mediate the response of cells to glucose deprivation and the presence of arsenite via mRNA regulation. Similarly, NRD1 has also been shown to impact yeast growth under various stresses, including nutrient depletion, heat shock, arsenite treatment, and oxidative stress[48]. NRD1 encodes key enzymes involved in the Nrd1-Nab3 termination pathway, which prematurely terminates the formation of polycistronic and antisense RNAs that are detrimental to the correct expression of genes[49]. In addition, Satoh et al.[48] suggested that NRD1 plays a role in stress-induced granule formation, which has been shown to increase stress resistance in fission yeast. Together with the RNA polymerase pathway (Fig. 5b), these genes might jointly enhance the stress resistance of S. cerevisiae to the three combined stressors.
In addition to transcription regulation, yeast methyltransferases have been shown to participate in acetic acid stress tolerance[50,51] and ethanol tolerance[52] via mediating meiosis, sporulation, triacylglycerol metabolism, vacuolar morphology, and mitochondrial functions. BUD23 in S. cerevisiae encodes for a class I methyltransferase Bud23. The latter is important for the biogenesis and export of the 40S subunit in yeast, which subsequently influences cell growth[53,54].
In addition, metabolic pathways related to DNA repair might also be involved in the response of S. cerevisiae to ethanol-hyperosmotic-SO2 stressors, as revealed by KEGG analysis (Fig. 5b). For example, during DNA replication, the non-homologous end joining (NHEJ) pathway supports ligation of the broken DNA ends without relying on the homologous sequences or the DNA template[55]. In contrast, the homologous recombination pathway was involved in DNA repair using the homologous DNA sequences as a template when there are double-strand breaks or single-strand gaps in the DNA[56]. These pathways help to maintain DNA integrity in S. cerevisiae and other microorganisms. Accordingly, activation of such pathways may lead to higher tolerance of the superior parental strain and strains belonging to the high tolerance pool under the given multiple stressors in this study.
These results suggest a complex response of S. cerevisiae to ethanol-hyperosmotic-SO2 stressors, which possibly relies on the function of the seven potential QTGs and the pathways they participated in that alter specific cellular processes. Beyond these findings, it is also crucial to understand the molecular mechanism associated with this complex trait. Therefore, it would be interesting to carry out a functional analysis of these seven potential QTGs and confirm the contribution of the SNPs identified in this study. To investigate further, future work would include the knockout of the seven genes individually to study the cause and effect associated with the multi-stressor tolerance phenotype in yeast.
-
In summary, different haploid strains of S. cerevisiae strains exhibit distinguished tolerance to combinations of ethanol, osmotic, and SO2 stressors. Among the tested strains, 31y10-9 and NX9412-4 showed opposite stress tolerance features and were used as parental haploids for further elucidating the genetic basis of the multi-stressor tolerance in yeast by QTL mapping. The major QTLs were identified using the BSA approach in the F2 segregant population with divergent tolerance capability. Two hot QTL regions composed of 20 genes in total were detected on chromosomes III and XIV. Based on GO enrichment analysis, seven candidate genes associated with nucleotide binding, methylation, and sterol synthesis were finally identified as potential QTGs. This study is the first of its kind to use QTL mapping with the BSA approach to investigate the genetic basis associated with ethanol-hyperosmotic-SO2 stress tolerance in S. cerevisiae. These findings also highlight the opportunities for using QTL mapping to reveal genetic determinants of other quantitative traits like nutrient depletion in wine yeast.
We extend our thanks to the College of Enology at Northwest A&F University. This work was financially supported by Ningxia Hui Autonomous Region Key R&D Project (Grant No. 2023BCF01027), the National Natural Science Foundation of China (Grant Nos U21A20269, 32372312, 32402163), the National Foreign Expert Program of China(Grant No. G2022172022L), Northwest A&F University (Grant No.Z2220221027), and the earmarked fund for CARS (CARS-29-jg-3)
-
The authors confirm their contributions to the paper as follows: study conception and design: Jiang J, Yu H, Lei X; data collection: Jiang J, Yu H, Lei X, Yang H; analysis and interpretation of results: Jiang J, Yu H, Lei X, Yang H; writing − draft manuscript preparation: Jiang J, Yu H, Ye D; supervision: Liu Y, Qin Y, Jiang J; writing − review and editing: Jiang J, Yu H, Liu Y, Zhang J, Qin Y, Song Y. All authors reviewed the results and approved the final version of the manuscript.
-
All data generated or analyzed during this study are included in this published article and its supplementary information files.
-
The authors declare that they have no conflict of interest.
- Supplementary Table S1 S. cerevisiae strains used in this study.
- Supplementary Table S2 Orthogonal test factors.
- Supplementary Table S3 Experimental design for the orthogonal test.
- Supplementary Table S4 Spore production rate for diploid S. cerevisiae using different media.
- Supplementary Table S5 Maximum specific growth rate of the haploid strains under different levels of multi-stressors.
- Supplementary Table S6 Analysis of the orthogonal test results.
- Supplementary Table S7 General features of the sequencing data.
- Supplementary Table S8 SNPs identified in coding regions in the superior parental strain 31y10-9 when compared with the inferior parental strain NX9412-4.
- Supplementary Fig. S1 Spore production in the improved Klyen’s medium. A: sporulation on 5 d; B: sporulation on 7 d.
- Supplementary Fig. S2 Identification of the HO knockout and the mating types in the haploid parents.
- Supplementary Fig. S3 Maximum specific growth rate under combined ethanol-osmotic-SO2 stressors of the F2 population.
- Supplementary Fig. S4 Histogram of the maximum specific growth rate of the haploid.
- Supplementary Fig. S5 Mating type of the haploid population.
- Copyright: © 2025 by the author(s). Published by Maximum Academic Press on behalf of China Agricultural University, Zhejiang University and Shenyang Agricultural University. This article is an open access article distributed under Creative Commons Attribution License (CC BY 4.0), visit https://creativecommons.org/licenses/by/4.0/.
-
About this article
Cite this article
Jiang J, Yu H, Lei X, Yang H, Ye D, et al. 2025. Impact of combined wine-related stressors on Saccharomyces cerevisiae and mapping of the associated QTLs. Food Innovation and Advances 4(3): 342−351 doi: 10.48130/fia-0025-0032 

Impact of combined wine-related stressors on Saccharomyces cerevisiae and mapping of the associated QTLs
- Received: 18 December 2024
- Revised: 11 May 2025
- Accepted: 15 May 2025
- Published online: 05 August 2025
Abstract: Ethanol, hyperosmotic stress, and certain levels of SO2 are the main abiotic factors inhibiting the survival of Saccharomyces cerevisiae during winemaking, but how combinations of these stressors impact yeast growth and the underlying genetic basis are not well studied. To illustrate these questions, ten randomly selected Chinese indigenous haploid S. cerevisiae were first evaluated for multi-stressor tolerance using a three-factor, three-level orthogonal test. Great variation in growth was observed in a medium containing 6% v/v ethanol, 300 mg/L SO2, and hyperosmotic stress equivalent to 200 g/L fructose. One hundred and eighteen haploids were further tested under the mentioned stress levels. Their growth shared common features of quantitative traits, which indicates the underlying mechanism can be investigated by quantitative trait locus (QTL) mapping. The parental haploids with opposite tolerance to the combined stressors were selected to generate the F1 hybrid and F2 segregants. Further characterization of the F2 population allowed the assembly of two pools, each composed of 15 individuals showing divergent tolerance to the multi-stressor. The associated major QTLs were mapped by genome-wide comparison of single-nucleotide polymorphism profiles between the two pools. Two regions located on Chromosomes III and XIV were identified to be associated with the multi-stressor tolerance. Based on GO and KEGG enrichment analysis, seven genes involved in nucleotide binding, methylation, and sterol synthesis were finally selected as potential quantitative trait genes that play a role in supporting yeast growth under the multi-stressor. The findings of this study expand current knowledge on the genetic determinants of variation in yeast tolerance to combined ethanol-hyperosmotic-SO2 stressors.