


-
The ornamental appeal of flowering plants largely depends on their flowering characteristics, with multiple-season flowering significantly extending the visual display period. As a result, reblooming has become a major breeding goal for many ornamental plant species[1]. Reblooming, defined as the ability of plants to flower twice within a single growth cycle[2], manifests differently across geographical regions. In temperate climates, reblooming typically occurs in spring and autumn, whereas in subtropical climates, it is more common in spring and summer. By diversifying flowering times, reblooming plants contribute to extended bloom periods, enriching the seasonal dynamics of gardens and landscapes. Consequently, plants exhibiting this trait have considerable ornamental and practical value for horticultural applications.
One notable group of ornamental plants that have attracted significant attention for reblooming traits is the bearded iris (Iris germanica L.), a perennial herbaceous plant of the family Iridaceae. Bearded iris is known for the distinctive beard-like appendages at the base of its outer tepals. These plants are renowned for their unique floral architecture, vibrant color variations, and primary flowering period from April to May, making them essential components in both garden settings and groundcover applications. In recent years, numerous reblooming iris cultivars, predominantly bearded iris, have been developed worldwide[3,4]. However, the breeding and identification of these cultivars face significant challenges. The unregulated introduction processes, and the poorly understood genetic mechanisms underlying reblooming traits make it difficult to identify reblooming cultivars outside their flowering periods. Additionally, the breeding cycle for new iris cultivars typically requires a minimum of three years to reach flowering maturity, complicating early-stage evaluations of reblooming traits in hybrid progenies. These limitations have substantially hindered the broader application of reblooming Iris in landscape architecture and the development of novel cultivars.
To address these challenges, molecular marker technology has emerged as a powerful tool for the genetic analysis and identification of key traits in ornamental plants. Molecular markers are particularly valuable for their genetic stability, environmental independence, and high reproducibility, making them ideal for use in germplasm analysis. In Iris spp., a variety of molecular marker techniques, including EST-SSR, SRAP, ISSR, AFLP, SSR, and RAPD, have been employed for the analysis of genetic diversity and phylogenetic relationships. For example, the EST-SSR markers identified by Tang et al.[5] demonstrated high amplification efficiency across both wild Iris and horticulturally important cultivars. Furthermore, 400 ortholog-specific EST-SSR markers have provided many highly polymorphic molecular tools for comparative genetic mapping and genotyping studies in Iris[5]. Zhang et al.[6] integrated chloroplast and nuclear genomic markers to conduct a phylogeographic study of Iris. QTL mapping was utilized to elucidate the genetic architecture of reproductive isolation between Iris fulva and Iris brevicaulis[7]. Collectively, these advances highlight the critical role of molecular marker technologies not only in evolutionary studies—such as speciation and adaptive differentiation—but also in horticultural trait improvement, including cultivar identification and parental selection.
Among various molecular markers, Simple Sequence Repeats (SSR), also known as microsatellites, have gained particular attention. These tandemly repeated sequences, consisting of repeat units ranging from 1 to 6 bp, are widely distributed throughout eukaryotic genomes[8]. SSR markers offer numerous benefits, including high polymorphism, co-dominant inheritance patterns, result reliability, and minimal DNA requirements. Traditional SSR analysis relied on polyacrylamide gel electrophoresis, which was time-consuming, toxic, and limited in its ability to detect small allelic variations. In contrast, the use of fluorescently labeled primers combined with capillary electrophoresis enables more precise detection of these small variations, enhancing the efficiency and accuracy of molecular marker-based studies[9].
The integration of association analysis with molecular marker technology has opened new avenues in plant breeding research. This approach, which leverages linkage disequilibrium (LD) in natural populations, facilitates the identification of gene loci associated with specific phenotypic traits[10−12]. By correlating highly polymorphic molecular markers with flowering traits, SSR markers linked to reblooming traits can be identified. Such markers provide invaluable tools for early-stage identification and breeding of reblooming iris cultivars, offering reliable molecular indicators for trait evaluation and scientific guidance for hybrid progeny selection and cultivar improvement. Tian et al.[13] conducted an association analysis of the molecular characteristics and floral traits of I. germanica, which revealed that 11 EST-SSR markers were associated with nine floral traits.
In this study, eight core SSR markers were employed to genotype 17 bearded iris cultivars to evaluate their genetic relationships, and identify molecular markers associated with reblooming traits. Firstly, the effectiveness of these markers in distinguishing reblooming and once-flowering cultivars was demonstrated. Furthermore, molecular fingerprints and a cluster tree were constructed for the 17 cultivars, providing a clear genetic differentiation among them. Through association analysis between SSR markers and blooming traits, one SSR marker was identified as significantly associated with the reblooming trait. This discovery not only enhances our understanding of the genetic mechanisms underlying reblooming but also provides valuable molecular tools for early-stage identification and breeding of reblooming iris cultivars. The findings of this research offer theoretical insights into gene discovery related to flowering traits and molecular breeding strategies, contributing to the classification, identification, and utilization of reblooming Iris germplasm resources.
-
The plant materials used in this study consisted of 17 bearded iris cultivars, as shown in Fig. 1, which were collected from a controlled environment in the horticultural experimental area in Beicang District, Ningbo City, China (29°53′ N, 121°47′ E). Each cultivar was assigned a unique cultivar code (CC), ranging from 1 to 17 (Table 1). Leaf samples were cleaned, sectioned, and placed in resealable bags. These samples were then transported on dry ice to the laboratory and stored at −80 °C for further use. The reblooming trait, defined as the ability to bloom twice within a single year, was scored as a binary trait: reblooming cultivars were assigned a value of 1, while once-flowering (blooming once a year) cultivars were assigned a value of 0. During the peak blooming period from April to August 2021, the maximum flower diameter and plant height of these 17 bearded iris cultivars were measured. The flower diameter was measured as the maximum horizontal width of a fully opened flower, and the plant height was determined as the vertical distance from the ground level to the highest naturally growing point of the plant. All data were measured from at least three biological replicates.
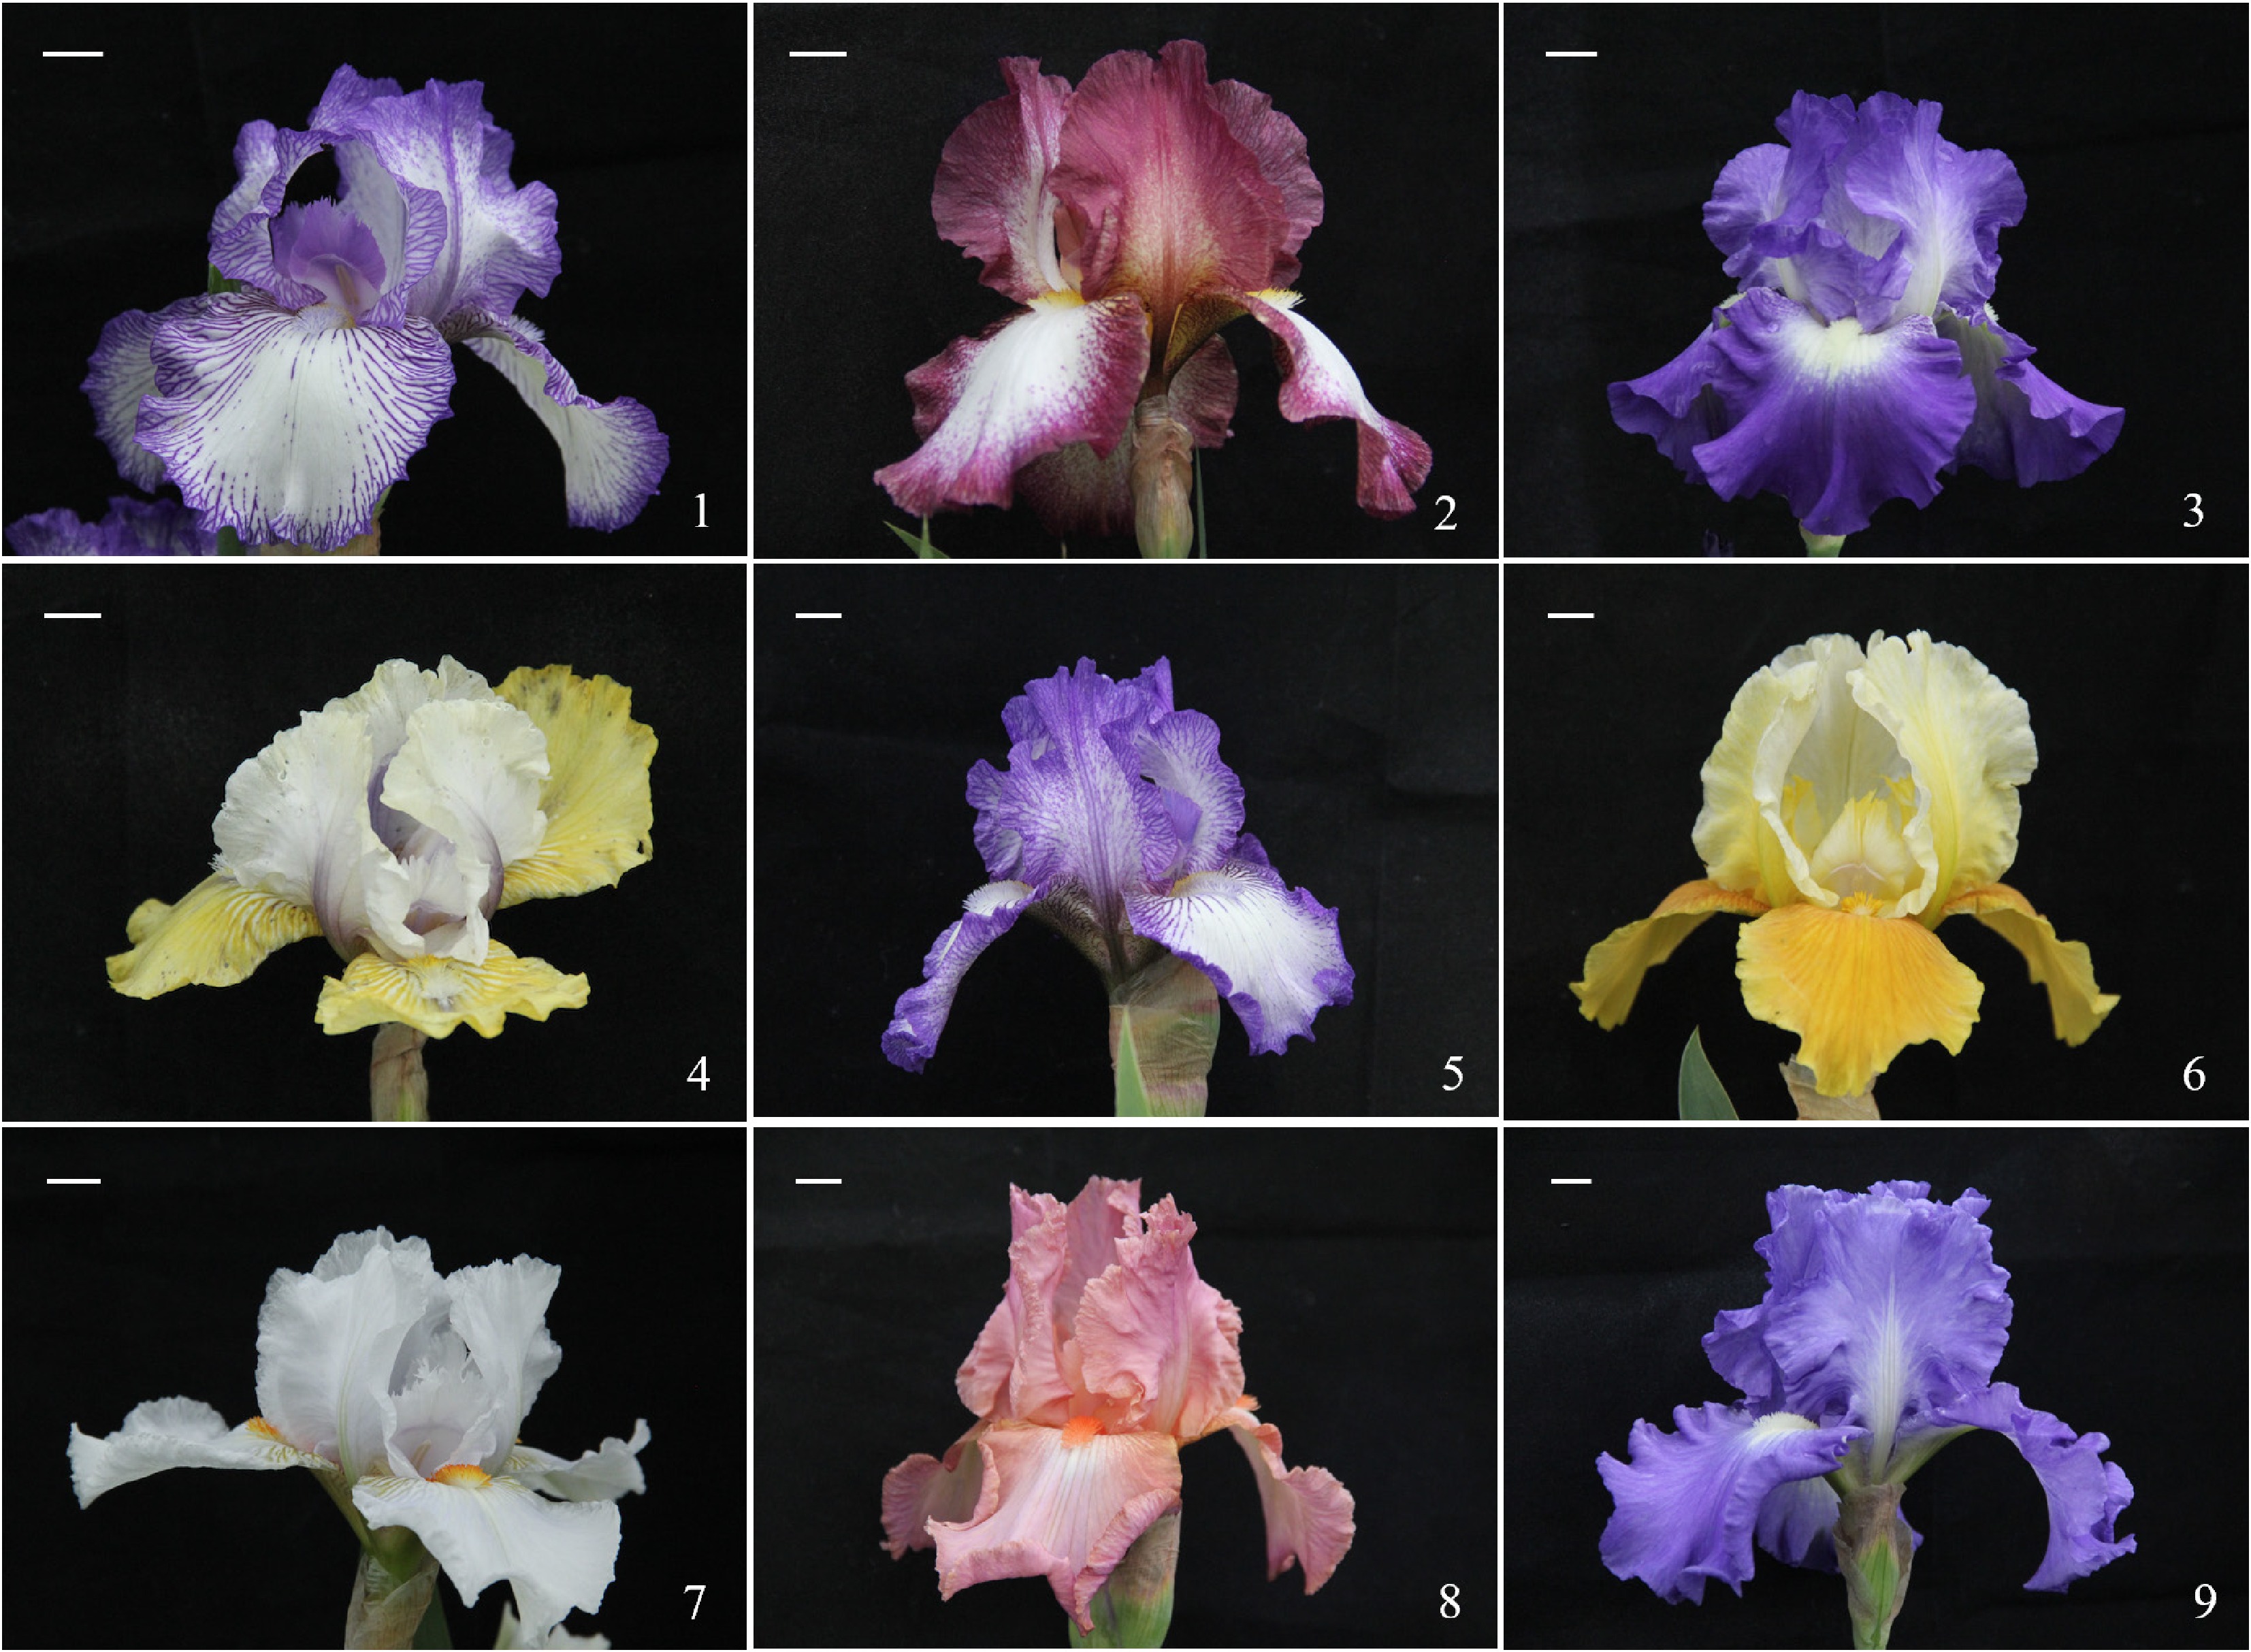
Figure 1.
Bearded iris cultivars used in this study. Cultivar codes 1 to 17 correspond to the 17 bearded iris cultivars listed in Table 1. Bars = 1 cm.
Table 1. Information on bearded iris cultivars in this study.
Cultivar code Cultivar name Source location 1* Antyrmn Gircys Ningbo, Zhejiang 2* Antumn Encorc Ningbo, Zhejiang 3* City Lights Ningbo, Zhejiang 4* Donhle Your Ningbo, Zhejiang 5* Earl of Essex Ningbo, Zhejiang 6* Gnn Rayz Ningbo, Zhejiang 7* I'll Be Back Ningbo, Zhejiang 8* Peach Jam Ningbo, Zhejiang 9* Victona Fall Ningbo, Zhejiang 10 Black Beard Ningbo, Zhejiang 11 Change of P Ningbo, Zhejiang 12 Broad Way Star Ningbo, Zhejiang 13 Berkeley Gold Ningbo, Zhejiang 14 John Naa Ningbo, Zhejiang 15 Sultan's Palace Ningbo, Zhejiang 16 Fufted Cloud Ningbo, Zhejiang 17 Tide'sim Ningbo, Zhejiang Cultivars marked with * are reblooming. Genomic DNA extraction
-
Genomic DNA was extracted from the samples using the Genomic DNA Extraction Kit (Vazyme, Nanjing, China). The quality of the extracted DNA, including its concentration, purity, and integrity, was assessed using 1% agarose gel electrophoresis and a NanoDrop spectrophotometer (ND-1000, Isogen Life Science, Utrecht, Netherlands). The DNA samples were subsequently diluted to 20 ng/μL and stored at −20 °C for further analysis.
Primer design
-
Based on the transcriptome data of bearded iris[14], the MIcro SAtellite identification tool (MISA)[15] was employed to identify SSRs. Both the 'misa.pl' and 'misa.ini' files provided by the MISA tool were utilized for SSR detection, using the default search parameters. Subsequently, Primer3[16] was utilized to design primers for SSR-containing contigs. The output from MISA served as the input for Primer3, with the process automated using Perl scripts. From the results obtained by Primer3, 110 SSR primer pairs were initially screened. The selection criteria included a PCR product size ranging from 150 to 500 bp, a melting temperature (Tm) around 60 °C, and a GC content of 40% to 60%. Among these, 55 pairs were dinucleotide repeats and 55 were trinucleotide repeats. All primers were synthesized by Sangon Biotech (Shanghai, China), and the primer sequences are listed in Supplementary Table S1.
SSR marker screening and detection
-
A total of 110 primer pairs were initially screened for PCR amplification using four randomly selected iris cultivars, including two reblooming, and two once-flowering cultivars. Ultimately, 26 primer pairs showing clear and polymorphic bands across all four cultivars were selected for fluorescently labeling and subsequent analysis. Details of the 110 primer pairs, and the 26 selected ones are provided in Supplementary Tables S1 and S2, respectively.
The PCR amplification system was as follows: every PCR reaction contained 10 μL Premix Taq™ (Code No. RR901Q, TaKaRa, Kyoto, Japan), 1 μL of DNA template (20 ng), 1 μL of forward primer (10 mM), 1 μL of reverse primer (10 mM), and 7 μL sterile distilled water, for a total volume of 20 μL. The RT–PCR cycling conditions were as follows: 3 min at 94 °C; 30 s at 93 °C; 32 cycles of 30 s at 58 °C and 72 °C for 1 min; and a final extension of 10 min at 72 °C. The amplification products were separated by 1% agarose gel electrophoresis for 12 min, then visualized and photographed under UV light.
Selected primers were labeled with a fluorescent marker (FAM) at the 5' end of the forward primer (sequence: TGTAAAACGACGGCCAGT), while the reverse primer sequence remained unchanged (Supplementary Table S2). Fluorescent-labeled primers were then used for PCR amplification of all samples, following the same reaction conditions and program.
Fluorescent capillary electrophoresis
-
The PCR products (1 μL), GeneScan™ 500 LIZ™ marker (0.5 μL, Thermo Fisher Scientific, Waltham, MA, USA), and deionized formamide (8.5 μL) were mixed and loaded into a 96-well plate. The mixture was denatured at 95 °C for 5 min, cooled on ice for a minimum of 10 min, and centrifuged at 1,000 rpm for 10 s. The plate was then loaded into a capillary electrophoresis system (3730XL Genetic Analyzer, ABI, USA) for detection. The fluorescent capillary electrophoresis fragment analysis was conducted by Sangon Biotech (Shanghai) Co., Ltd (Shanghai, China).
Statistical analysis
-
Flower diameter and plant height were measured based on three biological replicates. Data were analyzed with SPSS 23.0 (IBM Corp., Armonk, NY, USA). One-way ANOVA followed by Duncan's multiple range test was used to assess differences among samples, with a significance threshold level of p < 0.05.
Fluorescent capillary electrophoresis data were analyzed using GENEMAPPER v4.0[17]. For each SSR primer, the amplified fragment sizes across the 17 iris cultivars were recorded and subsequently arranged in decreasing size. The largest fragment was designated as allele A, followed by B, C, D, … in alphabetical order. The resulting allelic data matrix was then imported into PopGen32[18] to calculate population genetic parameters, including the number of alleles (Na), observed heterozygosity (Ho), expected heterozygosity (He), Nei's genetic distance (Nei), and Shannon's information index (I). The polymorphic information content (PIC) of each SSR locus was calculated using PIC_CALC[19]. To assess the genetic structure of the 17 bearded iris cultivars, STRUCTURE[20] was employed. K values were set from 2 to 10, with 10 independent iterations for each K. The optimal number of clusters was identified based on ΔK values calculated using the Evanno method via the Structure Harvester tool (
https://github.com/dentearl/structureHarvester ). Genetic clustering analysis was performed using NTSYSpc v2.10e[21], with dendrogram construction based on the unweighted pair group method with arithmetic mean (UPGMA). Associations between traits and SSR markers were evaluated using TASSEL 5.0[22], which employed both general linear models (GLMs), and mixed linear models (MLMs). -
A total of 29,800 SSR loci were identified from 100,391 unigenes in the bearded iris transcriptome, corresponding to an SSR occurrence frequency of 29.68%, and an average length of 15.05 bp (Supplementary Table S3). Fourteen types of repeat motifs were detected, with trinucleotide repeats representing the most diverse type (10 motif types). However, dinucleotide repeats were the most abundant, with 20,593 SSRs (69.10% of all SSRs), an occurrence frequency of 20.51%, and an average length of 14.10 bp. Trinucleotide repeats were less frequent, comprising 9,207 SSRs with an occurrence frequency of 9.17% and an average length of 16.00 bp.
Among the 20,593 dinucleotide repeats, the AG/CT motif was the most frequent (10,454, 10.41%), followed by AT/AT (6,690, 6.66%), while CG/CG repeats were relatively rare (534, 5.21%). Among the 9,207 trinucleotide repeats, AAG/CTT and AGG/CCT motifs were the most common, with 1,933 (1.93%) and 1,761 (1.75%) occurrences, respectively, whereas ACT/AGT repeats were the least frequent (159, 0.16%) (Supplementary Fig. S1).
The lengths of SSRs in the bearded iris transcriptome ranged from 12 to 24 bp (Supplementary Table S4). Repeats shorter than 15 bp accounted for 62.89%, those between 15 and 20 bp for 1.95%, and those longer than 20 bp for 35.16%. In general, SSRs with more repeat units tended to be longer, whereas longer SSRs were less abundant.
Identification and screening of core SSR primers
-
A total of 110 SSR primer pairs were initially selected for PCR amplification using four iris cultivars. The amplification products were evaluated the amplification stability and clarity through 1% agarose gel electrophoresis. Based on the quality of the amplification bands, 26 primer pairs exhibiting clear and stable bands were selected for further analysis. For instance, primer P3S41 produced distinct and stable bands during amplification (Supplementary Fig. S2). These 26 selected primers, labeled with fluorescent dyes, were further used to amplify genomic DNA from 17 bearded iris cultivars. The amplification products were subjected to fragment analysis using an ABI 3730XL Genetic Analyzer. Ultimately, eight core primer pairs were selected as optimal candidates for downstream analyses, with their sequences detailed in Table 2. These primers generated high-quality fluorescence capillary electropherograms, characterized by strong signal intensity and no interference from nonspecific peaks, demonstrating high amplification efficiency and specificity. Compared to conventional SSR techniques, this study employed fluorescent labeling combined with capillary electrophoresis, which enabled rapid, stable, and low-toxicity identification of iris cultivars. This approach offers significant advantages over traditional methods, including improved accuracy, efficiency, and reliability in cultivar identification.
Table 2. Information on eight core SSR marker primers.
Primer name Repeat unit Repeat numbers PCR amplicon lengths (bp) Primer ID Primer Sequence (5'-3') F/R Fluorescent label P2S19 AC 2 173 P2S19-F TTGTAGCTCTGCAGAAGCCC 5-FAM P2S19-R CTGAATGATGCTCCGCAACG P2S45 AT 2 201 P2S45-F CGAGCTTGTGTCTCTCTTGC 5-FAM P2S45-R GGTGACACAACGAACAAGACA P2S48 AT 2 266 P2S48-F AGCCAGGCGGTTTCAACATA 5-FAM P2S48-R TCGTGCTTTCGAGACAAGCT P3S12 AAT 3 102 P3S12-F TGACGTGGACAACTGCATCA 5-FAM P3S12-R AACAGCCTCGCAAAGCCTAT P3S17 AAT 3 262 P3S17-F TCTGCTTCAAGGCTCCATGG 5-FAM P3S17-R AGGATCTTTATCAGGCCGCG P3S28 AGA 3 208 P3S28-F AGGAGCCAACCCGAATGAAG 5-FAM P3S28-R TTGAGGCCAAGGCACATGAT P3S30 AGA 3 162 P3S30-F TAGAACCACCCTCGTCACCT 5-FAM P3S30-R CCGAGGCCTTCTCAACGAAT P3S41 AGT 3 259 P3S41-F TGCTGTTACGCCTTCACCTT 5-FAM P3S41-R AATTCCTTCTCAGCCTGGCC Currently, molecular markers have been successfully developed and applied in genetic studies of various Iris species, including I. loczyi[6], I. laevigata[23], I. ensata[24], I. brevicaulis[5], I. fulva[5], and I. germanica[13]. Within the genus Iris, particularly in I. germanica, prolonged artificial selection and cultivation have led to a continuous increase in the number of cultivars, accompanied by a rising degree of similarity among them. This has rendered traditional morphological classification increasingly inadequate for accurately distinguishing subspecies and specific cultivars. In this context, molecular marker technologies have emerged as powerful tools for the exploration of I. germanica resources, cultivar identification, and breeding improvement. Studies have shown that Iris species and cultivars generally exhibit high levels of genetic diversity. Such genetic diversity is the product of long-term evolutionary processes and underpins the species' ability to adapt to diverse ecological environments and expand its geographic range[25]. This characteristic aligns well with the broad ecological adaptability observed across Iris species. However, since only 17 cultivars were tested, the representativeness of the selected core SSR primers across the wider spectrum of bearded iris germplasm remains uncertain. Additional validation with larger and more diverse cultivar sets will be required to ensure their universal applicability.
Genetic diversity analysis using core SSR primers
-
The genetic diversity of 17 bearded iris cultivars was assessed using eight core SSR primers, resulting in the identification of 43 alleles. The number of alleles detected per primer ranged from 3 to 9, with an average of 5 (Table 3). The Ho ranged from 0.2280 to 0.8077, with a mean of 0.5877, while the He ranged from 0.1500 to 0.8095, with a mean of 0.4759. Nei ranged from 1.0943 to 1.9982, with a mean of 1.3203. The I varied between 1.0232 and 1.9982, averaging 1.3203. The PIC ranged from 0.5072 to 0.6986, all exceeding 0.5, with an average of 0.6228. Overall, these results demonstrated that the eight SSR core primers exhibited high polymorphism and genetic diversity, making them suitable for analyzing the genetic diversity of Iris germplasm. These findings are consistent with those reported by Zhang et al.[26] in their study on I. germanica cultivars.
Table 3. Genetic diversity analysis of bearded iris cultivars based on eight core SSR markers.
Marker Na Ho He Nei I PIC P2S19 5 0.5294 0.6934 0.6730 1.2830 0.6210 P2S45 9 0.8095 0.8606 0.8401 1.9982 0.8226 P2S48 5 0.3810 0.7619 0.7438 1.4294 0.6986 P3S12 6 0.7619 0.5784 0.5646 1.1331 0.5235 P3S17 3 0.1500 0.6808 0.6638 1.0943 0.5897 P3S28 6 0.1579 0.7496 0.7299 1.4915 0.6916 P3S30 4 0.4615 0.6062 0.5828 1.0232 0.5072 P3S41 5 0.5556 0.6079 0.5910 1.1095 0.5279 Mean 5 0.4759 0.6924 0.6737 1.3203 0.6228 Note: Na, number of alleles; Ho, observed heterozygosity; He, expected heterozygosity; Nei, Nei's genetic distance; I, Shannon's information index; PIC, polymorphic information content. The high genetic diversity among these iris cultivars may be attributed to their broad introduction, complex cultivation history, and extensive artificial hybridization. The rich genetic variation accumulated during the breeding process provides a robust foundation for the formation of diversity[27]. Consistent with previous studies on other horticultural plants, the SSR primers selected in this study proved to be highly effective and reliable in revealing the genetic diversity of Iris germplasm[28,29]. Furthermore, the results expand the potential application of SSR molecular markers in horticultural plants, offering a solid scientific foundation for the conservation, utilization, and breeding of Iris germplasm. Although high levels of polymorphism and genetic diversity were detected, the relatively restricted sample size may have led to an underestimation of rare alleles or subtle population structures within the broader iris germplasm. Future work incorporating more cultivars may reveal additional layers of genetic variation.
Genetic relationship and clustering analysis of 17 bearded iris cultivars
-
Using the eight core SSR primers, 39 polymorphic bands were amplified by capillary electrophoresis across 17 bearded iris cultivars. Each band was assigned a sequential number from 1 to 39. For each cultivar, the presence or absence of bands was coded as 1 or 0, respectively, resulting in a binary (0,1) matrix. This matrix represented a 39-bit molecular identification (ID) (Table 4).
Table 4. Binary (0,1) matrix representing molecular IDs of 17 bearded iris cultivars.
Band Cultivar 1 2 3 4 5 6 7 8 9 10 11 12 13 14 15 16 17 Band 1 0 0 0 0 0 0 0 0 0 0 0 1 0 0 1 1 1 Band 2 1 1 1 0 0 1 1 1 1 1 1 0 1 0 0 0 0 Band 3 0 0 0 0 0 0 0 0 0 0 0 0 0 0 0 0 0 Band 4 0 0 0 0 0 0 0 0 0 1 0 0 0 0 0 0 0 Band 5 0 0 0 0 0 0 0 0 0 0 0 1 0 0 0 0 0 Band 6 0 0 1 0 0 1 0 0 0 0 1 0 0 0 1 0 0 Band 7 0 0 0 0 0 0 1 0 0 0 0 0 0 0 0 0 0 Band 8 1 0 0 0 0 0 0 0 0 1 0 1 0 0 0 1 0 Band 9 0 0 1 1 1 0 0 1 1 0 0 0 0 1 1 0 1 Band 10 0 1 0 0 0 1 0 0 0 0 1 0 0 0 0 0 0 Band 11 0 0 0 0 0 0 0 0 1 0 0 0 1 0 0 0 0 Band 12 1 1 1 0 0 0 0 0 0 0 0 0 0 0 0 0 0 Band 13 0 0 0 0 0 0 0 0 0 0 1 1 0 0 0 1 0 Band 14 1 0 0 0 1 1 0 0 0 0 0 0 0 1 1 0 0 Band 15 0 1 1 0 0 0 0 0 0 1 0 0 0 0 0 0 0 Band 16 0 0 0 1 0 0 1 0 0 0 0 0 0 0 0 0 0 Band 17 0 0 0 0 0 0 0 0 0 1 0 0 0 0 0 0 0 Band 18 0 1 1 0 1 0 0 0 1 0 1 1 0 1 1 0 1 Band 19 1 1 1 0 1 0 0 0 0 0 0 0 0 1 0 1 1 Band 20 0 0 1 1 0 0 0 0 0 0 1 0 0 1 1 0 0 Band 21 1 0 0 1 1 0 1 1 1 1 1 0 0 0 0 1 0 Band 22 1 0 1 0 0 0 1 0 1 0 1 1 0 1 1 1 1 Band 23 1 1 0 0 1 1 1 1 0 0 1 1 1 1 1 0 0 Band 24 0 0 0 0 0 0 0 0 0 0 0 0 0 0 0 0 0 Band 25 1 1 0 0 1 1 1 0 0 0 0 0 0 1 0 1 0 Band 26 0 0 0 0 0 0 0 0 0 0 0 0 0 0 0 0 0 Band 27 1 1 1 1 1 1 1 1 1 1 1 1 1 1 1 1 1 Band 28 0 0 1 0 0 0 0 0 0 1 0 0 1 0 1 0 1 Band 29 0 0 0 0 0 0 0 0 0 0 0 0 0 0 0 0 0 Band 30 0 0 0 0 0 0 1 0 0 0 0 0 0 0 0 0 0 Band 31 0 0 0 0 0 0 0 0 0 0 0 0 0 0 0 1 0 Band 32 0 0 0 0 0 0 0 0 0 0 0 0 0 0 0 0 1 Band 33 0 1 1 1 1 1 0 1 1 0 1 0 0 0 1 0 0 Band 34 1 1 1 1 1 1 1 1 1 1 1 1 0 0 0 0 0 Band 35 0 0 0 0 0 0 0 0 0 0 0 0 0 0 0 1 0 Band 36 0 0 0 0 0 0 1 0 0 0 0 0 0 0 0 0 0 Band 37 0 0 0 0 0 1 0 0 0 0 0 0 0 0 0 0 0 Band 38 0 0 0 0 0 0 0 1 0 1 1 1 0 1 1 0 1 Band 39 0 0 0 0 0 1 1 0 1 0 0 0 1 0 0 0 0 The genetic structure of the 17 bearded iris cultivars was analyzed using STRUCTURE software based on SSR markers. The optimal number of genetic clusters was determined to be K = 4, as this value corresponded to the highest ΔK, indicating the most likely population structure (Fig. 2a). At K = 4, most cultivars exhibited admixed genetic backgrounds without clear differentiation, although slight variations were observed in some individuals (e.g., CCs 7 and 8) (Fig. 2b). These results highlight the overall genetic composition and admixture patterns among the cultivars.
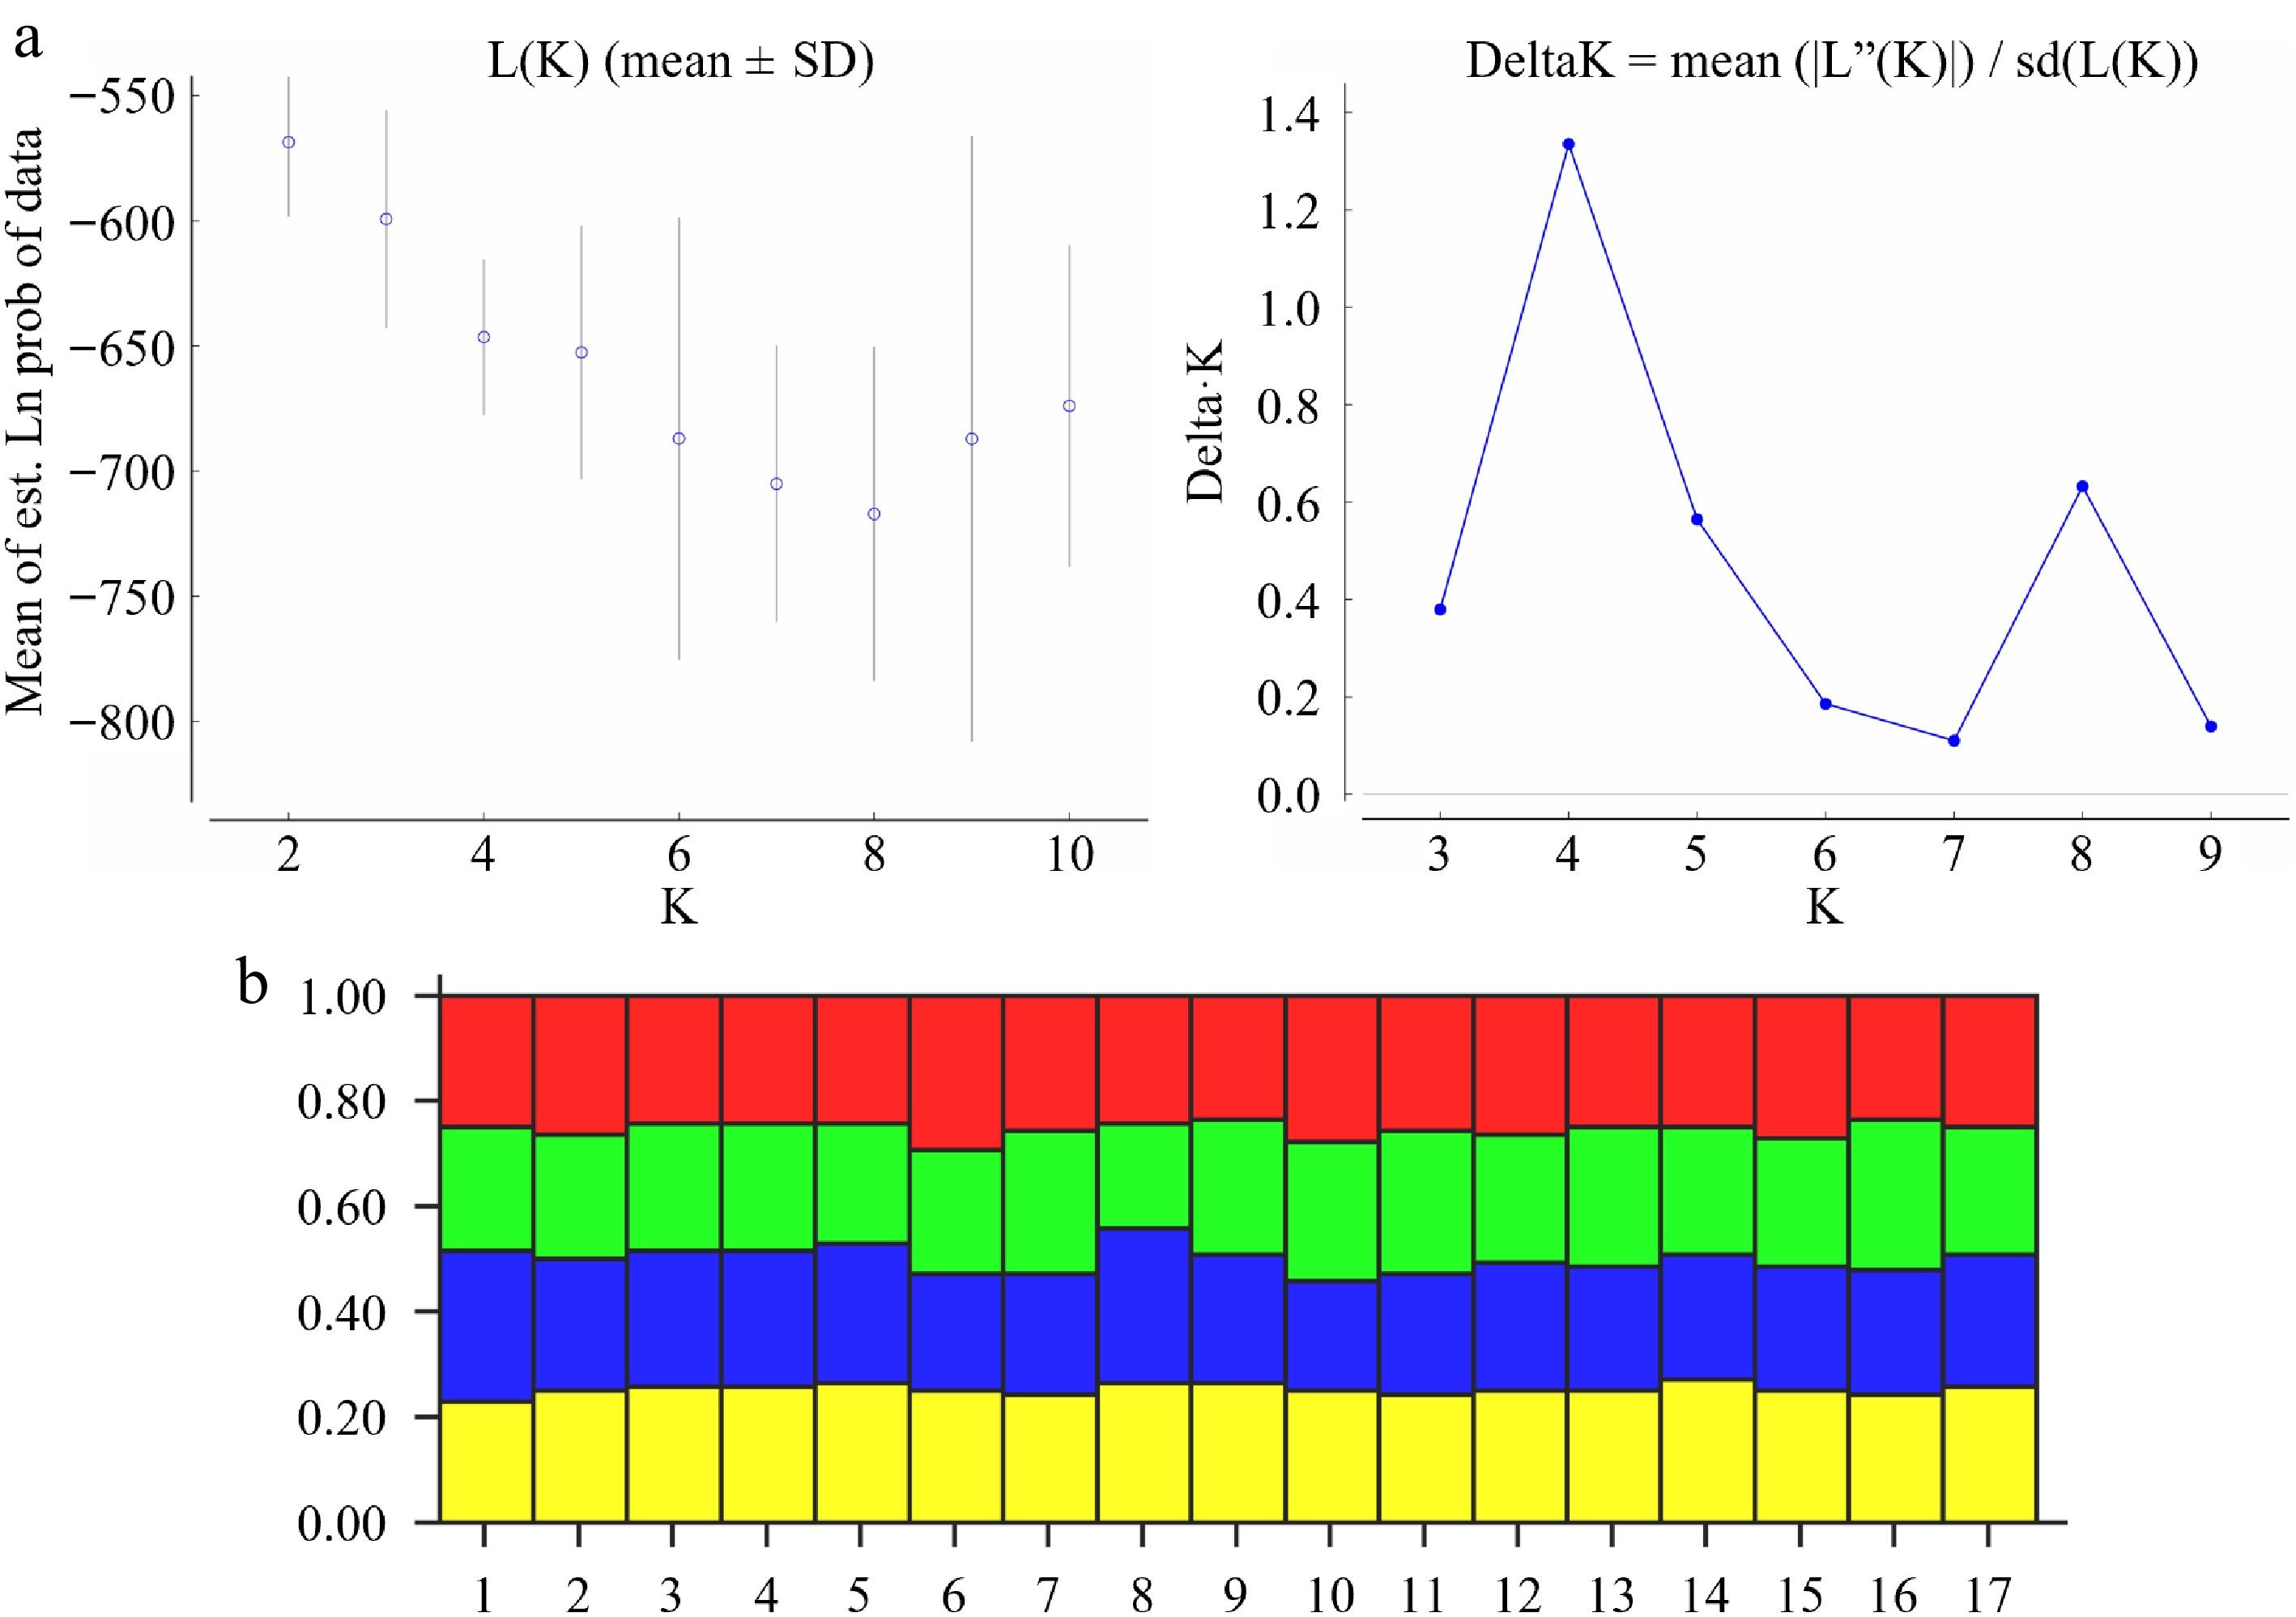
Figure 2.
Population structure of 17 bearded iris cultivars. (a) Estimation of sub-population number. The left figure presents ln (data probability) vs K (2–10), and the right figure illustrates sub-population number against delta K. (b) Population structure analysis of 17 bearded iris cultivars. Cultivar codes 1 to 17 correspond to the 17 bearded iris cultivars listed in Table 1.

Figure 3.
Cluster analysis of 17 bearded iris cultivars. Cultivar codes 1 to 17 correspond to the 17 bearded iris cultivars listed in Table 1. The clustering was performed based on the genetic relationships revealed by SSR fluorescence molecular markers. Genetic clustering analysis was performed using NTSYSpc v2.10e, with dendrogram construction based on the unweighted pair group method with arithmetic mean (UPGMA).
To validate the clustering pattern and explore genetic relationship, UPGMA-based hierarchical clustering was performed. At a relative genetic distance of 0.43, the 17 bearded iris cultivars were divided into four distinct groups (Fig. 3). Group I comprised nine cultivars (CCs 1–9), all of which exhibited reblooming traits; Five cultivars (CCs 11, 12, 14, 15, and 17) clustered into Group II, while two cultivars (CCs 10 and 13) clustered into Group III. Group IV was represented solely by 'Fufted Cloud' (CC 16), which formed an independent cluster. Notably, Groups II, III, and IV consisted of once-flowering cultivars. These clustering results suggest a significant association between blooming periodicity traits and genetic relationships among the iris cultivars. The eight core SSR primers effectively distinguished reblooming iris cultivars from once-flowering cultivars, supporting the feasibility of molecular markers for analyzing reblooming traits.
The clustering analysis also revealed significant genetic diversity among once-flowering cultivars. For instance, 'Fufted Cloud' formed an independent group, suggesting its unique genetic background or specific breeding history compared to other once-flowering cultivars. This uniqueness may be attributed to its distinct genetic composition, potentially involving specific gene combinations that differentiate it from other once-flowering cultivars. Such genetic distinctiveness could be linked to its morphological or physiological traits, such as flower size, color, or environmental adaptability. This finding aligns with previous studies highlighting the genetic complexity and diversity within iris cultivars[30,31].
It is noteworthy that the 17 bearded iris cultivars analyzed in this study included nine well-established reblooming varieties, such as 'Peach Jam' (No. 8), which was previously documented by Tian et al.[13]. To minimize the potential impact of the environment on phenotype, all plant materials were cultivated under controlled conditions. Furthermore, DNA-based molecular markers are largely unaffected by environmental influences and are characterized by high polymorphism, thereby offering a robust approach for reducing environmental bias[32]. The use of core SSR markers combined with cluster analysis effectively differentiated reblooming and once-flowering cultivars and revealed distinct clustering patterns reflecting their underlying genetic relationships. It should also be noted that the clustering patterns observed here were based on a limited number of cultivars. With broader sampling, the boundaries between groups may shift, and additional subgroups might be detected, providing a more refined picture of the genetic structure.
Association analysis of SSR markers with the reblooming trait in Iris
-
Association analyses between SSR molecular markers and the reblooming trait, flower diameter, and plant height of 17 bearded iris cultivars were conducted using the GLM and MLM models. The phenotypic traits of the bearded iris cultivars during the blooming period are summarized in Table 5. Specifically, the cultivars numbered 1–9 are reblooming types, whereas cultivars 10–17 are once-flowering types. Among these 17 cultivars, flower diameter ranges from 8.6 to 12.5 cm, and plant height ranges from 42.3 to 99 cm. Quantile-quantile (QQ) plots were generated to visualize the results of the association analyses.
Table 5. Phenotypic traits of bearded iris cultivars during blooming.
Cultivar code Reblooming statusa Flower diameter (cm)b Plant height (cm)c 1 1 10.3 ± 0.3cde 61.8 ± 0.8cd 2 1 10.2 ± 0.6cdef 70.2 ± 1.6bc 3 1 10.3 ± 0.6cde 70.0 ± 16.6bc 4 1 9.5 ± 0.1ef 42.3 ± 4.5e 5 1 10.5 ± 0.4cde 62.0 ± 6.2bcd 6 1 12.5 ± 0.7ab 77.7 ± 4.2b 7 1 10.8 ± 0.5bcde 53.3 ± 4.8de 8 1 11.0 ± 0.4bcde 92.3 ± 7.4a 9 1 13.8 ± 0.9a 99.0 ± 9.2a 10 0 10.0 ± 1.1def 66.3 ± 8.5bcd 11 0 11.3 ± 0.6bcd 70.7 ± 1.7bc 12 0 8.6 ± 0.3f 66.7 ± 1.8bcd 13 0 11.5 ± 0.1bcd 62.0 ± 7.4bcd 14 0 9.8 ± 1.7def 72.3 ± 1.2bc 15 0 11.3 ± 0.2bcde 65.3 ± 1.7bcd 16 0 11.7 ± 0.2bc 60.3 ± 2.5cd 17 0 11.5 ± 0.4bcd 60.0 ± 6.4cd a 1 indicates a reblooming cultivar, while 0 indicates a once-flowering cultivar. b The average maximum flower diameter of three biological replicates. c The average maximum plant height of three biological replicates. Different letters indicate significant differences at p < 0.05, following statistical analysis by ANOVA. The GLM analysis revealed a significant association between the SSR marker P2S19 and the reblooming trait (p < 0.05), whereas no significant association was detected using the MLM model (Fig. 4a and b). This discrepancy may arise from differences in the characteristics of the two models. The GLM model exhibits higher sensitivity for small sample populations, facilitating the detection of potential associations; however, it is also prone to false positives. In contrast, the MLM model accounts for population structure and kinship effects, thereby reducing the likelihood of false positives, but it is more suitable for large sample sizes and may have reduced sensitivity in small populations[33]. The significant association of P2S19 suggests that it may reside in a key genetic region regulating the reblooming trait. This finding warrants further verification through the construction of high-density genetic maps or genome-wide association studies (GWAS). No SSR markers were identified as being significantly associated with flower diameter or plant height, which may reflect the complex genetic architecture underlying these traits.
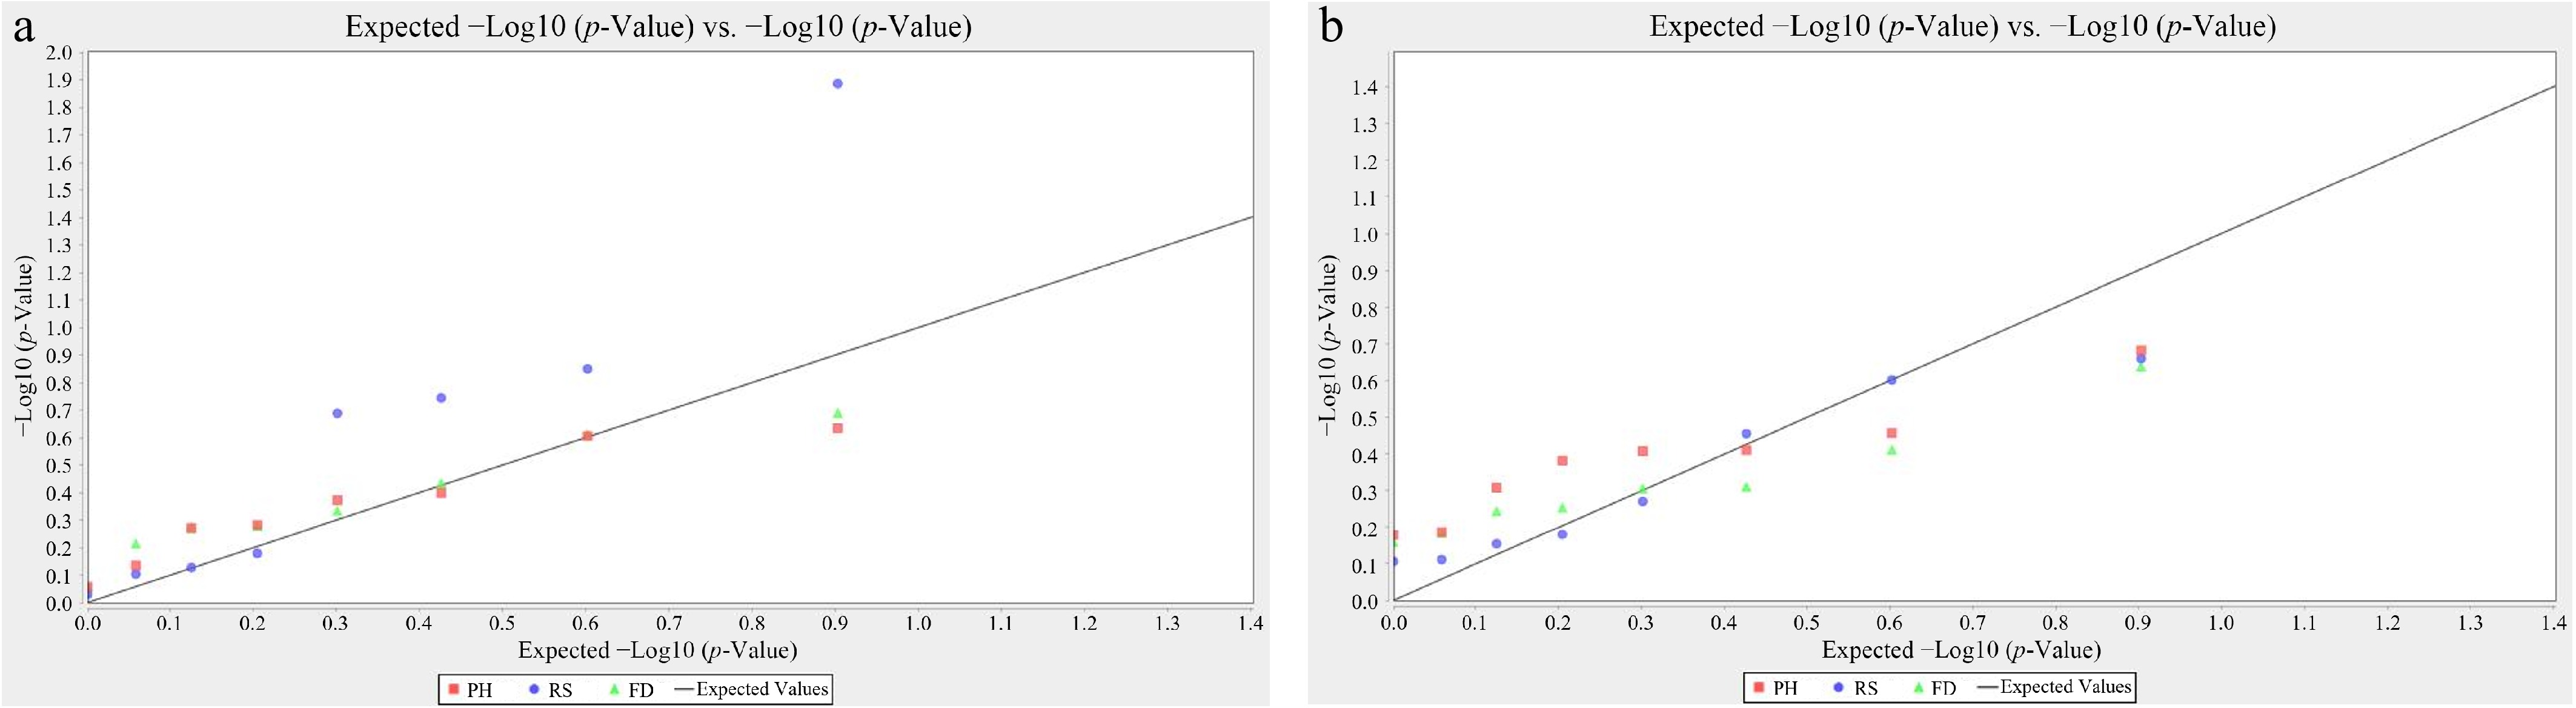
Figure 4.
Quantile-quantile plot of the association analysis for the reblooming trait in bearded iris cultivars. (a) The generalized linear regression model (GLM). (b) The mixed linear model (MLM). RS, Reblooming Status; FD, Flower Diameter; PH, Plant Height.
Despite the limited number of SSR markers significantly associated with the reblooming trait identified in this study, the credibility of the present findings remains robust. The genetic mechanism underlying the reblooming phenotype is likely highly complex, potentially involving the coordinated regulation of multiple genes and the contribution of rare or low-frequency alleles. Tian et al.[13] conducted a genetic diversity analysis of 25 I. germanica cultivars using EST-SSR markers, and identified 22 primer pairs with high polymorphism, of which 50% were significantly associated with nine phenotypic traits. However, although their study documented the blooming types of the cultivars, it did not include an association analysis specifically targeting the reblooming trait—possibly due to the absence of detectable correlations.
In the present study, 110 SSR primer pairs were screened and eight core markers with high levels of polymorphism (average PIC = 0.6228) selected, which successfully distinguished all 17 tested cultivars, including a clear separation between reblooming and once-flowering types. Notably, one of these markers showed a significant association with the reblooming trait. Compared to previous studies, the present research provides a novel perspective by focusing on molecular marker identification related to the reblooming trait in Iris, laying a preliminary foundation for understanding its genetic basis. The findings offer valuable theoretical support for marker-assisted selection and genetic improvement of Iris, and present a promising strategy for the molecular breeding of other reblooming ornamental plants. The ability of SSR markers to distinguish reblooming from once-flowering cultivars, as demonstrated by clustering analysis, further highlights their potential to facilitate breeding programs aimed at enhancing desirable traits, such as prolonged flowering duration. Given the restricted sample size, the statistical power of association analysis was limited, which may partly explain why only one marker (P2S19) showed a significant correlation with the reblooming trait. Future research should incorporate larger and more geographically diverse cultivar sets, employ a greater density of molecular markers (e.g., SNP-based genotyping or additional SSRs), and integrate detailed phenotypic data. Such approaches will enhance the robustness of diversity estimates, provide a more comprehensive understanding of the genetic architecture of Iris germplasm, and improve the power of trait–marker association analyses.
-
This study systematically evaluated the genetic diversity and established genetic relationships among 17 bearded iris cultivars using SSR marker analysis. A total of 29,800 SSR loci were identified from transcriptome data, providing abundant resources for molecular marker development. Among these, dinucleotide repeats (particularly AG/CT and AT/AT) were the most prevalent, while trinucleotide motifs such as AAG/CTT and AGG/CCT were common but less abundant. Through the screening of 110 SSR primers derived from these loci, eight core primers were identified as highly polymorphic and effective in differentiating reblooming from once-flowering cultivars. Notably, the SSR marker P2S19 was significantly associated with the reblooming trait (p < 0.05), suggesting its potential linkage to genomic regions regulating the reblooming trait. The integration of transcriptome-derived SSR identification, fluorescent capillary electrophoresis, and association analysis not only enhances our understanding of Iris genetics but also demonstrates the practical utility of SSR markers in germplasm identification, genetic diversity assessment, and molecular breeding. These findings provide a solid genomic and technical foundation for the improvement and conservation of bearded iris cultivars.
This research was funded by the Zhejiang Sci-Tech University Start-up Fund (Grant No. 24052162-Y), the general project of the Zhejiang Provincial Department of Education (Y202456763), the agricultural scientific research project from Hangzhou Science and Technology Bureau (Grant No. 20191203B81), and the National Natural Science Foundation of China (NSFC, Grant No. 31901352).
-
The authors confirm contributions to the paper as follows: study conception and design: Li D, Xia Y; data collection, analysis and interpretation of results: Shao L, Xu T, Wang X, Zhang R, Cui Y, Ren Z; draft manuscript preparation: Shao L; review of the manuscript: Li D, Xia Y, Zhou H, Zhang J. All authors reviewed the results and approved the final version of the manuscript.
-
All data generated or analyzed during this study are included in this published article and its supplementary information files.
-
The authors declare that they have no conflict of interest.
- Supplementary Table S1 Primers used for preliminary screening of SSR markers.
- Supplementary Table S2 Primers used for the second-round screening of SSR markers.
- Supplementary Table S3 Summary of SSR motif types identified in the bearded iris transcriptome.
- Supplementary Table S4 Distribution of SSR motif lengths in the bearded iris trancriptome.
- Supplementary Fig. S1 Characterization of repetitive motifs of SSR loci in the bearded iris transcriptome.
- Supplementary Fig. S2 PCR amplification profiles of 17 bearded iris cultivars using primer P3S41. The 'M' above the lanes represents a 500 bp DNA marker, while cultivar codes 1 to 17 correspond to the 17 bearded iris cultivars listed in Table 1.
- Copyright: © 2025 by the author(s). Published by Maximum Academic Press, Fayetteville, GA. This article is an open access article distributed under Creative Commons Attribution License (CC BY 4.0), visit https://creativecommons.org/licenses/by/4.0/.
-
About this article
Cite this article
Shao L, Xu T, Wang X, Zhang R, Cui Y, et al. 2025. Genetic diversity and association analysis of the reblooming trait in bearded iris cultivars using SSR fluorescent markers. Technology in Horticulture 5: e040 doi: 10.48130/tihort-0025-0035 

Genetic diversity and association analysis of the reblooming trait in bearded iris cultivars using SSR fluorescent markers
- Received: 10 February 2025
- Revised: 11 October 2025
- Accepted: 15 October 2025
- Published online: 15 December 2025
Author Correction to this article was published on 31 March 2026, http://doi.org/doi.org/10.48130/tihort-0026-0006.
Abstract: Reblooming is a highly desirable trait in ornamental plants as it extends the flowering period and enhances horticultural value. This study investigated the genetic relationships of 17 bearded iris cultivars, comprising nine reblooming, and eight once-flowering cultivars. Transcriptome-wide screening identified 29,800 Simple Sequence Repeat (SSR) loci from 100,391 unigenes, with an occurrence frequency of 29.68%. Dinucleotide repeats were the most abundant (69.10%), predominantly AG/CT and AT/AT motifs, while trinucleotide repeats accounted for 30.90%, mainly AAG/CTT and AGG/CCT motifs. From 110 SSR primers designed based on these loci, eight highly polymorphic primers were selected, detecting 43 alleles with polymorphic information content (PIC) values ranging from 0.5072 to 0.6986 (average 0.6228). These markers effectively distinguished between reblooming and once-flowering cultivars, enabling the construction of molecular fingerprints and a cluster dendrogram for the 17 cultivars. Association analysis revealed that one SSR marker (P2S19) was significantly correlated with the reblooming trait. Together, these findings provides valuable insights for understanding reblooming regulation and facilitate the molecular breeding of reblooming iris cultivars.
-
Key words:
- Bearded iris /
- Reblooming /
- SSR fluorescent markers /
- Association analysis /
- Genetic diversity analysis