


-
Pears, belonging to the Rosaceae family, are the fifth most significant fruit species in terms of production, with a global yield of approximately 25 million metric tons for the 2023/2024 season, and 1.81 million metric tons in the European Union[1]. Their market importance is reflected in breeding efforts and the development of new cultivars adapted to changing environmental conditions[2,3]. Pears are classified into 75–80 species and interspecific hybrids[4] distributed across temperate zones worldwide. Most species can hybridize with each other, offering great breeding potential. Another advantage is their highly heterogeneous genome, supported by self-incompatibility and a whole-genome duplication approximately 30 million years ago, which enables further molecular-level adaptations. Understanding the pear genome and interspecific differences assists breeders in selecting parents for new cultivars.
Molecular markers provide valuable information ranging from evolutionary and population studies to species and cultivar identification. Today, Simple Sequence Repeats (SSR) and Single Nucleotide Polymorphism (SNP) markers are the most commonly used, and several comparative studies have assessed their usefulness[5,6]. Results from basic population studies (PCA, Structure) are generally consistent for both marker types[7]. Typically, 3–10 SNPs per SSR are required to retain equivalent information content[6], as SNPs are usually biallelic, while a single SSR can have more than 10 alleles. Although SSR markers are popular for their simplicity and higher information per locus, SNPs are valued for robustness and chromosome-wide coverage. The lower mutation rate of SNPs further enhances data stability.
Several SSR marker sets have been developed to study pear diversity. While most are applicable across Pyrus, some target Asian[8] or European varieties[9]. The first genotyping set was assembled by the European consortium (ECPGR)[10] and later revised[11]. The original ECPGR set of 17 dinucleotide SSR markers was reduced to 12 markers grouped into three multiplex PCR reactions. Although it achieved high expected heterozygosity (0.81), it was technically demanding due to frequent stutter peaks and the need for careful allele binning. Therefore, another genotyping set was developed under the USPGR initiative[12], using 10 markers with longer repeat motifs (up to 8 bp), which are more stable and less prone to artifacts. All markers are amplified in a single multiplex reaction, simplifying laboratory procedures but lowering heterozygosity (0.60). Microsatellites are still used today for the characterization of Hungarian[13], Italian[14], Turkey[15], or the Canary Island[16] germplasm. Some SSR markers originate from the closely related genus Malus, and new ones continue to be identified in silico[17].
SNP markers offer the advantage of experimental design tailored to specific research goals and resources. The reference sequences for European cultivars such as Pyrus communis 'Bartlett'[18] or 'd'Anjou'[19], and Asian pears like Pyrus pyrifolia 'Nijisseiki'[20], Pyrus bretschneideri 'DangshanSuli'[8], and Pyrus betulifolia[21] significantly simplify this process. SNPs are suitable for constructing linkage maps[22], exploring population diversity[6], or reconstructing pedigrees[23], within or across species, with the required number of SNPs depending on the study's purpose. Based on available resources, SNPs can be obtained through sequencing, reduced-representation methods such as Genotyping by Sequencing[24−27], or Genotyping Arrays like the Axiom Pear 70K Array[28], or via Genotyping-in-Thousands by Sequencing (GT-seq).
Although SNP genotyping technologies are widely available, no small-scale SNP marker panel for Pyrus exists that is suitable for cultivar identification. GT-seq combines targeted amplification in a single multiplex reaction with Illumina sequencing[29]. This cost-effective and flexible method allows primers to be easily exchanged or updated. Amplicon sequencing using GT-seq is now being applied in various areas, including the monitoring of genetic diversity[30], individual identification[31], and genotyping[32].
This study aimed to analyze population structure and identify or verify parent–offspring and full-sibling relationships in a germplasm collection of more than 400 pear (Pyrus spp.) accessions, primarily Pyrus communis. For these purposes, detailed genomic information was obtained through partial whole-genome sequencing using ddRAD libraries. A further objective was to develop two complementary genotyping tools: (i) a panel of abSNPs with the potential to distinguish pear types (Asian, European, and hybrids), and discriminate among European cultivars; and (ii) a set of 17 SSR markers, one from each pear chromosome. Both tools were designed for genotyping in a single PCR reaction while maintaining a very low probability of random matches between distinct genotypes. Finally, the performance of these genotyping methods was compared in terms of their usability for diverse applications, including genotyping, clone identification, and parentage analysis.
-
A set of 445 pear accessions, including European, Asian, and interspecific hybrids, was selected from the Collection of Genetic Resources (CGR) of the Research and Breeding Institute of Pomology Holovousy, Ltd.(RBIPH), and two companies under the assurance of source anonymity (Supplementary Data S1).
Genomic DNA was isolated from leaves using the Exgene Plant SV isolation kit (GeneAll) according to the manufacturer's instructions. An Invitrogen Qubit Fluorometer was used to assess DNA quality.
ddRAD library and sequencing
-
Python script Digital_RADs.py (
https://github.com/BU-RAD-seq ) was used to determine the conditions for library preparation based on in silico digestion of the reference sequence. The modified MiddRAD protocol[33] was used for GBS library preparation. Briefly, 300 ng of genomic DNA was double-digested with AvaII (10,000 U/ml, NEB, Cat#: R0153L) and MspI (20,000 U/ml, NEB, Cat#: R0106S). The barcoded adapters[34] were annealed and ligated. The digested and ligated DNA from 12 samples was pooled in a 1:1 ratio. To reduce the volume, the pooled DNA was purified using AMPure XP SPRI beads (Beckman Coulter, Cat#: A63881) in a 2x reaction volume and eluted to 65 μL. A 30 μL aliquot of the pooled and purified DNA was size-selected on a BluePippin BR02776 instrument using BluePippinTM 1.5% Agarose Gel Cassettes, Dye-Free, with internal standards of 250 bp to 1.5 kb (Sage Science, Cat#: BDF1510). The size selection range was set from 300 to 400 bp. The PCR reaction mix included: 16.75 μL of size-selected DNA, 1.25 μL PCR1 primer, and 1.25 μL indexed PCR2 primer (each 10 μM)[34], 5 μL Q5 Reaction Buffer (5x), 0.25 μL Q5 High-Fidelity DNA Polymerase (2 U/μL), and 0.5 μL dNTPs (10 mM). The amplification protocol involved an initial denaturation at 98 °C for 30 s, followed by 10 cycles of denaturation at 98 °C for 10 s, annealing and extension at 72 °C for 30 s, and a final extension at 72 °C for 2 min. The reaction was maintained at 4 °C until further use. Libraries were sequenced on NovaSeq 6000 (Illumina), producing 2 × 150-bp paired-end reads.Variant calling
-
Re-indexed raw data were demultiplexed by barcodes using the process_radtag script included in stacks v. 2.62[35]. Demultiplexed fastq data were quality filtered (-q 30) and barcode sequences from read 1 were removed using fastp[36]. Quality-filtered data were mapped to the reference of the first haplotype of Pyrus communis d'Anjou Genome v2.3. a1[19] with BWA-MEM v0.7.15[37], and non-uniquely mapped reads were removed. The Asian accessions were mapped in the same way on the reference sequence from Pyrus pyrifolia, variety 'Nijisseiki'[20]. The resulting alignments were processed using GATK v4.4.0.0 software[38] with HaplotypeCaller and CombineGVCFs tools to call variants. SNPs filtering for the minimum read depth 8, minor allele frequency (MAF < 0.01), and missing genotypes (0.95) was carried out using vcftools v0.1.16[39]. Samples missing more than 10 % of SNPs were then removed. For the elimination of SNPs in strong linkage, the SNPs were pruned for pairwise linkage disequilibrium (LD) in Plink v2.0[40]. Pruned SNPs had an r2 < 0.2 with any other SNP within a 50-SNP sliding window and a step size of five SNPs.
Population analysis and genetic diversity
-
Two population genetic analyses, STRUCTURE[41] and principal component analysis (PCA), were performed using SNPs pruned for LD. The STRUCTURE software implemented via the structure_multi_1_submitter.sh script (
https://github.com/V-Z/structure-multi-pbspro ) was used to infer the population structure through a Bayesian approach. Ancestry fractions were estimated using a no-admixture model for K values ranging from 2 to 20, with 10 independent runs conducted for each K value. The output graphs were ordered using a phylogenetic tree. The SNPhylo[42] pipeline was used for the phylogenetic analysis from non-pruned SNPs with default settings. A phylogenetic tree was rooted at the midpoint and created using the ʀ package ɢɢᴛʀᴇᴇ[43]. PCA was performed using Plink v2.0. Identity by Descent and kinship matrix were compounded using Plink v1.9, v2.0, and the ʀ package SNPRelate. A statistical program, nQuire[44], was used to determine ploidy based on the ratio of allele depths in heterozygous variants.The kinship coefficient (Kin) and the probability of zero IBD (π0) were calculated from SNPs pruned for linkage disequilibrium using the ʀ package SNPRelate. The threshold for clone detection was established using genotypes identical by name. Thresholds for first- and second-degree relationships, as well as for distinguishing parent–offspring (PO) from full-sibling (FS) relationships, were determined based on known duos and trios (Supplementary Data S2), with reference to values from the literature[45]. All graphs were constructed in R using the ɢɢᴘʟᴏᴛ2 package, and the network of first-degree relationships was generated with the igraph package.
Primer design, sequencing, and data processing for AbSNP markers
-
A total of 7,361 SNPs pruned for linkage disequilibrium in 308 samples were considered for primer design. Using an in-house R script, analyses were performed on all samples together and, separately, on the Asian group, the European groups E1 and E2, and the European–Asian hybrid group. SNPs were excluded if the proportion of heterozygous genotypes exceeded 50% and the proportion of homozygous genotypes for either the reference or the alternate allele was below 20%. Variants exhibiting homozygous differences were identified across all pairwise sample combinations, excluding pairs with Kin greater than 0.3535. Candidate SNPs were then ordered along chromosomes according to their frequency of occurrence across informative sample combinations to select a minimal set distributed genome-wide; three SNPs were chosen for each combination. Unique SNPs from the five analyses were merged into a single set, and an additional check—again using an in-house R script—verified homozygous differences across all sample combinations and confirmed an even chromosomal distribution.
Primer design for a single multiplex reaction was carried out with the Python script NGS_primerplex.py included in the NGS-PrimerPlex toolkit[46], using sequences from the first haplotype of the Pyrus communis 'd'Anjou' Genome v2.3.a1[19]. Primers targeted an amplicon length of ~200 bp with an optimal melting temperature of 60 °C and were screened for non-target hybridization. After primer design, homozygous differences across all sample combinations were re-evaluated to confirm marker performance.
To select the primer sequences (Supplementary Data S3), the Illumina overhang adapters 5'-TCGTCGGCAGCGTCAGATGTGTATAAGAGACAG and 5'-GTCTCGTGGGCTCGGAGATGTGTATAAGAGACAG were appended to each forward and reverse primer, respectively. The primers were diluted to a concentration of 100 μM and pooled equally into one supermix. The first PCR reaction mix in a final volume of 10 μL included: 3 μL of DNA (40 ng), 2 μL primer pool (50 nM per primer), and 5 μL 2x Multiplex PCR Master Mix (QUIAGEN). The amplification protocol involved initial denaturation at 95 °C for 15 min, followed by eight cycles of denaturation at 95 °C for 30 s, 0.4 °C/s ramp rate to annealing at 57°C for 10 s, and extension at 72 °C for 2 min. Then by 16 cycles of denaturation at 95 °C for 30 s, annealing at 57 °C for 30 s, and extension at 72 °C for 30 s, and a final extension at 68 °C for 10 min. The reaction was then held at 4 °C for preservation. All reactions were purified using 0.7x reaction volume of AMPure XP SPRI beads (Beckman Coulter, Cat#: A63881) according to the manufacturer's protocol, and eluted to 7 μL. The second PCR reaction in the final volume of 10 μL included: 6.7 μL purified PCR product, 1 μL uniquely indexed primers pair IDT for Illumina DNA/RNA UD Indexes, Sets A-B (#20091654, #20091656), 0.2 μL NTPs (10 mM), and 0.1 μL Q5 High-Fidelity DNA Polymerase with 5 μL 5X Q5 Reaction Buffer (NEB #M0491S, New England Biolabs). The amplification protocol involved initial denaturation at 98 °C for 1 min, followed by 10 cycles of denaturation at 98 °C for 10 s, annealing at 65 °C for 30 s, extension at 72 °C for 30 s, and a final extension at 72 °C for 5 min. The reaction was then held at 4 °C for preservation. All reactions were purified using a 0.7x reaction volume of AMPure XP SPRI beads (Beckman Coulter, Cat#: A63881) and eluted to 10 μL. Libraries were sequenced on NovaSeq X Plus (Illumina), producing 2 × 150-bp paired-end reads.
Raw sequencing data were reindexed and trimmed by quality using fastp[36]. Paired reads were merged using Pear v. 0.9.11 with a minimal overlap of 50 bp and mapped to the reference of the first haplotype of Pyrus communis d'Anjou Genome v2.3. a1[19] with BWA-MEM v0.7.15[37]. Uniquely mapped reads were used for variant calling using bcftools v.1.21 with the command mpileup and call. Population and relationship analyses were processed in the same manner as for the ddRAD dataset, except for the phylogenetic tree, which was created using VCF2PopTree software[47] with the Genetic Distance setting and the Neighbor-Joining method. Mendelian error rate was determined with VCFtools v0.1.16[39]. Probability of Identity (PID) and Polymorphic Information Content (PIC) were counted using an in-house Python script. Per-locus polymorphism information content (PIC) and probability of identity (PID) were calculated for SSR and abSNP loci and compared within diploid (Asian, European, and hybrid) and triploid accessions using Wilcoxon rank-sum tests with effect sizes estimated by Cliff's δ. To evaluate the effects of marker type, taxonomic group, and ploidy, nonparametric two-factor-aligned rank transform (ART) ANOVA models were applied, with hybrids assessed descriptively due to sample structure.
Design and analysis of SSR markers
-
The PCR reaction was performed as a multiplex using 34 primers, enabling the simultaneous amplification of 17 highly polymorphic SSR markers (Table 1) in a single reaction. Some primer sequences were adopted from existing literature, while others were newly designed to ensure that the amplified SSR fragments had appropriate lengths, allowing all markers to be analyzed together. Accordingly, one primer from each pair was labeled with a specific fluorescent dye (6-FAM, VIC, NED, or PET). The sequences and final concentrations of the primers used in the reaction are listed in Supplementary Data S3. The isolated DNA from all samples was diluted to a concentration of 10 ng/μL. The PCR reaction was carried out under the following conditions: 5 μL of Phusion Flash High-Fidelity PCR Master Mix (Thermo Fisher Scientific), 1 μL of primers premix (final concentration of each primer is in Supplementary Data S3), 2 μL DNA (10 ng/μL), and PCR-grade water up to 10 μL. PCR was run on a C1000 PCR cycler (Bio-Rad) using a universal temperature profile as follows: 98 °C/1 minute; 24 cycles (98 °C/10 s, 58 °C/10 s, 72 °C/30 s); final extension 72 °C/30 s. Afterward, the fragment analysis was followed according to the given procedure: 1 μL of PCR product was mixed with 15 μL Hi-Di Formamide and 0.5 μL GeneScan 600 LIZ dye Size Standard v2.0 (both Thermo Fisher Scientific). Samples were denatured at 95 °C for 2 min, and run on a 3500 Genetic Analyzer (Thermo Fisher Scientific). Results were analyzed in v5 Gene-Mapper software (Thermo Fisher Scientific). POLYGENE software, version V1.7[48], was used to analyze genetic diversity and allele frequencies in a population of 188 unique genotypes (for diploids) and 25 unique genotypes for triploids, defined based on three alleles for at least seven markers. POLYGENE software was also used to perform parentage analysis.
Table 1. List of markers used for pear genotyping.
SSR marker Chromosome Motif Source of the SSR marker TsuENH003_a 1 (TC)n [49] CH02f06_a 2 (TG)n(AG)n [50] NB109a_a 3 (AG)n [51] NZ05g8_a 4 (GA)n [52] CH05e06_a 5 (AG)n [50] CH05a05_a 6 (AG)n [50] CH04e05_a 7 (GA)n [50] CH01h10_a 8 (TC)n [50] NB106a_a 9 (AG)n [51] CH02b03b_a 10 (TC)n [50] NB105a_a 11 (AG)nAT(AG)n [51] CH01d09_a 12 (GA)n [50] NH021a_a 13 (AG)n [51] CH05d03 14 (AG)n [50] CH02d11_a 15 (AG)n [53] CH05c06 16 (TC)n [50] GD96_a 17 (TC)n [54] The suffix '_a' in the marker name indicates that at least one primer used for amplification was designed at a position different from the original, i.e., the allele length amplified by the original primers differs from the length of the same allele amplified according to this study. However, both represent amplification of the same polymorphic locus within the genome. -
The collection of 324 Pyrus spp. accessions were used for ddRAD-seq. Based on in silico analysis of the reference sequence of Pyrus communis d'Anjou Genome v2.3. a1[19], AvaII, and MspI were selected as the best combination of restriction enzymes to prepare ddRAD libraries with the optimal number of loci for genotyping (52,035). Size-selected libraries (300-400 bp after adapter ligation) were sequenced with a mean number of quality-filtered reads per sample of 4.47 million. The average number of ddRAD loci identified per sample was 53,129, with a mean read depth of 41 per locus. The mean numbers of SNPs and InDels per sample were 126,171 and 12,964, respectively. After SNP filtering for read depth (DP) ≥ 8, MAF ≥ 0.01, missing for genotype ≤ 5 %, and missing for sample ≤ 10 %, 42,961 SNPs and 308 individuals were preserved. For the population analysis and marker design, 7,361 SNPs pruned for LD were used. LD-pruned SNPs were evenly distributed along the chromosomes, except for centromeric regions and the distal parts of the short arm of chromosome 1A and the long arms of chromosomes 13A and 16A (Fig. 1).
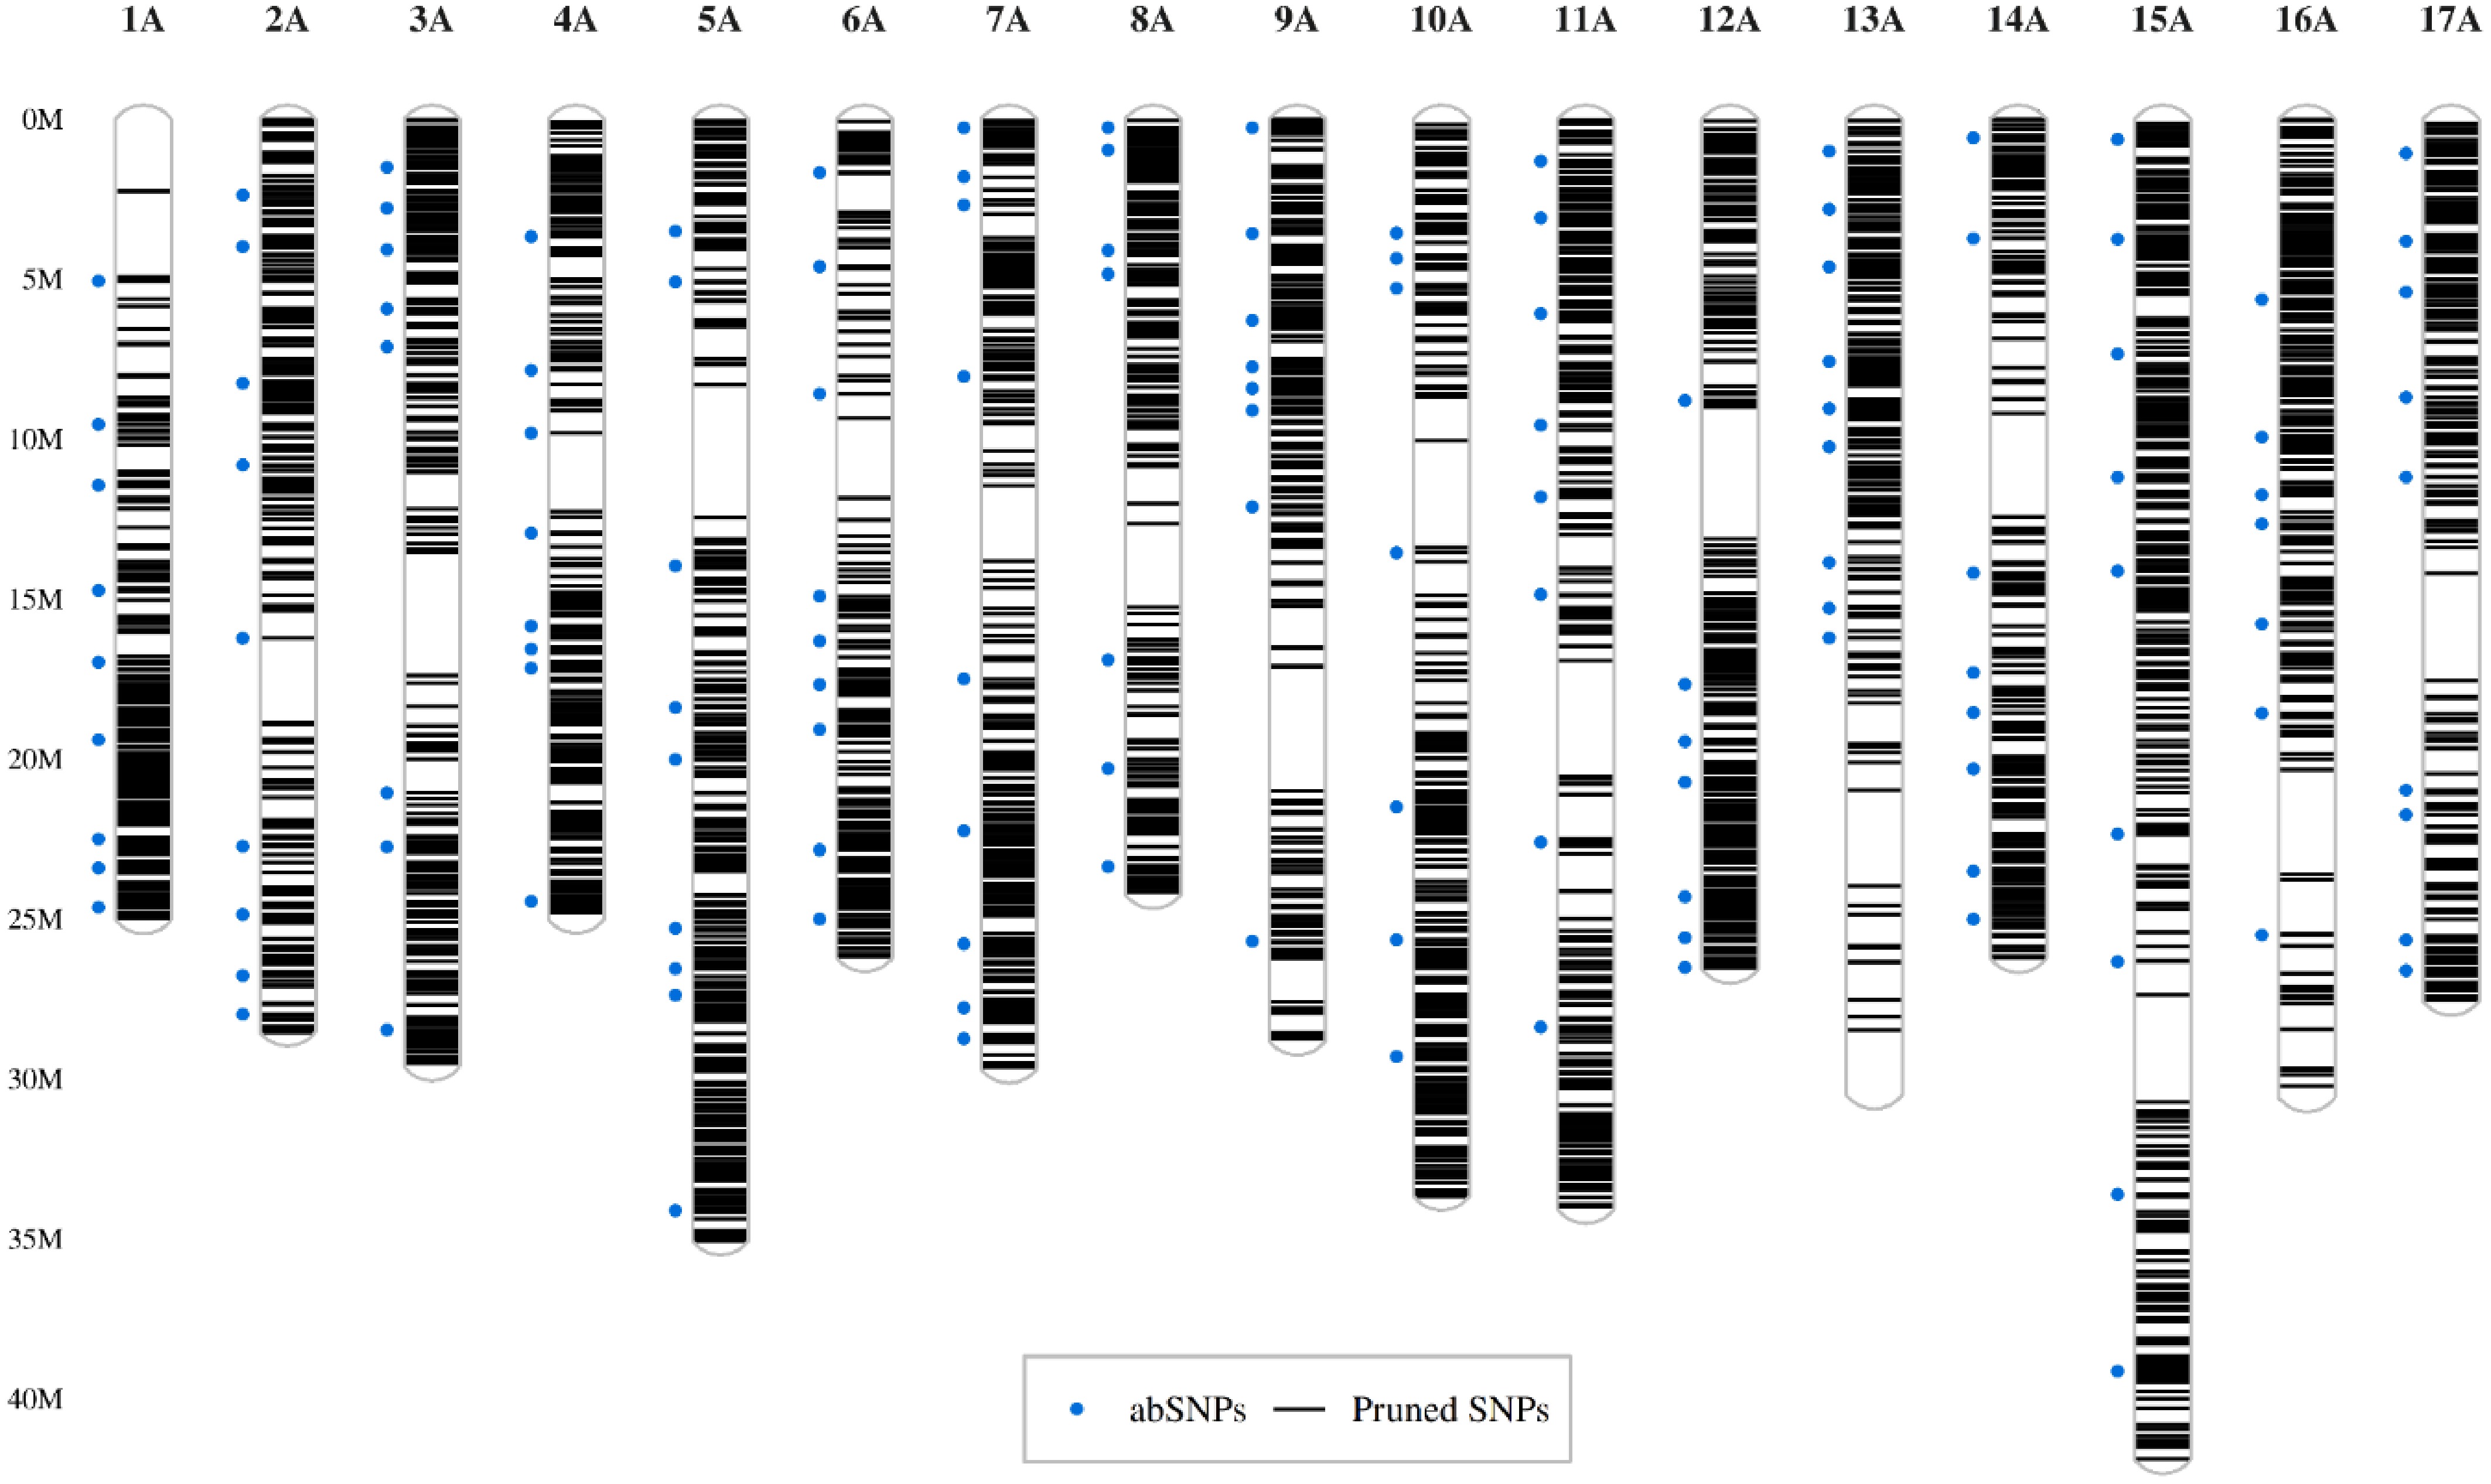
Figure 1.
Distribution of SNPs along the chromosomes. The set of 7,361 SNPs pruned by LD is displayed as black lines representing their positions along the chromosomes (y-axis). Blue dots on the left side of chromosomes indicate markers selected for amplicon sequencing.
Population structure
-
Ploidy levels were determined using nQuire, and a total of 276 diploid and 32 triploid accessions were jointly analyzed as one dataset for the determination of population structure. Principal component analysis (PCA) was used to reduce the complexity of the pruned set of SNPs. The first three components separated the dataset of the accessions into six groups (Fig. 2a). The first PCA with 29.16% variance divided the collection into three groups: (1) accessions including Asian pears (Asian Group, A) from Pyrus pyrifolia, Pyrus bretschneideri, Pyrus pashia, and Pyrus ussuriensis; (2) hybrids (= H) between Pyrus communis and Pyrus pyrifolia; and (3) varieties from Pyrus communis (= European Group, E). Two accessions deviated from E Group, 'Tatarova', which is a hybrid between Pyrus communis and Sorbus spp., and one unknown sample. The second component, with 16.06% of variance, additionally separated the European Group into two groups (= E1, E2). Group E1 comprises mainly landraces and primitive European varieties, whose fruits are usually classified as summer pears and are primarily intended for processing. In contrast, Group E2 comprises advanced and old European varieties, predominantly of Belgian, French, and German origin, characterized by high-quality fruits with good storage potential. The third component, with 8.6% variance, separated two accessions from the H Group (= H1). Finally, the Asian Group was divided into two groups (A1 and A2) (Supplementary Data S1). Subgroup A1 includes hybrids and varieties of Pyrus bretschneideri, whereas subgroup A2 comprises mainly Asian pears from the Pyrus pyrifolia species.
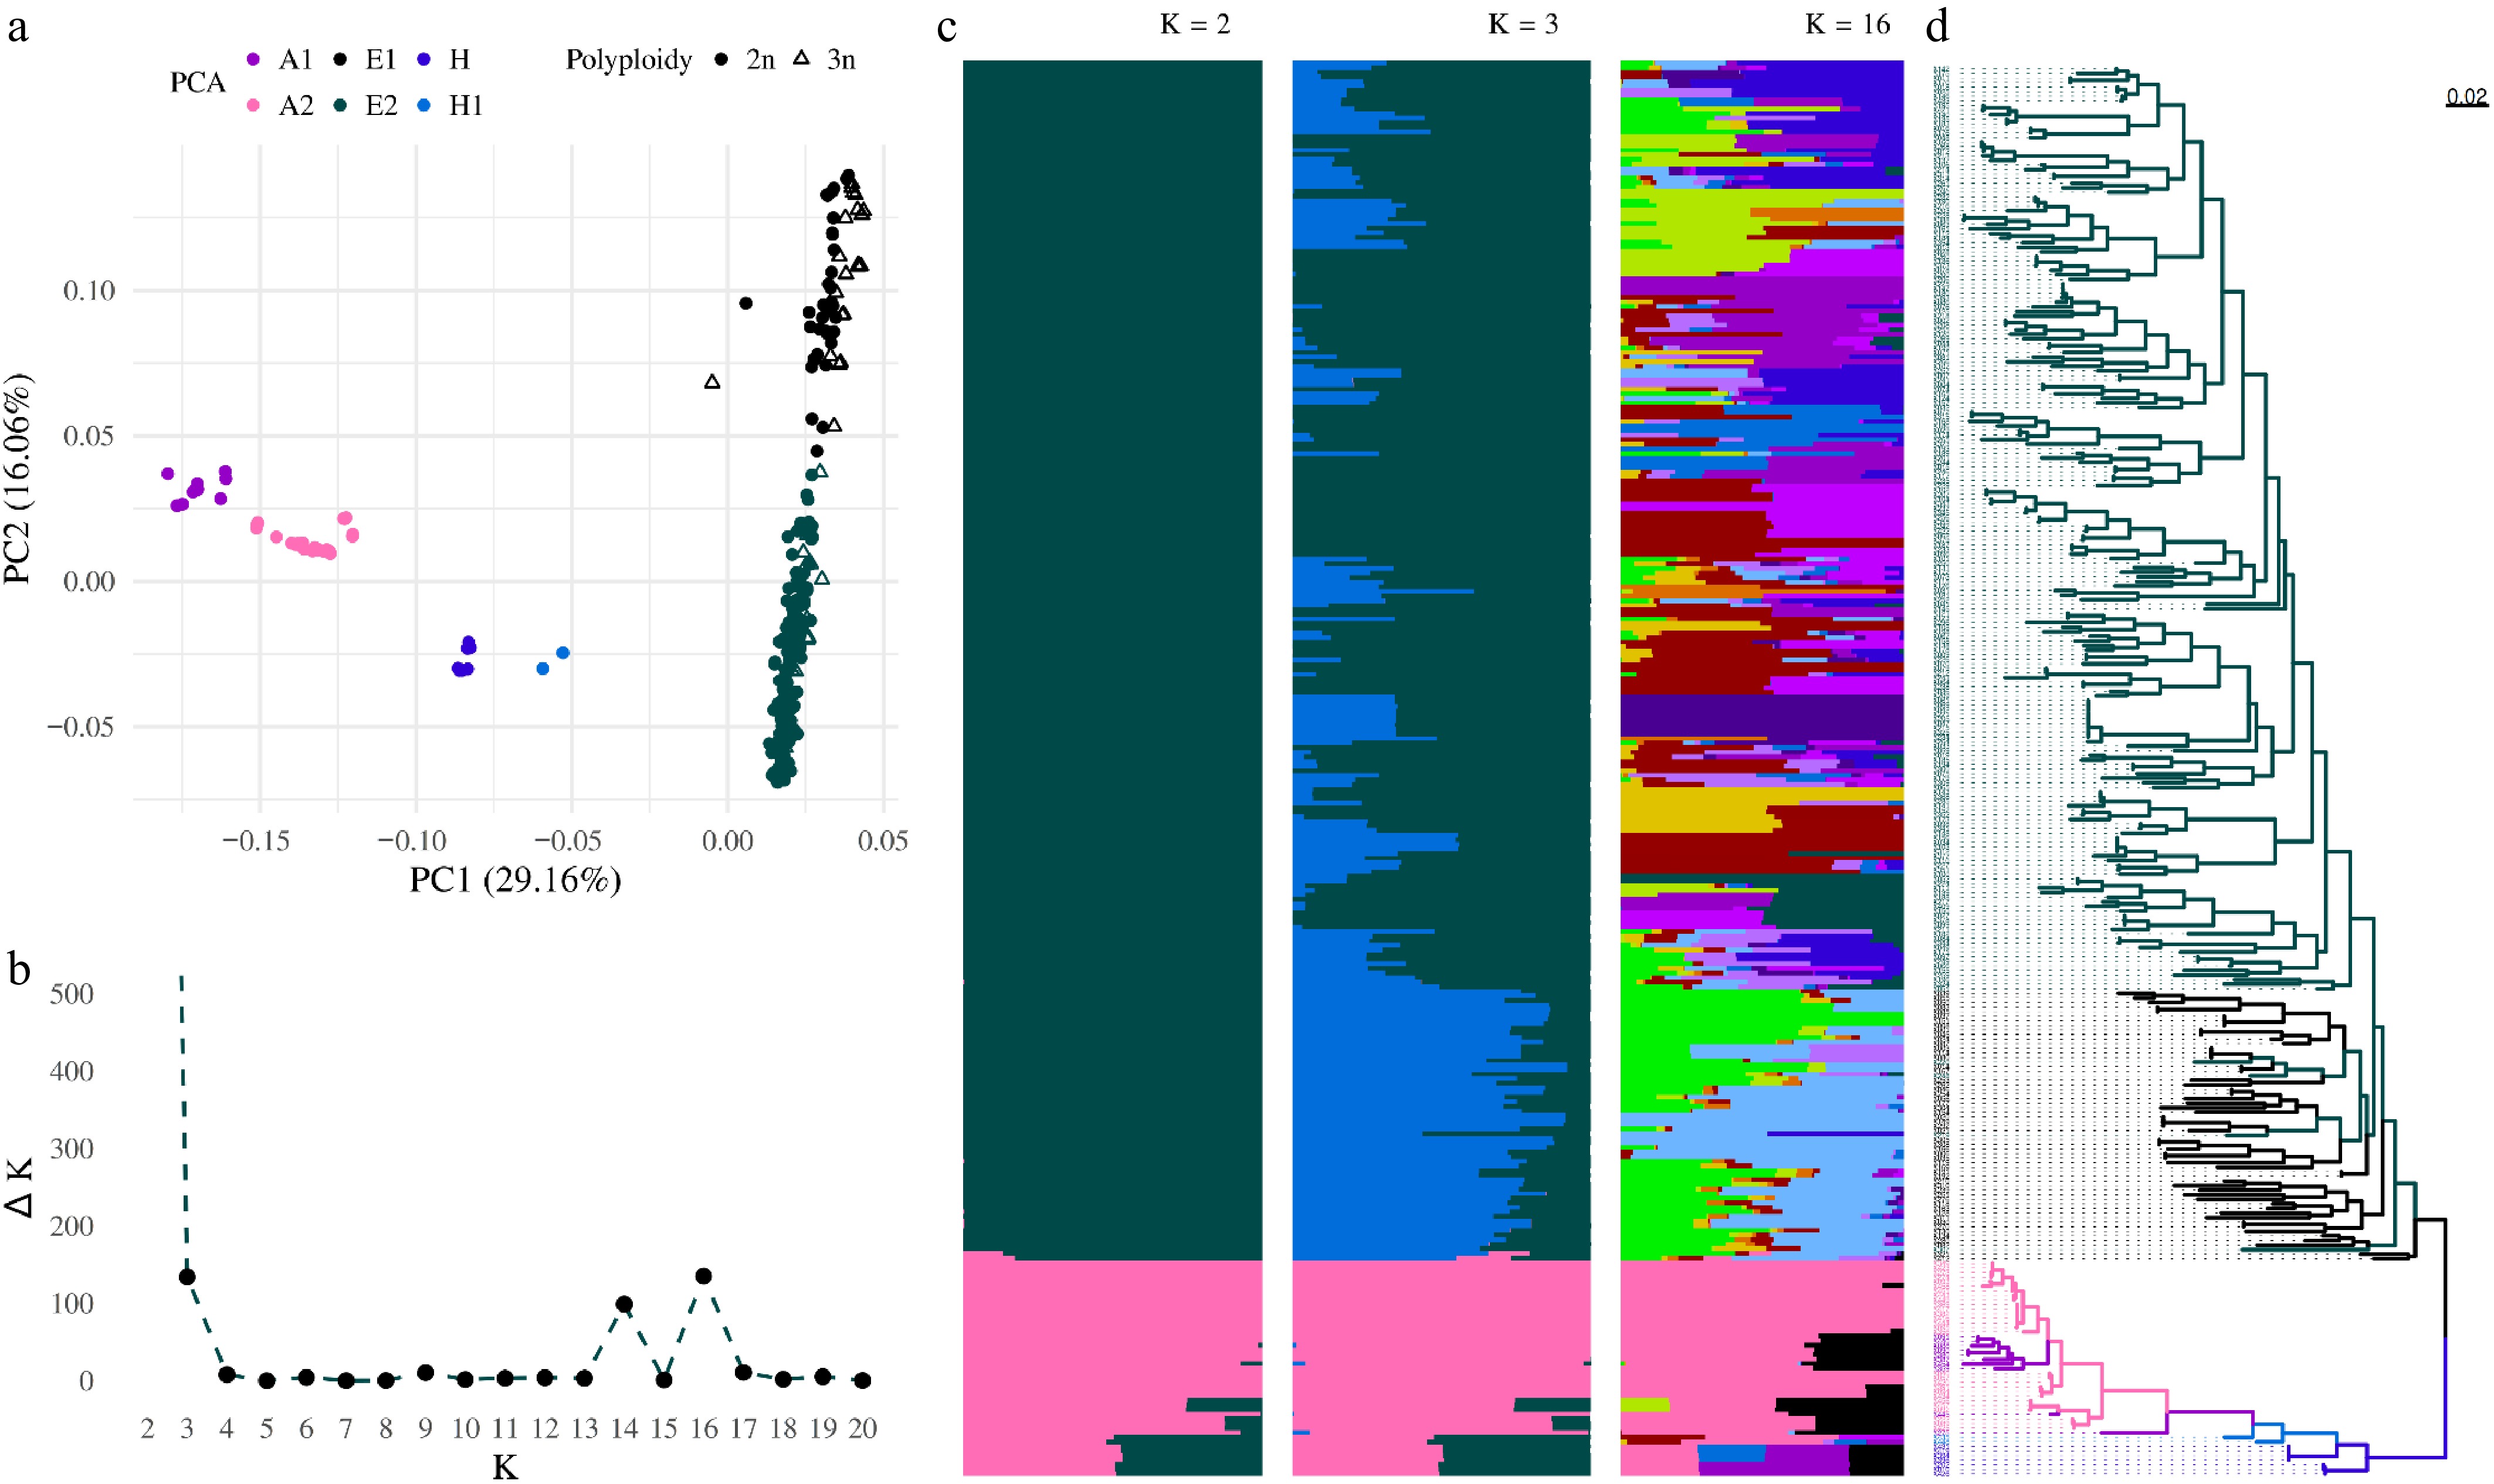
Figure 2.
Population structure analysis from pruned SNPs. All samples are divided according to principal component analysis into six groups. (a) Asian (A1, A2), European (E1, E2) accessions, and hybrids (H, H1) between Asian and European groups. (b) Plot of Delta K as a function of K within the range from 2 to 20. (c) Bar plots for K = 16, K = 3, and K = 2 illustrate the population structure described using a Bayesian approach. Each individual ordered according to the phylogenetic tree is represented by a horizontal line, with each color representing one of the inferred clusters. (d) The phylogenetic tree rooted at the midpoint was constructed using the SNPhylo pipeline. Accessions are colored according to the PCA color scheme.
Bayesian clustering analysis, performed using the STRUCTURE program, identified population structure and relatedness among pear accessions. For each K value (1–20), delta K was calculated, with the highest values observed at K = 2, K = 3, and K = 16 (Fig. 2b). At K = 2, the accessions were divided into two genetically distinguishable groups, the European and the Asian, with a subset of hybrids (Fig. 2c). At K = 3, the European group further split into two subgroups (Fig. 2c). Interestingly, clustering at K = 16 closely mirrored the phylogenetic relationships depicted in the phylogenetic tree (Fig. 2d), which was constructed from the same LD-pruned SNP set.
Clone identification
-
A total of 7,361 pruned SNPs were used for inferring first- and second-degree relationships as well as clonal variants, with accessions analyzed separately according to ploidy level inferred using nQuire, thereby revealing mislabelled entries in the original records. The kinship coefficient (Kin), calculated using the SNPRelate package, was employed to detect clones. The kinship coefficient effectively separated the sample combinations into distinct relationship groups (Fig. 3a). Across all datasets, seven triploid and 56 diploid clonal groups were identified. All pairs of accessions in these groups had Kin values greater than 0.4654 (Supplementary Data S1), within the expected range of 0.3536 to 0.5 defined for clones[45]. The groups comprised a total of 159 accessions, with each group containing between two and nine individuals. Some groups included accessions with synonymous names, such as 'Špinka' and 'Gute Graue', or conversely, accessions that were mislabeled in the original descriptions. Despite differences in origin, the varieties 'Hardyho máslovka', HA042, HA047, HA061, HA069, HA205, HA215, and HA325 were all assigned to a single group (Group 33), which contained the highest number of clonal accessions.
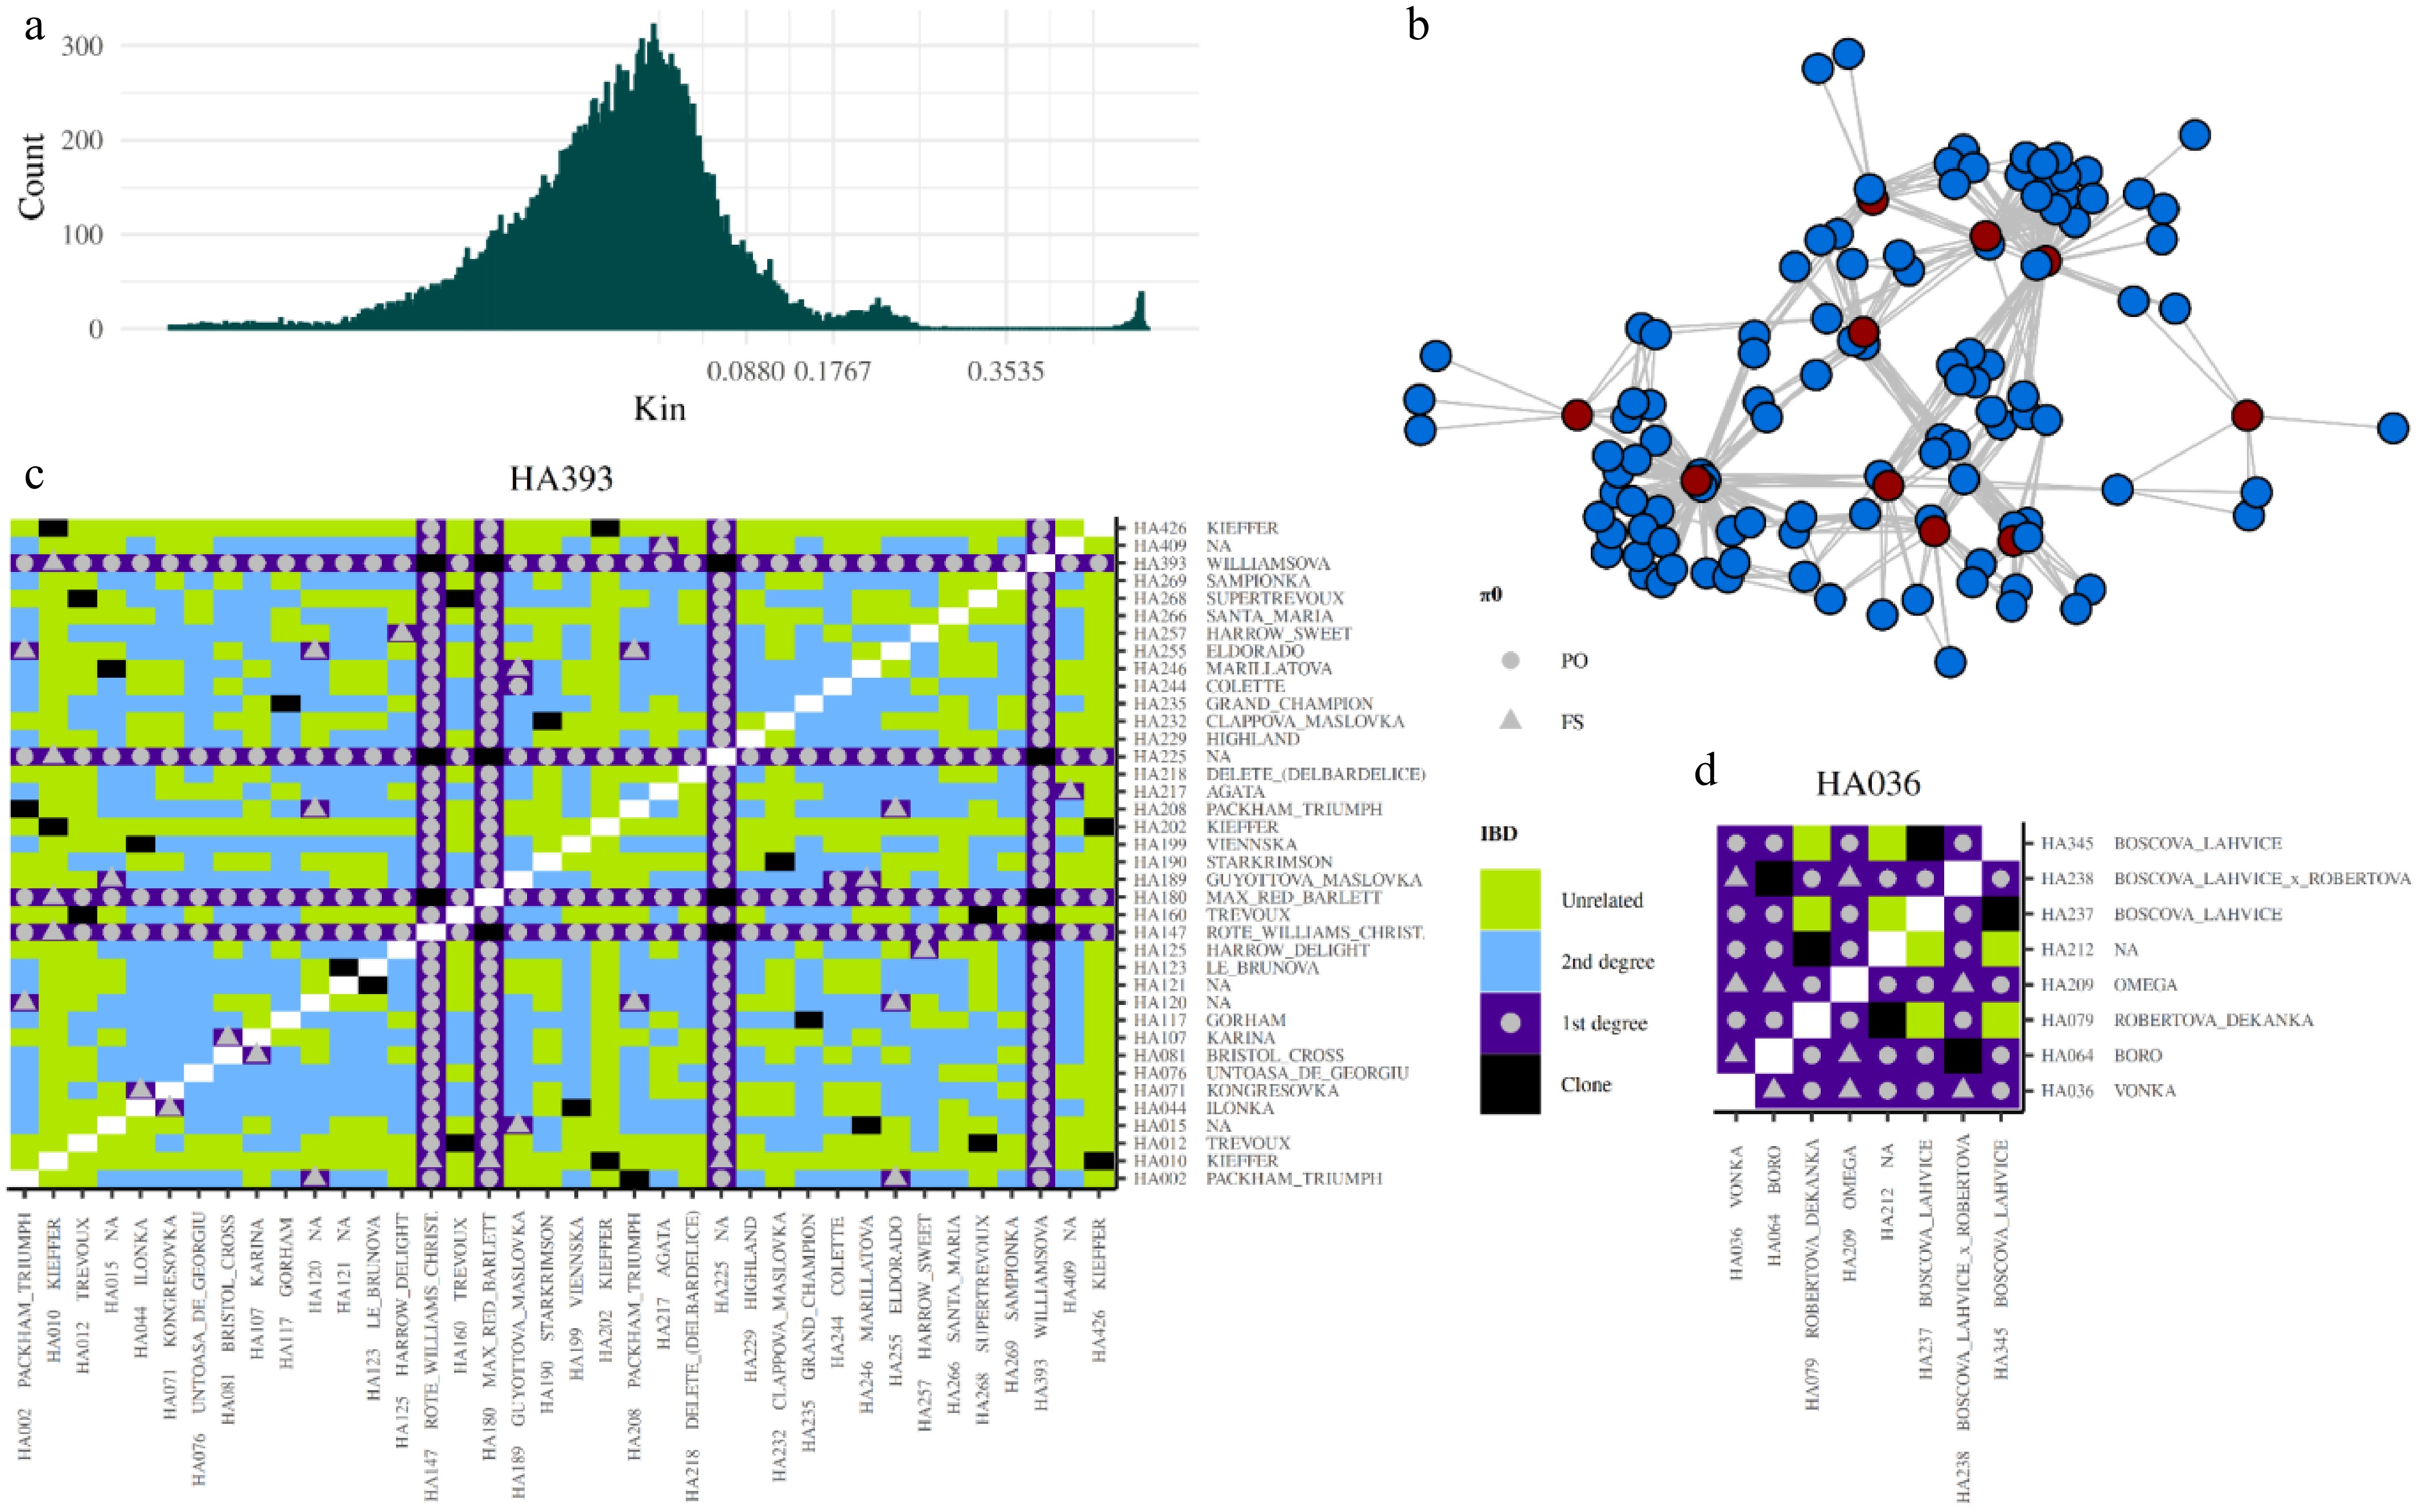
Figure 3.
Relationships defined using pairwise IBD coefficients. (a) Histogram showing the distribution of kinship coefficient values (x-axis) and their counts (y-axis) in diploid samples. The histogram is zoomed into the window of –0.5 to 0.5, with breaks representing different relationship categories: clone (> 0.3535), first-degree (> 0.1768–0.3535), second-degree (0.0880–0.1768), and unrelated (< 0.0880). (b) Network of first-degree relationships among donor accessions (red dots), with their offspring represented by blue dots. Lines connect nodes that share first-degree relationships, with kinship coefficients ranging from 0.1768 to 0.3535. (c) First-degree relationships with 'Williamsova', and (d) first-degree relationships with 'Vonka', along with the relationships of all filtered samples. The color of each tile in the heatmap represents the strength of the relationship, based on the kinship coefficient. Symbols in all first-degree relationships indicate whether the relationship is PO (parent-offspring) or FS (full-sibling), based on the π0.
Among the 33 pairs of accessions in the collection sharing the same name, 29 pairs met the criterion for clonality (Kin > 0.3535). In contrast, the accessions 'David' (HA409, HA205), 'Napoca' (HA201, HA440), and 'Nijisseiki' (HA273, HA443) obtained from different sources exhibited Kin close to zero, suggesting potential misclassification of one accession in each pair. Another discrepancy was observed for accessions labeled 'Elektra' (HA112, HA354), which showed a Kin of 0.2133, indicating that these accessions are first-degree relatives but not clones of each other. These two 'Elektra' accessions likely originated from independent crosses between the parents 'Clappova' and 'Nordhäuser Winterforelle'.
Parentage analysis
-
The kinship coefficients (Kin) and the probability of zero IBD (π0) were used to determine first-degree relationships, including parent-offspring (PO) and full siblings (FS) on the diploid accessions. The minimum and maximum Kin values for the 51 known PO relationships in our collection (one parent, one offspring) were 0.1815 and 0.2604, respectively (Supplementary Data S2). This is consistent with the generally accepted Kin range of 0.1768–0.3535 for defining first-degree relationships[45]. We distinguish two ranges for first-degree relationships: 0.1768–0.2604, observed in our dataset, and 0.2604–0.3535, derived from the generally accepted range. The π0 coefficient for the same combinations was in the range of 0.0022–0.0064. It is assumed that for ideal data, the value should be 0. Therefore, we again divided the parent-offspring (PO) assignments based on the observed range of 0.0022–0.0064 and the range close to generally accepted values of 0–0.0022. Based on these, observed (in our collection) and generally defined values for both coefficients, thresholds for relationships were established (Table 2).
Table 2. Thresholds and observed values for genetic relationship inference.
Relationship Kin Kin observed and set up (bold) Marking Kin π0 π0 observed (bold) and set up Marking π0 Monozygotes/clone > 0.3535 > 0.4654 and > 0.3535 Clone < 0.1 < 0.0003 Parent-offspring (PO) 0.3535– 0.1768 0.2604–0.1816 and 0.3535–0.1768 1st degree < 0.1 0.0022–0.0064 and 0–0.0064 PO Full-siblings (FS) 0.1–0.365 0.0064–0.1 FS 2nd degree 0.1768–0.088 Unrelated < 0.088 Observed Kin values were defined from documented relationships in our collection (Supplementary Data S2, Kin test). The Kin threshold was determined based on the correlation between observed values and the ranges defined by Manichaikul et al.[45]. The setup π0 thresholds were established based on observed data. According to the surveillance, the accessions 'Boscova', 'Clappova', 'Děkanka Robertova', 'Drouardova', Guoyotova máslovka', 'Nordhäuser Winterforelle', 'Konference', 'Solanka', HA224, and 'Williamsova' belong to the main donor genotypes in our collection (Fig. 3b). Among parent-offspring (PO) combinations, including 158 accessions, 65 duos and 47 trios, were identified (Supplementary Data S2). Eighty full-sibling combinations were detected (Supplementary Data S2). For example, the accessions 'Blanka', 'Bodra', 'Erika', 'Jana', 'Jizera', 'Morava', and 'Vladka' are likely offspring originating from crosses between 'Boscova' and 'Drouardova', confirmed with pairwise IBD analysis. Only one accession ('Boscova lahvice × Drouardova'), which should originate from the same parental combination, showed no PO and FS match in the collection. Similarly, the accessions 'Vonka', 'Boro', and 'Omega' are demonstrably offspring of 'Boscova' and 'Děkanka Robertova', and pairwise π0 coefficients among them fall within the expected range for FS relationships (Fig. 3d).
The accession 'Guoyotova máslovka' exemplifies a complex cross and is a full sibling of 'Marillatova' and HA015. One parent of those ascensions is 'Williamsova', and the second parent is likely HA174 (clone of HA029), the Kin between 'Williamsova' and HA174 is 0.0687, indicating that they are unrelated. The accession 'Collete' shows a parent-offspring relationship with 'Williamsova', 'Guoyotova máslovka', and HA174, and a second-degree relationship with HA015 and 'Marillatova', suggesting inbreeding through 'Guoyotova máslovka'.
A limitation of predicting relationships using Kin is that it cannot compare individuals across different species. For example, 34 potential offspring of the accession 'Williamsova' and three other clone accessions were identified (Fig. 3c). All offspring exhibit π0 coefficients within the expected range for parent-offspring (PO) relationships, except for one cultivar, 'Kieffer', a hybrid between Pyrus communis and Pyrus pyrifolia. The second hybrid, 'Rafzas', is expected to result from a cross between 'Hosui' and 'General Leclerc'. While the Kin for 'General Leclerc' is consistent with this expectation, the Kin for 'Hosui' shows negative values. Interestingly, based on the PI_HAT value—calculated as the proportion of identity-by-descent (IBD)—'Rafzas' is still identified as an offspring of 'Hosui' and 'General Leclerc'.
Alternative genotyping approaches: comparison of two marker types
-
In addition to ddRAD-based genotyping, SSR and amplicon-based SNP (abSNP) markers were evaluated as cost-effective alternatives for clone identification, parentage testing, diversity assessment, and ploidy confirmation. Seventeen SSR and 161 abSNP markers were tested on 362 (Supplementary Data S4 for diploids, Supplementary Data S5 for triploids), and 394 (Supplementary Data S6) accessions, respectively. Initially, the ploidy of the samples was determined, as it has a significant impact on statistical analysis. In all samples analyzed by SSR markers, three alleles per marker were observed in a minimum of seven out of 17 microsatellites, and corresponding varieties were classified as triploids. Eleven percent of accessions analyzed by SSR were identified as triploid (Supplementary Data S1, S5), which matched the results from nQuire. For abSNP markers, the ratio of allele depth between the minor allele and all alleles for 40 triploids ranged from 0.326 to 0.338. There were six discrepant accessions (HA037, HA151, HA192, HA321, HA412, HA769) between the two approaches.
A subset of 213 unique diploid accessions genotyped by both marker systems (evaluation set, ES) was used for direct comparison. Mean PIC values were 0.289 for abSNPs and 0.827 for SSRs. Despite lower per-locus PIC, the larger number of abSNP loci produced a lower multilocus PID (2.9 × 10−69) than SSRs (9.1 × 10⁻²⁵), indicating higher overall panel resolution for abSNPs while both systems ensured reliable varietal discrimination.
At the per-locus level, SSR loci exhibited significantly higher PIC and −log10(PID) than abSNP loci across all diploid groups (Asian, European, and hybrids; Wilcoxon tests, p < 10−10; Cliff's δ ≥ −0.97). Two-factor aligned rank transform (ART) ANOVA restricted to diploid Asian and European accessions revealed a strong main effect of marker type for PIC (F1,254 = 130.54, p < 2 × 10⁻¹⁶; partial η2 = 0.34) and −log10(PID) (F1,254 = 129.95, p < 2 × 10⁻¹⁶; partial η2 = 0.34), a small group effect (PIC: F1,254 = 4.67, p = 0.0317; −log10(PID): F1,254 = 4.61, p = 0.0328), and no marker type × group interaction (PIC: p = 0.649; −log10(PID): p = 0.112), indicating consistent relative marker performance across Asian and European pears.
European triploids were analyzed separately to assess ploidy effects. As in diploids, SSR loci showed significantly higher PIC and −log10(PID) than abSNP loci (W = 0, p = 1.42 × 10⁻¹¹; Cliff's δ = −1.0). ART-ANOVA including marker type and ploidy (2n vs 3n) confirmed a strong marker type effect for PIC (F1,333 = 126.0, p < 2 × 10⁻¹⁶; partial η2 = 0.27) and −log10(PID) (F1,333 = 124.8, p < 2 × 10⁻¹⁶; partial η2 = 0.27), no main effect of ploidy, and a small marker type × ploidy interaction for −log10(PID) (F1,333 = 14.94, p = 1.33 × 10⁻⁴; partial η2 = 0.04), indicating minor modulation of effect magnitude without altering marker ranking.
The first two PCA components based on SSR markers separated ES into Asian and European groups (Fig. 4a), while the hybrid group was additionally distinguished using abSNPs (Fig. 4b). The highest ΔK was observed at K = 2 for both marker types, at K = 3 for SSR markers, and at K = 4 for abSNP markers (Fig. 4c, d). Bayesian clustering analysis with both marker types identified Asian, European, and hybrid groups. The phylogenetic tree was generated based on SSR markers (Fig. 4e) and was used to order all structure plots.
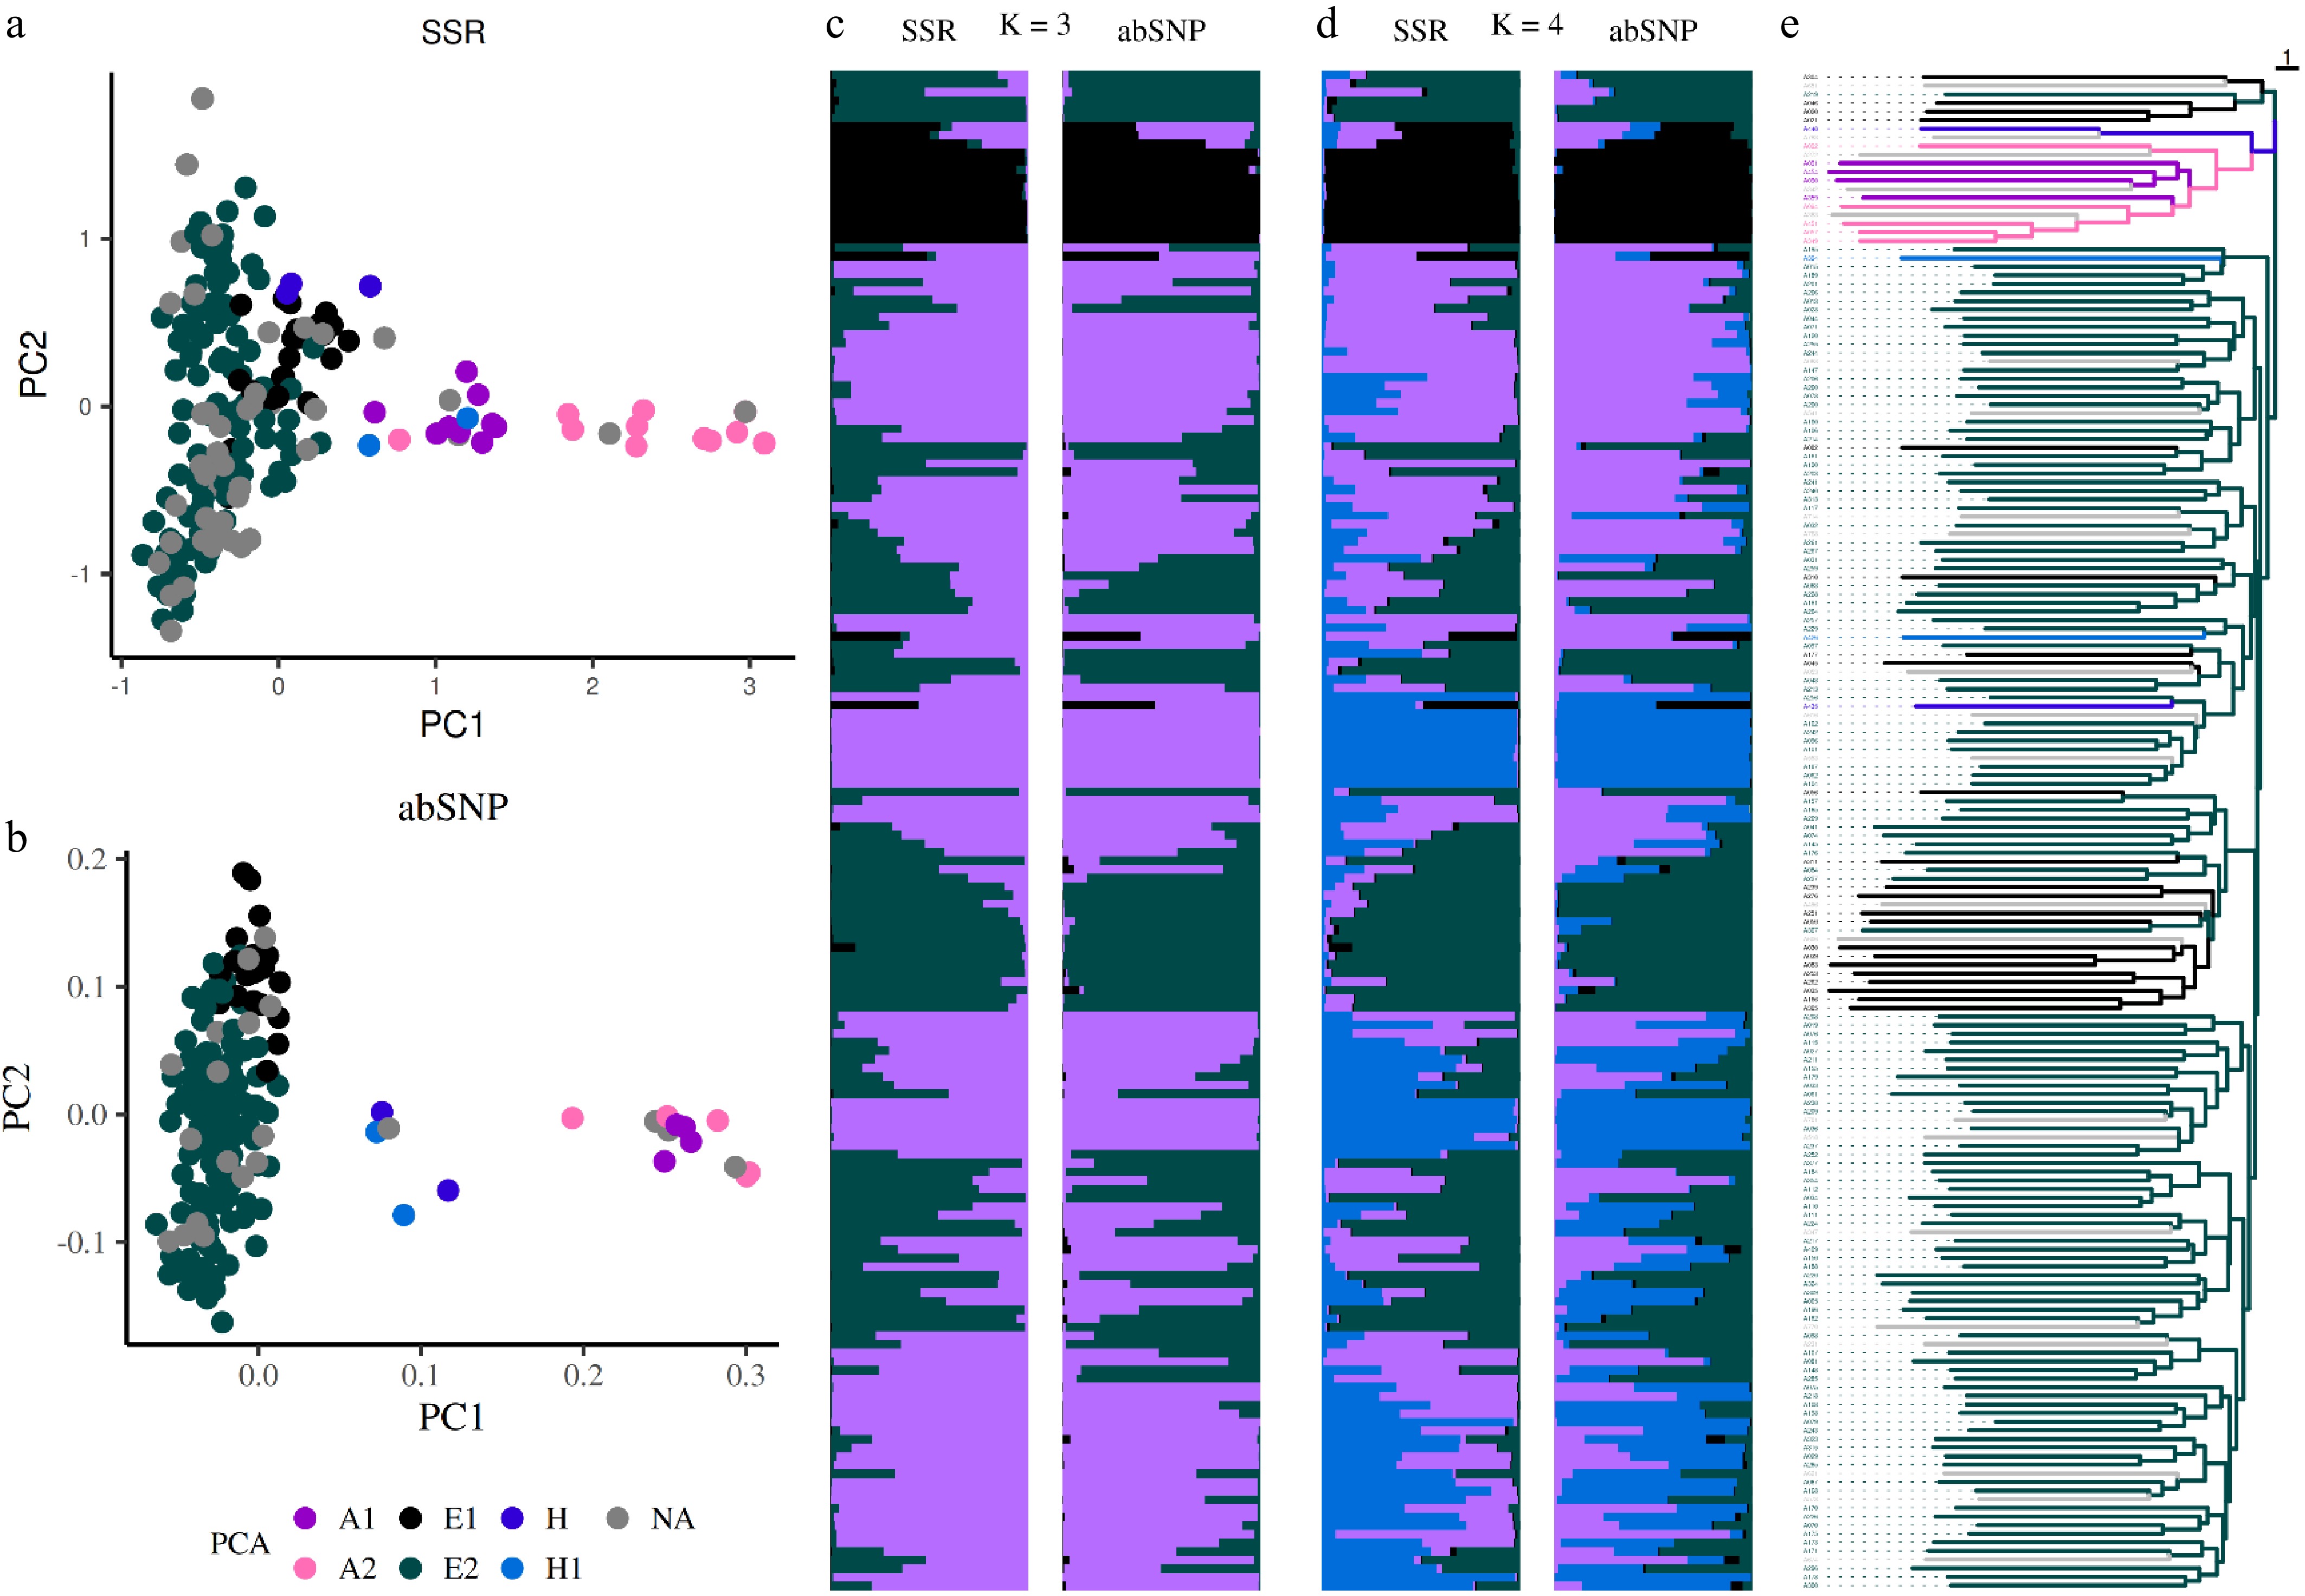
Figure 4.
Population structure analysis using markers. Principal component analysis (PCA) based on (a) SSR, and (b) amplicon-based SNP markers. Dots represent individual accessions and are colored according to their group membership, as defined by ddRAD analysis, (e) consistent with the phylogenetic tree generated from SSR markers. Bar plots, ordered according to the phylogenetic tree, illustrate population structure inferred using a Bayesian approach with SSR and abSNP markers for (c) K = 3, and (d) K = 4, with each cluster represented by a distinct color.
Both SSR and abSNP markers proved reliable for clone identification. For abSNP markers, a Kin threshold of > 0.3535 was applied to define clone groups. In total, nine triploid and 60 diploid groups containing at least one clone were identified. All groups defined by abSNP markers corresponded to those determined by ddRAD, except for one abSNP-defined group, which included the triploid accessions 'Lucasova', 'Philip', 'Merodova', 'Dielova', and 'President Mas'. Based on observations from accessions with identical names (e.g., 'Keiffer', 'Grosdemange'), a change in one allele was considered within tolerance, and we identified 10 triploid and 63 diploid clone groups (Supplementary Data S1). In both marker systems, we were unable to distinguish accessions differing only by mutations, such as the red bud-sport mutation in 'MAX_RED_BARTLETT' ('Williamsova') or 'Clappova červená' ('Clappova').
Determining parent–offspring (PO) relationships is a more complex task. Parentage assignment using SSR markers in POLYGENE software identified 40 trios for diploids (Supplementary Data S2) that generally corresponded with those obtained from ddRAD, except six trios with offspring: HA079, HA228, HA232, HA268, HA377, and HA409. For example, the accession 'Robertova Děkanka' was identified as the offspring of 'Condo' and 'Vonka' by SSR markers; however, based on ddRAD data, 'Robertova Děkanka' is one of the donors in our collection. 'Vonka' is the offspring of 'Robertova Děkanka' and 'Boscova Lahvice', while 'Condo' is the offspring of 'Robertova Děkanka' and 'Konference'. The second example includes HA224 as the parent of 'Milka' and 'David' (HA409). However, π0 from ddRAD did not confirm this relationship; nevertheless, the π0 values of 0.0066 and 0.0067 were close to the defined threshold between PO and FS.
In contrast, parent–offspring (PO) determination using abSNPs proved to be of questionable reliability. Compared with trios for diploids determined by ddRAD, 80% of trios derived from abSNPs were incorrectly assigned. Upon closer examination, we found discrepancies even within genotypes of varieties represented by multiple accessions ('Boscova', 'Clappova', 'Hardyho máslovka', 'Konference', 'Milka', and 'Williamsova') (Supplementary Data S6). Although allelic depth indicated the presence of both alleles, SNPs were classified as homozygous under default variant calling settings. When the threshold for the minor allele was manually lowered to 10% (abSNP_MAF10 markers), several loci previously scored as homozygous were instead called heterozygous, and the success rate of determination increased by about 16%. For example, in the 'Hardyho máslovka' group, several samples with homozygous calls were changed to heterozygous at five markers (P_2A_273, P_11A_595, P_12A_769, P_15A_492, and P_13A_884), while for two markers (P_5A_163 and P_5A_491), all samples in the group were reclassified from homozygous to heterozygous. All these changes were consistent with ddRAD calls.
Validation using ddRAD variant calling revealed further inconsistencies, indicating that direct comparison between ddRAD and amplicon-based methods at the level of single SNPs is not feasible. For instance, among 129 common SNPs in the accession 'Hardyho máslovka', five differed between variant calls from ddRAD and abSNP|abSNP_MAF10 markers.
Finally, the markers were evaluated using Mendelian error rates in overlapping trios defined by ddRAD. Eight abSNP markers exceeded the 5% threshold for Mendelian errors, while only one of these exceeded the 5% threshold in the abSNP-filtered ddRAD data. After removing 42 markers that exceeded the 1% threshold for Mendelian errors, the success rate of determination increased to 58%. Nevertheless, the trios analyzed did not cover the full spectrum of the collection, and therefore, even this validation approach cannot fully resolve allele imbalance caused by amplification bias.
-
The ddRAD-seq derived SNP dataset provided a robust framework for resolving population structure within the pear germplasm collection. Using 7,361 LD-pruned SNPs, both PCA and Bayesian clustering clearly separated European (Pyrus communis) and Asian pear accessions, with hybrids occupying intermediate positions. This pattern is consistent with previous genome-wide studies based on GBS and SNP arrays, which consistently report strong genetic differentiation between Asian and European pears despite their inter-fertility[23,26,27]. The lack of clear geographic structuring within the European group is also in agreement with earlier findings, reflecting extensive historical exchange of germplasm and recurrent use of a limited number of founder cultivars in European breeding programs[3,23].
Within European pears, the separation of two subgroups corresponding broadly to landraces and older processing cultivars versus dessert cultivars of Western European origin mirrors observations reported from SSR- and SNP-based analyses of European collections[13,14]. The Asian group was further subdivided into accessions corresponding largely to P. bretschneideri–derived material and P. pyrifolia, consistent with previous SSR- and genome-based studies describing distinct genetic pools within Asian pears[20,55].
Although interspecific differentiation was clear, resolution within Asian pears was less pronounced when mapping reads to the P. communis reference genome. Improved heterozygosity estimates observed when Asian accessions were mapped to Asian reference genomes support previous recommendations to analyze Asian and European pears separately or to use species-appropriate references to reduce mapping bias[56−58]. These findings highlight the importance of reference genome choice for accurate inference of population structure and relatedness in admixed or interspecific datasets.
Clone identification and cultivar identity in pear germplasm collections
-
Using kinship coefficients derived from ddRAD SNPs, we identified a large number of clonal groups, revealing extensive synonymy and mislabelling within the collection. Similar levels of redundancy and cultivar misidentification have been widely reported in pear and other clonally propagated fruit crops[11,12,14,59]. In agreement with these studies, most accessions sharing the same cultivar name were confirmed as clones, while several differently named accessions proved genetically identical.
Conversely, a small number of accessions bearing identical names were not clonal but instead showed first-degree relationships, as exemplified by the two 'Elektra' accessions. Such cases likely reflect repeated use of identical parental combinations in breeding programs, a phenomenon previously documented in pear pedigree reconstructions[23]. The identification of major donor cultivars such as 'Boscova', 'Williamsova', and 'Clappova' further supports historical records describing their central role in European pear breeding[3].
Despite the high resolution of ddRAD-seq, somatic mutations such as red-fruited bud-sport variants of 'Williamsova' and 'Clappova' could not be distinguished. This limitation is inherent to SNP-based approaches targeting a restricted portion of the genome and has been reported in previous studies using both SSRs and SNPs in perennial fruit crops[11,12]. Nonetheless, ddRAD-seq allowed reliable discrimination between true clones and closely related but genetically distinct accessions, reducing the risk of erroneous cultivar identification.
Parentage and relatedness inference using genome-wide SNPs
-
Kinship coefficients (Kin) and π0 values derived from ddRAD SNPs enabled reliable inference of parent–offspring and full-sibling relationships among diploid accessions. The observed Kin ranges for known parent–offspring pairs were consistent with theoretical expectations and previously reported empirical thresholds[23,45]. Using these parameters, we reconstructed numerous duos and trios, confirming known pedigrees and identifying previously undocumented relationships.
The reconstructed pedigree structure revealed extensive reuse of a limited number of parental genotypes, consistent with findings from the USDA pear collection, where a small number of founders contribute disproportionately to modern cultivars[23]. Complex relationships involving repeated backcrossing and inbreeding, such as those observed for 'Guoyotova máslovka' and related accessions, further illustrate the narrow genetic base of European pear breeding.
Parentage inference across species boundaries remained challenging. While hybrids could be reliably detected at the population level, Kin-based thresholds are less robust for interspecific relationships, as previously noted in genome-wide studies of admixed populations[45,57]. The example of 'Rafzas', where PI_HAT supported parentage despite negative Kin values for one parent, underscores the need for cautious interpretation of relatedness metrics in interspecific contexts.
Comparative performance of SSR and abSNP markers
-
In parallel with ddRAD-seq, we evaluated SSR and abSNP panels as cost-effective alternatives for routine genotyping. Both marker systems successfully distinguished Asian, European, and hybrid groups, consistent with previous comparative analyses of SSR and SNP markers in pear and other crops[6,7,12]. SSR markers exhibited substantially higher per-locus polymorphic information content, whereas abSNPs achieved higher overall discriminatory power due to their larger number, reflected in lower multilocus PID values.
These results confirm the well-established trade-off between marker informativeness per locus and cumulative multilocus resolution[5,6]. SSR markers remain highly effective for cultivar identification and parentage analysis, owing to their multi-allelic nature and lower susceptibility to allele dropout. In contrast, abSNP markers performed well for clone identification and population-level analyses but were less reliable for parentage inference.
A major limitation of the abSNP approach was preferential amplification of one allele, leading to erroneous homozygous calls in heterozygous individuals. This phenomenon, known as allele dropout, is frequently caused by polymorphisms within primer binding sites and has been widely documented in amplicon-based sequencing approaches[32,60]. Despite excluding primer-site SNPs with frequencies ≥ 5%, amplification bias persisted, reflecting the high heterogeneity of the pear genome[61]. Moreover, other technical factors inherent to multiplex PCR, including primer–dimer formation, variation in GC content, secondary structure formation, and differences in amplicon length, are known to cause unequal amplification among loci and alleles[29,62,63]. Such effects can lead to locus-specific coverage variation and stochastic loss of one allele, particularly when read depth is limited, thereby inflating homozygosity.
Adjusting the minor allele frequency threshold partially improved concordance with ddRAD calls but did not fully resolve inconsistencies, and Mendelian error analysis identified a subset of unreliable loci. Similar reductions in heterozygosity and increased genotyping error rates have been reported for GT-seq panels compared with RAD-seq or array-based platforms[30,32]. These observations are consistent with reports that abSNP genotyping tends to underestimate heterozygosity relative to reduced-representation or array-based approaches, particularly in outcrossing and genetically diverse species[29,64].
We proposed a stringent 0% SNP frequency threshold across the entire primer sequence to minimize allele dropout; however, the practicality of this approach in pear warrants careful consideration. The exceptionally high nucleotide diversity and structural heterogeneity of the pear genome[57,61] substantially constrain the availability of sufficiently long, invariant regions suitable for primer design. As a result, overly strict exclusion criteria may reduce the number of usable loci and bias marker selection toward more conserved genomic regions, potentially lowering overall informativeness.
Taken together, these findings indicate that while abSNP panels are suitable for identification and diversity studies, their application to pedigree reconstruction in pear should be approached with caution unless supported by extensive marker validation and optimization.
Implications for germplasm management and marker choice
-
Taken together, our results demonstrate that ddRAD-seq provides the most comprehensive and reliable framework for population structure analysis, clone identification, and parentage inference in pear. However, its higher cost and longer turnaround time may limit routine use. SSR markers, particularly when optimized into a single multiplex reaction, remain a robust and accessible tool for cultivar verification and parentage testing, consistent with their continued use in national and regional germplasm collections[12,14].
AbSNP panels offer a flexible and scalable alternative for high-throughput genotyping and clone identification, particularly where sequencing infrastructure is available. The complementary strengths of these approaches suggest that an integrated genotyping strategy, combining genome-wide SNP discovery with targeted marker panels, is best suited for the management, conservation, and utilization of pear genetic resources.
-
This study presents a comprehensive genomic analysis of a pear (Pyrus spp.) germplasm collection and highlights the utility of integrating reduced-representation sequencing with targeted genotyping approaches. The ddRAD-derived SNP dataset provided a robust foundation for resolving population structure, confirming cultivar identity, and elucidating parent–offspring and full-sibling relationships. Based on these data, two complementary genotyping tools were developed and optimized for single-reaction amplification: an abSNP panel and a newly designed set of 17 SSR markers representing all pear chromosomes. Comparative evaluation demonstrated that while abSNP markers are well suited for clone identification, cultivar discrimination, and population-level analyses, SSR markers provide greater reliability for parentage verification. Together, these tools offer a flexible and cost-effective framework for precise genotyping of pear accessions, supporting future applications in breeding programs, genetic resource management, and germplasm conservation.
This study was supported by the Ministry of Agriculture of the Czech Republic (Project QK22010268). Computational resources were provided by the e-INFRA CZ project (ID:90254), supported by the Ministry of Education, Youth and Sports of the Czech Republic.
-
The authors confirm contributions to the paper as follows: study conception and design: Čmejlová J, Bartoš J; data collection: Holušová K, Žďárská I, Arabčuková S, Krška B, Čmejlová J; analysis and interpretation of results: Holušová K, Žďárská I, Arabčuková S, Krška B, Čmejlová J; draft manuscript preparation: Holušová K. All authors reviewed the results and approved the final version of the manuscript.
-
Data generated or analyzed during this study are included in this published article and its supplementary information files. Raw sequencing data are available from the corresponding author upon reasonable request.
-
The authors declare that they have no conflict of interest.
-
accompanies this paper online at: https://doi.org/10.48130/frures-0026-0005.
- Supplementary Data S1 Sample characteristics.
- Supplementary Data S2 Relatedness assessment among duos and trios.
- Supplementary Data S3 Primer sequences for abSNP and SSR loci.
- Supplementary Data S4 Results of SSR analysis for diploid accessions.
- Supplementary Data S5 Results of SSR analysis for triploid accessions.
- Supplementary Data S6 Alleles detected by abSNP marker analysis.
- Copyright: © 2026 by the author(s). Published by Maximum Academic Press, Fayetteville, GA. This article is an open access article distributed under Creative Commons Attribution License (CC BY 4.0), visit https://creativecommons.org/licenses/by/4.0/.
-
About this article
Cite this article
Holušová K, Žďárská I, Čmejlová J, Arabčuková S, Krška B, et al. 2026. Uncovering genetic relationships and designing markers for genotyping European pear varieties. Fruit Research 6: e019 doi: 10.48130/frures-0026-0005 

Uncovering genetic relationships and designing markers for genotyping European pear varieties
- Received: 11 November 2025
- Revised: 22 January 2026
- Accepted: 14 February 2026
- Published online: 13 May 2026
Abstract: Understanding relationships among pear (Pyrus spp.) accessions and ensuring their correct identification is critical for breeding and germplasm management. In this study, we analyzed 445 accessions, primarily Pyrus communis, using three genotyping approaches to assess population structure, determine parentage, and identify cultivars. ddRAD libraries were prepared using the restriction enzymes AvaII and MspI. From more than 7,000 SNPs pruned for linkage disequilibrium, we distinguished species, identified clones, commonly used breeding cultivars and their offspring, and detected misclassified accessions. From the identified SNPs, we developed a panel of over 100 amplicon-based SNP (abSNP) markers. In parallel, we designed a novel set of 17 SSR markers, allowing both marker types to be genotyped in a single PCR reaction and directly compared. The SSR panel proved highly robust, achieving a probability of identity (PID) of 9.1 × 10⁻²⁵, which allowed for discrimination among individual accessions and facilitated parentage assignment. In contrast, abSNP markers were less reliable for parentage analysis due to amplification bias associated with the highly heterogeneous pear genome. Nevertheless, abSNP markers were highly effective for clone identification, cultivar discrimination, and population-level studies. These results provide a framework for cost-effective genotyping and germplasm management in pear breeding programs.
-
Key words:
- Pyrus /
- Genotyping /
- ddRAD /
- SSR /
- Amplicon