


-
Aggressive behavior, often manifesting as mutual intraspecies fighting, is a critical evolutionary trait that plays a vital role in securing resources, mates, territorial control, and social status for animals[1]. This behavior is pivotal for survival and reproduction across various species. Extensive research has been conducted to understand aggression in diverse species, including humans, mice, zebrafish, and flies[2−6]. In the context of commercial pig production, the practice of mixing pigs is commonly employed to optimize barn space and facilitate batch production[7]. However, this practice leads to inevitable aggressive interactions as pigs from different sources fight intensely to establish new social hierarchies[7]. Such aggression results in several negative outcomes, including noticeable skin damage on the front side of the carcass and the tail. This damage not only leads to secondary infections but also causes psychological trauma, stress, reduced immunity, and compromises animal welfare[8]. Furthermore, the skin lesions caused by aggression, as well as the stress from mixed herd attacks during transportation to slaughterhouses, can significantly affect meat quality and sensory properties[9,10].
The neural circuits that govern aggressive behavior in mammals are remarkably conserved across species and primarily involve key brain areas such as the hypothalamus, prefrontal cortex, and amygdala[11,12]. A central component in understanding aggression, especially its link to stress responses, is the hypothalamic-pituitary-adrenal (HPA) axis[13,14]. The HPA axis begins its activation in the hypothalamus. Specifically, the paraventricular nucleus (PVN) secretes corticotropin-releasing hormone (CRH) and arginine vasopressin (AVP). These hormones then stimulate the pituitary gland to produce and release adrenocorticotropic hormone (ACTH) into the bloodstream. Once ACTH reaches the adrenal cortex, it triggers the secretion of glucocorticoids, mainly cortisol in humans and corticosterone in many other mammals. Corticosterone, a primary glucocorticoid in many mammals, has a significant relationship with aggressive behavior. For example, during nicotine withdrawal, mice typically exhibit increased levels of aggression, which positively correlate with elevated corticosterone levels[15]. Similarly, mice that display dominant aggressive behavior have been found to have significantly higher concentrations of plasma corticosterone[16]. In the context of territorial aggression, such as that observed in Song Sparrows, corticosterone plays a more crucial role than testosterone[17].
In pigs, aggressive behavior is a complex trait influenced by genetic, nutritional, and early socialization factors[18−21]. Thanks to advancements in high-throughput sequencing technologies, whole-genome sequencing can now be used to analyze traits like aggressive behavior. For instance, genome-wide association studies (GWAS) have identified a link between the SLC12A9 gene and feather pecking and aggression in chickens, and a specific single nucleotide polymorphism (SNP) in the monoamine oxidase A (MAOA) gene (c.1164+41 T > C) has been associated with aggression in horses[22,23]. Porcine SLCO3A1 copy number variation (CNV) shows significant associations with aggression phenotypes and exhibits differential expression in temporal lobe tissues of pigs with contrasting aggression traits[21].
Although GWAS has significantly advanced aggression research, further multifaceted investigations are required to fully elucidate the molecular regulatory basis of aggressive behavior, given the inherent complexity of its underlying mechanisms. In this study, an integrated analysis of transcriptomic and metabolomic data from the hypothalamus and pituitary of pigs displaying varying levels of aggression was conducted. The primary objectives were to identify genes and metabolites potentially linked to aggressive behavior in pigs and to characterize gene transcription and metabolites of the HPA axis in pigs with differing aggression levels.
-
The animal experiments were conducted at Jiangsu Huaduo Animal Husbandry Technology Co., Ltd. in Xuzhou, Jiangsu, China. Before the experiment, a high-definition camera (EZVIZ CB3, Hangzhou, China) was installed above the pen for optimal observation. To select the most (M) and least (L) aggressive pigs, we implemented a two-stage behavioral observation. Initially, 160 weaned piglets were grouped in the aisle and then distributed into eight piggeries, each with 20 piglets, sorted by body weight and sex. During the experiment, all piglets had unlimited access to food and water. Aggressive behavior was monitored continuously for 48 h post-mixing. We recorded the duration and frequency of active attacks, defining fights as aggressive events lasting over 3 s, with a minimum 8-s interval between successive fights involving the same pig pair[24]. The composite aggressive score (CAS) was calculated as follows: the sum of active attack durations (s) multiplied by 0.07, plus the frequency of active attacks[25].
In the second stage, following the initial 48-h observation, the five pigs with the highest and lowest CAS values in each pen were selected. This resulted in a total of 80 pigs, which were then allocated to four separate barns. After another 48-h observation period, the four pigs with the highest and lowest CAS values from each group were chosen (Supplementary Table S1).
The selected piglets were euthanized using ether anesthesia, after which their entire brain tissue was removed. The hypothalamus (HP) and pituitary gland (PG) tissues were carefully identified and extracted. These samples were immediately flash-frozen in liquid nitrogen and stored at −80 °C in an ultra-low temperature freezer for future transcriptomic and metabolic analyses.
Metabolomics analysis
-
Metabolite extraction and quality control were conducted on HP and PG samples from the most and least aggressive pigs, utilizing established analytical methods consistent with prior publications[26]. This process led to the exclusion of one PG sample due to contamination, resulting in a total of 15 samples for metabolite analysis, comprising eight HP and seven PG samples (with four each of HPM, HPL, and PGL, and three PGM samples). Given the lack of a universally established functional metabolite database, this study integrated four annotation platforms: KEGG, HMDB, METLIN, and CAS. Metabolites identified across databases were systematically annotated according to their respective classification systems. Multivariate analyses (OPLS-DA) of tissue-specific metabolite profiles elucidated distribution patterns and identified variable importance in projection (VIP) scores. A t-test was performed to analyze the differences in metabolite expression levels between groups. Differentially expressed metabolites (DEMs) were subsequently identified through inter-group comparisons (HPM vs HPL, PGM vs PGL) applying dual thresholds (VIP > 1, p < 0.05). These DEMs were further analyzed using the KEGG database to understand their functional significance. Co-expression networks of metabolites in the HP and PG of the most and least aggressive pigs were constructed using the R package WGCNA.
RNA extraction and RNA sequencing
-
Total RNA from the HP and PG was extracted using the Trizol method (Vazyme, China). And underwent 150 bp bipartite paired-end sequencing on the Illumina Nova-seq 6000 platform (Illumina, USA). Fastp (v 0.19.7) was employed for quality control and read splicing to yield clean data[27]. The HISAT2 (v 2.1.0) aligned sequencing data with the latest pig reference genome (Sscrofa 11.1), and featureCounts (v 1.5.3) generated gene expression matrices[28,29]. Data normalization produced Fragments Per Kilobase of exon model per Million mapped fragments (FPKM) expression matrices. Using the R package limma (v 3.9.19), differentially expressed genes (DEGs) between the most and least aggressive pigs were identified, applying a fold change > 2 or < 0.5 and p-value < 0.05[30]. Gene Ontology (GO) and Kyoto Encyclopedia of Genes and Genomes (KEGG) enrichment analyses of DEGs were performed using KOBAS (v 3.0)[31]. The Kmeans and Mfuzz methods clustered detected genes in the M and L groups[32,33]. For further insights, gene set enrichment analysis (GSEA) and gene set variation analysis (GSVA) were conducted using the clusterProfiler (v 4.4.2) and GSVA packages in R[34,35]. Additionally, the WGCNA (v 1.7.1) method constructed a co-expression network of genes in the HP and PG of the most and least aggressive pigs (HPM, HPL, PGM, PGL)[36].
Integrated analysis of transcriptomic and metabolomic data
-
The KEGG enrichment analysis revealed that the 'GABAergic synapse' pathway (Entry: ssc04727) was co-differently expressed in both transcriptomic and metabolomic data of the hypothalamus (HP) and pituitary gland (PG) from the most (M) and least (L) aggressive pigs. To explore the correlations between genes and metabolites in this pathway, analyses were conducted in the transcriptome and metabolome using OmicStudio[37]. For genes significantly associated with GABA-related metabolites, Cytoscape (v 3.9.1) was employed to predict the transcription factors binding to these genes. Using Cytoscape, a transcription factor-gene-metabolite network diagram was constructed, illustrating the intricate interactions within the 'GABAergic synapse' pathway in the context of aggression-related traits in pigs.
Quantitative PCR validation
-
Total RNA from the hypothalamus of the most aggressive (HPM) and least aggressive (HPL) pigs was extracted and reverse-transcribed into cDNA (Vazyme, China). qPCR primers were designed via Primer-BLAST and are detailed in Supplementary Table S2. Porcine GAPDH served as an internal reference gene, with relative gene expression calculated using the 2−ΔΔCᴛ method. The qPCR reactions employed the SYBR green method on a QuantStudio 7 real-time PCR system (ABI, USA). The qPCR reaction mixture, totaling 10 μL, consisted of 5 μL SYBR master mix (2×), 0.2 μL each of forward and reverse primers (20 pmol/μL), 1 μL of cDNA, and 3.6 μL of water. The amplification protocol started with a 2-min initial denaturation at 95 °C, followed by 40 cycles of 95 °C for 10 s and 60 °C for 30 s. Each sample underwent three technical replicates.
Statistical analysis
-
The significance of experiments was analyzed using a t-test in IBM SPSS Statistics 26. Data results are expressed as mean ± SEM, with a p-value of less than 0.05 indicating a significant difference and a p-value of less than 0.01 indicating a very significant difference. Pearson correlation coefficients were calculated to quantify the degree of linear relationship between variables. The results with a p-value of less than 0.05 were defined as significantly different.
-
Untargeted metabolomics sequencing via LC-MS methods was utilized to explore differences in metabolite profiles between the HP and PG of the most (M) and least (L) aggressive pigs. PCA highlighted significant disparities in metabolite compositions between the HP and PG. The first two principal components, PC1 and PC2, accounted for 13.65% and 11.27% of the total variance, respectively (Fig. 1a).
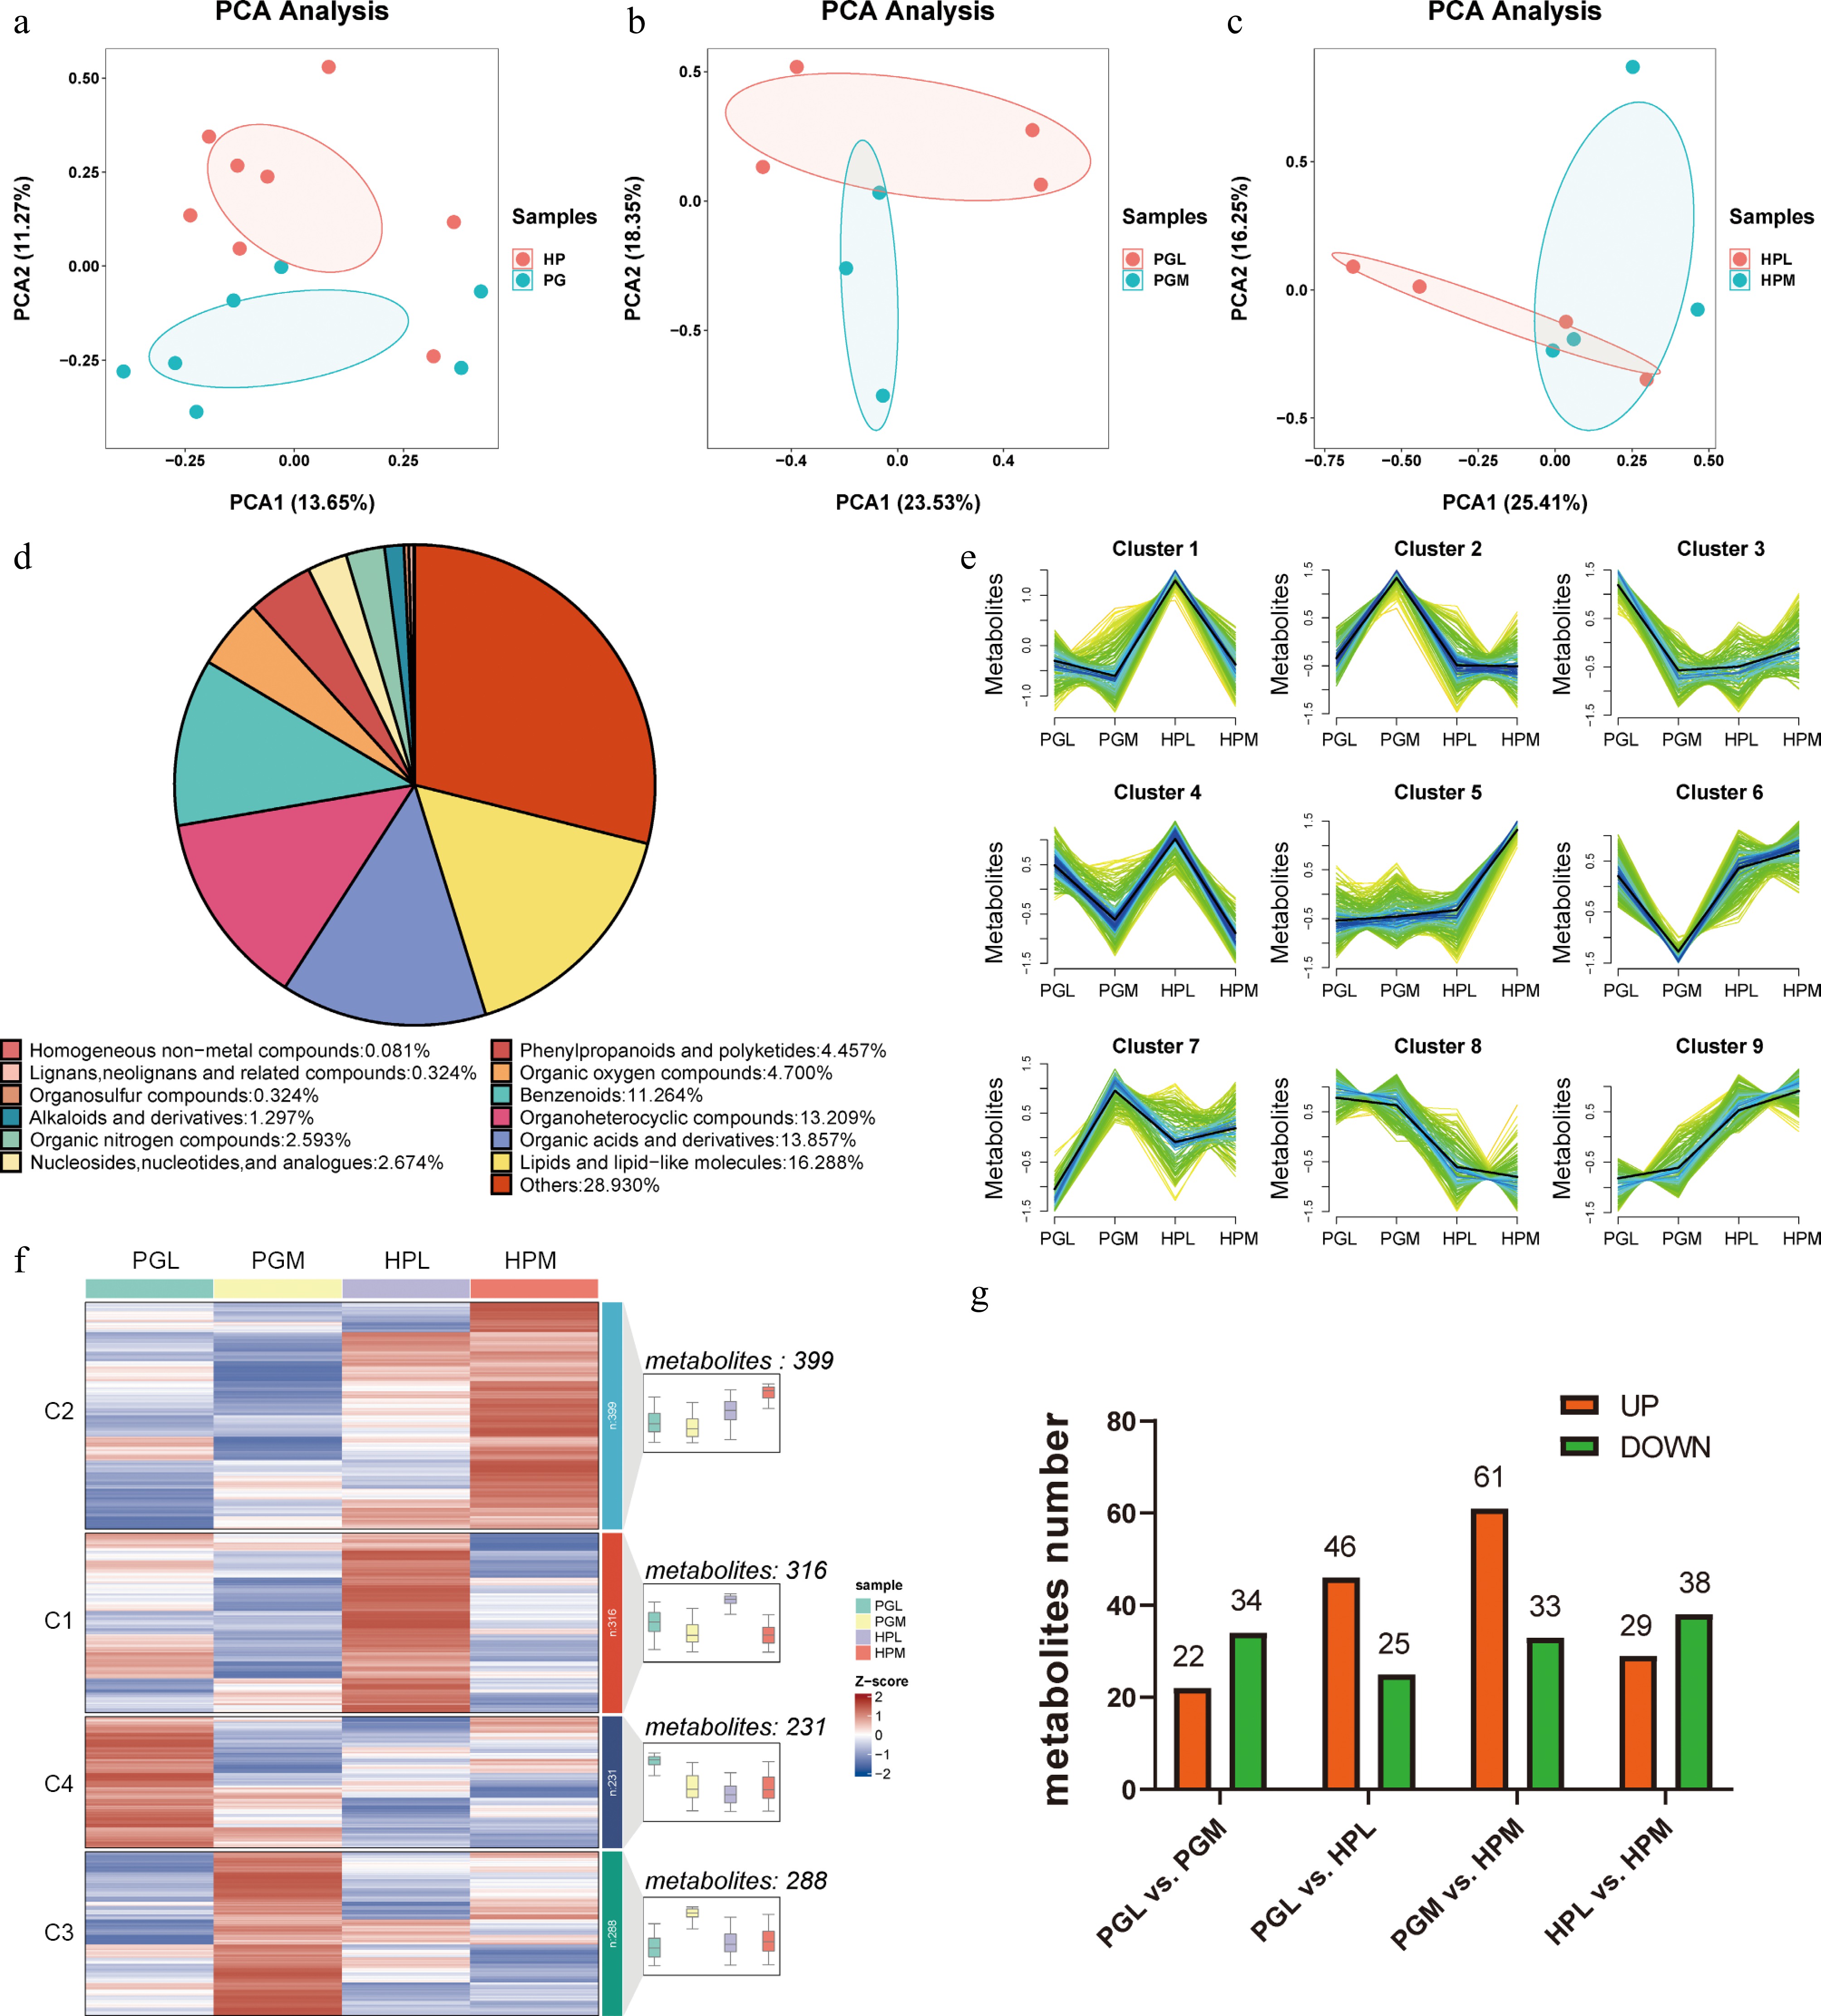
Figure 1.
Metabolite profiles between the hypothalamus (HP) and pituitary gland (PG) of pigs exhibiting varying levels of aggression. (a)−(c) are Principal Component Analysis (PCA) of metabolites identified from different tissues (HP vs PG) and aggression (the hypothalamus of the most aggressive (HPM) vs the hypothalamus of the least aggressive (HPL), the hypothalamus of the least aggressive pigs (HPL) vs the hypothalamus of the most aggressive pigs (HPM)). (d) Pie chart depicting the categories of metabolites. (e) and (f) represent cluster analysis of all detected metabolites using Mfuzz and Kmeans clustering methods, respectively. (g) The number of differentially expressed metabolites (DEMs) (VIP > 1 and p < 0.05) identified in different tissues (PGL vs HPL, PGM vs HPM) and aggression (PGL vs PGM, HPL vs PGM).
In this study, significant differences were observed in the metabolite compositions between the HP and PG of the most and least aggressive pigs, as illustrated in Fig. 1b and c. A total of 1234 metabolites were identified, with 357 (28.39%) not annotated in public databases (Supplementary Table S3). Of the 877 annotated metabolites, 'Lipids and lipid-like molecules' were the most abundant (201, 16.288%), followed by 'Organic acids and derivatives' (171, 13.857%). The category with the fewest identified metabolites was 'Homogeneous non-metal compounds', with only one (Fig. 1d). Potential aggression-related metabolites were identified using clustering methods. The Mfuzz method classified the 1,234 metabolites into nine classes, with Cluster 4 containing 142 metabolites showing lower expression in HPM than in HPL, and Cluster 5 including 160 metabolites with higher expression in HPM compared to HPL (Fig. 1e). The K-means clustering method divided the metabolites into four classes; in Cluster 1316 metabolites showed higher expression in HPL compared to HPM, while Cluster 2 contained 399 metabolites with higher expression in HPM compared to HPL (Fig. 1f). A total of 56 differentially expressed metabolites (DEMs) were identified in the PG (PGL vs PGM) using a VIP threshold > 1 and a p-value < 0.05 (Supplementary Table S4), with 34 up-regulated and 22 down-regulated in M compared to L pigs. In the HP (HPL vs HPM), 67 DEMs were identified, with 38 up-regulated and 29 down-regulated in M compared to L pigs (Fig. 1g).
Identification of metabolite markers associated with aggressive behavior
-
The HP, as a central organ of the HPA axis, shows a significant link between its metabolite changes and aggressive behavior. Venn plots were used to identify candidate marker metabolites via Kmeans, Mfuzz, and DEMs approaches (Fig. 2a, b). Among the metabolites identified as highly expressed in HPL by these methods (316 in Kmeans, 142 in Mfuzz, and 38 in DEMs), 15 overlapped across all three approaches (Fig. 2c). Conversely, 14 metabolites were consistently identified as highly expressed in HPM (399 in Kmeans, 160 in Mfuzz, and 29 in DEMs) (Fig. 2c).
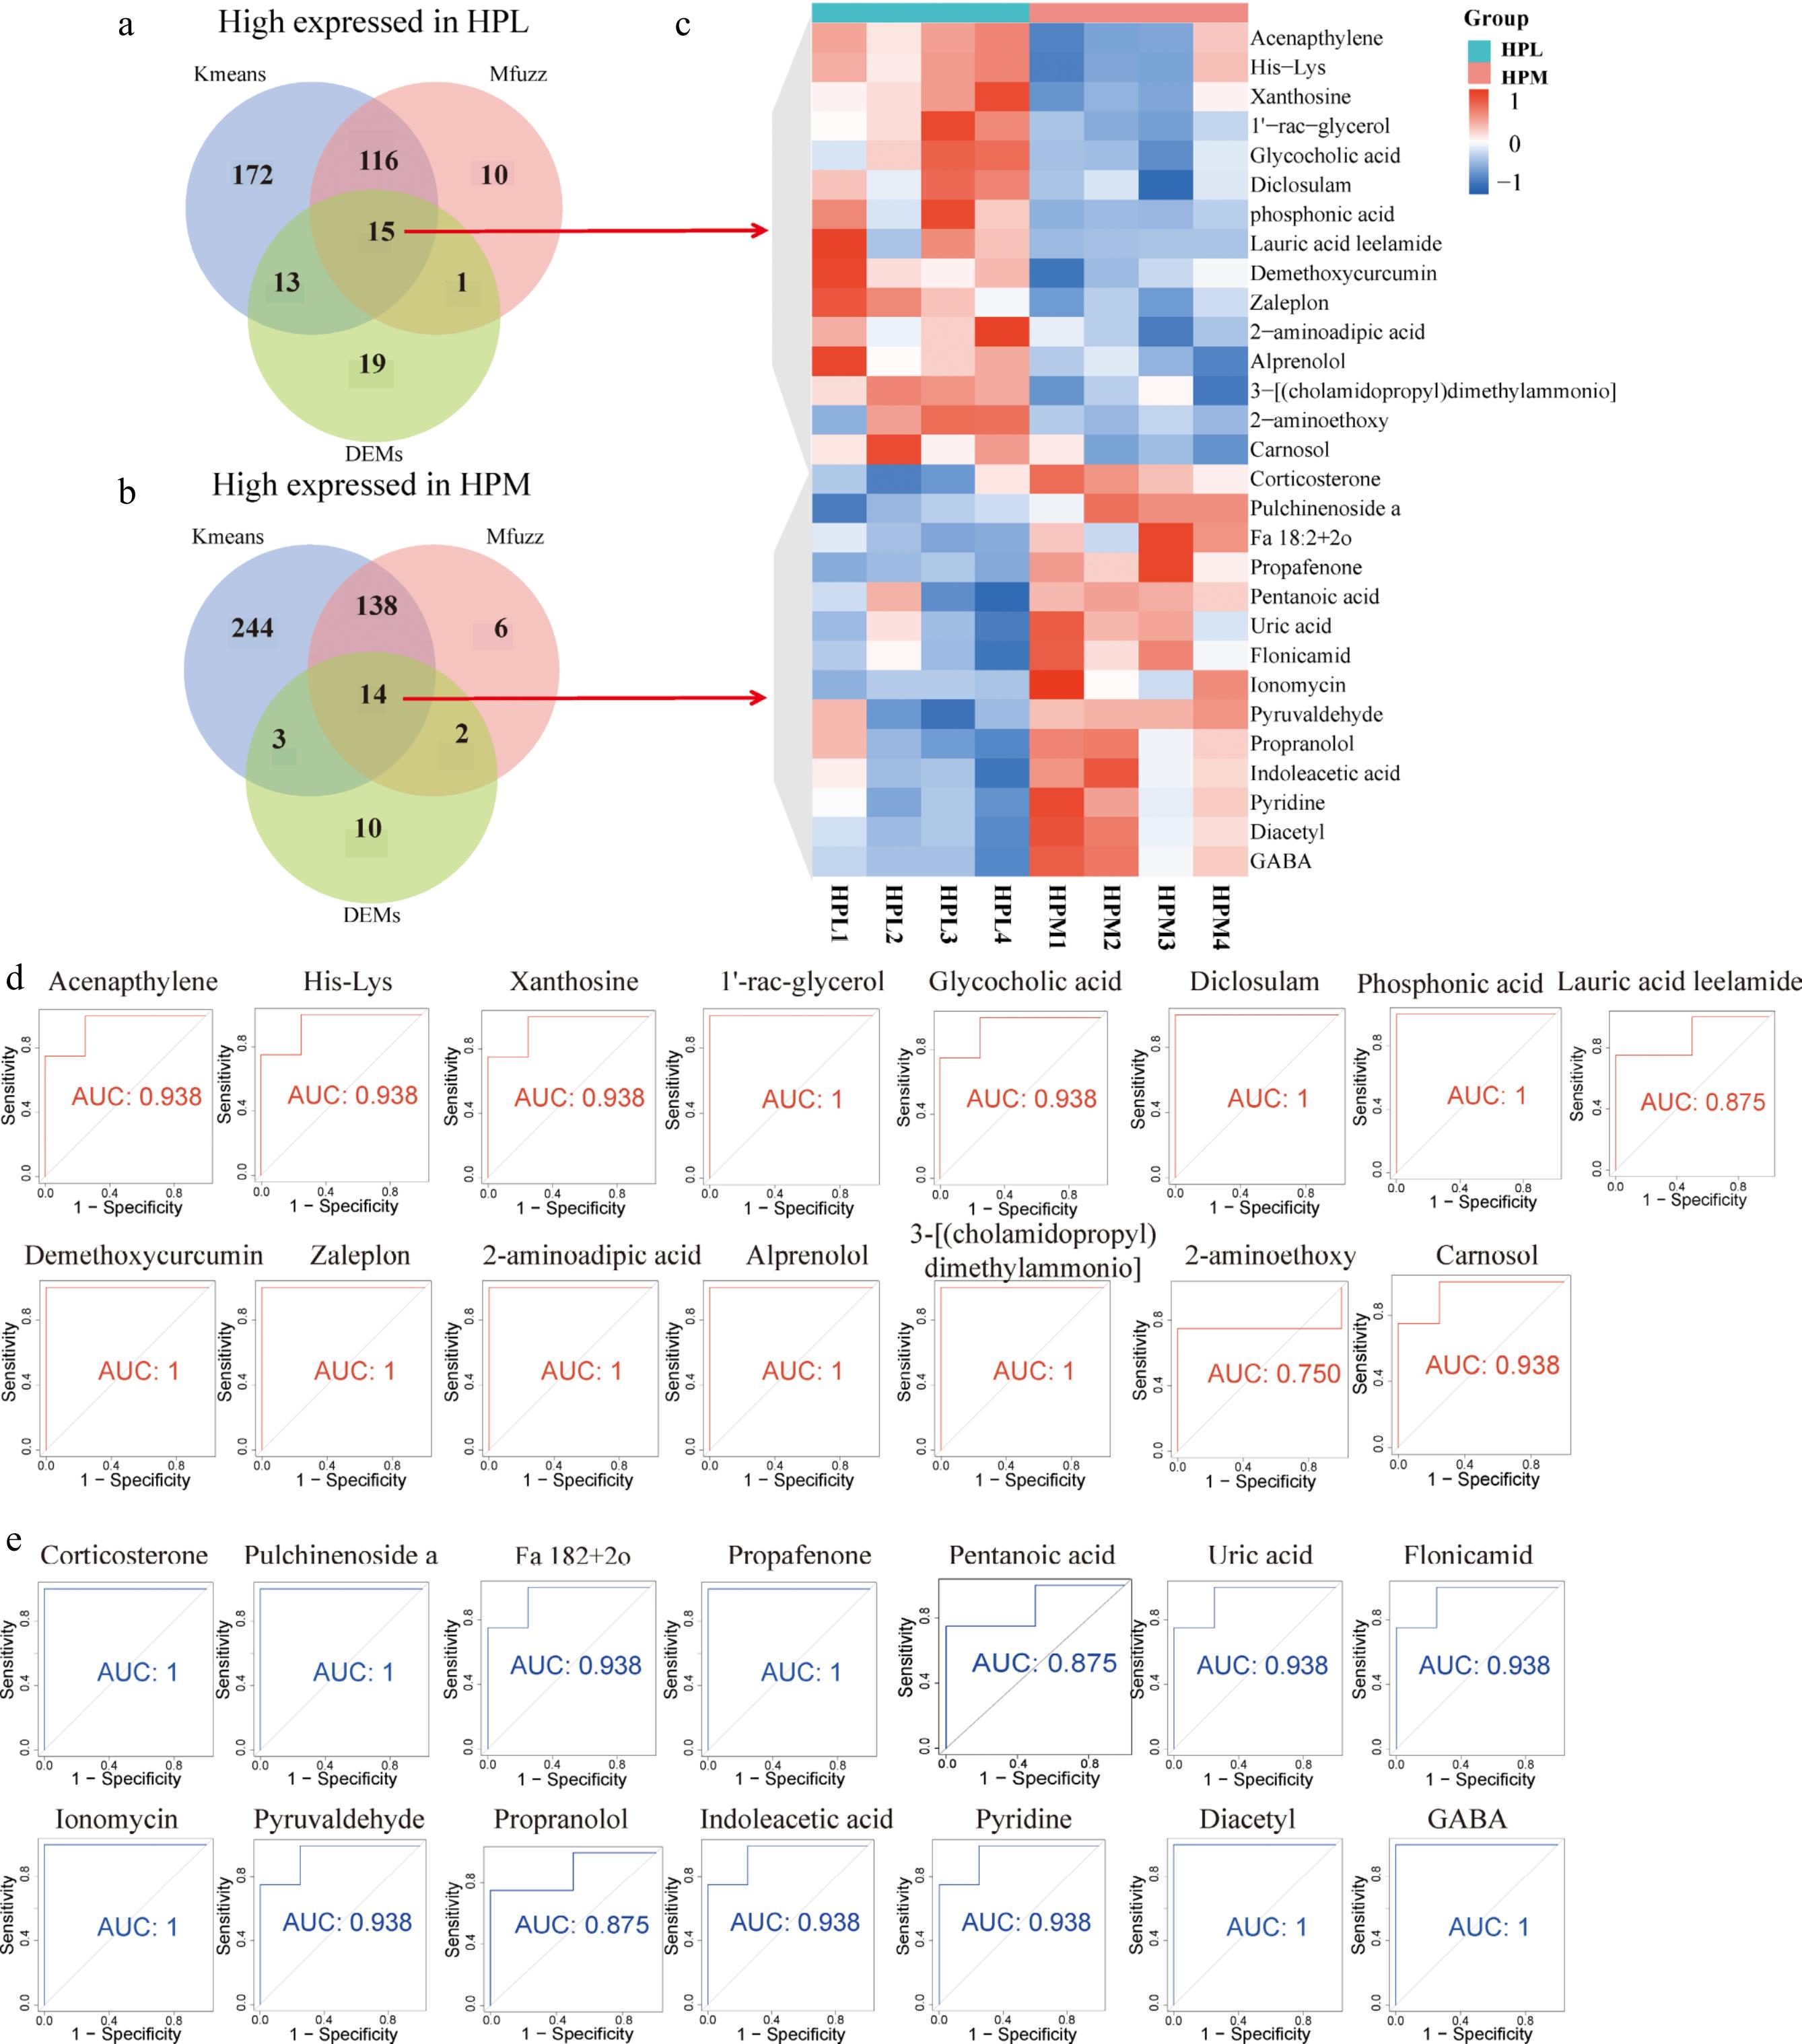
Figure 2.
Identification of molecular markers for metabolites associated with aggressive behavior. Metabolite markers in the HP of the (a) most and (b) least aggressive behavior identified by combining different data processing methods (kmeans, Mfuzz, and DEMs). (c) Heatmap of the expression levels of metabolic markers related to aggressive behavior in the HP. (d) and (e) The Receiver Operating Characteristic (ROC) curves for these candidate metabolic markers.
Twelve of these were annotated as organoheterocyclic compounds (Indoleacetic acid, Pyridine, Uric acid, Flonicamid), lipids and lipid-like molecules (Pulchinenoside a, Ionomycin, Corticosterone), organic oxygen compounds (Diacetyl, Pyruvaldehyde), benzenoids (Propranolol), organic acids and derivatives (gamma-aminobutyric acid, GABA), and phenylpropanoids and polyketides (Propafenone). Receiver Operating Characteristic (ROC) curves further investigated these metabolites' potential as biomarkers for aggressive behavior. The 15 metabolites highly expressed in HPL had an area under the curve (AUC) above 0.75, with eight reaching an AUC of 1 (Fig. 2d). All 14 metabolites highly expressed in HPM exhibited an AUC above 0.875, with six achieving an AUC of 1 (Fig. 2e). These results suggest that the metabolites identified through combined analysis hold potential as biomarkers for aggressive behavior.
Metabolomic functional enrichment analysis
-
Previous research has extensively investigated the link between aggressive behavior and the dopamine metabolic pathway, serotonin pathway, and aldosterone pathway[15,38]. In our study, we analyzed the expression levels of dopamine and 3-methoxytyramine (Dopaminergic synapse), serotonin (Serotonergic synapse), and corticosterone (Aldosterone synthesis and secretion).
However, significant differences were observed only in the expression of corticosterone in the HP between the most and least aggressive pigs (HPL vs HPM, p < 0.05), as shown in Fig. 3a−d. To delve deeper into the relationship between metabolites and aggressive behavior, we performed weighted gene co-expression network analysis (WGCNA) on the 1,234 detected metabolites. These metabolites were classified into 17 modules (Fig. 3e). Notably, 117 metabolites in the MEblue module (Supplementary Table S5) exhibited a positive correlation with the most aggressive pigs (HPM) and a negative correlation with the least aggressive ones (HPL), as depicted in Fig. 3f. Further KEGG enrichment analysis of the MEblue module metabolites highlighted their involvement in pathways like the synaptic vesicle cycle, neuroactive ligand-receptor interaction, and the cAMP signaling pathway (Fig. 3g). Additionally, KEGG enrichment analysis of differentially expressed metabolites (DEMs) in the HP and PG according to varying aggression levels revealed that PG DEMs predominantly participated in the adipocytokine signaling pathway and cAMP signaling pathway. In contrast, HP DEMs were associated with nicotine addiction and morphine addiction pathways (Fig. 3h). Crucially, both the metabolites in the MEblue module and the DEMs in the HP (HPL vs HPM) showed enrichment in the GABAergic synapse pathway.
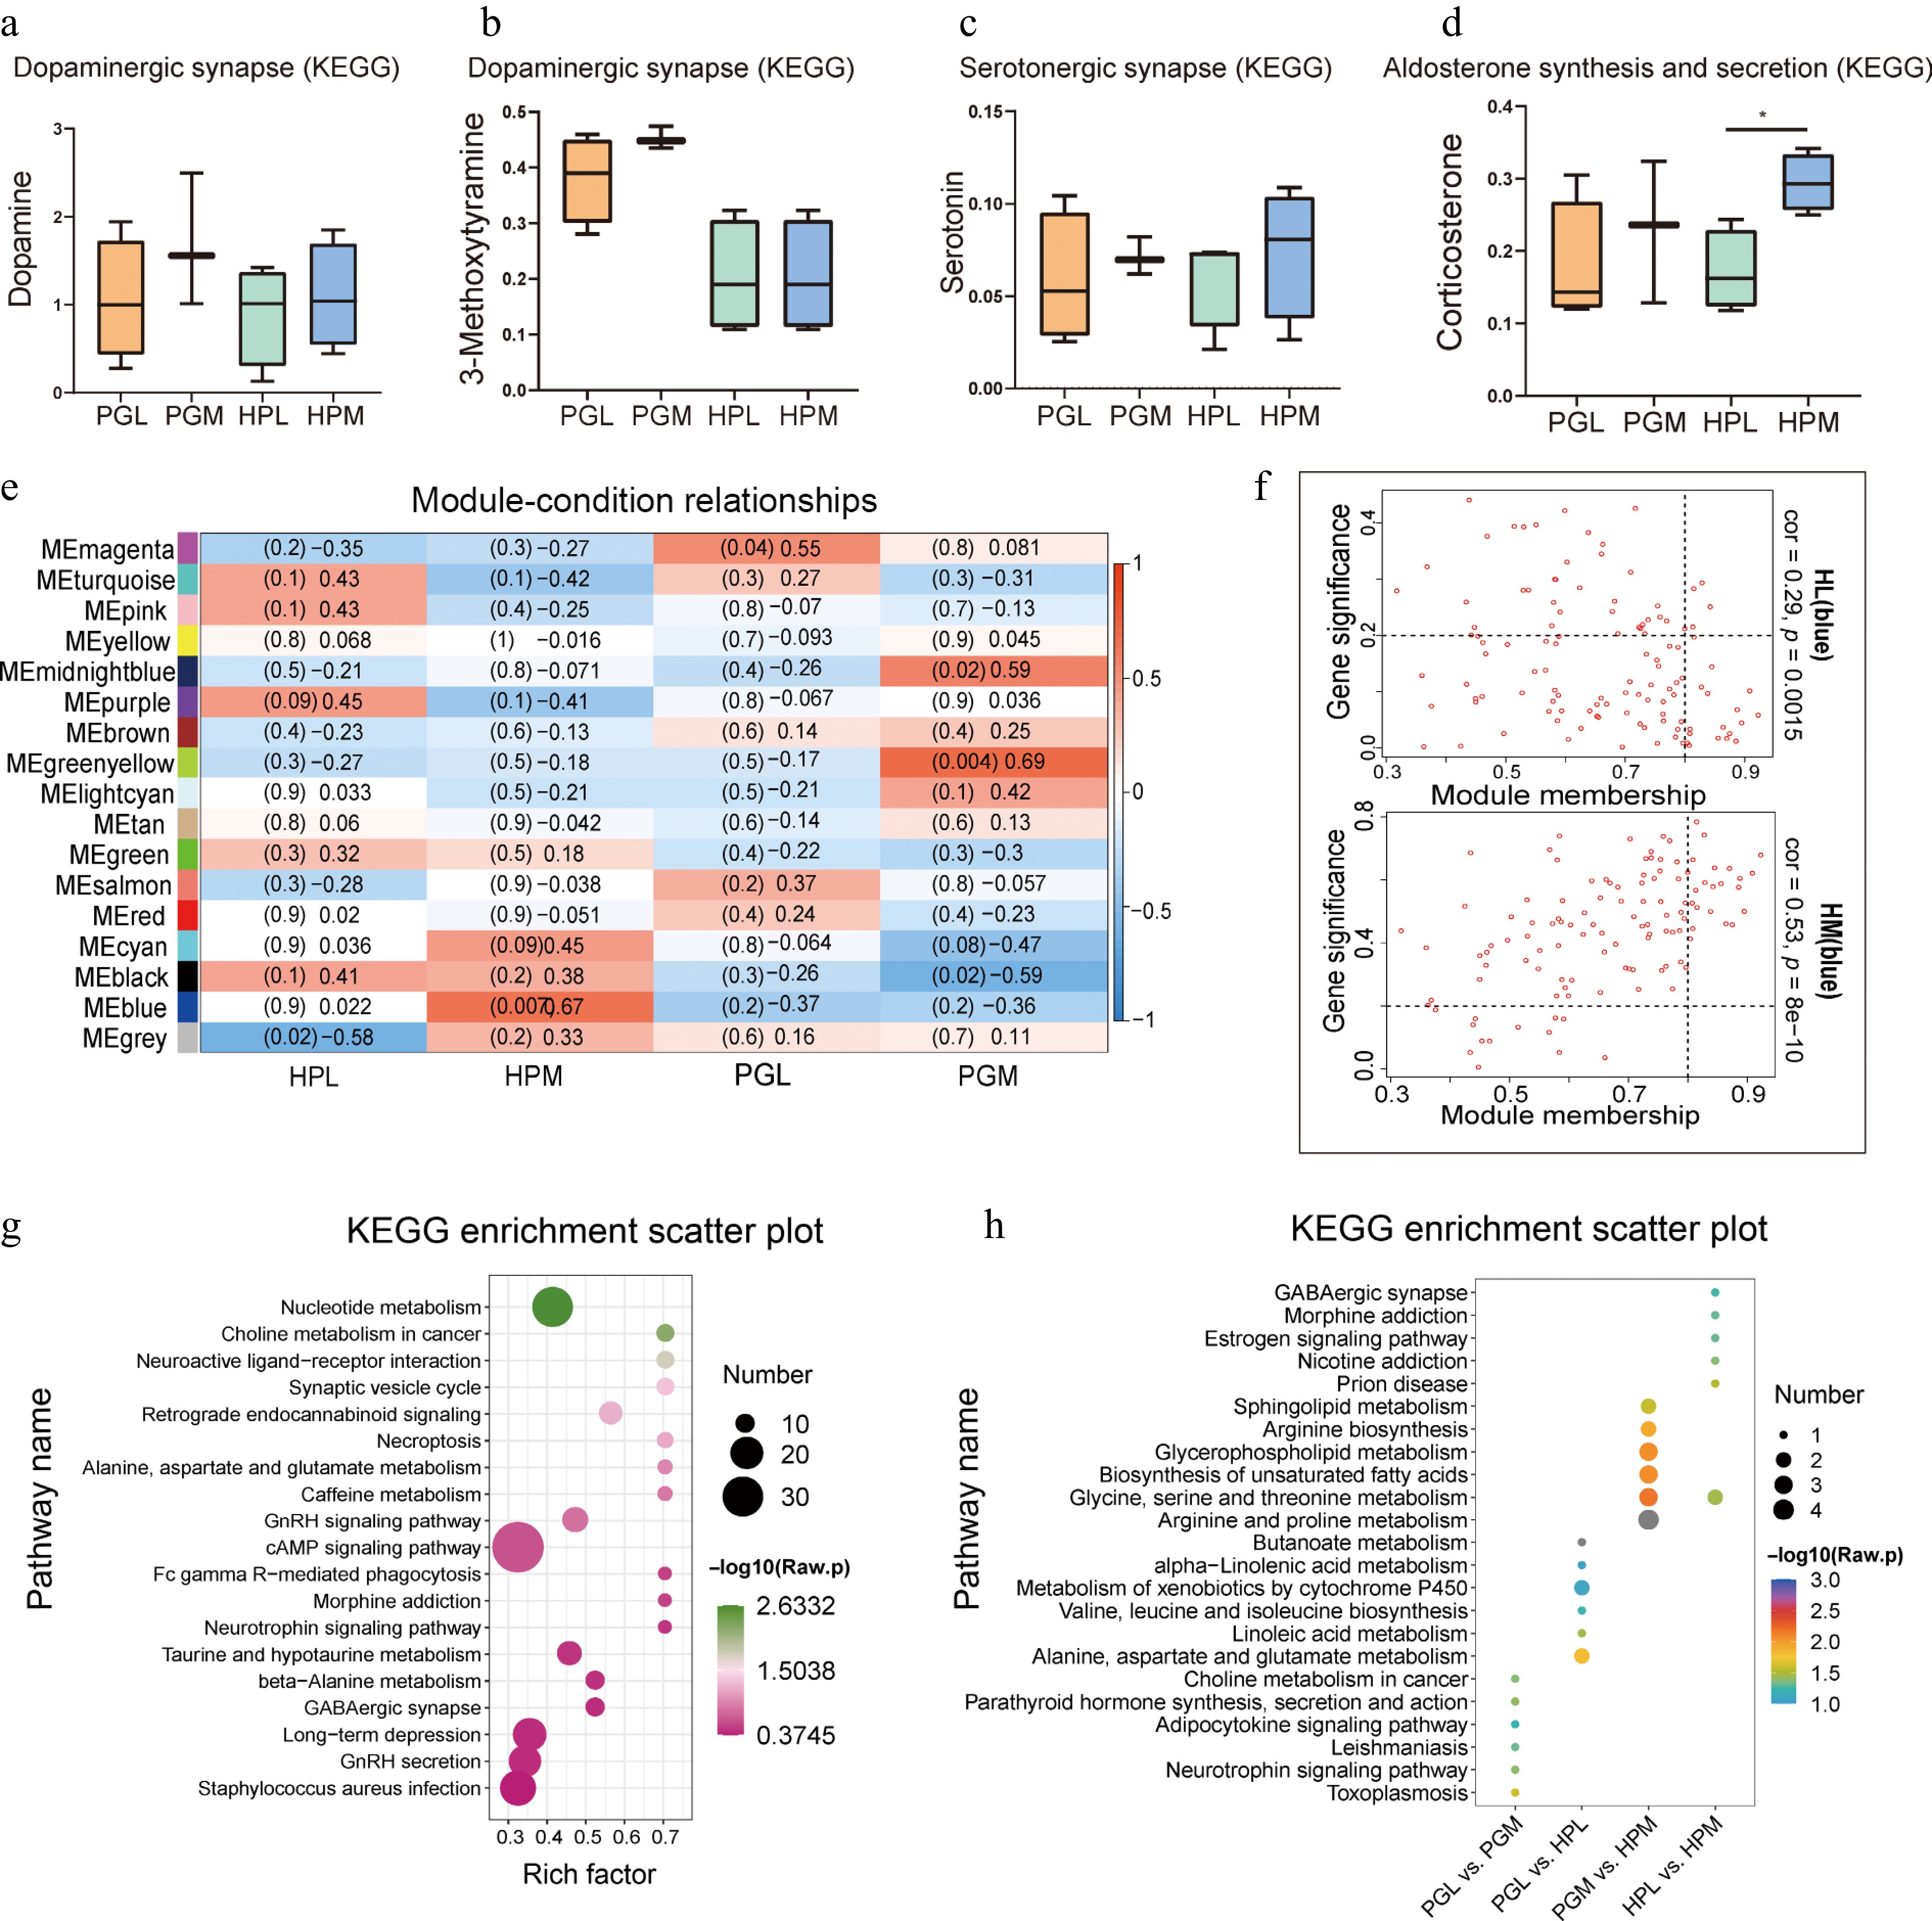
Figure 3.
Functional enrichment analysis of identified metabolites. (a) - (d) represent the relative expression of dopamine, 3-methoxytyamine, serotonin, and corticosterone in the hypothalamus (HP) and pituitary gland (PG) of pigs exhibiting varying degrees of aggression. Notably, a significant difference was observed in the relative expression of corticosterone between the least aggressive pigs (HPL) and the most aggressive pigs (HPM), denoted by an asterisk indicating p < 0.05. (e) Weighted Gene Co-expression Network Analysis (WGCNA) of metabolites in HP and PG of pigs with different aggressive behaviors. (f) Metabolites in the MEblue module were negatively correlated with HPL and positively correlated with HPM. (g) Kyoto Encyclopedia of Genes and Genomes (KEGG) enrichment plot of metabolites in the MEblue module. (h) KEGG enrichment plot of differentially expressed metabolites (DEMs) in tissues (PGL vs HPL, PGM vs HPM) and aggression (PGL vs PGM, HPL vs HPM), showcasing the pathways in which these DEMs are involved.
Transcriptional profiles of PG and HP in pigs with different aggressive behavior
-
Gene transcript levels are essential in regulating aggression. PCA analysis revealed significant differences in transcript levels between the PG and HP of pigs showing varying aggressive behaviors (the most aggressive, M vs the least aggressive, L). The HP and PG were separated into two distinct groups, with the first two principal components, PC1 and PC2, accounting for 34.85% and 8.69% of the variance, respectively, as shown in Fig. 4a. Additionally, the PG and HP displayed two distinct expression patterns in relation to the M and L groups, depicted in Fig. 4b and c. In the PG, 643 DEGs were identified, with 247 genes up-regulated and 396 genes down-regulated in the PGM compared to the PGL, as illustrated in Fig. 4d. The HP showed a larger number of DEGs, with a total of 1,204: 708 genes were up-regulated and 496 genes were down-regulated in the HPM compared to the HPL, as listed in Supplementary Table S6.
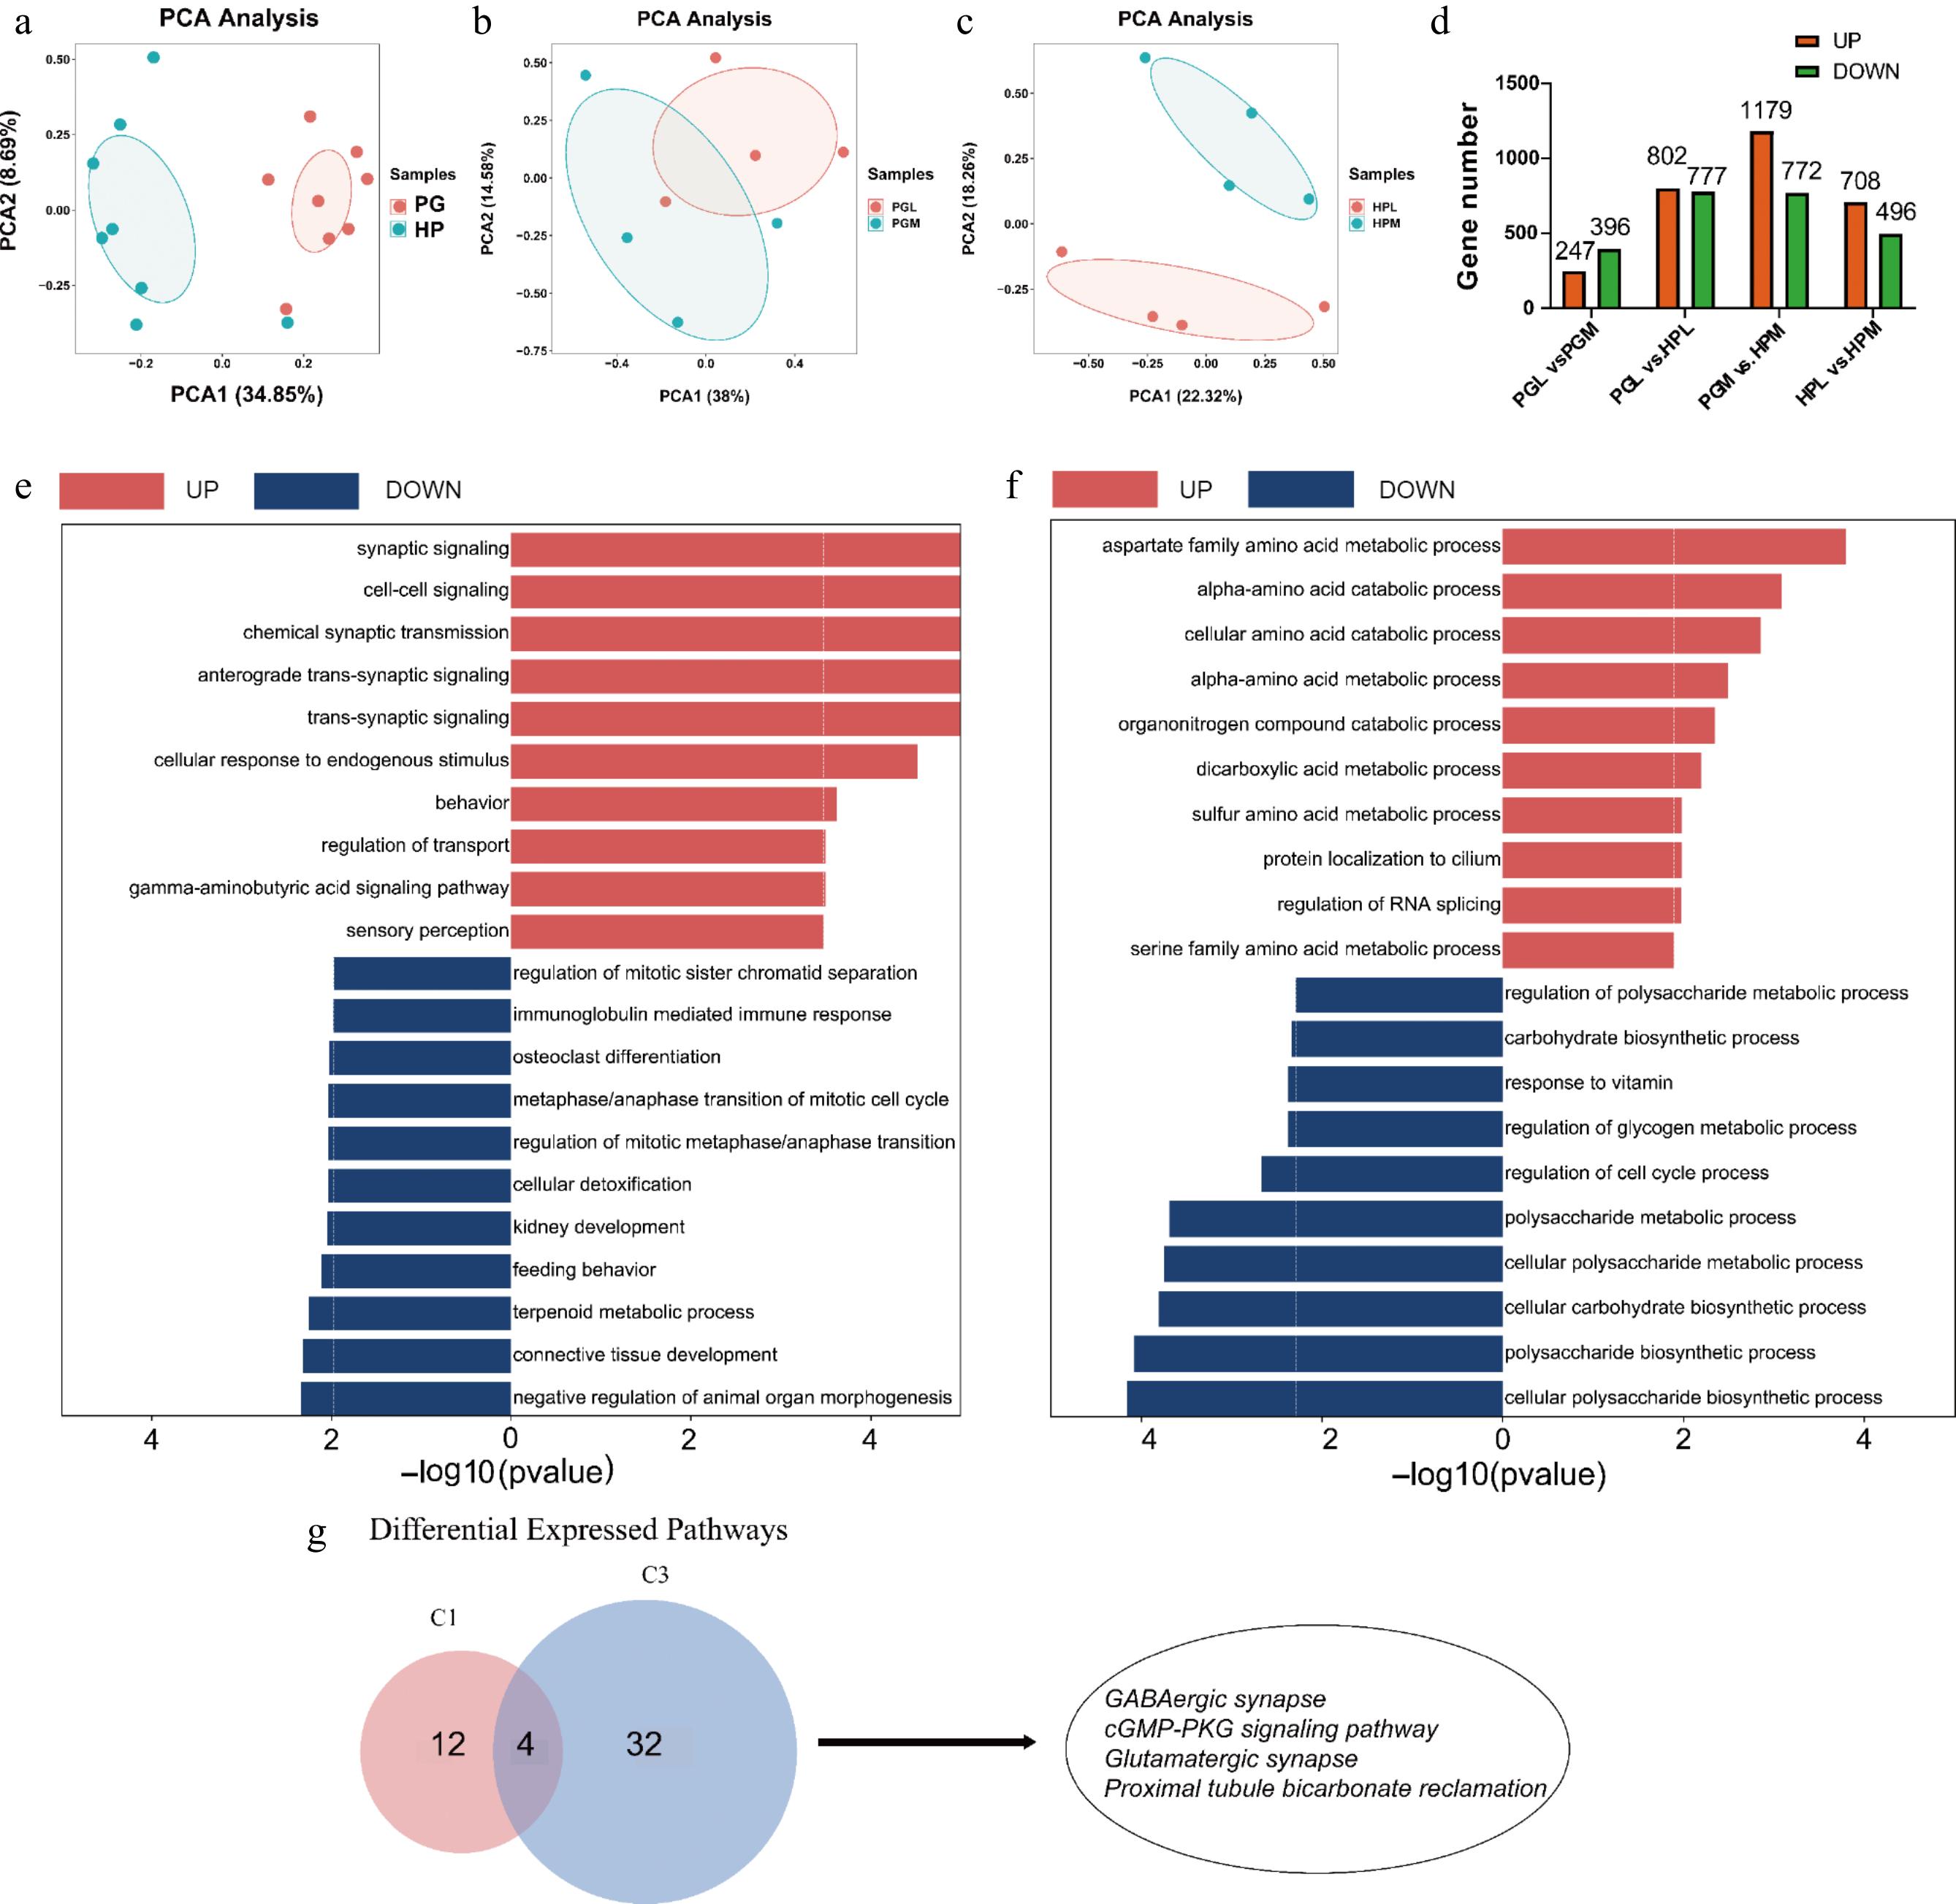
Figure 4.
Transcriptomic profiles of the hypothalamus (HP) and pituitary gland (PG) in the most and least aggressive pigs. (a)−(c) are PCA analyses of genes identified from different tissues (HP vs PG) and aggression (PGL vs PGM, HPL vs HPM). (d) Number of DEGs (fold change > 2 or < 0.5 and p-value < 0.05) identified in different tissues (PGL vs HPL, PGM vs HPM) and aggression (PGL vs PGM, HPL vs PGM). (e) and (f) represent GO enrichment analysis of DEGs for PG (PGL vs PGM) and HP (HPL vs HPM), respectively, where red entries indicate genes up-regulated in the most aggressive compared to least aggressive pigs, and blue indicates down-regulated genes. (g) The Venn plot demonstrates the KEGG pathway that is generally upregulated in the most aggressive pigs, C1 represents the pathway enriched in PGM, and C3 represents the pathway enriched in HPM, including GABAergic synapses, cGMP-PKG signaling, glutamatergic synapses, and proximal tubular carbonic acid synapses were consistently upregulated in both HPM and PGM groups.
GO enrichment analysis was conducted on the DEGs of the HP and PG, specifically focusing on biological process (BP) entries. In the PGM group, the upregulated genes were mainly associated with synaptic signaling and chemical synaptic transmission, as depicted in Fig. 4e. This suggests a significant involvement of these processes in aggressive behavior. In contrast, the genes down-regulated in the PGM group were largely linked to connective tissue development and feeding behavior, indicating a possible reduction in these processes in more aggressive pigs. In the HPM group, the up-regulated genes were primarily related to the aspartate family amino acid metabolic process and alpha-amino acid catabolic process, shown in Fig. 4f. This points to an increased activity in amino acid metabolism in these pigs. Conversely, the genes down-regulated in the HPM group were mainly enriched in polysaccharide metabolic processes, including cellular polysaccharide biosynthetic and metabolic processes. This suggests a decreased involvement in polysaccharide metabolism in more aggressive pigs. The function of DEGs in the HP and PG was assessed using KEGG enrichment analysis. In the PGM, up-regulated genes were predominantly enriched in pathways related to GABAergic synapse, Parkinson's disease, and the proteasome (Supplementary Fig. S1a). In contrast, the genes down-regulated in PGM were mainly enriched in pathways associated with endocrine and other factor-regulated calcium reabsorption, and nicotin and nicotinamide metabolism. Comparatively, in the HPM group, up-regulated genes were enriched in pathways including GABAergic synapse, axon guidance, cGMP-PKG signaling, and glutamatergic synapse. The down-regulated genes in the HPM group were primarily enriched in natural killer cell-mediated cytotoxicity and tryptophan metabolism pathways (Supplementary Fig. S1b).
The pathways that are upregulated in both HPM and PGM groups may be indicative of common characteristics associated with enhanced aggressive behavior. A Venn diagram analysis, covering 16 pathways in the PGM (C1) group and 36 pathways in the HPM (C3) group, was conducted (as shown in Fig. 4g and detailed in Supplementary Table S7). Notably, several pathways such as GABAergic synapses, cGMP-PKG signaling, glutamatergic synapses, and proximal tubular carbonic acid synapses were consistently upregulated in both HPM and PGM groups. This consistency suggests a potential role of these pathways in the regulation of aggressive behavior.
Transcriptomic functional enrichment analysis
-
To further explore gene set variations across different tissues in pigs exhibiting diverse levels of aggressive behavior, GSVA analysis was conducted. This analysis calculated enrichment scores for each KEGG pathway in each sample, as shown in Fig. 5a and detailed in Supplementary Table S8.
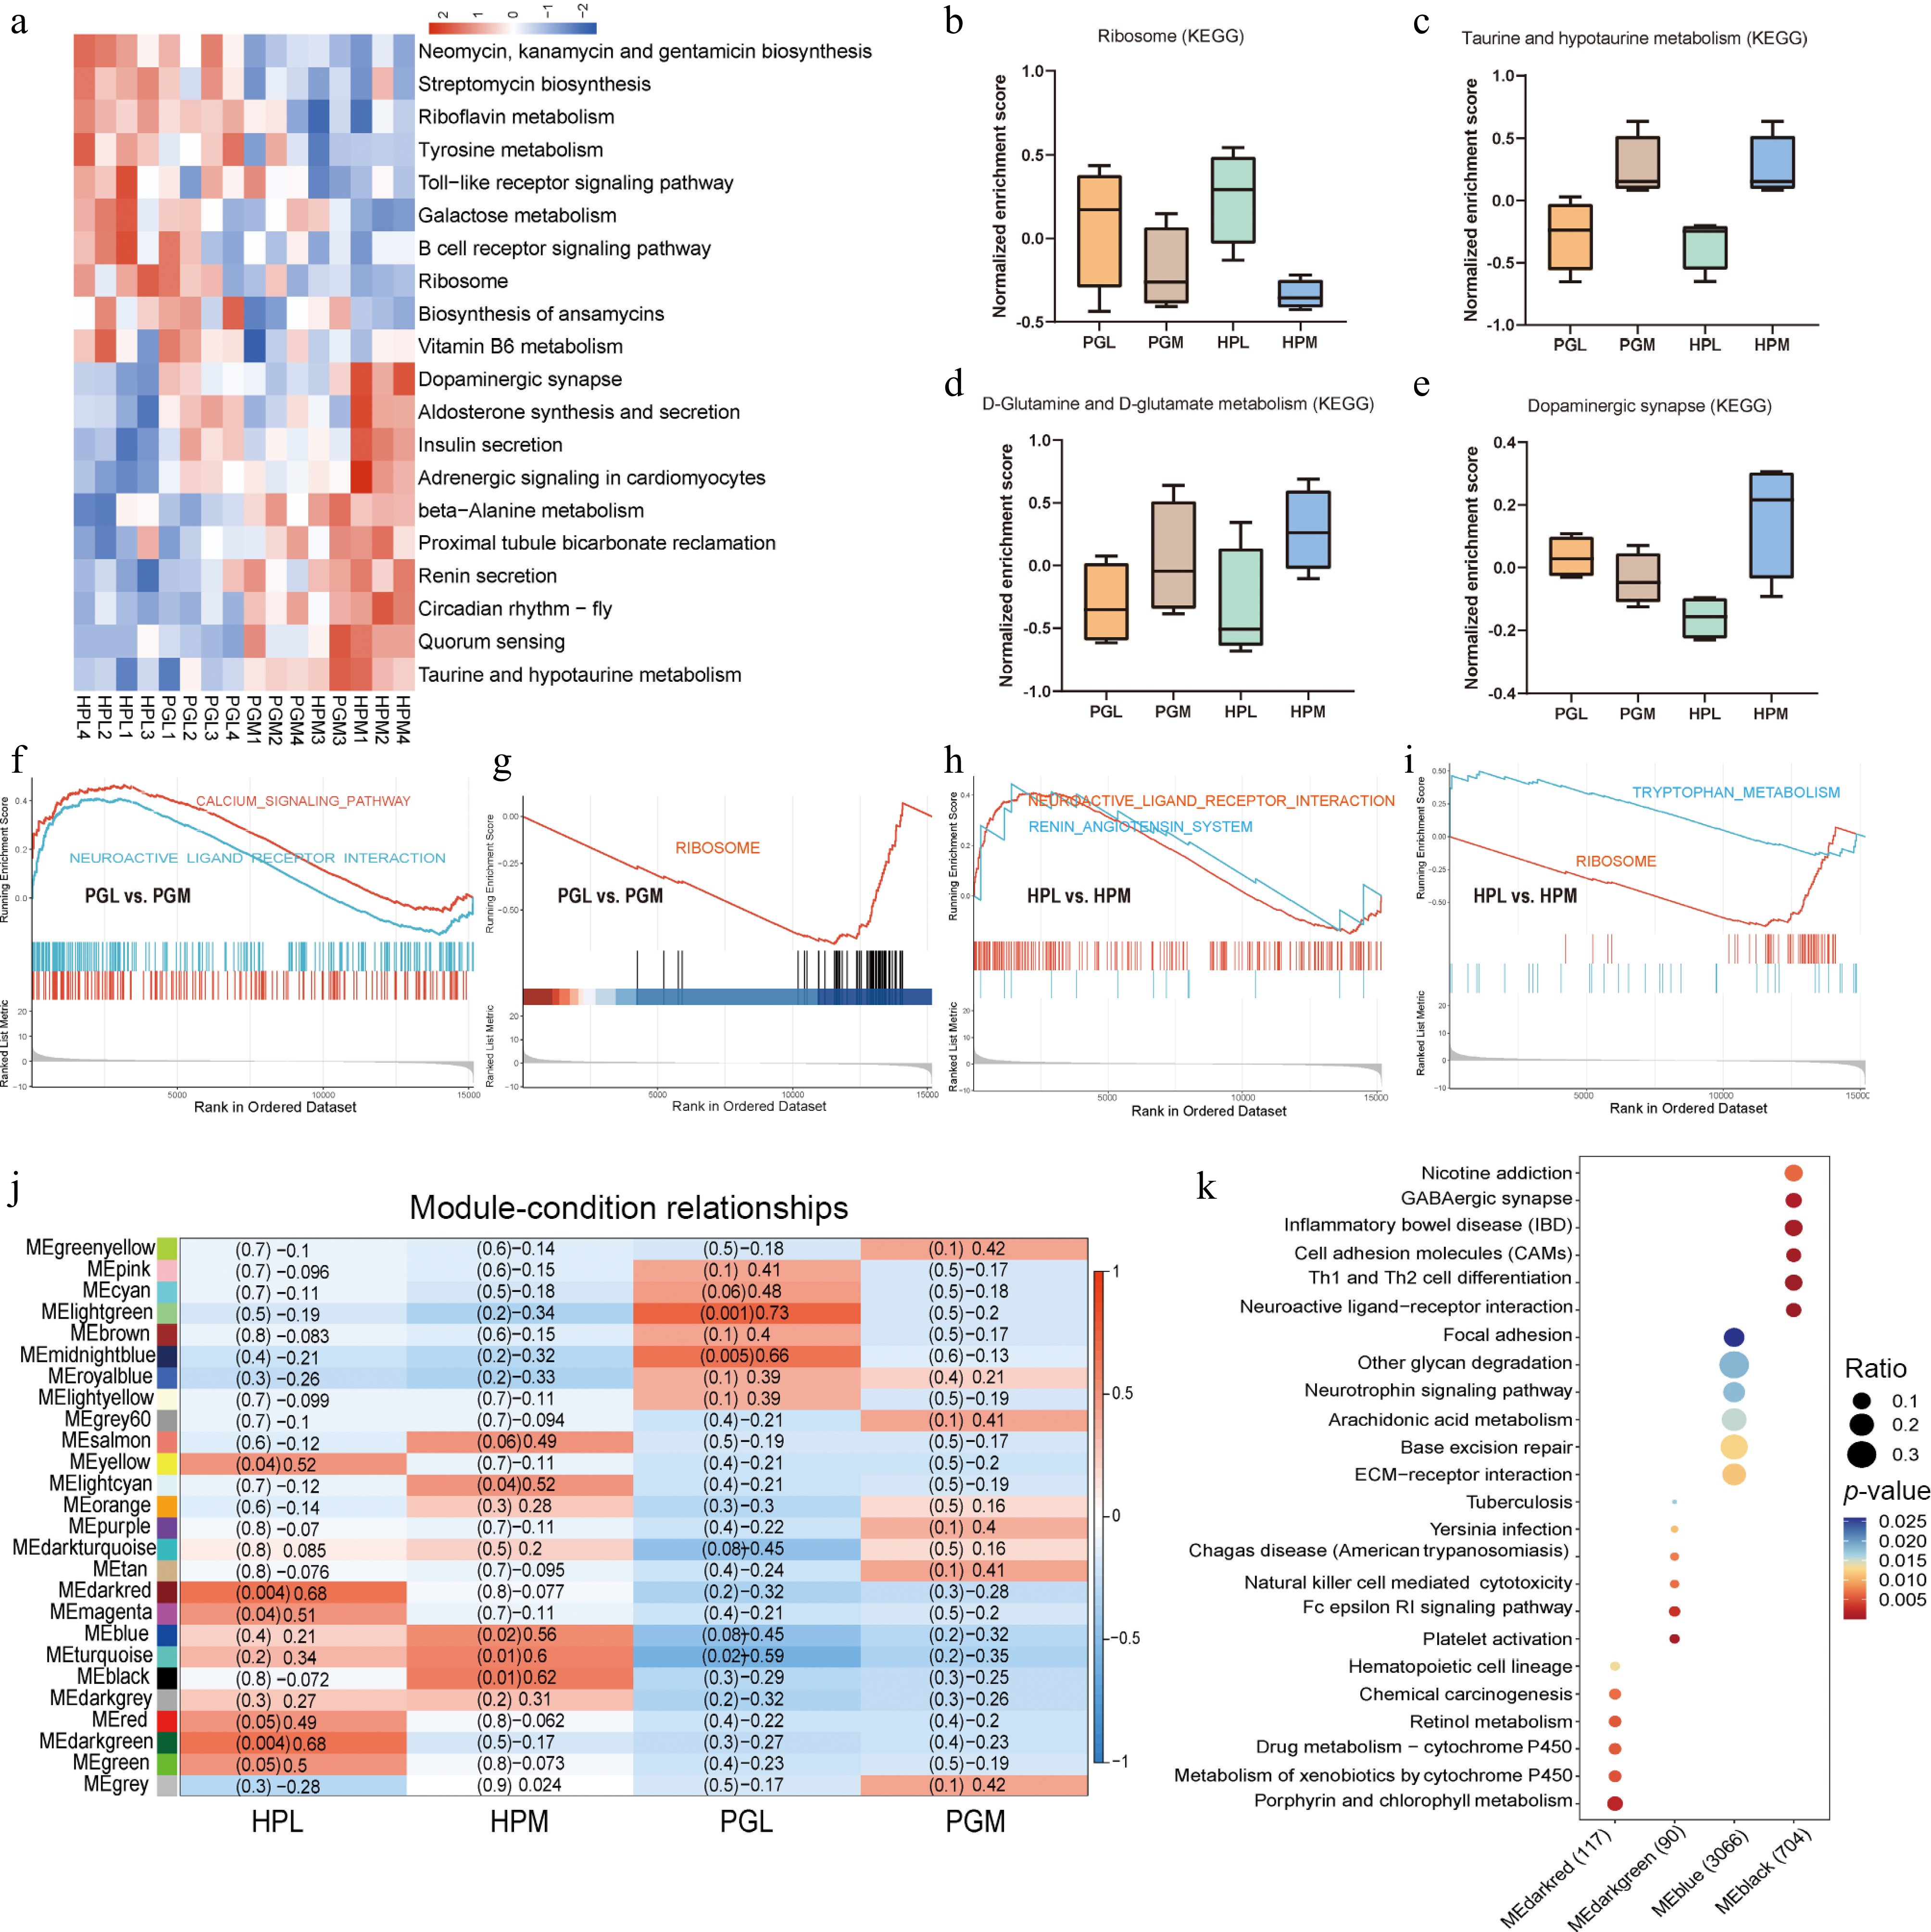
Figure 5.
Transcriptomic functional enrichment analysis. (a) The clustered heatmap represents the relationship between pathways of gene set variation analysis (GSVA) and aggressive behavior. (b)−(e) Box plots showing the GSVA normalized enrichment scores for 'Ribosome', 'Taurine and hypotaurine metabolism', 'D-glutamine and D-glutamate metabolism', and 'Dopaminergic synapse', respectively. (f)−(i) show the pathways in the gene set enrichment analysis (GSEA) related to aggressive behavior (PGL vs PGM, HPL vs HPM). (j) WGCNA analysis of genes in HP and PG of pigs with different aggressive behaviors. (k) KEGG enrichment pathway of MEdarkred (gene set: 117), MEdarkgreen (gene set: 90), MEblue (gene set: 3066), and MEblack (gene set, 704) modules.
The GSVA revealed that the ribosome pathways were particularly enriched in the least aggressive pigs (PGL and HPL), as depicted in Fig. 5b. In contrast, the taurine and hypotaurine metabolism, and D-glutamine and D-glutamate metabolism pathways were enriched in the most aggressive pigs (PGM and HPM), as shown in Fig. 5c and d. Notably, the Dopaminergic synapse pathway was specifically enriched in the HPM group (Fig. 5e), indicating a potential regulatory role of dopamine in modulating aggressive behavior. GSEA revealed that the calcium signaling pathway and renin-angiotensin system pathways were enriched in the PGM and HPM groups, respectively. Additionally, the neuroactive ligand system pathway was found to be enriched in both the PGM and HPM groups (Fig. 5f, g). Both PGL and HPL groups showed co-enrichment in the Ribosome pathway. Moreover, the HPL group exhibited specific enrichment in the tryptophan metabolism pathway (Fig. 5h, i). These findings suggest a complex interplay of various metabolic and signaling pathways that influence aggressive behavior in pigs.
To further elucidate the gene clusters associated with aggressive behavior in pigs, a WGCNA was conducted to create gene co-expression networks. This analysis grouped all genes into 26 distinct clusters, as illustrated in Fig. 5j. KEGG enrichment analysis was then applied to specific gene clusters. Analysis of 117 genes in the MEdarkred and 90 genes in the MEdarkgreen modules, which demonstrated a strong correlation with the HPL group, revealed associations with porphyrin and chlorophyll metabolism, Fc epsilon RI signaling pathway, and natural killer cell-mediated cytotoxicity, as shown in Fig. 6k. Further KEGG enrichment analysis focused on 3,066 genes in the MEblue module and 704 genes in the MEblack module, which exhibited a high correlation with the HPM group. These modules were found to be associated with pathways such as the neurotrophin signaling pathway, GABAergic synapse, and neuroactive ligand-receptor interaction.
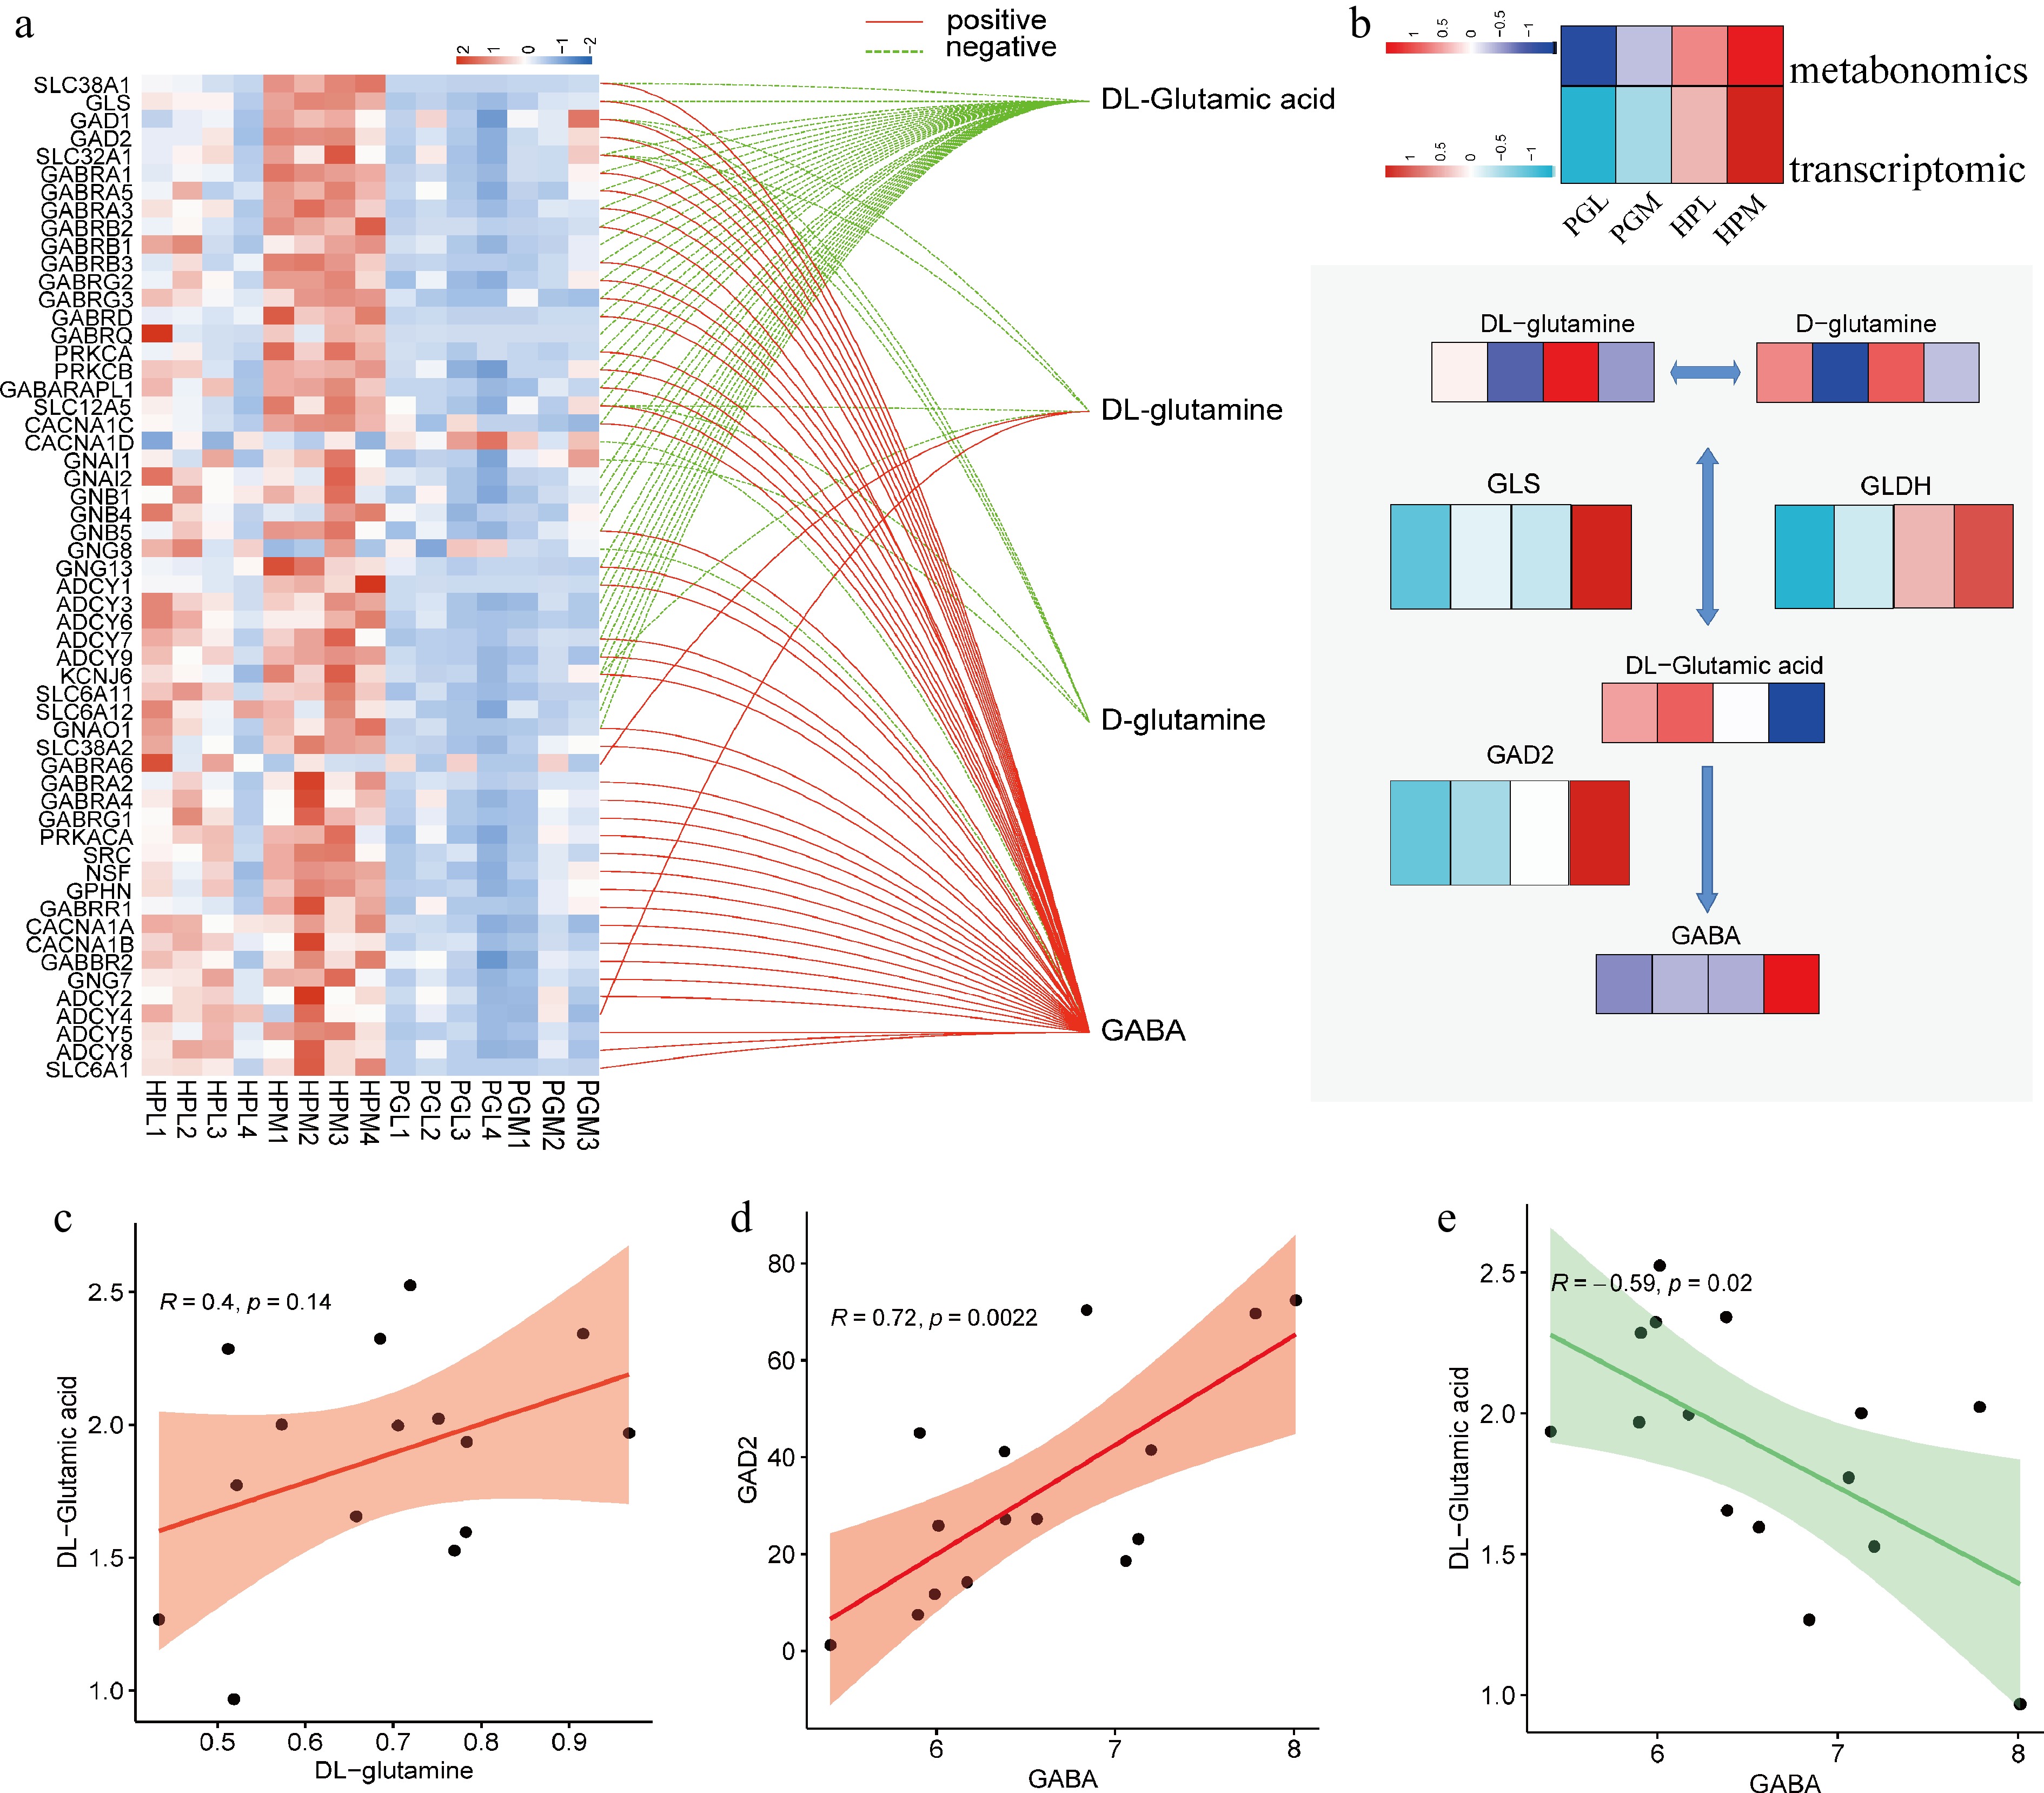
Figure 6.
Integrated analysis of metabolome and transcriptome. (a) Correlation analysis of GABA-related genes and GABA-related metabolites, with a threshold of the absolute value of the correlation coefficient > 0.5 (positive means r is greater than 0.5, and negative means r is less than −0.5) and p < 0.05. (b) Heatmap showing transcription and metabolism associated with GABA synthesis in PGL, PGM, HPL, and HPM groups. (c)−(e) Represent the relationships between DL-glutamine and DL-glutamic acid (R = 0.4, p = 0.14), GABA and GAD2 (R = 0.72, p = 0.0022), and GABA and DL-glutamic acid (R = 0.59, p = 0.02), respectively.
Integrative analysis revealed that DEMs and DEGs were significantly enriched in the GABAergic synapse pathway
-
The interplay between gene transcription and metabolite alterations is a key factor in understanding biological processes. In our study, we aimed to explore the relationship between the transcriptome and the metabolome in pigs displaying varying degrees of aggressive behavior. To achieve this, we conducted an integrated analysis, combining the results from the KEGG enrichment analysis of DEGs and DEMs. A significant finding from this integrated analysis is the consistent alteration observed in the 'GABAergic synapse' pathway (Entry: ssc04727) across both the transcriptomic and metabolomic data. This pathway's involvement was further emphasized by the identification of four metabolites and 86 genes associated with the 'GABAergic synapse' in our study, as detailed in Supplementary Table S9. This result highlights the importance of the GABAergic synapse pathway in the context of aggressive behavior in pigs and underscores the potential for cross-disciplinary insights when integrating transcriptomic and metabolomic data.
In our study, we conducted a correlation analysis between four metabolites and 86 genes associated with the 'GABAergic synapse' pathway. This analysis revealed that 56 genes exhibited a significant association (|r| > 0.5, p < 0.05) with the expression of the four metabolites, as shown in Fig. 6a. Specifically, two metabolites demonstrated a positive correlation with the expression of 45 genes, while four metabolites showed a negative correlation with the expression of 38 genes. A network map detailing the associations of these gene metabolites, particularly those involved in GABA synthesis, was constructed (Fig. 6b). Among these findings, a trend towards statistically significant differences was noted in the concentration of DL-glutamine and DL-glutamic acid (r = 0.4, p = 0.14), as depicted in Fig. 6c. These two compounds are interconvertible through the action of enzymes GLS and GLDH[39,40]. DL-glutamic acid, which comprises equal amounts of D-glutamic acid and L-glutamic acid, is catalyzed by the enzyme GAD2 to produce GABA from L-glutamic acid[41]. Notably, GAD2 was highly expressed in the HPM group, correlating with the higher GABA content observed in this group (Fig. 6d). Conversely, a notable negative correlation trend was found between DL-glutamic acid and GABA (Fig. 6e). To validate the transcriptomic data obtained, a qPCR analysis of six DEGs in the HPL vs HPM was performed. The results of the qPCR analysis were in line with the findings of the transcriptomic data, providing further validation for the study's findings (Supplementary Fig. S2).
Co-expression network for GABA-related genes, transcription factors, and metabolites
-
The results from our study indicate significant differences in GABA-related genes and metabolites among pigs exhibiting varying levels of aggressive behavior. To gain further insights into the regulatory mechanisms of GABA synthesis, we focused on identifying potential transcription factors that might bind to GABA-related genes. Our predictive analysis identified nine genes (GABRG2, GNAI2, ADCY6, ADCY3, PRKCB, ADCY2, GNG8, ADCY5, and ADCY1) that are potentially capable of binding to a total of 67 transcription factors. This led to the identification of 273 regulatory pairs involving GABA-related genes, transcription factors, and metabolites, as shown in Fig. 7a.
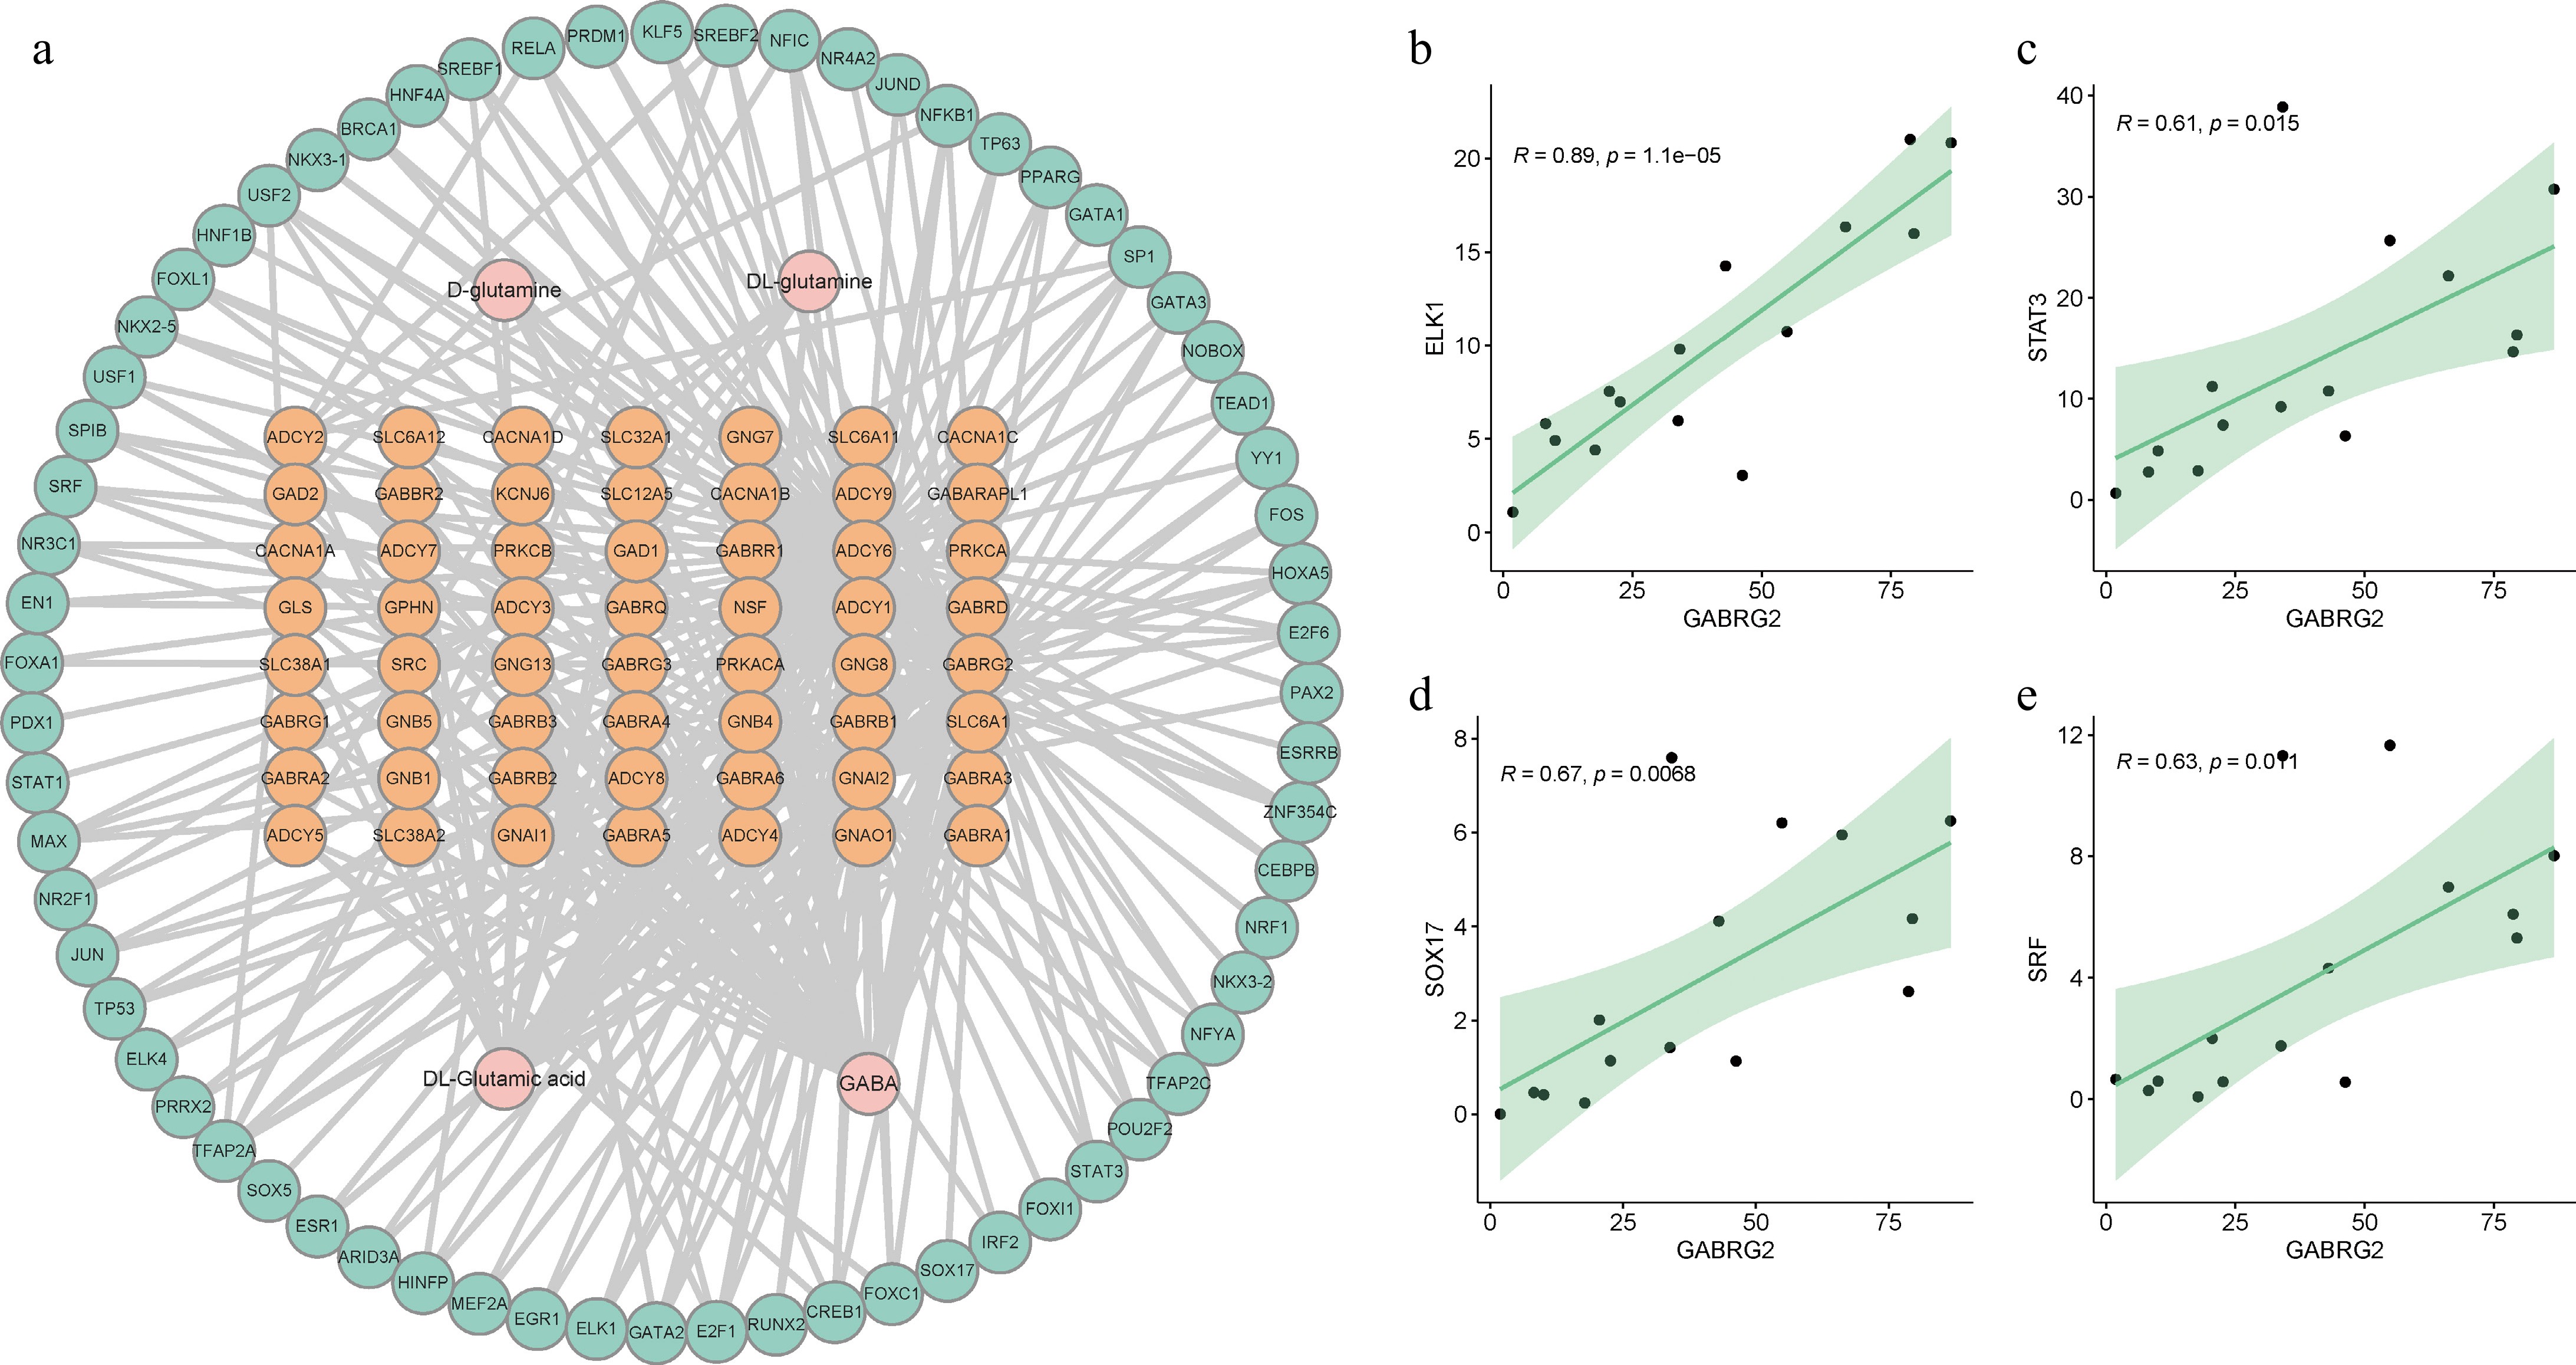
Figure 7.
Interaction network for GABA-related genes, transcription factors, and metabolites. (a) A comprehensive network of 273 regulatory pairs including interactions between GABA-related genes, transcription factors, and metabolites. (b)−(e) The correlation between the expression levels of specific transcription factors and the GABRG2 gene. Each panel shows the relative expression correlation for one of the transcription factors (ELK1, STAT3, SOX17, and SRF) with GABRG2, respectively.
Notably, the gene GABRG2 stood out for its significant number of binding transcription factors, totaling 49. Among these transcription factors, ELK1, STAT3, SOX17, and SRF were particularly prominent, displaying a positive correlation with the expression of GABRG2 (Fig. 7b−e). These findings suggest that these transcription factors might play a crucial role in modulating the expression of GABRG2. This could provide a deeper understanding of the molecular mechanisms underlying the regulation of GABA synthesis and its impact on aggressive behavior in pigs. The identification of these regulatory relationships opens new avenues for research into the genetic basis of aggression and its modulation through the GABAergic system.
-
In our study, we identified a total of 56 DEMs in the pituitary gland of pigs with different aggression levels (PGL vs PGM) and 67 DEMs in the hypothalamus (HPL vs HPM). These identified DEMs may hold significant regulatory potential in aggression modulation, which is a critical finding considering the broader implications of aggressive behavior. As social animals, pigs establish new social hierarchies through aggressive behavior after mixing. The hypothalamic-pituitary-adrenal (HPA) axis plays a critical role in this process. Studies show that the intensity of aggression correlates closely with changes in blood cortisol levels, and multiple SNPs in HPA axis-related genes are significantly associated with post-mixing aggression. Additionally, plasma cortisol and globulin levels change correspondingly with the restructuring of social hierarchy[42,43]. Driven by mixing stress, systemic metabolic disturbances rapidly occur. These are characterized by elevated plasma levels of free fatty acids, glucose, and lactate, with lactate and glucose concentrations showing significant correlations with aggression frequency[44]. From a practical perspective, aggression during pre-slaughter mixing negatively impacts pork quality, manifesting as increased skin lesions, abnormal meat color, and altered pH. Thus, effective interventions are essential. Nutritional modulation of metabolic status represents a viable approach. For example, tryptophan-supplemented diets sustainably reduce basal plasma cortisol and norepinephrine concentrations, offering long-term mitigation of mixing stress rather than merely transient effects[45,46]. At the neurotransmitter level, serotonin and dopamine are key regulators of aggressive behavior in pigs. In tail-biting scenarios, for instance, pigs exhibiting aggression show significantly increased dopamine and serotonin levels in specific brain regions, highlighting the synergistic role of the neuroendocrine system in modulating aggression[47].In contrast to pigs, where serotonin typically suppresses aggression,elevated serotoninlevels correlate with enhanced aggression in crustaceans and stalk-eyed flies (Teleopsis dalmanni)[48,49]. However, our study found no significant differences in hypothalamic and pituitary serotonin levels between pigs with contrasting aggression phenotypes. This discrepancy may result from the technical limitations of the LC-MS metabolomics approach used. While this method enables high-throughput detection of a lot of metabolites with precision, its sensitivity for detecting specific low expression levels like serotonin may be suboptimal. Additionally, the limited sample size likely reduced statistical power to detect metabolites with subtle expression differences. Future studies should employ targeted methods (e.g., ELISA) for serotonin validation and increase sample sizes to improve reliability. The role of metabolites in disease diagnosis and prognosis has gained prominence with the advancements in high-throughput metabolomics. However, one significant challenge in this field is the inadequacy of current metabolite reference databases. A substantial number of detected metabolites remain unannotated, hindering functional studies and posing risks of misinterpretation of results. This highlights the urgent need for the development of universally applicable methods and more comprehensive databases in metabolomics research, which would greatly enhance our understanding and management of conditions like aggressive behavior in both humans and animals.
Metabolism plays a crucial role in reflecting both physiological and pathological states, making metabolites valuable as biomarkers for various diseases. These biomarkers offer a more objective and quantifiable means of disease diagnosis and management compared to traditional methods[50]. A typical example is α-Synuclein in Parkinson's disease. This soluble protein is involved in synaptic plasticity. In patients, impaired α-Synuclein function within dopaminergic neurons may elevate cytoplasmic dopamine levels and cause severe oxidative stress. This cascade ultimately results in the loss of dopaminergic cell function and the onset of the disease[51]. As one of the most common mental disorders, depression currently lacks precise causes or diagnostic methods. The notably elevated C-reactive protein (CRP) levels in patients provide strong support for the inflammatory hypothesis of depression. Although CRP alone cannot serve as an independent diagnostic marker, continued research into its role may offer key insights into the disorder's origins[52]. In the realm of neurodegenerative disorders, diagnosing Alzheimer's disease presents significant challenges. The introduction of biomarkers like P-tau181 has substantially improved the accuracy of Alzheimer's diagnoses[53]. These examples underscore the importance of metabolites and other biomarkers in disease diagnosis and management.
By integrating multiple approaches, we identified candidate metabolites associated with aggressive behavior. Among the metabolites related to the HPL group, Carnosol has been highlighted in previous studies for its beneficial effects. It has been shown Carnosol can reduce cognitive deficits in neurodegenerative models by altering protein homeostasis[54,55]. Carnosol also possesses neuroprotective properties through its anti-oxidative stress effect[56,57]. In contrast, the metabolite Corticosterone, associated with the HPM group, is well-known for its role in the modulation of aggressive behavior. Elevated levels of corticosterone have been observed in individuals exhibiting higher levels of aggression[58]. Despite these insights, the exact molecular mechanisms by which corticosterone influences aggressive behavior remain to be fully elucidated. This finding presents an intriguing observation. While porcine adrenal glands demonstrate the capacity to synthesize and secrete corticosterone, its circulating concentration remains approximately 20% of cortisol levels[59]. Notably, cortisol, a glucocorticoid strongly implicated in the modulation of aggressive behaviors in swine, was conspicuously absent from metabolites identified through our untargeted metabolomic profiling[60,61]. This detection gap is likely attributable to the current limitations in cortisol annotation within our metabolite reference database. Progressing of metabolomic research from approximately 100 to over 800 distinct compounds, driven by advancements in analytical technologies and expanded annotation databases[62−64]. Although our study successfully characterized 1,234 metabolic features through metabolomics analysis, a subset of metabolites remain unannotated within existing frameworks. To address this methodological constraint, subsequent investigations will incorporate targeted metabolomic approaches for precise quantification of specific metabolite classes.
The HPA axis is a key neurobiological pathway involved in the regulation of aggressive behavior. In our study, we identified differential expression of 1,204 genes in the HPL vs HPM comparison and 643 genes in the PGL vs PGM comparison. Notably, these DEGs were predominantly associated with synapse-related functions and amino acid metabolism. Synaptic interactions are critical in neuronal communication and the exchange of information[65]. Experimental findings have illustrated the significance of synaptic function in aggressive behavior. For instance, optogenetic inhibition of synapses in the posterior ventral region of the medial amygdala (MeApv) was found to reduce the initiation of aggressive behavior, and adjustments in synaptic stimulation frequency in this region influenced the duration of such behavior[66]. Furthermore, the experimental induction of synapses in the amygdala hippocampal region (AHiPM) and ventral medial hypothalamus (VMHvl) neurons heightened aggressive behavior in mice[67]. The pituitary gland, functioning as the central organ of the HPA axis, plays a critical role in ensuring robust signal transduction. In pigs with higher aggression, the pituitary gland exhibits upregulation of CYP51A1, a gene associated with cholesterol synthesis. As a precursor for cortisol and aldosterone, the upregulation of cholesterol potentially contributes to adrenal hyperactivity and elevated hormone production in highly aggressive individuals[68]. Concurrently, STARD4, a gene essential for cholesterol transport, demonstrates significantly higher expression in the pituitaries of high-aggression pigs compared to low-aggression counterparts[69]. These observations indicate that CYP51A1 and STARD4 may act as key pituitary-derived regulators of adrenal hormone release and aggression divergence in pigs. These studies underscore a potential link between changes in synaptic structure or function and aggressive behavior. However, it's crucial to note that these insights are primarily based on optogenetic manipulations. Direct evidence confirming the regulatory role of synapse-related genes in aggressive behavior is still lacking. More research is needed to establish a concrete understanding of how synaptic alterations contribute to aggression, which could have important implications for understanding and managing aggressive behaviors across different species, including humans.
In our study, the integration of metabolomic and transcriptomic data revealed a significant role of the 'GABAergic synapse' pathways in modulating aggressive behavior in pigs. GABA, an inhibitory neurotransmitter predominantly found in the central nervous system (CNS), is essential in modulating neuronal activity. It primarily works by reducing neuronal activity and inducing sedative effects, thus playing a vital role in maintaining neural balance. The effects of GABA are not limited to the CNS; its consumption in humans has been associated with reduced stress and a sense of relaxation[70]. This highlights the potential therapeutic applications of GABA in managing stress and anxiety-related conditions. In the context of animal behavior, particularly in pigs, adding an appropriate amount of GABA to piglet diets has proven effective in reducing fighting behavior. This dietary intervention also positively impacts feed intake and daily weight gain, demonstrating the broader benefits of GABA in animal husbandry. Furthermore, studies in mice have shown that elevated GABA synthesis following exercise correlates with decreased anxiety levels. Conversely, decreased GABA signaling, particularly in the anterior cingulate cortex, has been strongly linked to increased anxiety and aggressive behavior in certain strains of mice, like BALB/cByJ[71,72]. These findings collectively underscore the importance of GABA and its related pathways in regulating behavior across different species.
The functional role of GABA in aggressive behavior beyond its well-known inhibitory effects. Aggressive behavior, which is closely linked to motivation and reward systems, involves various brain regions, including the lateral habenula (LHb). The LHb is a crucial node in the brain's reward pathway and has a significant impact on aggression. Notably, the activation of GABAergic neurons within the LHb, often triggered by appetitive hormones, has been shown to increase aggressive behavior in mice. This suggests a complex and nuanced role for GABA in modulating aggression. The varying effects of GABA observed across different studies may be attributed to its dual role under different stress conditions. Under chronic stress, GABA tends to exert sedative effects, while during acute stress, its endogenous synthesis is heightened, facilitating rapid adaptive responses. This duality is evident in changes in GABA concentration in the amygdala during acute and chronic stress conditions. Acute stress typically leads to an upregulation of glutamate decarboxylase (GAD) gene mRNA expression in the brain, a key enzyme in GABA synthesis. In contrast, chronic stress is associated with a downregulation of GAD gene mRNA expression[73,74]. The mixing of piglets in this study may represent an acute stress challenge. During the stress-triggering phase, rapid activation of hypothalamic CRH neurons likely initiates the HPA axis response, leading to elevated secretion of ACTH and adrenal hormones, which exacerbates aggressive behaviors[75]. By 48 h post-mixing, enhanced activity of GABAergic neurons and subsequent elevation in GABA levels may suppress hypothalamic CRH release to prevent excessive HPA axis activation. This regulatory mechanism potentially contributes to the reduction in aggressive behaviors as the mixing duration extends. To advance the understanding of GABA-mediated regulatory mechanisms, future studies will incorporate multiple temporal phases post-mixing to address the temporal delays in post-stress metabolic regulation and the coordination dynamics of multi-organ interactions within neuroendocrine circuits. These observations highlight the complexity of GABA's role in the brain, particularly in relation to stress and aggression. While GABA generally acts as an inhibitory neurotransmitter, its specific actions can vary significantly based on the physiological context, impacting behaviors like aggression. However, the precise molecular mechanisms through which GABA regulates aggressive behavior are still not fully understood, indicating a need for further research in this area. Unraveling these mechanisms could provide deeper insights into the neurobiology of aggression and potentially lead to more effective strategies for managing aggressive behaviors.
GABA is an essential neurotransmitter in the central nervous system, and its action at synapses is critical for modulating neuronal activity. GABA is released from presynaptic neurons and interacts with receptors on the postsynaptic membrane. These receptors are of two main types: ion channel receptors (GABA-A) and G protein-coupled receptors (GABA-B). The blocking of GABA-A receptors has been found to significantly affect BDNF levels and behavioral regulation in the prefrontal cortex[76]. This indicates the importance of GABA-A receptors in neural plasticity and behavior control. Mice exhibiting low aggressive behavior have shown increased expression of GABA receptors, along with depressive symptoms and social withdrawal. Notably, these symptoms improve rapidly with the activation of GABA receptors[77], suggesting a therapeutic potential of GABA receptor activators in mood and behavioral disorders. Furthermore, GABA also influences the release of dopamine in the substantia nigra through its receptors, suggesting a possible pathway through which GABA might modulate aggressive behavior[78]. This interaction between GABA and dopamine systems underscores the complexity of neurotransmitter interactions in regulating behavior. Interestingly, studies have also indicated that acupuncture treatment can significantly increase levels of neuropeptide Y (NPY), which in turn relieves chronic stress by attenuating HPA axis activity through GABA receptors. This finding points to the potential of alternative therapies in modulating neurochemical pathways for stress relief. In our present study, we developed a gene-transcription factor-metabolite interaction network associated with GABA metabolism. A key finding was the identification of the GABA-A receptor gene GABRG2, which has potential binding sites for 49 transcription factors. Transcription factors such as ELK1, STAT3, SOX17, and SRF may function as positive regulators of GABRG2 transcription, enhancing its expression in response to dynamic alterations in GABA metabolism. This insight opens avenues for future research to explore the roles of these transcription factors in more detail. However, it's crucial to conduct further refined experiments to verify the specific functions and regulatory mechanisms of these transcription factors in GABA metabolism and its related behavioral effects.
Aggressive behavior is a common trait among mammals, including humans, where it is often linked to psychiatric disorders and has substantial negative impacts on individuals and society. In the context of commercial pig farming, aggressive behavior among pigs notably affects productivity and economic outcomes, making its management a crucial aspect of the industry[79]. Despite its prevalence and significance, the precise regulatory mechanisms underlying aggressive behavior are not fully understood. This study sought to address this gap by investigating molecular mechanisms through the integration of transcriptomic and metabolomic data from the HP and PG of pigs exhibiting varying levels of aggression. The results of this combined analysis highlighted the significant role of genes and metabolites associated with the 'GABAergic synapse' pathway in the regulation of aggressive behavior. This finding is particularly relevant as it points to a specific biological pathway that can be targeted for further research and potentially for the development of interventions to manage aggression. Understanding the molecular basis of aggression in pigs not only has implications for animal welfare and productivity in agriculture but also offers insights that could be extrapolated to understanding aggression in other mammals, including humans.
-
In summary, we integrated transcriptomic and metabolomic data from the HP and PG of pigs, categorized based on their aggressive behavioral traits. This research stands out as the first to comprehensively map transcriptional profiles and metabolite changes in the PG and HP of pigs in relation to aggression and underscores the potential of the GABA metabolic pathway as a crucial target in regulating aggressive behavior. Integrated analysis revealed elevated expression of GABA metabolism-related genes in the hypothalami of pigs exhibiting higher aggressive behavior, which intriguingly paralleled heightened GABA expression levels in this brain region. Furthermore, GABA concentrations exhibited significant positive correlations with the expression of GAD2, the rate-limiting enzyme in GABA biosynthesis. Based on these transcriptomic data, we constructed a regulatory network encompassing GABA-associated genes, transcriptional regulators, and metabolic intermediates. Key transcriptional regulators, including ELK1, STAT3, SOX17, and SRF, were identified as potential modulators of GABAergic metabolism and behavioral aggression. These findings contribute to the broader understanding of the neurological and genetic underpinnings of aggressive behavior in mammals, including humans.
This work was supported by the National Natural Science Foundation of China (Grant No. 32172786), the Independent Innovation Funds for Agricultural Science and Technology in Jiangsu Province [CX(24)1014], and the 'JBGS' Project of Breeding Industry Revitalization in Jiangsu Province (JBGS[2021]101).
-
All procedures were reviewed and preapproved by the Nanjing Agricultural University Institutional Animal Care and Use Committee (NJAULLSC2021030, approval date: 2021-3-2). The research followed the 'Replacement, Reduction, and Refinement' principles to minimize harm to animals. This article provides details on the housing conditions, care, and pain management for the animals, ensuring that the impact on the animals is minimized during the experiment.
-
The authors confirm contribution to the paper as follows: study conception and design: Zhou B, Zhang C; data collection: Zhang C, Liu M, Xu Q, Yang H, Chao X, Chen J, Liu S; analysis and interpretation of results: Zhang C, Ding Y, Bi H, Wang Z, Muhammad A, Muhammad M; writing—original draft: Zhang C; writing—review and editing: Zhou B, Allan PS. All authors reviewed the results and approved the final version of the manuscript.
-
The data that support the study findings are available from the authors upon reasonable request.
-
The authors declare that they have no conflict of interest.
- Supplementary Table S1 Detailed information of the pigs used for transcriptomic and metabolomic experiments in this study.
- Supplementary Table S2 The primers used for qPCR in this study.
- Supplementary Table S3 Overview of all metabolites detected in this study.
- Supplementary Table S4 Overview of DEMs detected in this study.
- Supplementary Table S5 Metabolites in the MEblue module and expression levels in the hypothalamus.
- Supplementary Table S6 Overview of DEGs detected in PG and HP.
- Supplementary Table S7 KEGG pathways in C1 and C3.
- Supplementary Table S8 GSVA enrichment scores for each KEGG pathway in PG and HP.
- Supplementary Table S9 GABA-related genes (FPKM) were detected in this study.
- Supplementary Fig. S1 KEGG enrichment analysis of DEGs. (a) and (b) are KEGG enrichment analyses of DEGs in PG (PGL vs. PGM) and HP (HPL vs. HPM), respectively.
- Supplementary Fig. S2 qPCR validation of the GABA-related genes. These findings support the reproducibility and reliability of the transcriptome data.
- Copyright: © 2025 by the author(s). Published by Maximum Academic Press on behalf of Nanjing Agricultural University. This article is an open access article distributed under Creative Commons Attribution License (CC BY 4.0), visit https://creativecommons.org/licenses/by/4.0/.
-
About this article
Cite this article
Zhang C, Liu M, Xu Q, Yang H, Chao X, et al. 2025. Unraveling the molecular basis of aggression in pigs through integrated transcriptomic and metabolomic analyses. Animal Advances 2: e017 doi: 10.48130/animadv-0025-0015 

Unraveling the molecular basis of aggression in pigs through integrated transcriptomic and metabolomic analyses
- Received: 25 December 2024
- Revised: 31 March 2025
- Accepted: 07 April 2025
- Published online: 25 June 2025
Abstract: In commercial pig production, weaned piglets exhibit more aggressive behavior after mixing, which adversely affects animal welfare and pig performance. This study integrated metabolomics and transcriptomics to assess the characterization of the hypothalamus and pituitary gland in pigs with differing aggression levels. We identified metabolite markers, including Fa 18:2+2o, Flonicamid, Ionomycin, Pyridine, Diacetyl, and γ-aminobutyric acid (GABA), associated with the most aggressive behavior in pigs. Transcriptomic analysis revealed 1,204 and 643 differentially expressed genes (DEGs) in the hypothalamus and pituitary gland, respectively. Pathway analysis linked the DEMs and DEGs to the 'GABAergic synapse', suggesting its involvement in aggression. We constructed a regulatory network from the sequencing data, incorporating GABA-related genes, transcription factors, and metabolites. Key transcription factors, including ELK1, STAT3, SOX17, and SRF, may regulate GABA metabolism and influence aggressive behavior. Our findings highlight GABA metabolism's role in aggression regulation and offer insights into its neurobiological underpinnings and molecular mechanisms.
-
Key words:
- Aggressive behavior /
- HPA axis /
- GABA /
- Metabolome /
- Transcriptome