


-
In recent years, cement, as the most extensively utilized construction material globally, has contributed to a variety of environmental problems—such as global warming, air pollution, and sea level rise—due to its high CO2 emissions, thereby posing a serious threat to human survival and development[1]. Despite the decline in total cement output driven by macroeconomic factors, technological advancements, and market changes, the pressure to reduce carbon emissions remains severe[2,3]. Consequently, a range of technologies have been explored to effectively mitigate CO2 emissions, including carbon sequestration and cleaner fuel use[4,5]. For instance, Wang et al. highlighted that the utilization of compressed natural gas reduces energy consumption, CO2 emissions, and air pollutants compared to conventional fuels[6]. Afari et al. discovered that a moderate addition of ethanolamine (MEA) to methyl diethanolamine (MDEA) solution significantly increases the rate of CO2 absorption[7]. Although numerous techniques demonstrate promising CO2 capture capabilities, their large-scale application in the cement industry remains constrained by high costs and limited efficiency. In response, carbon capture and storage (CCS) has gained increasing attention for its low cost, high efficiency, ability to limit the production of harmful by-products, and wide range of applications. Among the various CCS materials, biochar is considered a promising material for its high specific surface area (SSA), chemical stability, porous character, and reduced land demand for waste disposal[2,8].
Biochar is produced by pyrolyzing biomass into sustainable porous sequestered carbon materials under anaerobic conditions. Previous studies indicated that biochar's CO2 uptake was mainly influenced by its microporous structure (van der Waals force-induced physical adsorption), and alkalinity (Lewis acid-base reaction-induced chemical adsorption)[9]. Thus, the adsorption performance of biochar mainly depends on its physicochemical properties, which are mainly influenced by the types of feedstock and pyrolysis conditions (e.g., temperature and pressure)[10]. Among them, pyrolysis temperature is considered to be a key factor in controlling the adsorption capacity of biochar at atmospheric pressure. For example, Li et al. pointed out that at pyrolysis temperatures of 600−800 °C, biochar produced from rice husks exhibited the highest CO2 uptake at 700 °C[11]. Lahijani et al. discovered that pyrolysis-induced structural changes in biochar enhanced its adsorption capacity with increasing pyrolysis temperature[12]. Xu et al. pointed out that slow pyrolysis under high-temperature conditions favors the generation of a large SSA and well-developed pore structure of biochar, resulting in enhanced adsorption properties[3]. However, the uptake of the original biochar remains insufficient to meet the demand posed by anthropogenic CO2 emissions. Therefore, numerous studies have been conducted to modify biochar via various modification approaches (e.g., physical, chemical, and biological) to improve its CO2 uptake capacity. For instance, Ghanbari et al. highlighted that MgO impregnation enhances biochar's crystalline structure and improves the diffusion flux through the large pores, thus increasing its CO2 adsorption capacity[13]. Zhu et al. reported that acid-modified biochar effectively removed a large number of soluble components, including metal salts and carbonates[14]. In contrast, alkali modification increases SSA and optimizes the pore architecture of biochar, thereby enhancing its CO2 adsorption capacity[15].
With the advancement of biochar modification, the application of biochar with excellent physicochemical properties in the cement industry has attracted increasing attention[8,16]. For example, Zeidabadi et al. highlighted that adding a 1% dose of biochar to concrete can absorb 20% of the cement industry's total CO2 emissions annually[17]. Wang et al. discovered that adding a 4% dose of biochar to concrete can sequester 0.124 kg of CO2[2]. Gupta et al. pointed out that the incorporation of biochar with adsorbed CO2 into cement composites reduces overall carbon emissions[18]. These results show that biochar is a promising material for CO2 sequestration in the cement industry. Moreover, the incorporation of biochar not only enhances the carbon sequestration capacity but also improves the mechanical properties of cement composites. For instance, Javed et al. indicated that the incorporation of biochar into concrete resulted in a denser internal structure and higher compressive strength[19]. Choi et al. highlighted that replacing mortar with biochar produced from hardwoods at a 5% mixing ratio enhanced compressive strength by 10%. However, higher biochar substitution ratios (e.g., 10%, 15%, 20%) resulted in lower compressive strength[20]. With further research, scholars have investigated the impact of structural heterogeneity of biochar on the properties of cement composites. Specifically, during the biochar decomposition, soluble minerals dissolve, and surface particles gradually dissociate from the original biochar. As a result, decomposed biochar can be specifically classified as sedimented particles (SP), suspended coarse particles (CP), and soluble fractions along with ultrafine particles (SCUP)[21–25]. Compared with CP and SCUP, SP exhibits the most significant enhancement in the compressive strength of cement composites[26]. As the main component of biochar's heterogeneous structure, the SP possesses a superior SSA and pore structure, which results in enhanced CO2 adsorption capacity compared to the other components. These results provide new insights for enhancing the CO2 adsorption capacity of biochar by leveraging its heterogeneous structural features.
Despite the increasing attention on biochar cement composites, several challenges remain unresolved. Currently, most studies have studied the CO2 adsorption effect of biochar as a whole component, while the CO2 adsorption capacity of the heterogeneous structure of biochar remains underexplored. In addition, the use of CO2-adsorbed SP in cement composites has not been investigated by experimental techniques. Therefore, the main objectives of this work are to: (i) Explore the impact of alkali modification on different components of biochar; (ii) Investigate the influence of different components of biochar on CO2 adsorption performance; (iii) Analyze the effect of biochar on the properties of cement composites under various conditions, including different adsorption volumes of CO2, pyrolysis temperatures, and addition ratios.
-
The biochar (Shengxiang Activated Carbon Department, Gongyi City, China) used in this work was derived from corn stover and pyrolyzed at 300, 500, and 700 °C. The chemical components of biochar are listed in Table 1. For convenience, biochar samples are denoted as BC300, BC500, and BC700 according to their pyrolysis temperature. P.O. 42.5 ordinary Portland cement (OPC; Rongcai New Building Materials Co., Ltd., Anhui, China), and the composition and particle sizes of the substances detected are shown in Table 2 and Fig. 1, respectively. The results indicate that the median particle sizes of BC300, BC500, and BC700 are 10.9, 9.02, and 9 μm, respectively, which are smaller than the 15.14 μm size of OPC particles. Deionized water, produced by the Laboratory Ultrapure Water Distribution System (Lingde Instrument Co., Ltd., Shanghai, China), was used in this work. The chemical reagent sodium hydroxide (McLean Biochemicals Co., Ltd., Shanghai, China) was used in this work.
Table 1. Elemental distribution in biochar (wt.%)
Sample C (%) O (%) Si (%) Cl (%) K (%) Else (%) BC300 35.70 25.14 13.19 1.26 5.73 18.98 SP300 38.50 19.39 11.67 − 1.67 28.77 BC500 40.63 33.35 17.71 0.94 3.55 3.82 SP500 44.59 20.06 18.19 − 4.13 13.03 BC700 43.05 6.58 21.17 0.87 8.83 19.50 SP700 45.58 19.10 21.88 − 2.78 10.66 Table 2. Chemical composition of OPC (wt.%)
Sample CaO SiO2 Al2O3 CO2 SO3 Fe2O3 K2O Other Content 44.64 25.13 11.57 8.36 3.45 3.35 1.11 2.39 
Figure 1.
Particle size distribution of BC300, BC500, BC700, and OPC.
Experimental methods
Specimen preparation
-
In this study, precipitated particles were prepared by the physical decomposition method[27]. Specifically, biochar (3 g) was dispersed in 100 mL of ultrapure water, dispersed for 30 min with an SK7200HP ultrasonic instrument (Shanghai Kedao Instrument and Equipment Co., Ltd, Shanghai, China), and then precipitated for 72 h. The precipitate in the beaker was collected as precipitated particles. Among them, the whole step was repeated twice. For the convenience of differentiation, the precipitated particles collected at 300, 500, and 700 °C above were denoted as SP300, SP500, and SP700, respectively.
The alkali-modified biochar was produced by dispersing 1 g of biochar in 40 mL of 1 mol·L−1 NaOH for 30 min, then modified, filtered, and dried. These samples were labeled as MBC300, MBC500, MBC700, MSP300, MSP500, and MSP700. Then, the different components of alkali-modified biochar were exposed to a nitrogen-filled environment in a rotary furnace, heated to 120 °C, and maintained for 1 h. After the furnace had cooled to room temperature, CO2 was introduced for 2 h, after which the biochar was removed from the tube. These samples were denoted as CMBC300, CMBC500, CMBC700, CMSP300, CMSP500, and CMSP700. Among them, CMBC and CMSP represent CO2-saturated modified biochar and CO2-saturated modified SP, respectively. Previous studies have demonstrated that, as physical adsorption is the predominant mechanism of CO2 capture by biochar, its morphology, physical properties, and chemical composition remain essentially unchanged after biochar pores are saturated with CO2[17, 28,29]. This provides a useful reference for evaluating the effect of different alkali-modified biochar materials in cement composites.
The CO2 adsorption experiments were conducted according to the procedures of previous studies[28]. Specifically, about 20 mg of biochar was introduced into an alumina crucible on the TGA, heated to 120 °C under a nitrogen atmosphere, and held for 1 h to remove biochar impurities (e.g., moisture and residual gases). Notably, the nitrogen flow rate for the impurity removal step matched that of the CO2 flow rate for the adsorption step (50 mL·min−1). Subsequently, when the temperature decreased to 25 °C, high-purity CO2 was injected for mass measurement. The increase in sample mass represented the absorbed quantity of CO2 (the amount of N2 adsorbed on the sample is neglected). Blank tests were conducted under the same conditions. This baseline accounted for instrumentation and buoyancy effects to ensure correct mass change values[30].
This work explored the influence of biochar incorporated at levels of 1%, 2%, 3%, and 5% on the properties of cement composites. All samples were mixed with a water-to-cement ratio (w/c) of 0.4, and the experimental scheme is listed in Table 3 and Supplementary Table S1. The different materials were mixed homogeneously for 10 min in certain proportions and then moved to the cement mixer to experiment according to the automatic control program. Then, the mixture was poured into 4 cm × 4 cm × 4 cm molds, and maintained for 24 h before demolding. Finally, the samples were moved to standard conditions of (20 ± 1) °C and humidity above 90%, where they were maintained until the day of testing. Notably, three replicate samples were prepared for each test.
Table 3. Ratio of different biochar incorporated into cement composites
Samples OPC (g) Biochar (g) W/C Control (Ref) 400 0 0.4 A1, A2, A3 396 4 0.4 A1, A2, A3 392 8 0.4 A1, A2, A3 388 12 0.4 A1, A2, A3 380 20 0.4 A1, A2, and A3 are BC300-cement composites, BC500-cement composites, BC700-cement composites, respectively. Characterization methods
-
The samples were cured for 7 and 28 d before the compressive strength test was conducted in accordance with the Chinese standard GB/T17671-2021[31]. The compressive strength average was calculated from the values of three specimens per group, and the standard deviation was indicated by error bars. After the strength experiments, fragments from all samples were collected and placed in anhydrous ethanol to halt hydration, and were then stored in a dry condition until the corresponding experiments. The samples were characterized using the following instruments:
A laser particle size analyzer (Mastersizer 2000, GBR) was employed to measure the particle size distribution of materials by measuring the scattered light intensity at various angles. A Brunauer-Emmett-Teller (Nova 4200E, USA, BET) was used to determine the SSA and pore volume of biochar. The nitrogen adsorption method (77.35K) was applied, with calculations based on the BET and Barrett-Joyner-Halenda (BJH) models. An X-ray fluorescence spectrometer (XRF-1800, JPN, XRF) was used to examine the elemental distribution in biochar and cement particles. X-ray diffraction (PANalytical X-Pert PRO MPD, NL, XRD) was used to analyze the compositional and structural information about the material at the atomic or molecular level. The test conditions included CuKα radiation, with a constant X-ray tube current of 40 mA and a voltage of 40 kV. Meanwhile, the scanning range was from 5 to 70° (2θ), with an increment of 0.02° and a step duration of 20 s. Fourier Transform Infrared Spectroscopy (Nexus 670, USA, FTIR) was employed to measure the absorption and reflection spectra of biochar within the infrared spectral region from 4,000 to 400 cm−1, with a scan rate of 20 times per minute. Scanning Electron Microscope (Zeiss Sigma500 Field Emission, GER, SEM) was utilized to analyze the microscopic structure of different materials. Synchronous thermal analyzer (STA449F5, GER, TG) heated the sample from 20 to 800 °C at 10 °C·min−1 (in nitrogen, with a 30 mL·min−1 airflow), to analyze the thermal stability and phase changes of the sample. An eight-channel isothermal calorimeter (I-CAL Flex, USA) was used to measure the hydration heat of each mixture at 20 °C for 3 d, and all raw materials were stored at 20 °C for at least 24 h before testing.
Data analysis and quantification of relevant emissions
-
The pseudo-first-order (Pfo), pseudo-second-order (Pso), and Avrami models were utilized to describe the adsorption kinetic profile of CO2. Here are further explanations of these model equations[32]:
Pfo modeling:
$ {q_t} = {q_e}\left( {1 - {e^{ - {k_1}t}}} \right) $ (1) Pso modeling:
$ {q_t} = \dfrac{{t{k_2}q_e^2}}{{1 + {q_e}t{k_2}}} $ (2) Avrami modeling:
$ {q_t} = {q_e}\left[ {1 - {e^{ - {{\left( {{k_A}t} \right)}^n}}}} \right] $ (3) where, qt (mg·g−1) and qe (mg·g−1) represent the CO2 adsorption at time t (min) and equilibrium, respectively. Furthermore, k1 (l·min−1), k2 (g·[mg·min]−1), and kA (l·min−1) are adsorption rate constants.
The primary greenhouse gases (e.g., CO2 and CH4) were quantified in relation to biochar cement-related substances. The emissions in this study are quantified based on the mass of each component as listed in Table 3 (e.g., 4 g of biochar, 396 g of cement, and 160 g of water). Additionally, Supplementary Table S2 and S3 provides detailed quantification information.
-
Previous studies have shown that the micropores of biochar provide a large SSA to accommodate adsorbates, while the mesopores promote rapid mass transfer, resulting in fast adsorption equilibrium[3]. Specifically, pores less than 0.8 nm are beneficial for the CO2 uptake by biochar under atmospheric pressure. The BET results indicate that the SSA of alkali-modified biochar was reduced, and the microporous structure was improved, as listed in Table 4. This is attributed to the corrosive nature of alkali, which alters micropore volume and causes the collapse of mesopores and macropores, thereby affecting its SSA. This result provides a reference for understanding CO2 adsorption by biochar in the following section.
Table 4. The surface area, cumulative adsorption pore volume, and adsorption average pore size of the different biochars
Sample BET surface area
(m2·g−1)Adsorption average pore size (nm) Cumulative adsorption pore volume (cm3·g−1) BC300 9.804 7.158 0.019 SP300 18.528 6.425 0.022 BC500 36.913 5.974 0.024 SP500 54.658 6.362 0.040 BC700 140.013 4.676 0.044 SP700 150.064 4.487 0.047 MBC300 2.894 6.924 0.012 MSP300 17.194 4.688 0.017 MBC500 29.691 4.613 0.033 MSP500 36.060 4.683 0.026 MBC700 124.607 4.676 0.044 MSP700 134.141 4.057 0.034 In all samples, the alkali-modified biochar was primarily characterized by changes in peak intensities, while the functional group types do not change significantly (Fig. 2). It is observed that the vibrations of the non-conjugated C=O group (1,734 cm−1), phenol (1,448 cm−1), and aromatic hydrocarbons (1,190 cm−1) were diminished after alkali modification in biochar prepared at low pyrolysis temperatures[33]. This is mainly attributed to alkali modification, which removes soluble components from the biochar through a corresponding chemical reaction. For example, phenol produces highly soluble phenol salts in an alkaline environment, which are eventually removed. Therefore, the FTIR spectra of the modified biochar appeared smoother than those of the original biochar. Moreover, the stretching vibrational peak of hydroxyl groups (−OH) at 3,341 cm−1 and the vibrational peaks of ester bonds (C=C and C=O) at 1,568 cm−1 were enhanced due to the oxidative cleavage of unstable C−C bonds and the formation of C−O bonds[34]. It is noteworthy that the functional group types of biochar decrease with increasing pyrolysis temperature. Therefore, alkali modification does not affect high-temperature pyrolyzed biochar as significantly as it does low-temperature pyrolyzed biochar.
Figure 2.
Results of FTIR of (a) modified original biochar, and (b) modified SP.
As shown in Fig. 3, bulges were consistently observed between 2θ = 12 and 25° in all samples, primarily resulting from the presence of amorphous carbon in the biochar, indicating that alkali modification has eroded its surface. Furthermore, the diffraction peaks at 20.8, 26.6, and 36.5° correspond to SiO2, with the most prominent peak appearing at 2θ = 26.6°[35]. The results show that the SiO2 diffraction peaks of the original biochar became more pronounced after alkali modification. However, alkali modification had a lesser effect on the SiO2 peak of SP. This could be due to changes in the structure or composition of the SP obtained from the original biochar after physical separation in an ultrasonic machine, making it less susceptible to alkali modification. Moreover, the SiO2 diffraction peaks of the biochar became more pronounced with increasing pyrolysis temperature, which resulted from the fact that the temperature affects the morphology of SiO2, thereby influencing its volcanic ash effect in cement composites.
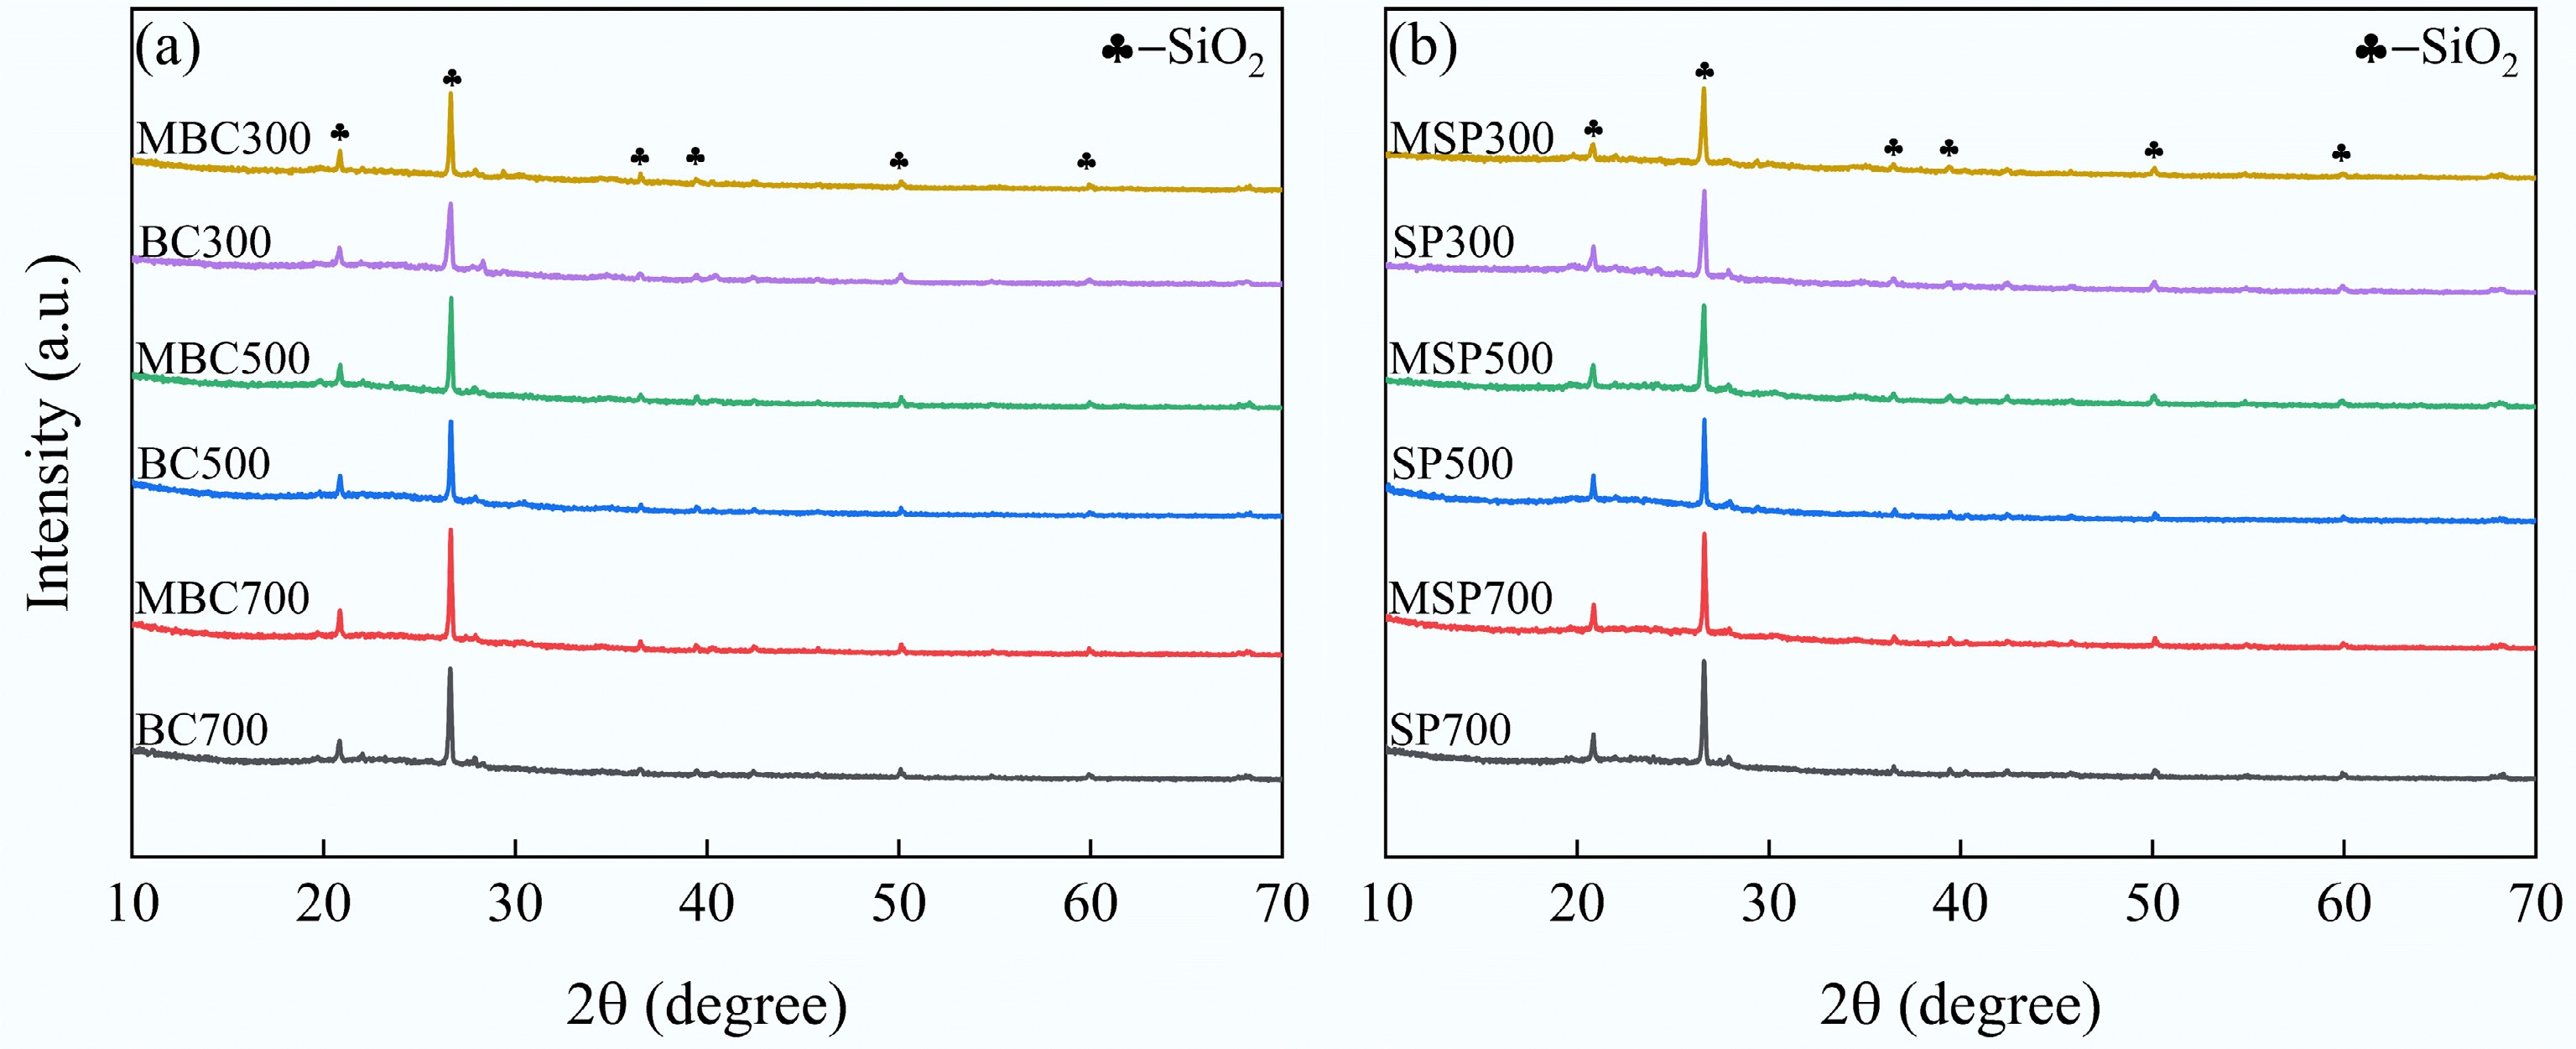
Figure 3.
Results of XRD of (a) modified original biochar, and (b) modified SP.
Figure 4 shows the Raman spectral results in the range of 1,000−2,000 cm−1 for different biochar. In all samples, two main bands were observed: the D band (1,340−1,350 cm−1), and the G band (1,580−1,600 cm−1). The D band corresponds to disordered structures resulting from defects in the aromatic ring system, such as layer misalignment, grain size, or edge state in the biochar. The G band represents the graphite strip and is caused by the breathing of aromatic rings[36]. It is reported that the degree of biochar graphitization is usually represented by the ratio of the D and G band peak intensities (ID/IG). As the ID/IG ratio decreases, the more ordered the carbon structure and the fewer defects in the biochar[37]. The results demonstrated a consistent upward trend in ID/IG with increasing biochar pyrolysis temperature, indicating an increase in defective aromatic ring structures. A slight increase in the ID/IG ratio was observed in SP relative to the original biochar, which may result from the disruption of the ordered carbon structure during ultrasonic separation. Furthermore, the ID/IG of the original biochar and SP at both 300 and 500 °C pyrolysis temperatures were smaller than those of their corresponding modified component. However, the opposite trend was observed for pyrolyzed biochar at 700 °C. This may be due to alkali modification disrupting the partially ordered carbon structure of the biochar pyrolyzed at 300 and 500 °C. However, the removal of impurities by alkali modification in biochar pyrolyzed at 700 °C may counteract this adverse effect.
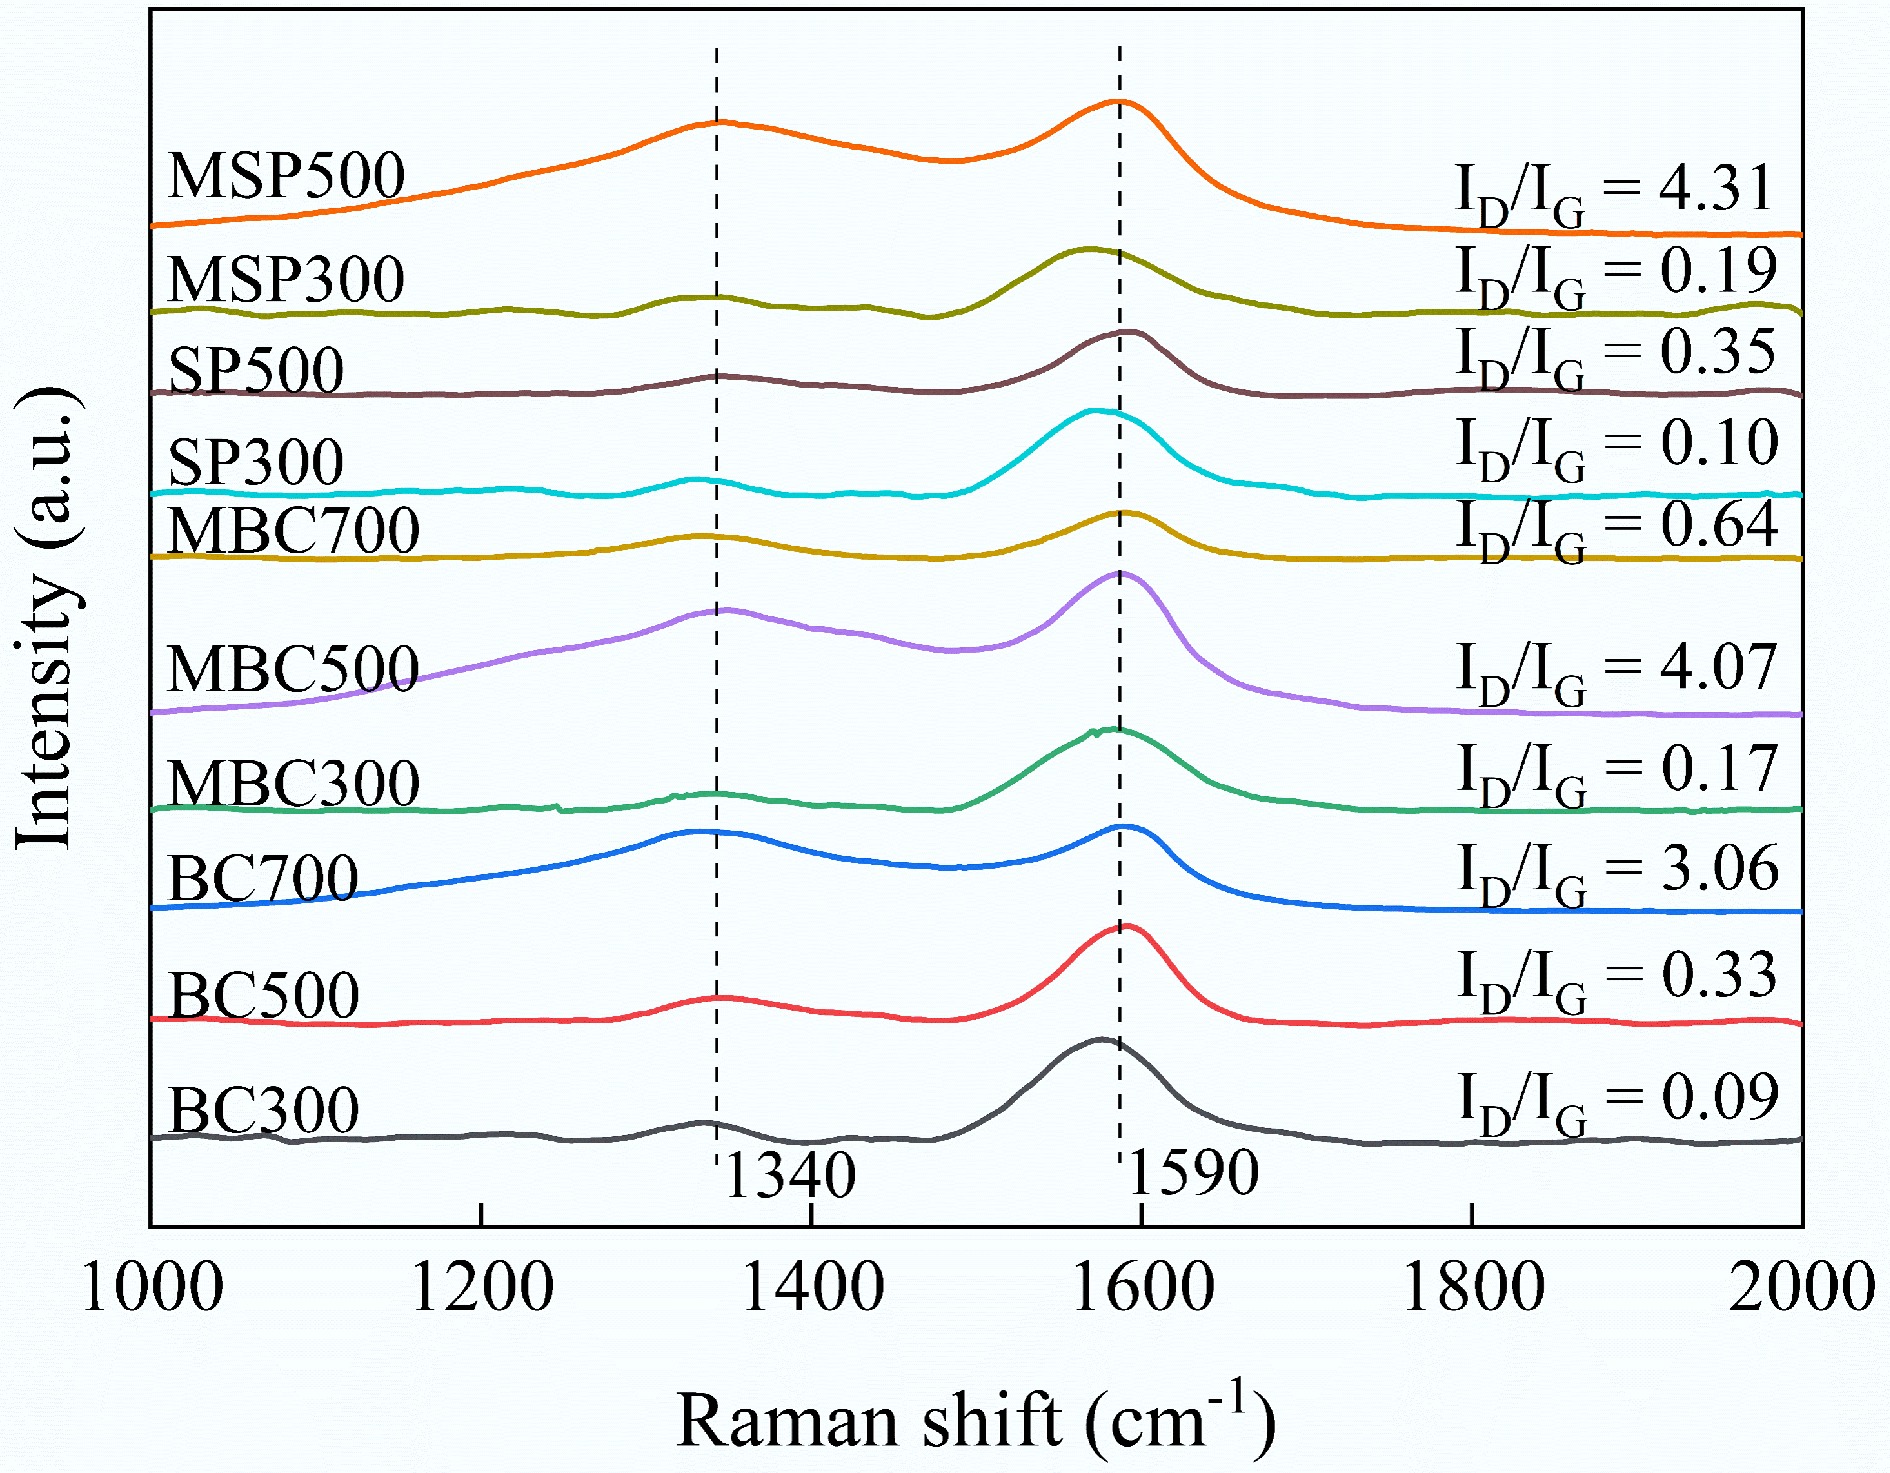
Figure 4.
Raman spectra characterization of different biochar samples.
Figure 5 shows the CO2 adsorption by biochar at room temperature. The results indicate that the CO2 uptake was higher by SP than by the original biochar. This could be due to the high ash content, which blocks the micropores in the original biochar and prevents surface alkaline active sites from effectively interacting with CO2 molecules[38]. Interestingly, the modified biochar and SP in this study showed better CO2 capture performance. This may be due to the enhancement of the microporous structure and pH of the biochar by alkali modification, which is consistent with the BET results. However, among all the modified biochar samples, MBC500 exhibited the highest CO2 adsorption capacity. Combined with the Raman spectroscopy results this indicates that the microporous structure and alkalinity of the biochar are not all determinants of CO2 adsorption, and that ID/IG is also one of the CO2 adsorption factors.
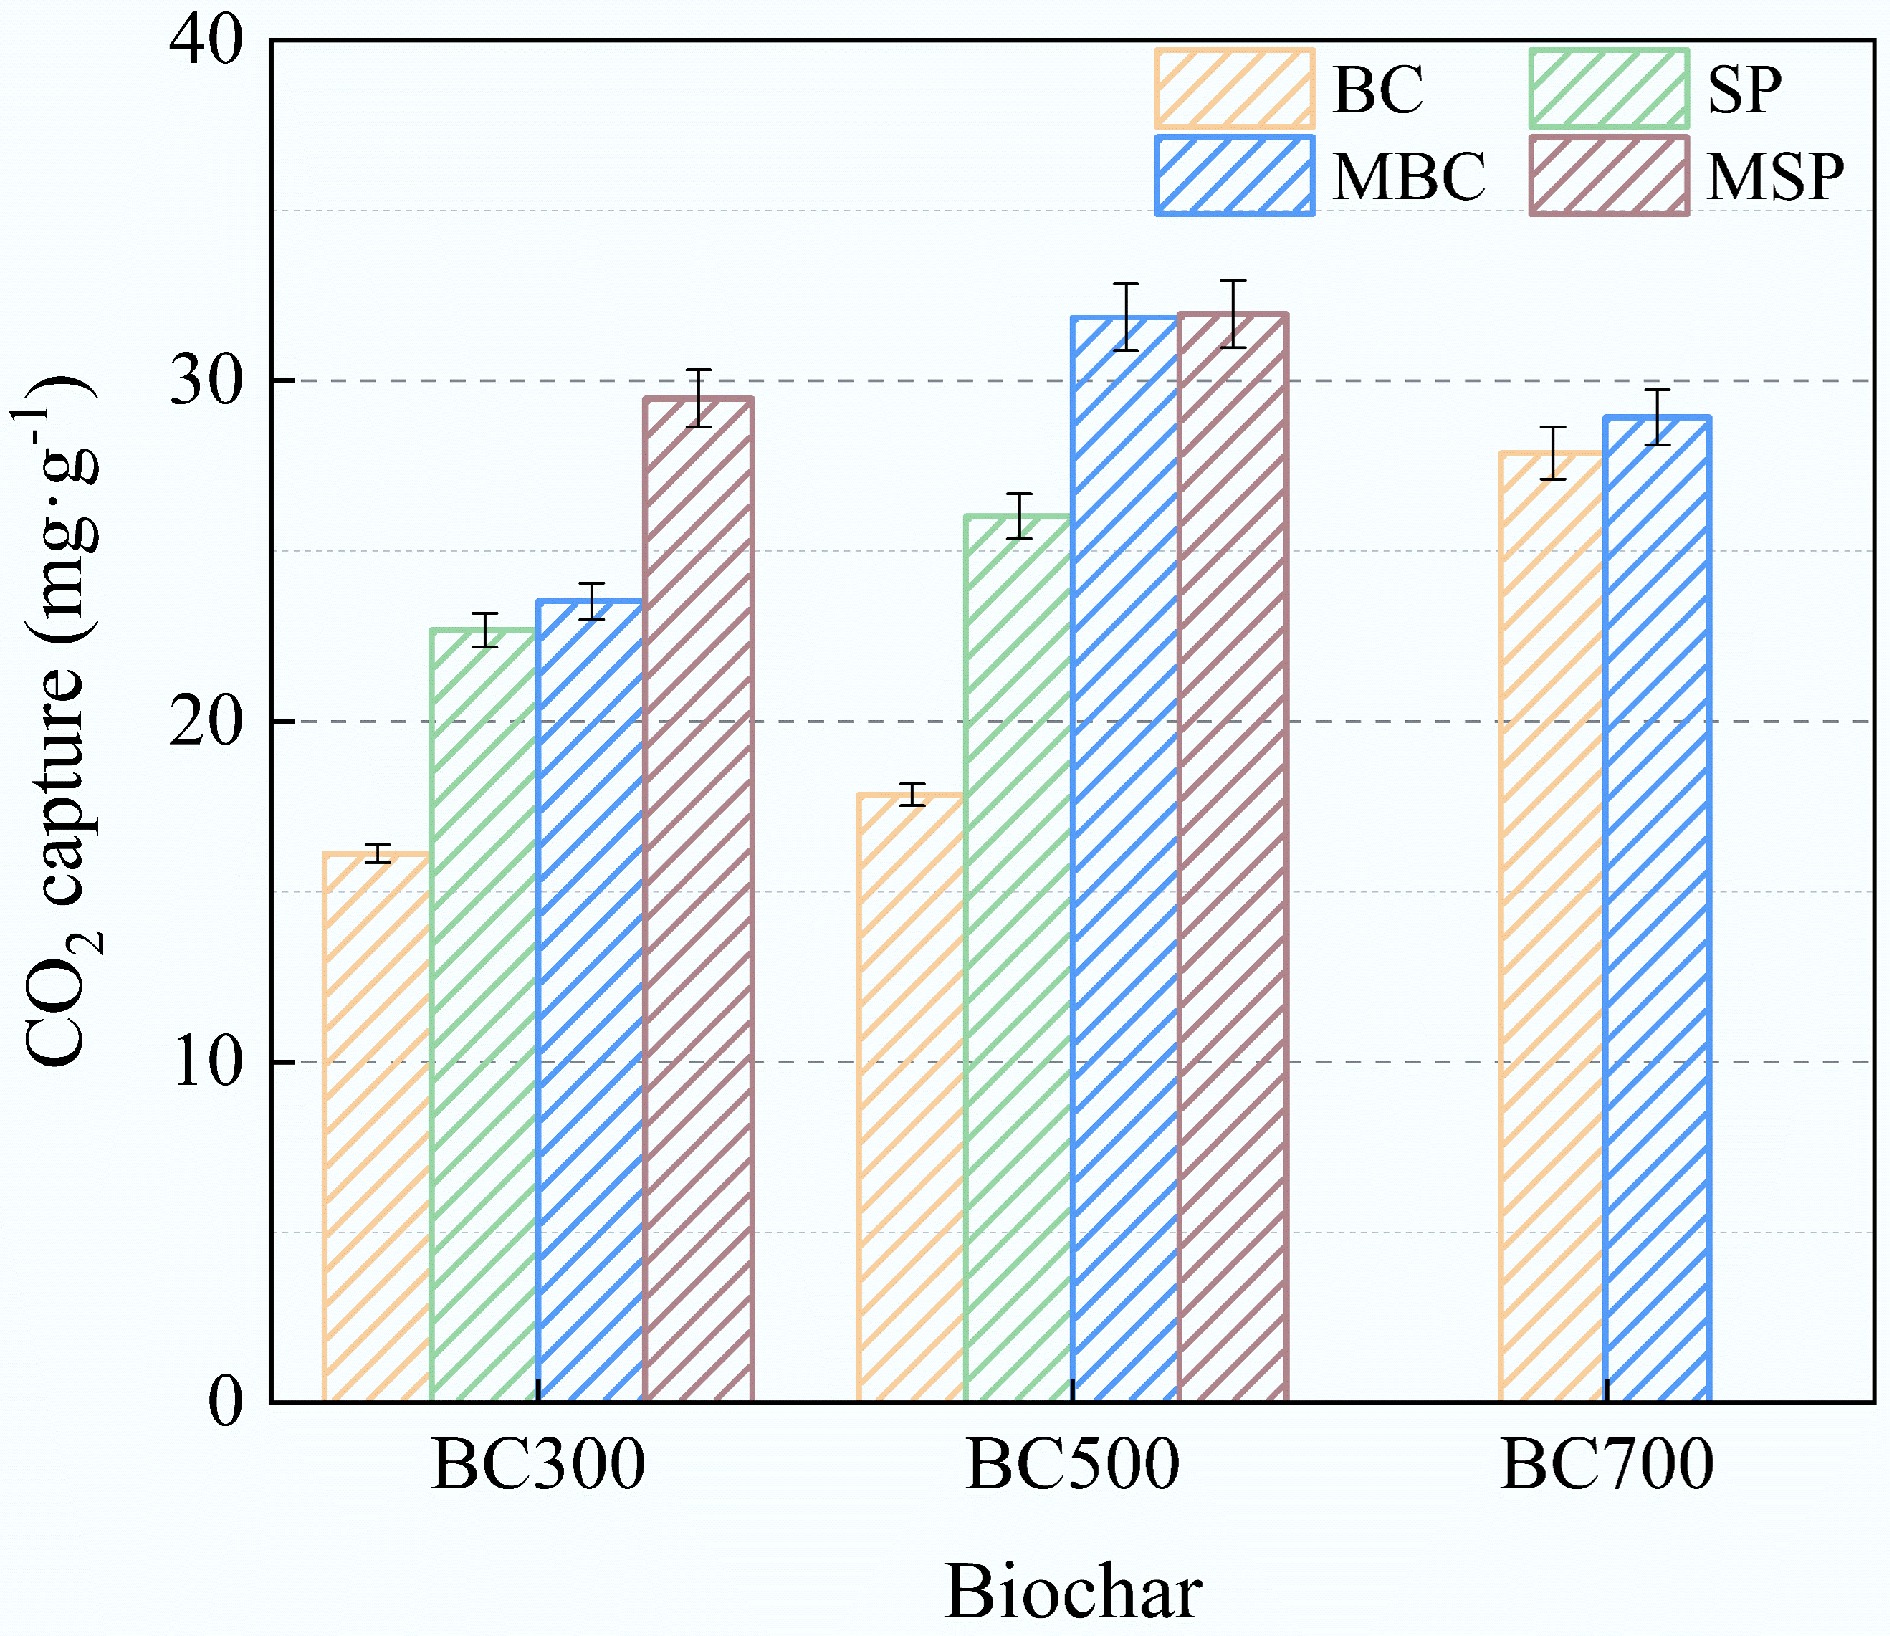
Figure 5.
CO2 uptake by different biochar at room temperature.
The Pfo, Pso, and Avrami models were employed to describe the CO2 adsorption process of different biochar (Fig. 6 and Table 5). It is reported that the Pfo model typically describes the reversible physical adsorption of CO2 by biochar, whereas the Pso model is more suitable for representing chemical adsorption, which involves chemical bonding interactions between CO2 and the biochar surface[39]. The Avrami model, a mathematical framework utilized to describe the kinetics of phase transitions, can also be applied to elucidate the processes of physical and chemical adsorption of CO2 by biochar[40]. The results showed that all biochar samples reached over 70% of their maximum adsorption capacity within 10 min, indicating their rapid adsorption behavior. Furthermore, among all the kinetic models for CO2 adsorption, the Avrami model yielded the highest R2 values, indicating that the CO2 adsorption in biochar is a result of both physical and chemical interactions. It is noteworthy that the R2 values for the Pfo model are higher than those of the Pso model, indicating that CO2 adsorption occurs primarily through physical interaction. In addition, the exponents n of the Avrami model are all higher than 1, indicating that CO2 is adsorbed in different regions of the biochar with varying probabilities. This is because the adsorption process is non-homogeneous.
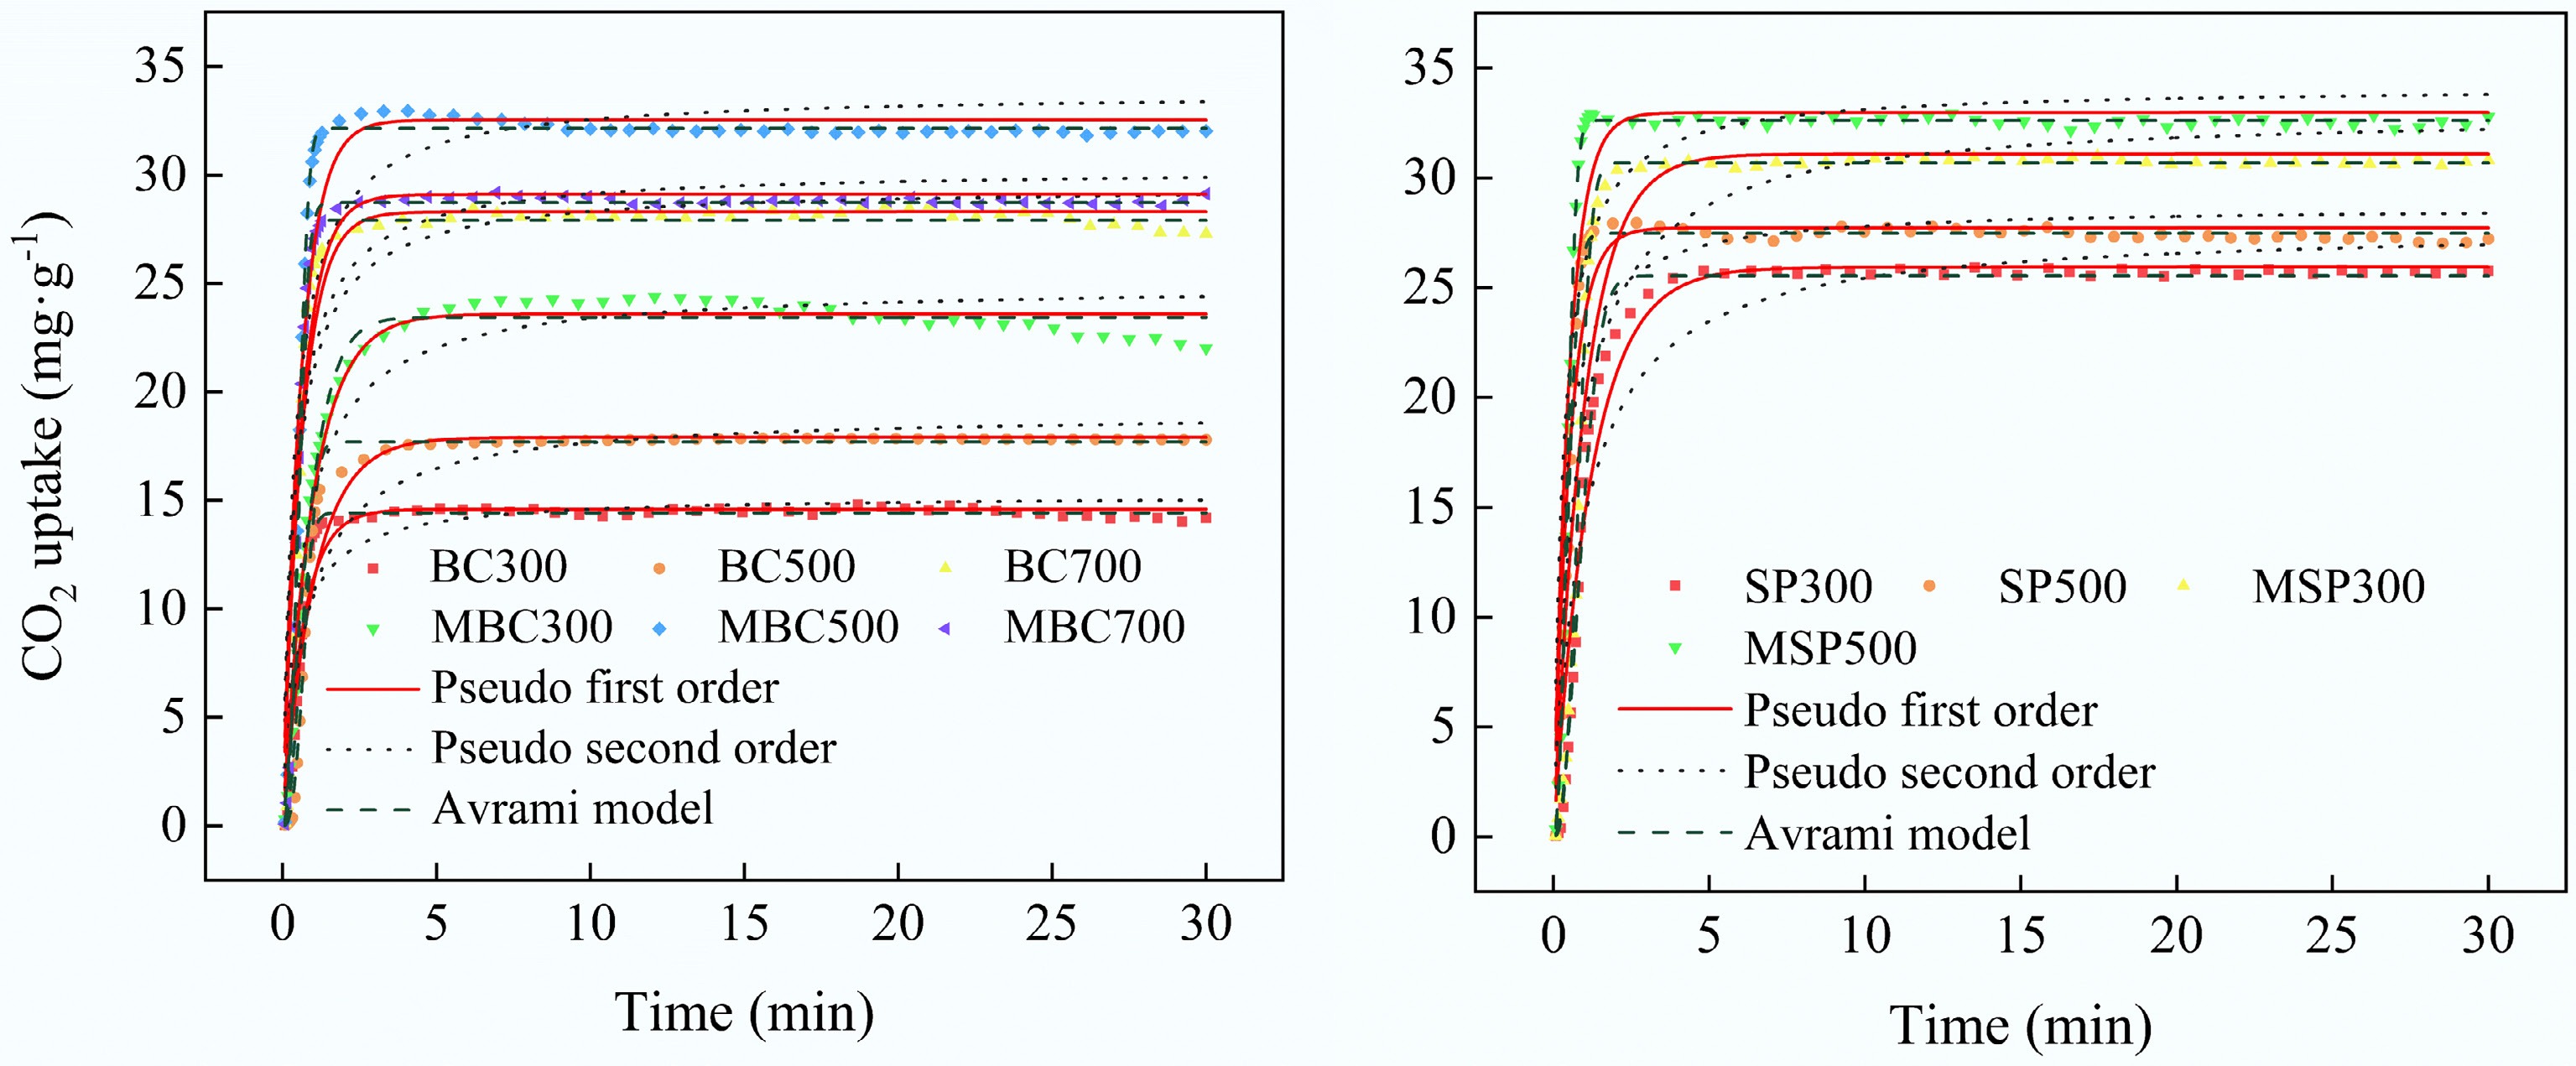
Figure 6.
Adsorption kinetic curves of different biochar samples at room temperature.
Table 5. Adsorption kinetics parameters of biochar to CO2
Model Pfo Model Pso Model Avrami Parameters qe k1 R2 qe k2 R2 qe kA n R2 BC300 14.59 1.5087 0.9270 15.23 0.1489 0.8501 14.43 2.5684 2.2174 0.9974 BC500 17.99 0.9815 0.9265 19.03 0.0676 0.8825 17.69 1.6072 2.7757 0.9959 BC700 28.30 1.6080 0.9243 29.48 0.0829 0.8468 27.91 3.1152 2.2713 0.9951 MBC300 23.59 1.0378 0.9808 24.92 0.0613 0.9360 23.43 1.0987 1.2791 0.9886 MBC500 32.53 1.6775 0.9072 33.80 0.0770 0.8138 32.14 3.6354 2.5360 0.9982 MBC700 29.10 1.6533 0.9217 30.27 0.0838 0.8380 28.72 3.2764 2.3077 0.9981 SP300 25.93 0.8307 0.9509 27.70 0.0393 0.9057 25.53 0.9339 2.0888 0.9936 SP500 27.72 1.9289 0.9283 28.69 0.1096 0.8283 27.47 3.4575 2.0176 0.9960 MSP300 31.08 1.0106 0.9168 32.98 0.0416 0.8571 30.68 1.3309 2.7293 0.9978 MSP500 32.97 1.9945 0.9096 34.13 0.0949 0.8037 32.61 4.6009 2.3394 0.9989 Figure 7 shows the exothermic rate during the hydration of cement composites incorporating 1% of different types of biochar. The first exothermic peak during the accelerated period appeared at 10 h, attributed to the hydration of tricalcium silicate (C3S)[41]. The results show that the incorporation of biochar neither delays nor accelerates the hydration process. Furthermore, modified biochar with adsorbed CO2 had lower heat escape here compared to the original biochar. This may be associated with CO2-induced carbonation, as CO2 adsorbed on modified biochar can convert some Ca(OH)2 to carbonate. Related studies have reported that the calorific value of calcium carbonate solution (102 calories·g−1) is lower than that of Ca(OH)2 (557 calories·g−1)[42]. The degree of carbonation may influence the microstructural connectivity within the interfacial transition zone (ITZ) between the biochar and the cement matrix, resulting in different compressive strengths of samples with different CO2 contents.
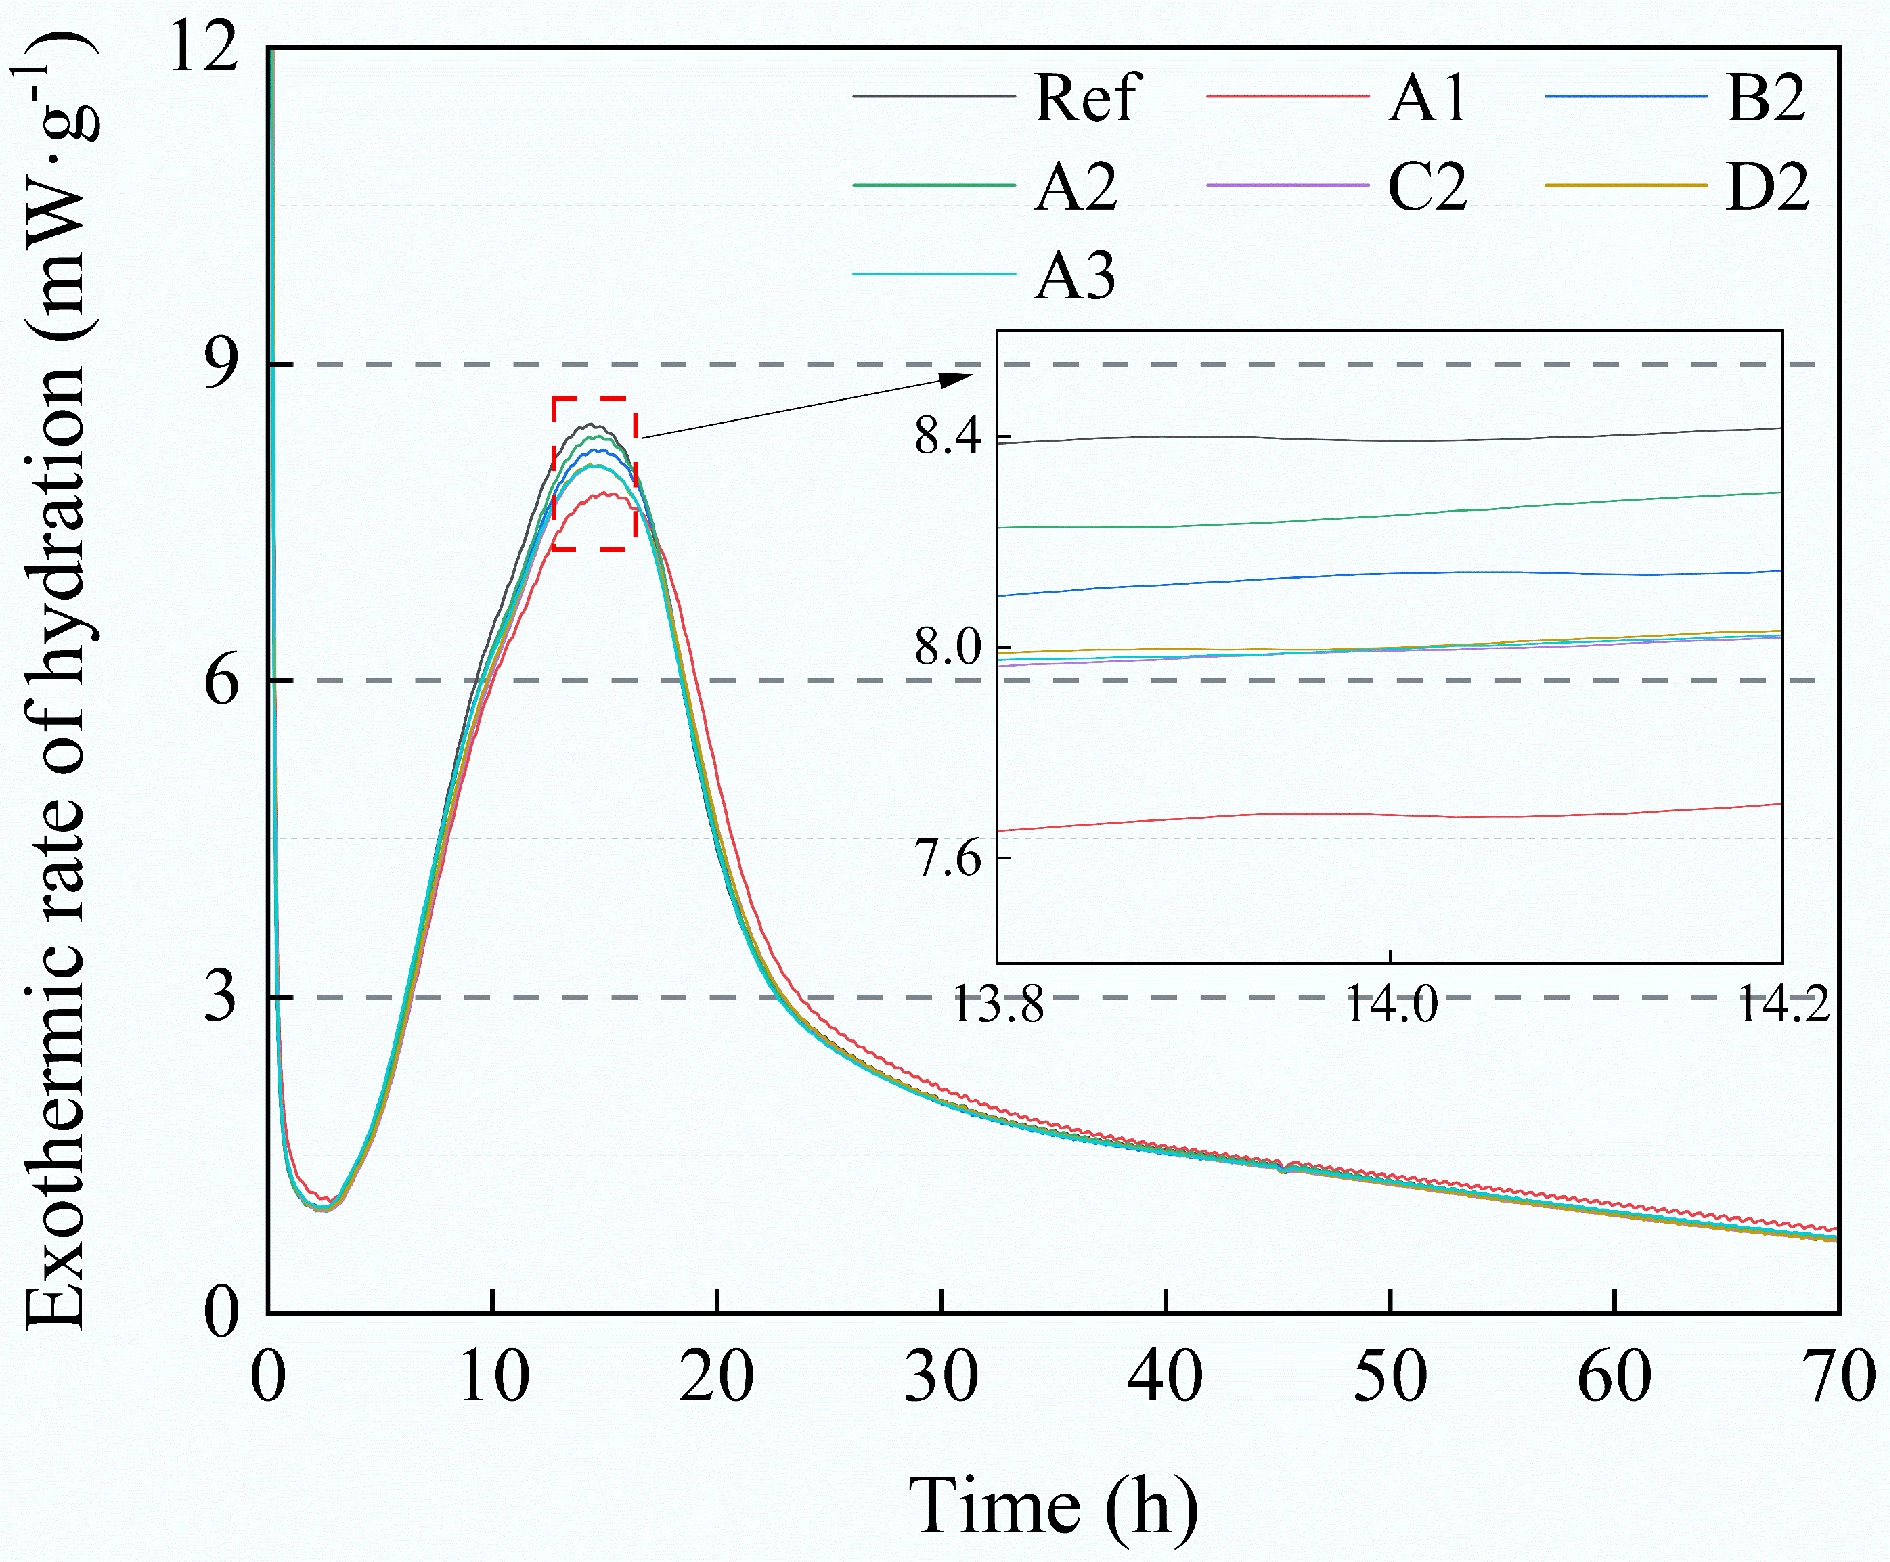
Figure 7.
Effect of different biochar additions on the exothermic rate of hydration of cement composites.
Figure 8 shows the compressive strength of different biochar cement composites. The results demonstrate that the 7-d compressive strength error bars were larger than those of the 28-d compressive strength. This may be because the test blocks are more fully hydrated and more stable in strength after 28 d. In all original biochar-cement composites, the compressive strength first increases and then decreases with the increase of the biochar pyrolysis temperature. Additionally, the compressive strength peaked at a 2% biochar dosage. This may be because different pyrolysis temperatures result in different nucleation, filling, and internal curing effects of biochar in cement composites, leading to different amounts of hydration products[43]. For example, BET results indicate that higher pyrolysis temperatures led to a higher SSA of biochar, contributing to hydration promotion. However, these effects cannot compensate for the reduction in cement content caused by the addition of biochar. Moreover, excessive biochar dosage increases porosity, which negatively affects the composites and makes them more prone to microcrack formation under pressure[44]. Interestingly, the compressive strength of SP at 7 d was lower than that of BC, while the opposite trend was observed at 28 d, which may be because the biochar volcanic ash effect has a more pronounced influence on the early compressive strength. In addition, CO2 adsorption on biochar is a physically exothermic process, thus facilitating the CO2 desorption process as the temperature increases. In this context, the heat generated from the cement hydration process may lead to the release of some CO2 from the modified biochar, thereby affecting the compressive strength of the cement composites. For example, the moderate addition of modified biochar with adsorbed CO2 promotes composites with higher compressive strengths compared to control and original biochar-cement composites. This is mainly attributed to the presence of CO2, which promotes internal carbonation of the cement composite, resulting in a denser structure. However, excessive CO2 incorporation can lead to an excessive expansion carbonation reaction around the biochar, which may introduce more voids in the cement composite and affect the compressive strength development[45]. Moreover, the optimization of the physicochemical properties of the biochar material also contributes to the compressive strength of the cement composites, as shown by the BET, XRD, and FTIR results. Compared to other pyrolysis temperatures, biochar pyrolyzed at 300 °C exhibited a higher fluctuation in the compressive strength of composites with increasing doping, which may be associated with the formation of fatty acids at low temperatures. In conclusion, the beneficial internal curing effects and the negative impacts of modified biochar for CO2 adsorption should be carefully balanced.
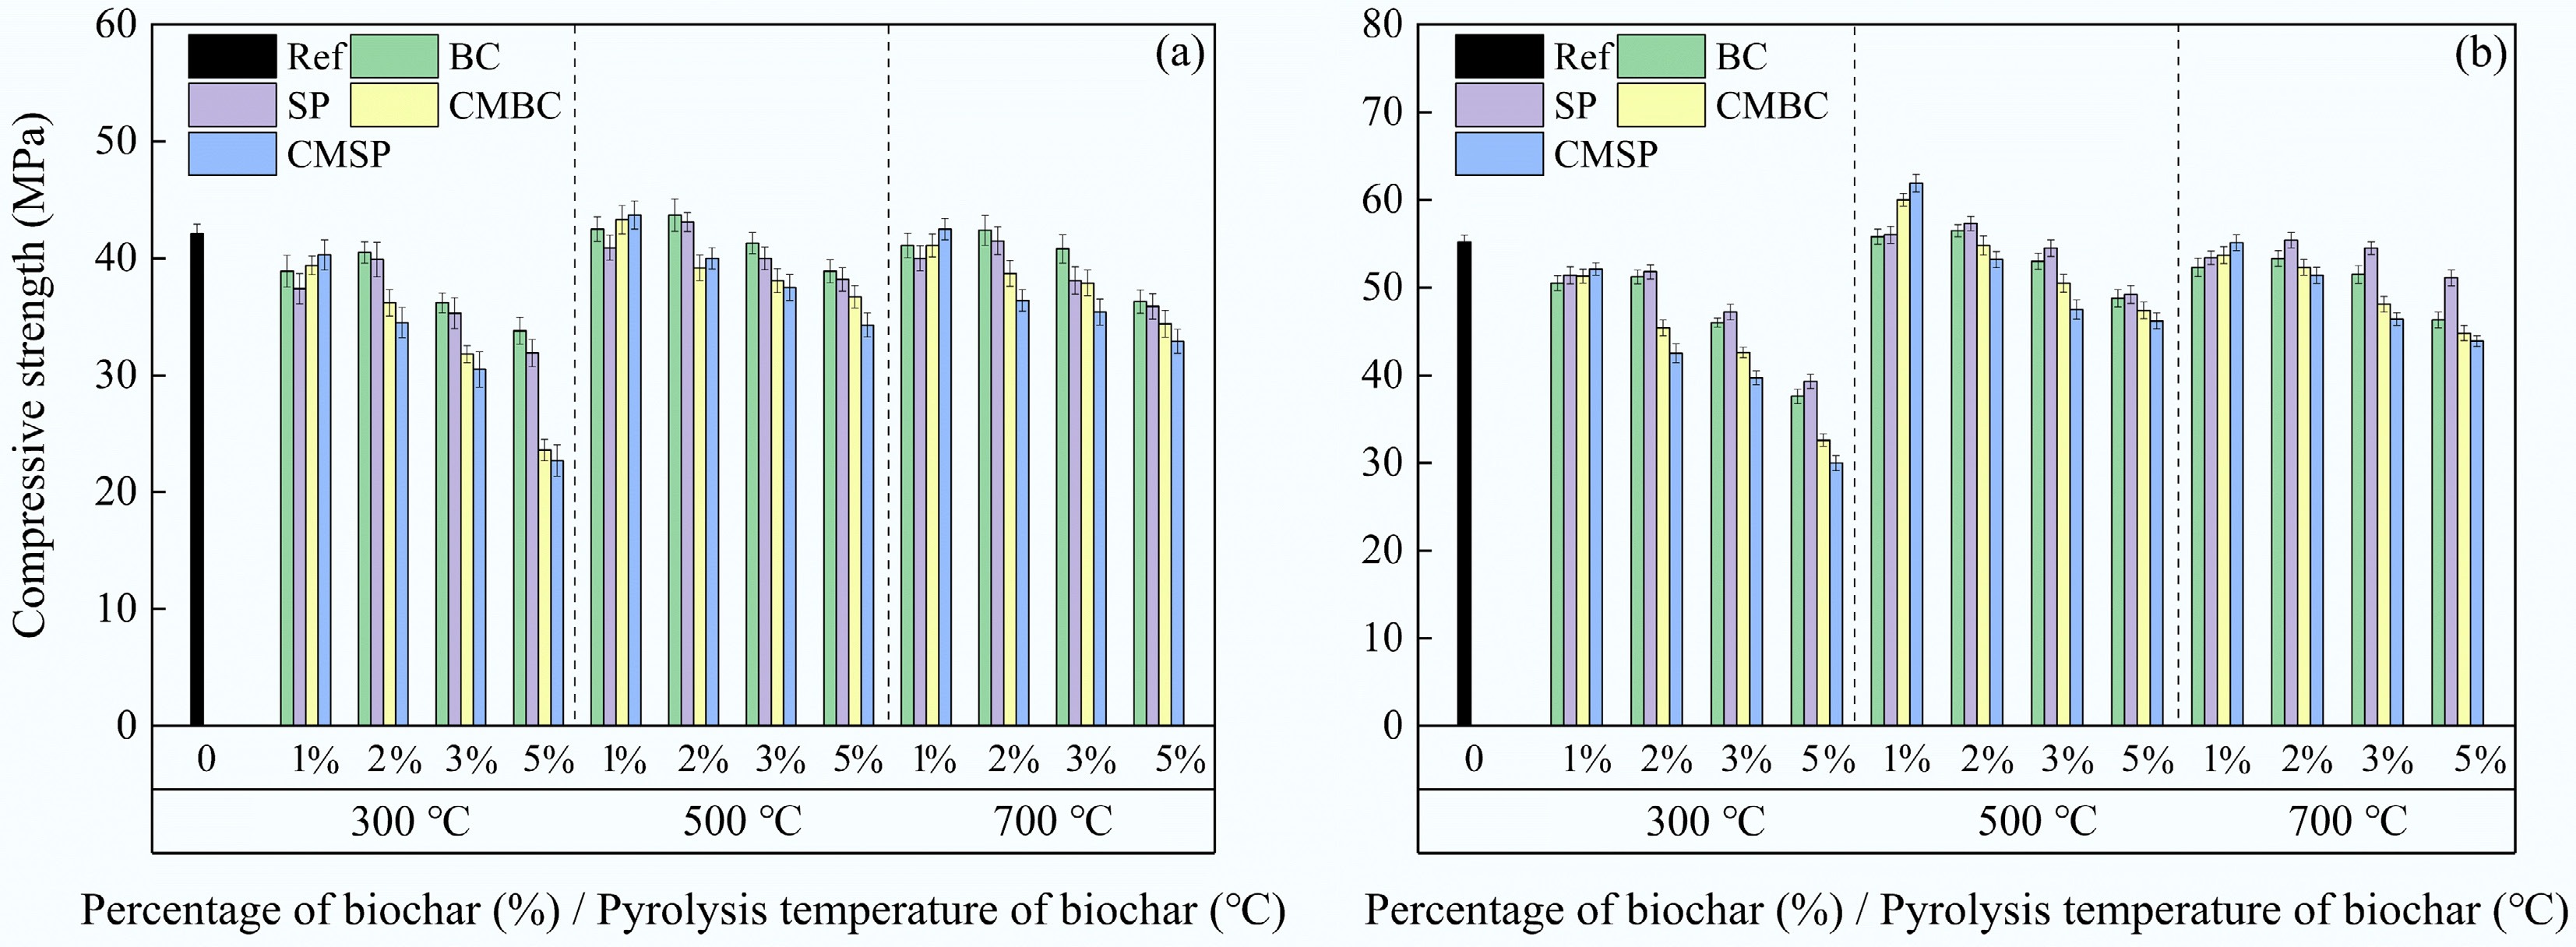
Figure 8.
Compressive strength results of different biochar cement composites tested at (a) 7, and (b) 28 d.
Figure 9a shows the XRD results of cement composites incorporating 1% biochar. Meanwhile, the most prominent peak (2θ = 18°) in the XRD spectrum was identified as semi-quantitative analysis of Ca(OH)2, and its integral area was analyzed (Supplementary Fig. S1). The results indicate that the primary crystalline phases Ca(OH)2, AFt, C3S, Belite (C2S), CaCO3, and SiO2 were present in all samples[41]. Therefore, the addition of biochar resulted in negligible changes to the crystalline phases. Moreover, the relatively high Ca(OH)2 content of BC500 and SP500 at 2θ = 18° compared to the control may be attributed to the promotion of cement hydration by biochar. However, BC300 and BC700 exhibited the opposite results, which may be due to the difference in pyrolysis temperatures, resulting in differences in the characteristics of the biochar itself, thereby affecting the performance of cement composites. This echoes the results of the physicochemical property tests of biochar mentioned above, including XRD, FTIR, and BET. In addition, the lower Ca(OH)2 content in modified biochar with adsorbed CO2, along with the increased peak intensity of calcite at 2θ = 18° can be attributed to the exothermic process of cement hydration, resulting in the desorption of CO2 from the biochar and the formation of CaCO3 by combining CO2 with some Ca(OH)2[32].
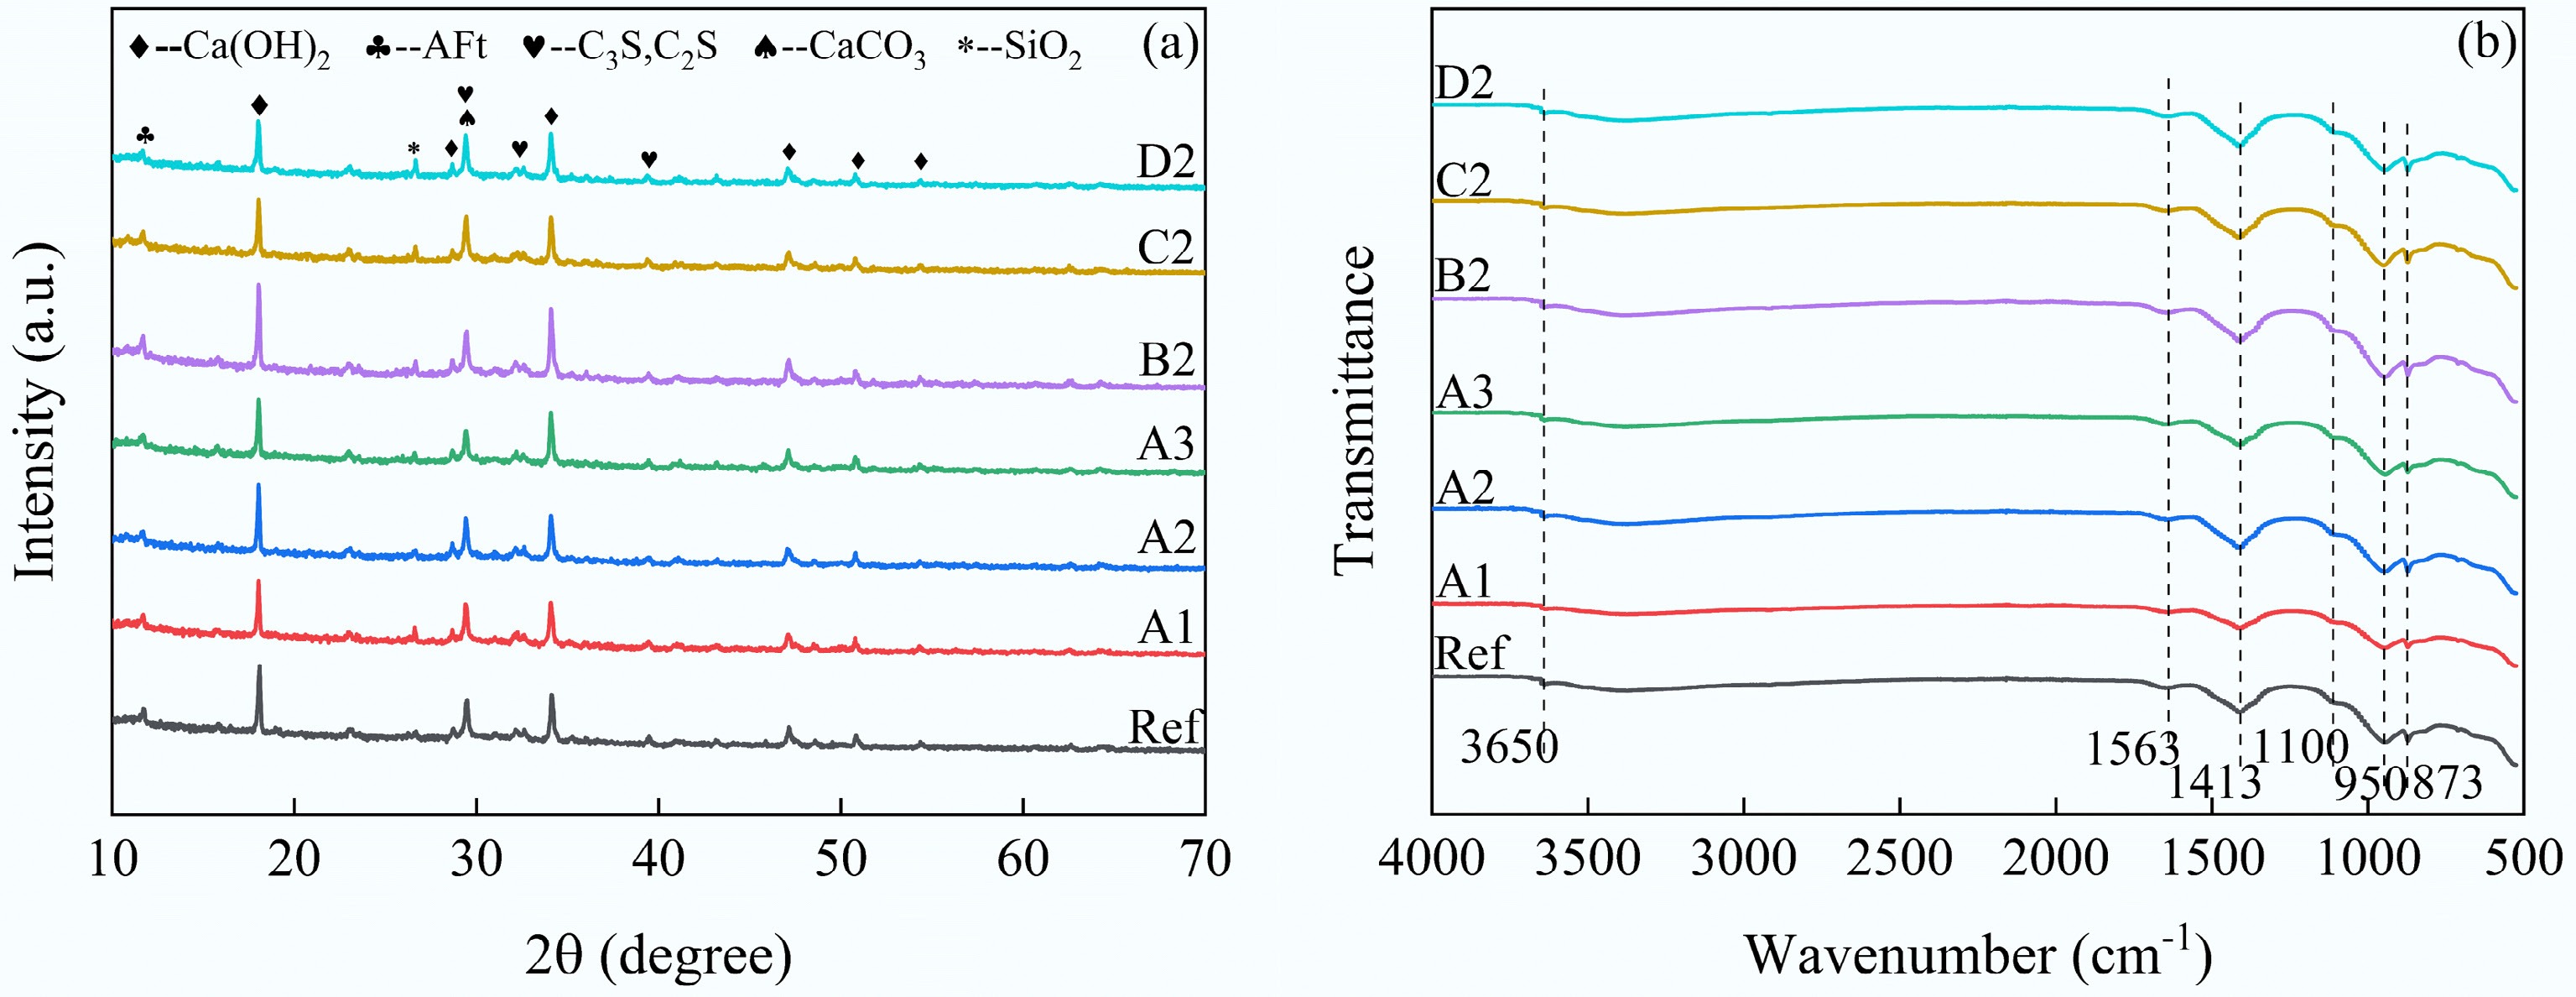
Figure 9.
Results of biochar-cement composites of (a) XRD, and (b) FTIR.
The FTIR results of the cement composites after 28 d are shown in Fig. 9b. The results demonstrate that the functional groups in all samples had similar energies, indicating that the samples contained the same composition. It is noteworthy that typical functional groups of biochar may not be observed in the samples because the characteristic peak intensity of biochar from corn stover pyrolysis may overlap with the hydration products. For example, the peak at 1,563 cm−1 is attributed to aromatic C=C in biochar or C=O vibrations in hydration products[46]. This is consistent with the FTIR results for biochar. Additionally, the peaks at 1,413 and 873 cm−1 represent the bending vibration of CO32−, and the peak at 950 cm−1 corresponds to the vibration of calcium silicate hydrate (C-S-H)[47]. In general, these peak strengths are considered to have some correlation with the strength of the cement composite. The peak intensities of BC300 and BC700 are slightly reduced at these locations and increased for the other biochar samples compared to the control. This demonstrates that, except for BC300 and BC700, the other 1% incorporation of biochar promoted the formation of more hydration products. This is consistent with the compressive strength results.
The SEM results of the cement composites cured for 28 d are shown in Fig. 10. Layered Ca(OH)2 crystals and flocculent C-S-H gels were observed in all samples[46]. This indicates that the incorporation of biochar had no effect on the type of hydration products in cement composites. Adding an optimal amount of biochar to the cement composites promoted the formation of hydration products, resulting in a more compact internal structure than that of the control group. Previous works have demonstrated that, due to van der Waals forces, cracks and pores cause ITZ connections to be weak and prone to fracture[48]. In this study, large pores were observed in the ITZ between biochar particles pyrolyzed at 300 and 700 °C and the cement matrix. As a result, the compressive strength of the biochar-cement composites decreased. Furthermore, the composites with C2 and D2 exhibited a denser microstructure, correlating with their improved strength in this work.
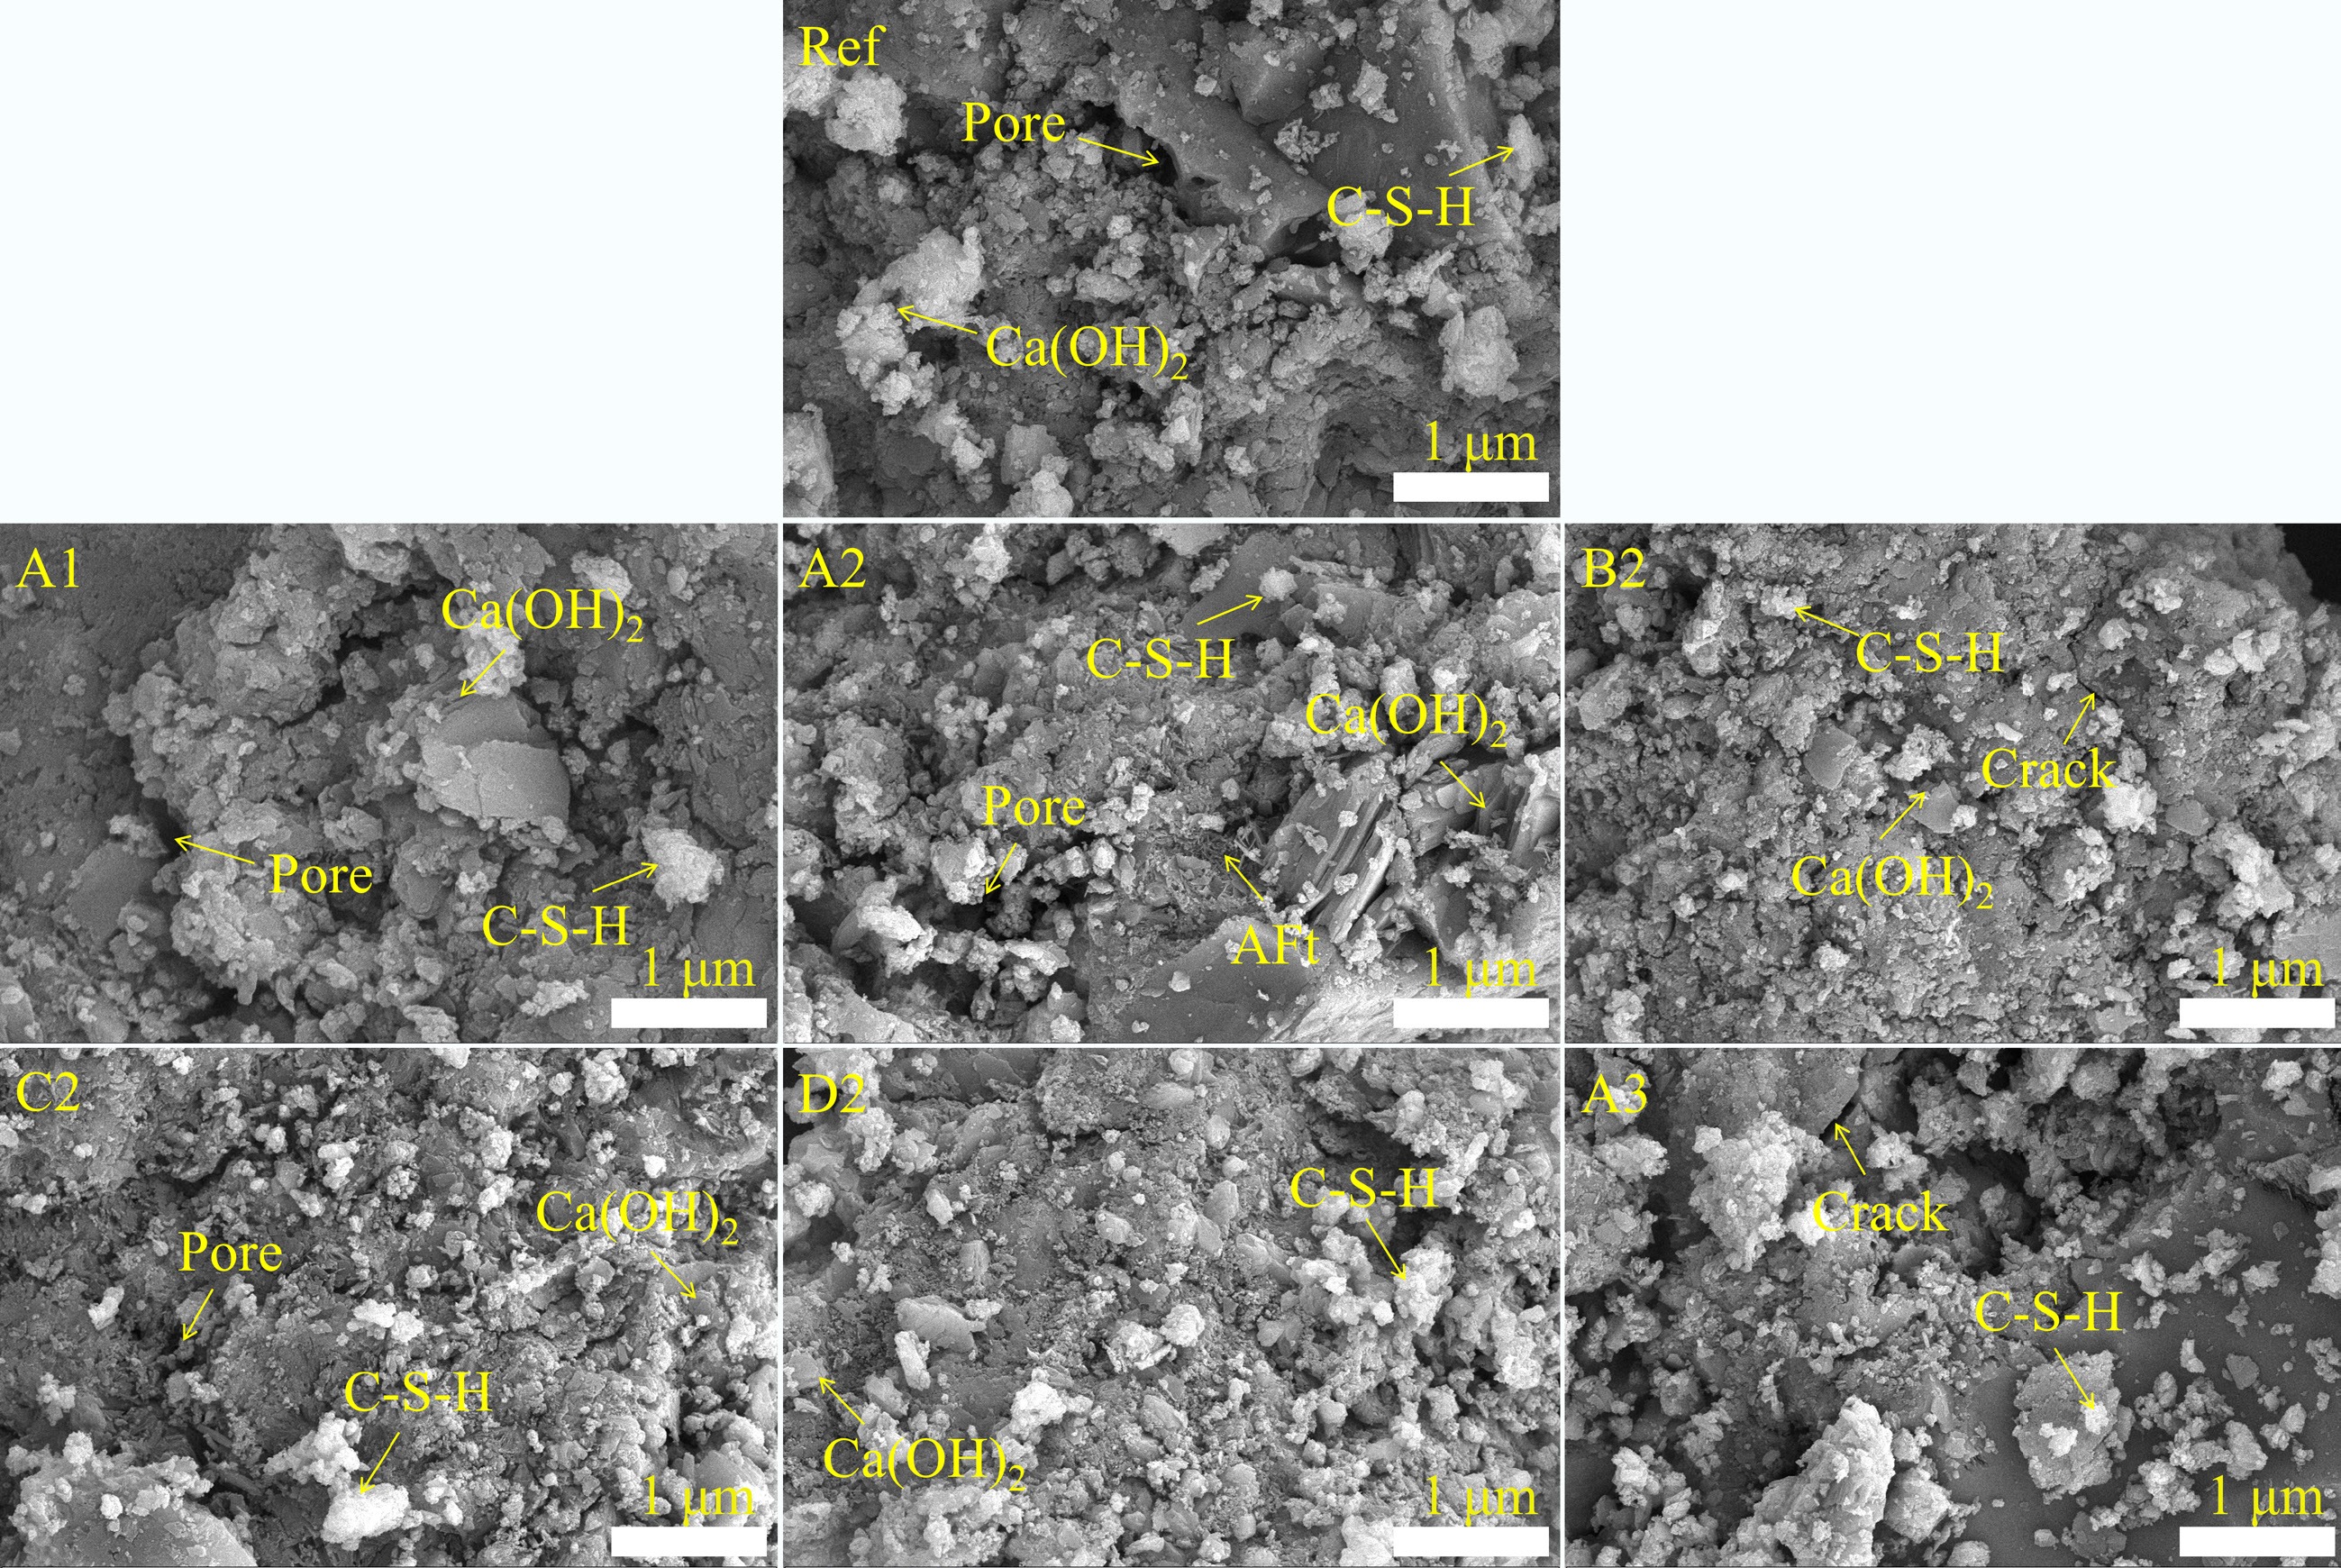
Figure 10.
SEM results for Ref, A1, A2, B2, C2, D2, A3.
The TG and DTG curves of the biochar-cement composites after 28 d of air curing are shown in Fig. 11. The results indicate that AFt, aluminate ferrite monosulfate (AFm), and C-S-H decomposed between 50–200 °C; Ca(OH)2 decomposed between 420–540 °C; and CaCO3 decomposed between 600–800 °C, exhibiting significant decomposition peaks[20]. It is noteworthy that when the test temperature exceeded the biochar pyrolysis temperature, there was a slight loss of biochar. However, this mass loss is not accounted for in this study due to its negligible magnitude. It is reported that Ca(OH)2 is an important indicator of the degree of hydration[46]. As listed in Table 6, the relatively high Ca(OH)2 content in the A2 and B2 samples indicates that biochar promotes cement hydration. Moreover, C2 and D2 exhibited a significantly higher mass loss compared to the control group in the temperature range of 600 to 800 °C. This phenomenon is attributed to the decomposition of calcite, and a similar trend is observed in the XRD results. These result demonstrates that CO2 adsorbed by biochar can effectively accelerate carbonation and enhance the strength of composites.

Figure 11.
Results of TG and DTG.
Table 6. Mass loss of Ca(OH)2 and CaCO3 in various biochar cement composites (wt.%)
Item Ca(OH)2 CaCO3 Ref 2.822 5.474 A1 2.685 5.989 A2 2.883 5.273 A3 2.806 6.164 B2 2.967 5.782 C2 2.759 6.451 D2 2.693 6.511 Figure 12 shows the hydration process of cement composites incorporating different types of biochar. In cement systems, CO2 typically undergoes a reaction process involving dissolution, ion diffusion, and precipitation. CO2 dissolves and ionizes in the presence of water, forming CO32− and H+. Notably, this process is exothermic and accompanied by some evaporation of the mixing water. Meanwhile, cement particles rapidly release Ca2+ upon dissolution. In the presence of water and high temperatures, Ca2+ reacts with CO32− to form a supersaturated solution, which subsequently leads to the precipitation of CaCO3[49]. The compressive strength results confirm this observation. In this period, the rapid formation of C-S-H contributed to the further enhancement of the corresponding strength. Moreover, the C-S-H formed around the biochar-saturated region undergoes decalcification and gradually transforms into SiO2 gel, leading to a reduction in the pH of the pore solution[50].
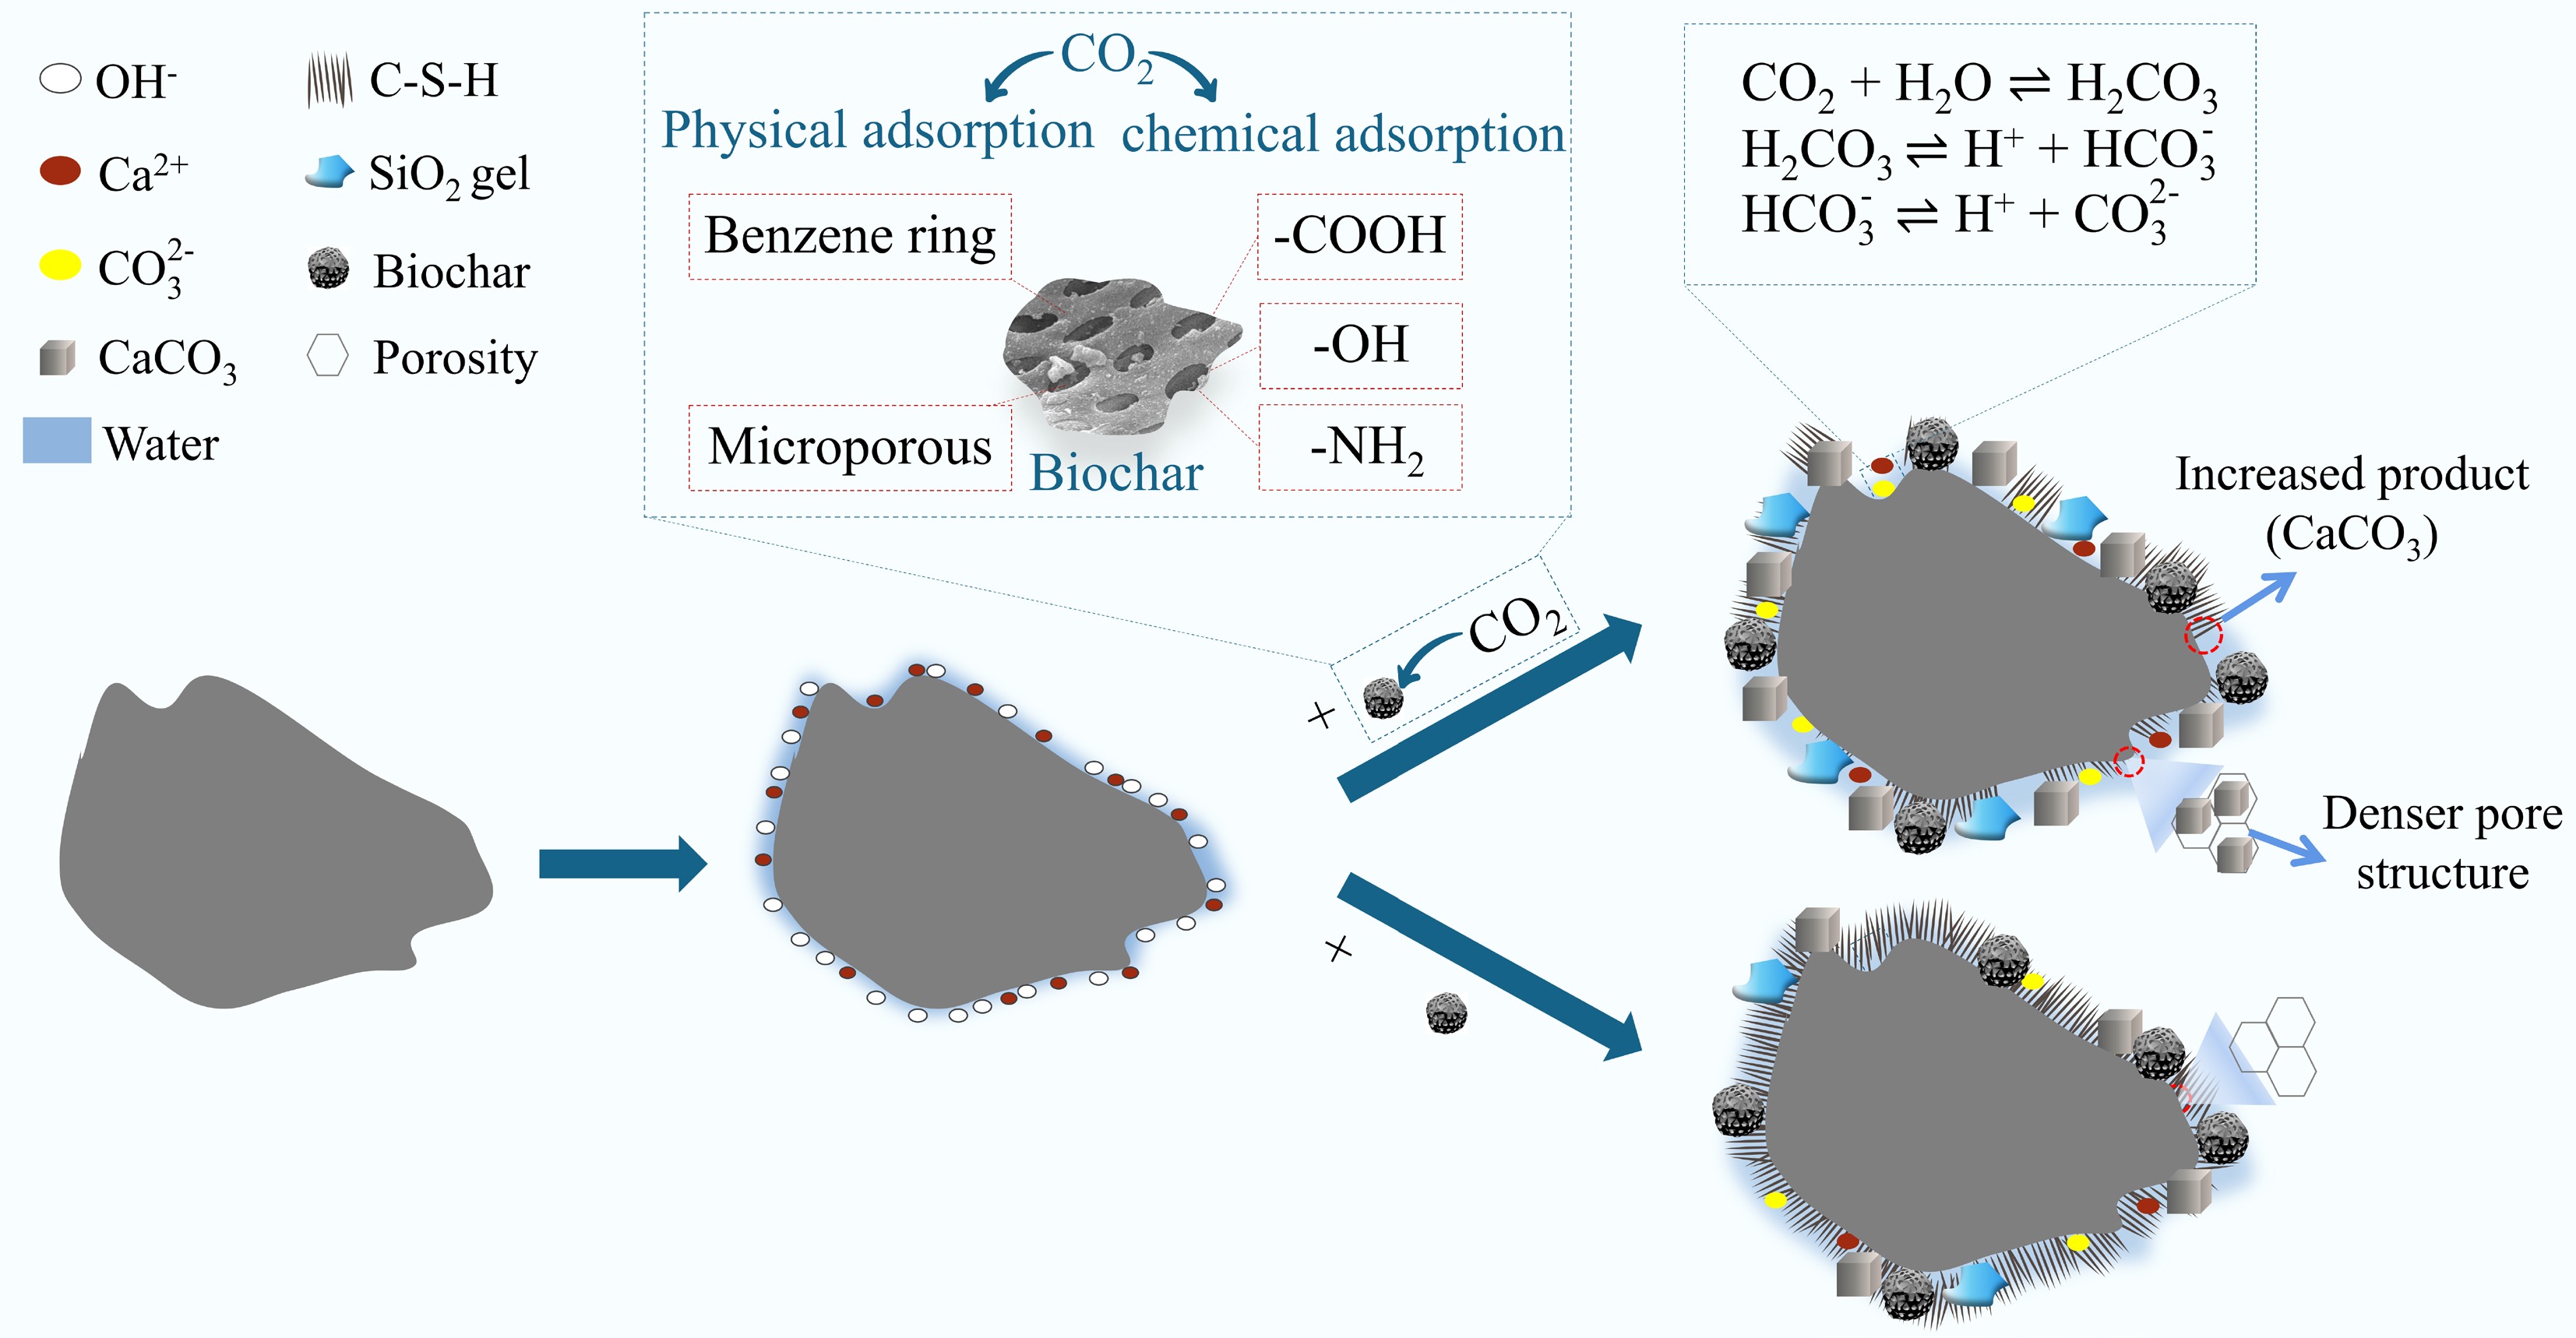
Figure 12.
Influence of different biochar on the cement hydration mechanism.
The quantified emission values of biochar cement composites are shown in Table 7, Supplementary Tables S2, and S3. The results indicate that cement production is the principal source of carbon emissions in biochar-cement composites. However, the incorporation of biochar contributes to a reduction in CO2 emissions. Moreover, the preparation of biochar avoids landfill disposal of biomass. Nevertheless, the carbon emissions caused by the use of chemical reagents may outweigh the environmental benefits gained from the process. It was observed that, regardless of the pyrolysis temperature of biochar, the carbon reduction achieved by applying SP in cement exceeded the emissions generated during the preparation of SP from BC. Furthermore, avoided emissions due to biochar production comprise two components: carbon sequestered within the biochar and replacing fossil fuels with syngas and bio-oil of equivalent caloric value. In short, the utilization of biochar reduces the environmental impacts associated with waste management.
Table 7. Carbon emissions of biochar cement composites
Materials/processes
(10−5 kg)Without BC A2/B2/C2/D2 (1%) A2/B2/C2/D2 (2%) A2/B2/C2/D2 (3%) A2/B2/C2/D2 (5%) Ecoinvent inputs OPC 29400 29100 28800 28500 27900 Cement production, Portland Water 2.69 2.69/4.93/4.37/6.61 2.69/7.17/6.05/10.53 2.69/9.41/7.73/14.45 2.69/13.89/11.09/22.29 Tap water production, conventional treatment BC500 production (−) − 138.33/173.94/
138.33/173.94276.66/347.88/
276.66/347.88414.99/521.82/
414.99/521.82691.65/869.70/
691.65/869.70Biochar preparation NaOH − 0/0/636/636 0/0/1272/1272 0/0/1908/1908 0/0/3180/3180 China carbon emissions database Transportation 164.4 168.48/168.62/
168.48/168.62172.55/172.84/
172.55/172.84176.63/177.07/
176.63/177.07184.77/185.52/
184.77/185.52Transportation distance: 30 km Avoided emission (−) − 0.59/0.60/0.59/0.60 1.17/1.20/1.17/1.20 1.76/1.81/1.76/1.81 2.93/3.01/2.93/3.01 − Net emission 29567.088 29132.25/29099.01/
29769.93/29736.6928697.41/28630.93/
29972.77/29906.2928262.57/28162.85/
30175.61/30075.8927392.88/27226.70/
30581.28/30415.10− -
This work introduces biochar as a carbon sequestration admixture for cement composites. The results indicate that increasing the pyrolysis temperature enhanced the CO2 adsorption capacity of both the original biochar and SP, with SP exhibiting a greater capacity than the original biochar. Alkali modification enhanced the microporous structure of biochar, thereby further increasing its CO2 capture capacity. Notably, the adsorption process was predominantly governed by physical adsorption, with chemical adsorption playing a secondary role. In addition, an appropriate dosage of biochar can mitigate the adverse effects associated with reduced cement content through the micro-filler effect, volcanic ash effect, and secondary hydration effect. In contrast, SP promoted the strength of cement composites better than the original biochar. However, excessive biochar addition resulted in a reduction in strength due to the increased porosity. Additionally, incorporating an appropriate amount of CO2-saturated modified biochar accelerated the carbonization process, resulting in the formation of a denser microstructure. However, excessive CO2 triggered an overreaction in the carbonation process of biochar-cement composites, resulting in the formation of additional voids and a reduction in their mechanical properties. Additionally, the incorporation of biochar contributed to reducing the carbon footprint of cement composites. Future studies should further investigate the applicability of different modified biochar saturated with CO2 at higher dosages. Additionally, comprehensive long-term durability evaluations, including resistance to environmental exposures, such as sulfate attack and chloride penetration, are crucial for fully assessing the practical applicability and benefits of biochar cement composites.
-
It accompanies this paper at: https://doi.org/10.48130/bchax-0025-0004.
-
Not applicable.
-
All authors contributed to the study conception and design. Data curation, validation, and formal analysis were performed by Binglin Guo, Ping Ye, Huyong Qin, Cheng Wang, Yang Liu, Yuyang Chen, Pengfei Bian, Di Lu, Lei Wang, Tongsheng Zhang, and Weiping Zhao. Project administration and funding acquisition were performed by Binglin Guo. Investigation and supervision were performed by Binglin Guo, Lei Wang, Tongsheng Zhang, Binggen Zhan, and Qijun Yu. Conceptualization was performed by Binglin Guo, Lei Wang, and Tongsheng Zhang. Review and editing were performed by Binglin Guo, Lei Wang, and Tongsheng Zhang. Methodology was performed by Binglin Guo and Ping Ye. The original draft was produced by Ping Ye. All authors commented on previous versions of the manuscript and approved the final version of the manuscript.
-
The datasets used or analyzed during the current study are available from the corresponding author upon reasonable request.
-
This work was provided to BG by 'the Fundamental Research Funds for the Central Universities' (Grant No. PA20255GDGP0027), and 'the University Synergy Innovation Program of Anhui Province' (Grant No. GXXT–2023–104).
-
The authors declare that they have no conflict of interest.
-
Full list of author information is available at the end of the article.
- Supplementary Table S1 The ratio of different biochar incorporated into cement composites.
- Supplementary Table S2 Carbon emissions of biochar cement composites (A1/B1/C1/D1).
- Supplementary Table S3 Carbon emissions of biochar cement composites (A3/B3/C3/D3).
- Supplementary Fig. S1 Semi-quantitative XRD analysis of Ca(OH)2.
- Copyright: © 2025 by the author(s). Published by Maximum Academic Press, Fayetteville, GA. This article is an open access article distributed under Creative Commons Attribution License (CC BY 4.0), visit https://creativecommons.org/licenses/by/4.0/.
-
About this article
Cite this article
Guo B, Ye P, Qin H, Wang C, Liu Y, et al. 2025. Investigation of the CO2 adsorption behavior of alkali-modified biochar components in cement composites. Biochar X 1: e006 doi: 10.48130/bchax-0025-0004 

Investigation of the CO2 adsorption behavior of alkali-modified biochar components in cement composites
- Received: 14 July 2025
- Revised: 16 August 2025
- Accepted: 10 September 2025
- Published online: 20 October 2025
Abstract: Incorporating biochar into cement offers an effective strategy to reduce carbon emissions. However, the structural heterogeneity of the original biochar limits its capacity for CO2 adsorption. In this work, biochar was produced by pyrolyzing corn straw at 300, 500, and 700 °C, and its main heterogeneous component—sedimented particles (SP)—was obtained through physical separation. Subsequently, both the original biochar and SP were treated with alkali to investigate their CO2 adsorption capacities. Furthermore, original biochar, SP, CO2-saturated modified biochar, and CO2-saturated modified SP were each incorporated into cement composites at dosages of 1%, 2%, 3%, and 5% by cement mass to evaluate their effects on the mechanical properties and carbon sequestration performance. The results demonstrated that SP had a higher CO2 adsorption capacity than the original biochar, and this capacity increased further with rising pyrolysis temperature. The adsorption kinetics indicate that biochar primarily undergoes physical adsorption of CO2, with a minor contribution from chemical adsorption. Furthermore, as the pyrolysis temperature of biochar increased, its effects on cement composites led to a trend of first increasing and then decreasing hydration product formation. The CO2-saturated modified SP resulted in higher compressive strength compared to cement composites containing SP alone at a substitution rate of 1%. This work provides insights that promote the effective utilization of biochar in the carbon sequestration of cement composites.
-
Key words:
- Biochar /
- CO2 adsorption /
- Alkali-modified /
- Carbon sequestration /
- Cement composites