


-
Composting is a sustainable and eco-friendly biochemical technology for managing municipal solid waste. Its low cost, operational simplicity, and adaptability have led to widespread adoption as an efficient method for organic waste recovery[1,2]. However, conventional aerobic composting, which relies primarily on indigenous microbial communities, is subject to several limitations, such as lower thermophilic temperatures, extended processing times, inconsistent product quality, significant greenhouse gas emissions, and nitrogen losses[3,4].
To enhance composting performance, researchers have investigated a variety of exogenous additives, including biochar, montmorillonite clay, zeolite, and gypsum[4−10]. In particular, biochar-amended composting has garnered considerable attention due to its benefits in enhancing soil health and promoting ecosystem sustainability[11,12]. The efficacy of biochar can be attributed to its physicochemical properties, such as high surface area, porosity, cation exchange capacity, and water-holding capacity, all of which contribute to favorable microbial habitats and improved nutrient dynamics[13]. Consequently, these properties collectively support improved organic matter degradation and humification, reduced nitrogen losses and greenhouse gas emissions, heavy metal immobilization, and prolonged thermophilic phases, leading to superior compost maturity and quality[13−17]. Additionally, biochar has been observed to mitigate the bioavailability of hazardous contaminants and eliminate antibiotic resistance genes during composting[13,15,16,18,19].
Despite these advantages, the published results regarding the effects of biochar exhibit considerable variability, and occasionally conflicting outcomes. These discrepancies mainly arise from complex interactions between two key factors: (1) intrinsic characteristics of biochar, including feedstock type, pyrolysis temperature, and particle size[20−23]; and (2) initial compost parameters, such as C/N ratio, moisture content, and pH levels[7,24]. Given this complexity, there is a pressing need for an integrative approach to quantitatively synthesize heterogeneous empirical data.
Meta-analysis serves as a robust methodological framework for the statistical combination of outcomes from independent studies, revealing consistent patterns and significant associations that may remain obscured in individual experiments[25]. Prior meta-analyses have demonstrated the effectiveness of biochar in enhancing nutrient retention in compost and mitigating emissions[2,25]. However, the majority of these studies have either focused on internal maturity indicators (e.g., germination index, nutrient content) or external gas emissions, rarely integrating both aspects within a single analytical framework. This study endeavors to bridge this gap by conducting a holistic, multi-indicator meta-analysis of the effects of biochar amendments on compost maturation.
To achieve this, this study compiled a global dataset comprising 269 observations drawn from 125 peer-reviewed studies published between 1990 and 2024. The analysis integrates both internal maturity indicators, including germination index (GI), C/N ratio, ammonium nitrogen (NH4+−N), and nitrate nitrogen (NO3−−N), and external indicators such as CO2, N2O, CH4, and NH3 emissions, across diverse composting systems. The influence of biochar properties and initial compost parameters on these outcomes was systematically examined through subgroup analyses and statistical modeling. Furthermore, structural equation modeling (SEM) was employed to rank the relative importance of key factors and to elucidate the direct and indirect pathways through which they affect compost maturity. The findings of this study provide comprehensive insights into the mechanisms and efficacy of biochar amendments, offering practical guidance for the optimization of composting strategies aimed at enhancing both compost quality and environmental performance.
-
A comprehensive literature search was conducted using Web of Science, Google Scholar, Elsevier ScienceDirect, and PubMed to gather data on the effects of biochar as an additive on compost maturity indicators. The search strategy employed combinations of the keywords: 'biochar', 'black carbon', or 'char'; 'maturity' or 'mature'; and 'composting' or 'compost', while excluding terms such as 'review' and 'meta-analysis' (Supplementary Table S1). The search encompassed publications from January 1, 1990, to January 31, 2024.
To identify relevant literature, we implemented a systematic screening process based on specific criteria. First, only original research articles presenting quantitative data on the changes in compost maturity attributable to biochar application was included. Second, the studies were required to feature both a control group (without biochar), and an experimental group (with biochar), along with replicates to facilitate comparisons among various groups. Third, selected studies had to report both properties of biochar and the initial conditions of compost. Mean values, standard deviations (SD), and the number of control and treatment groups were extracted from tables or digitized from figures using the GetData Graph Digitizer. For studies providing only standard errors (SE), SD was calculated using the formula SD = SE ×
$ \sqrt{n} $ Data processing and subgroup classification
-
Biochar properties and initial compost parameters have been identified as key variables influencing composting maturity[25,28]. Nine properties of biochar included pyrolysis temperature, feedstock type, size, carbon to nitrogen (C/N), electrical conductivity, surface area, pH, amendment rate, and pore volume. Initial compost parameters consist of the initial carbon to nitrogen, initial moisture content, initial pH, waste type, and bulking agent type[25,29,30]. Maturity indicators of compost encompassed internal indicators such as carbon-to-nitrogen ratio, germination index, ammonium nitrogen, and nitrate nitrogen, as well as the gas index of ammonia, methane, carbon dioxide, and nitrous oxide[2,31]. A list detailing the biochar properties, initial compost parameters, and eight compost maturity indicators, along with their full names and corresponding abbreviations, is presented in Table 1.
Table 1. Complete nomenclature and abbreviations for biochar properties, initial compost parameters, and indicators of compost maturity
Items Full name Abbreviation Value range Biochar properties Pyrolysis temperature PT 300−900 °C Size Size 0.074−50 mm Carbon to nitrogen C/N 4.521−856.38 Electrical conductivity EC 0.09−131 ms/cm Surface area SA 0.35−1,150 m2/g pH pH 3.05−11.39 Amendment rate AR 0%−70% Pore volume PV 0.0035−0.9 cm3/g Feedstock type FT Wood Straw Husk Bamboo Manure/green waste/sewage sludge Initial
compost parametersInitial carbon to nitrogen IC/N 6−50.15 Initial moisture content IMC 36.8%−78.73% Initial pH IpH 4.09−9.31 Waste type WT Livestock manure Sewage sludge Green waste Food waste Bulking agent type BAT Sawdust Straw Other bulking agents Compost maturity indicators Carbon to nitrogen ratio C/N ratio 5.78−48.1 Germination index GI 0.88%−186.44% Ammonium nitrogen NH4+−N 0.024−4910a Nitrate nitrogen NO3−−N 0.004−4230a Methane CH4 0.001−16968b Carbon dioxide CO2 0.001−34277b Nitrous oxide N2O 0.003−22664b Ammonia NH3 0.004−9881b a Unit g/Kg, mg/Kg, g, mg;b unit g/Kg, mg/Kg, g, mg, %, ppm. Value ranges are reported directly from the original studies and may include multiple units (e.g., g/kg, mg/kg, %, ppm). These data were not standardized, as the meta-analysis is based on relative changes rather than absolute values. The biochar and initial compost parameters were classified into 2–5 subgroups based on their respective property values (refer to Supplementary Tables S3 and S4). To ensure the robustness of these subgroup classifications, one-way analysis of variance (ANOVA), and post-hoc least significant difference (LSD) tests using SPSS 26.0 (IBM, USA) were employed[25,28,32].
Meta-analysis
-
A meta-analysis is designed to estimate the effect of an experimental intervention on a specific outcome while considering variability across multiple factors[33]. Previous studies have extensively discussed the methodologies for conducting meta-analysis[34−36]. To quantify the change resulting from an experimental intervention, the natural logarithm of the response ratio (LnRR) is utilized, which compares measurements between the experimental and control groups. This transformation ensures that the data conforms to a normal distribution, thereby allowing for a more accurate evaluation of effect size, and facilitating the determination of whether a statistically significant difference exists between the groups[37]. The equation is as follows:
$ LnRR=ln\left(\dfrac{{X}_{t}}{{X}_{c}}\right)=ln\left({X}_{t}\right)-\mathrm{ln}\left({X}_{c}\right) $ (1) where, Xt and Xc denote the means of treatment (with biochar) and control (without biochar) groups, respectively. The variance (ʋ) was estimated as follows:
$ \nu =\dfrac{{s}_{t}^{2}}{{n}_{t}{x}_{t}^{2}}+\dfrac{{s}_{c}^{2}}{{n}_{c}{x}_{c}^{2}} $ (2) In this equation, nt and nc represent the sample size of the treatment and control groups, respectively; st and sc denote the standard deviations of the treatment and control groups[37]. A negative % change indicates a statistically significant decrease, while a positive % change indicates a statistically significant increase. The following equation can be utilized to calculate the percentage change in LnRR for forest maps:
$ \text{%}\, Ch\mathit{ange}=\left(\mathrm{e}^{\mathit{ln}RR}-1\right)\times100 $ (3) The Q statistic was utilized to assess the heterogeneity of LnRR among the studies. Total heterogeneity (Qt) encompasses within-group (Qw) and between-group (Qb) heterogeneity, accurately reflecting the extent of variation in lnRR across studies[38]. A Qb value surpassing the critical level (p-value < 0.05) indicates a significant difference among groups. The Meta Win 2.1 software was employed to calculate the LnRR and the corresponding 95% confidence intervals for each categorical group. Considering the heterogeneity across populations and the substantial variability observed within different studies, a random-effects model was adopted to estimate the mean LnRR, and 95% bootstrapped confidence intervals (CI) for each subgroup through 4,999 iterations[39].
In this study, it was determined that compost maturity indicators were significantly responsive to biochar amendment when the 95% CI values did not overlap with zero. It was further evaluated by the statistical significance of mean differences among various subgroups by examining the extent of overlap within their respective 95% confidence intervals. A lack of overlap indicated that the means were significantly different from each other. This approach provided a solid foundation for identifying noteworthy variables while adhering to rigorous standards[40]. Initially, an overall significance analysis was conducted, followed by a subgroup analysis that concentrated exclusively on properties exhibiting statistical significance at both the overall and subgroup levels.
Heterogeneity test and publication bias
-
To validate the reliability of the meta-analysis results, tests for heterogeneity and publication bias were conducted. Potential publication bias was evaluated to ensure the robustness of the meta-analysis through funnel plot asymmetry analysis, and Rosenthal's Fail-safe N method[41]. Kendall's Tau and Spearman Rank-Order correlations with significant values (p < 0.05) were interpreted as evidence of possible publication bias. The calculated Fail-safe N was then compared to the threshold of 5n + 1 (where n denotes the number of studies included). A Fail-safe N exceeding 5n + 1 led us to conclude that publication bias did not substantially influence the overall trend of the final analysis results[34].
Pearson correlation analysis
-
Pearson correlation analysis is a widely recognized statistical method for quantifying the linear relationship between two variables. The primary metric of this analysis, the Pearson correlation coefficient, provides insights into both the strength and direction of the linear association between variables[42]. In this study, Pearson correlation analysis was applied to: (1) evaluate the overall significance of biochar properties and initial compost parameters on compost maturity indicators; and (2) assess the significant relationships among various maturity indicators, thereby providing a groundwork for subsequent structural equation modeling. A correlation was deemed statistically significant when the p-value was < 0.05.
Structural equation models
-
Structural equation models (SEMs) are a robust approach for fitting data into models that depict and visually illustrate complex causal relationships among visual variables[43]. In this study, the SEMs were constructed using IBM SPSS AMOS 24.0 software (IBM, USA), utilizing the maximum likelihood estimation method to calculate the influence coefficients among variables. This analytical approach not only quantified the relationships between variables but also enables the ranking of key properties that affect compost maturity, as described in Supplementary File 1[44]. The process commenced with the identification of significant relationships among compost maturity indicators through Pearson correlation analysis, which served as the foundation for SEMs development. Subsequently, the total standardized effects, which include both direct and indirect influences, of all factors on various indicators, were calculated to evaluate their respective contributions. Finally, by leveraging these computed effects, the key properties impacting compost maturity were systematically ranked.
-
The results of the heterogeneity test are presented in Supplementary Table S5. The Chi-Square test yielded a p-value of less than 0.05, indicating statistically significant differences between the groups. The results indicated the presence of significant between-group heterogeneity, as the majority groups displayed QB values. Given the utilization of diverse data sources in this study, these outcomes were inevitable[25].
The impact of publication bias is detailed in Supplementary Table S6. The results revealed that biochar size exerted a biased influence on CO2, CH4, and N2O emissions during composting process, while biochar pH was found to affect only N2O emissions. Notably, no bias was evident in the analysis of other subgroups. While acknowledging the presence of bias in these subgroup analyses is important, it does not compromise the accuracy or robustness of the final analysis, suggesting analyses can be considered reliable.
The rationale for grouping of biochar properties, and initial compost parameters was assessed using the one-way analysis of variance (ANOVA), followed by the post-hoc least significant difference (LSD) test (Supplementary Fig. S3). The results revealed that both biochar properties, and initial compost significantly affected internal indicators, including the C/N ratio, GI, NH4+−N, NO3−−N, as well as on external indicators such as N2O, NH3, CO2, and CH4 (p > 0.05). This method effectively validated the classification of subgroups and ensured the reliability of subsequent forest map analysis.
Overall significance analysis of biochar properties, and initial compost parameters on the compost maturity indicators
-
The overall significance analysis of nine selected biochar properties, and five initial compost parameters, in relation to maturity indicators, including four internal and four external indicators, was assessed using Pearson correlation analysis (Supplementary Fig. S4). The results demonstrated that the nine biochar properties had a significant impact on the maturity indicators. However, it is noteworthy that the EC of biochar and the BAT of the initial compost parameters exhibited a relatively weak influence on only a few maturity indicators.
While this overall significance analysis provides insights into the general effects of a specific property on the maturity indicators, it is crucial to integrate these findings with the forest map results from meta-analysis to comprehensively assess the significant effects of both biochar properties and initial compost parameters on maturity indicators.
Effect of biochar amendment on compost internal maturity indicators
-
The properties of biochar, including pH, C/N, specific surface area, feedstock type, pyrolysis temperature, and PV, are crucial factors that ultimately affect compost quality and maturity, while also reducing gas emissions[20,21,45]. Additionally, the initial factors of composting, such as initial pH and initial C/N, type of bulking agent, moisture content, and compost type, can significantly affect strains and enzyme activities, which ultimately impacts the quality of the final product[46−50].
Maturity indicator of the C/N ratio
-
The C/N ratio is a pivotal indicator for evaluating the maturity and stability of compost, with a reduction in this ratio signifying progression toward mature compost[51]. As shown at the bottom of each panel in the forest map (Fig. 1a), the addition of biochar significantly decreased the C/N ratio by 5.44% (i.e., increasing maturity). This reduction is likely the result of increased organic mineralization rates and the stability provided by biochar-modified compost, driven by microbial activity[52].
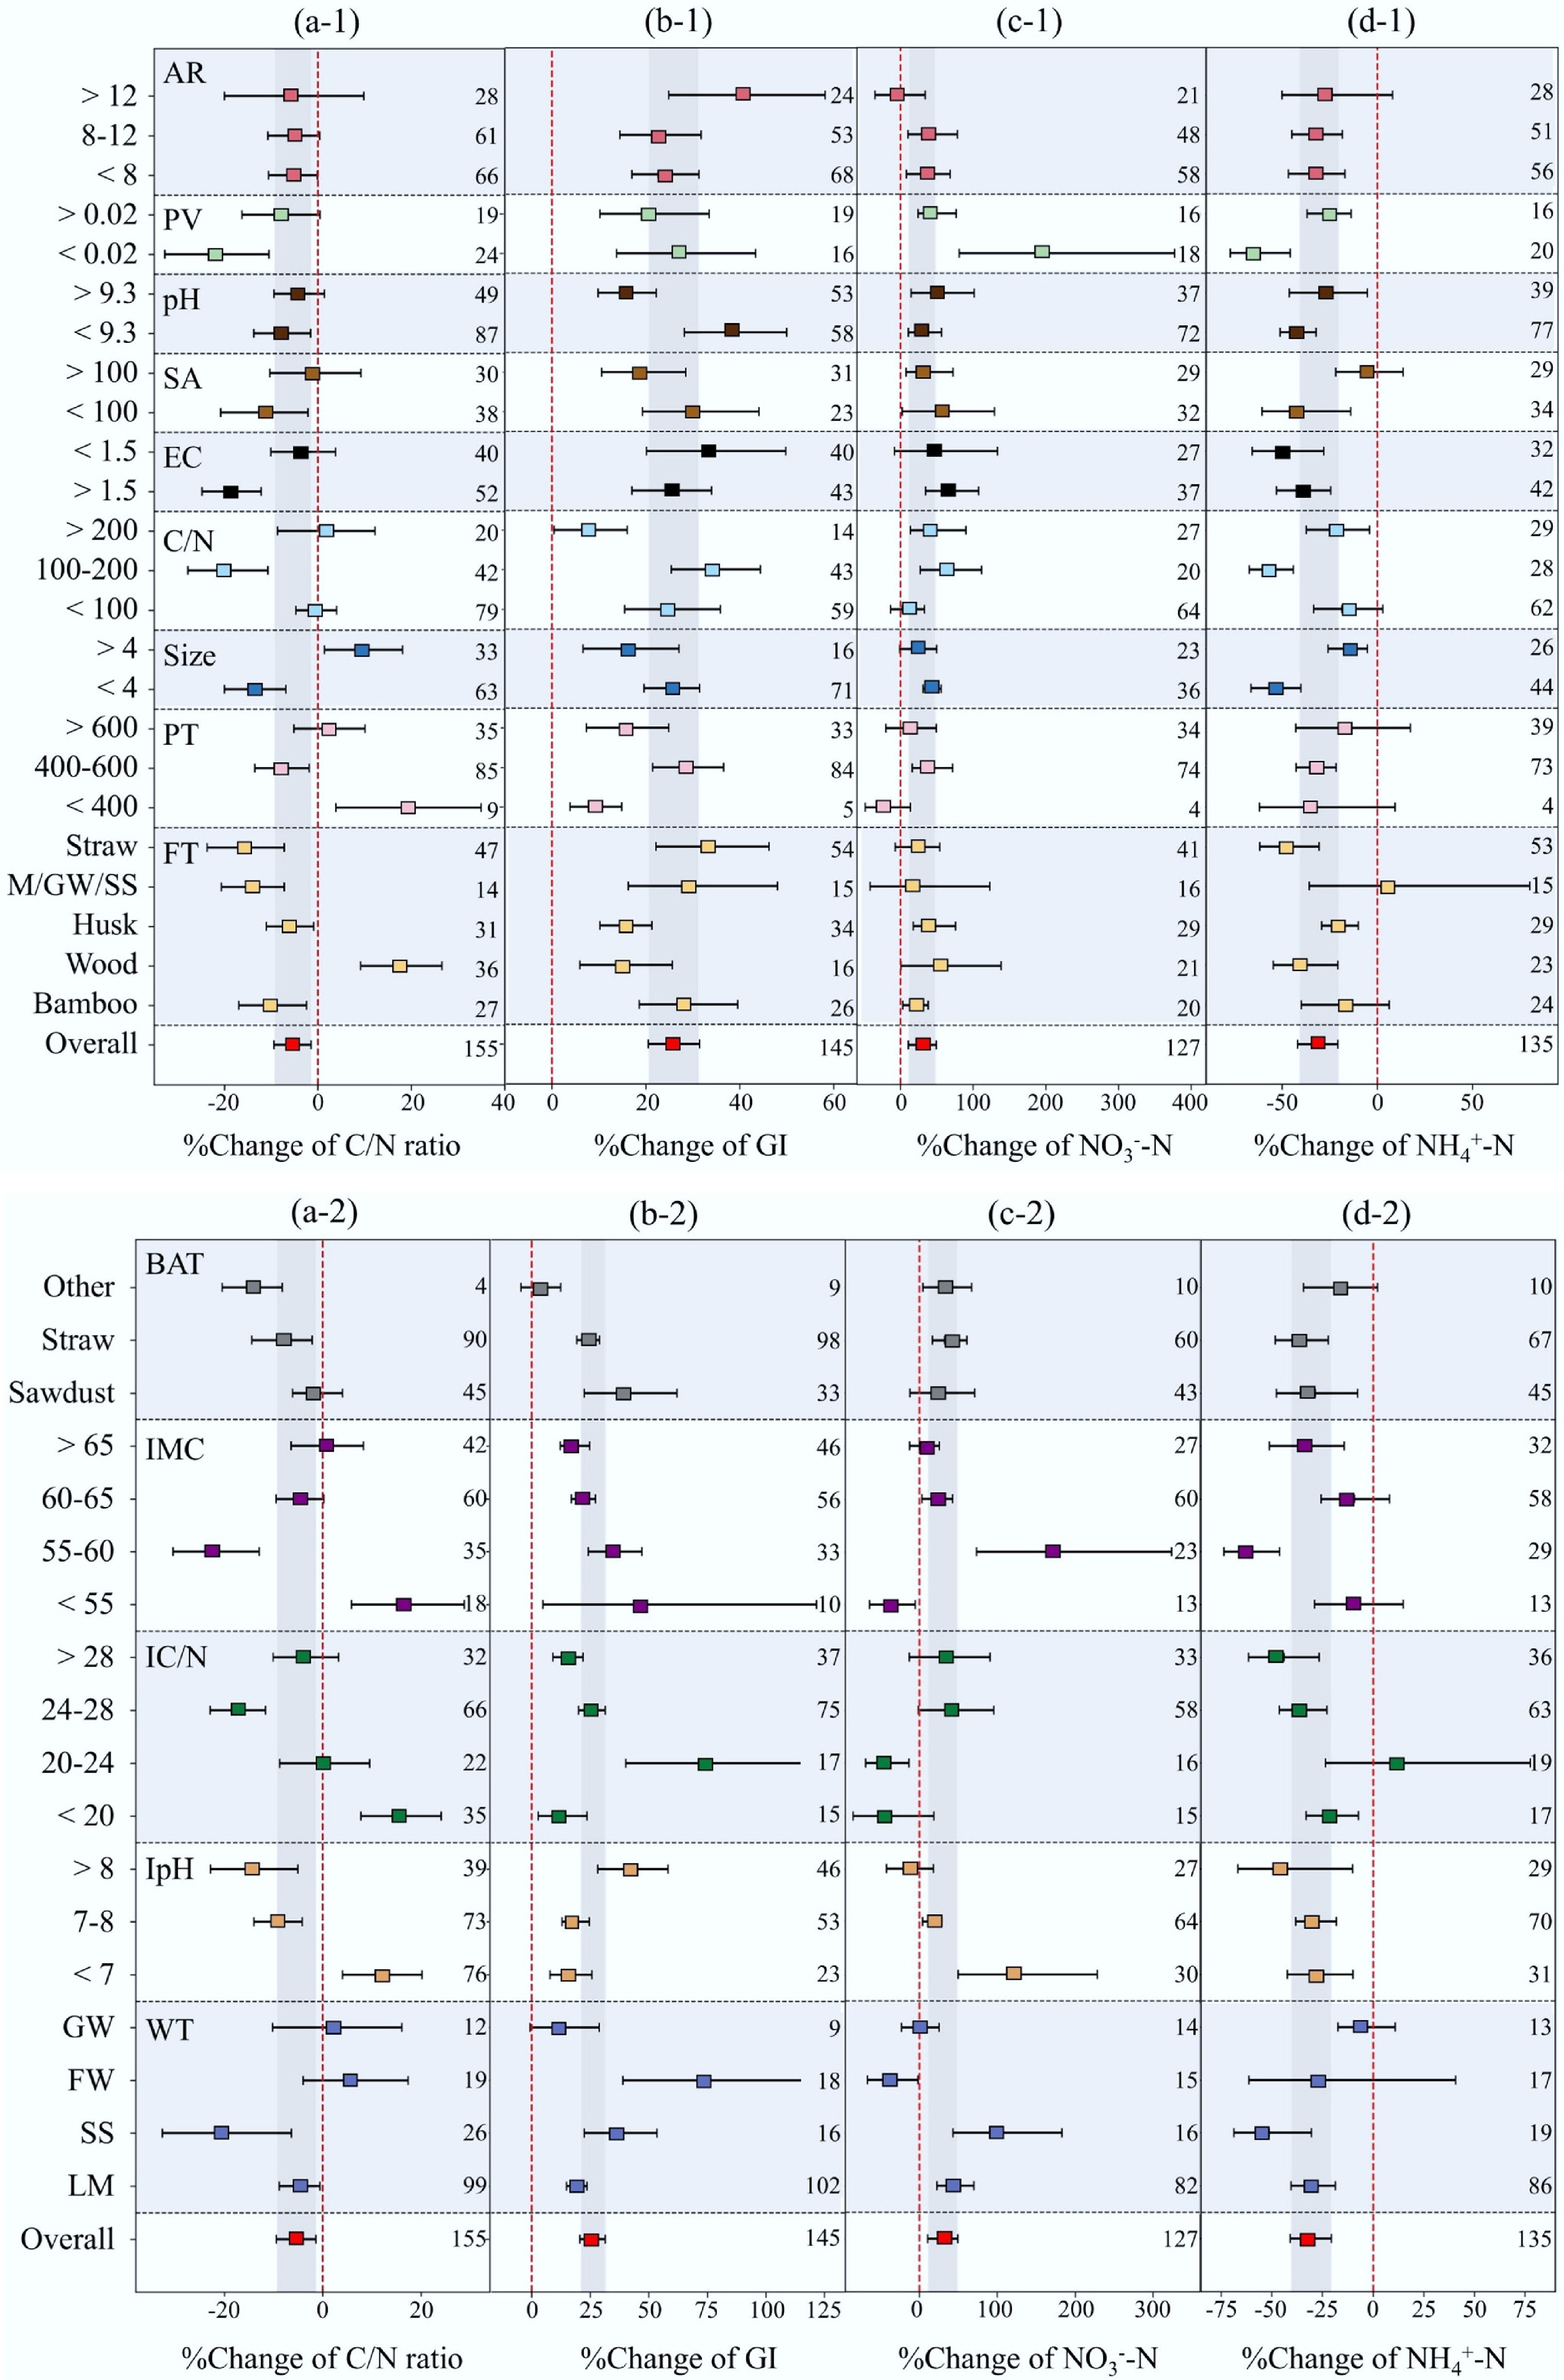
Figure 1.
Impact of (1) biochar and (2) initial compost parameters on the internal maturity indicators of compost. (a) C/N ratio; (b) GI; (c) NO3−−N; (d) NH4+−N. Note: the overall impact is shown at the bottom of each panel. The square represents the subgroup response value; the error bars represent the 95% confidence interval; and the vertical gray area represents the 95% confidence interval for the overall impact. The responses are displayed vertically according to the various categories of biochar properties. The numbers on the right side of the graph represent the amount of data observed for subgroups or overall dataset. (FT, feedstock type; PT, pyrolysis temperature; C/N, carbon to nitrogen; EC, electrical conductivity; SA, surface area; PV, pore volume; AR, amendment rate; WT, waste type; IpH, initial pH; IC/N, initial carbon to nitrogen; IMC, initial moisture content; BAT, bulking agent type).
The overall significance analysis revealed that biochar properties, including FT (p < 0.001), PT (p < 0.05), Size (p < 0.001), C/N (p < 0.001), EC (p < 0.05), and PV (p < 0.05), could significantly affect the final C/N ratio of compost (Supplementary Fig. S4). Notably, PV (< 0.02) contributed to a substantial reduction of 21.87% in the final composting C/N ratio, highlighting the strong impact of microstructure on carbon and nitrogen dynamics during composting[53]. Similarly, C/N (100–200) resulted in a 19.76% reduction in the composting C/N ratio, suggesting that the chemical composition of biochar plays a crucial role in regulating organic matter degradation and nitrogen retention. This incorporation of high-carbon biochar as an exogenous source of carbon and nitrogen positively influences both water removal and the degradation of total organic carbon[54].
Conversely, PT (< 400), Size (> 4), and FT (Wood) led to significant increases in the C/N ratio, quantified as 23.50%, 9.44%, and 17.73%, respectively. These increases can be attributed to the lower pyrolysis temperature of biochar, which facilitates the retention of higher proportions of organic carbon, thereby enhancing its incorporation into the composting system[55]. Additionally, biochar derived from wood inherently possesses a high C/N ratio, which may result in a minimal or even opposite effect on the overall C/N ratio of the compost[56]. Furthermore, larger-sized biochar tends to exhibit greater physical inertness and a weaker adsorption capacity, ultimately leading to an increased final C/N ratio[25].
The response of the C/N ratio in the compost product to biochar addition was also significantly influenced by initial compost parameters, including IpH (p < 0.05), IC/N (p < 0.001), IMC (p < 0.001) (Supplementary Fig. S4). As shown in Fig. 1a-2, IC/N (24–28) and IMC (55–60) resulted in significant reductions in the C/N ratio by 17.22% and 22.12%, respectively. This indicated that a high initial C/N ratio and moderate moisture content had a positive response to the addition of biochar to the final compost[50]. In contrast, IMC (< 55), IC/N (< 20), and IpH (< 7) led to increases in the C/N ratio by 16.28%, 15.60%, and 12.00%, respectively. This observation can be primarily attributable to two factors. Firstly, a lower initial C/N predisposes the compost to enhanced total nitrogen losses. Secondly, environmental conditions characterized by low moisture content and excessive acidity impair microbial activity, thereby diminishing the rate of organic matter degradation[57]. Consequently, the degradation rate of total organic carbon may lag behind that of total nitrogen, resulting in an elevated C/N ratio[54].
In summary, when utilizing the C/N ratio as the maturity indicator to evaluate the impact of biochar amendment on compost maturity, the specific biochar properties, such as a C/N (100−200) and PV (< 0.02), along with initial compost parameters including IC/N (24−28), and IMC (55−60), are strongly recommended for decreasing the C/N ratio to achieve a more mature compost.
Maturity indicator of GI
-
The germination index (GI) is highly sensitive and commonly used for evaluating compost maturity and phytotoxicity[58,59]. As depicted in Fig. 1b, the incorporation of biochar into compost resulted in a significant enhancement of the GI, with an increase of 25.57%. An overall significance analysis (Supplementary Fig. S4) revealed that various biochar properties, such as PT (p < 0.05), and C/N (p < 0.01), had a significant impact on the compost GI. Although the enhancements under conditions of C/N > 200 and PT < 400 °C were relatively moderate (8.33% and 9.24%, respectively), they were statistically significant and thus warrant further discussion. Notably, the effect of increasing pyrolysis temperature on GI exhibited a rise followed by a decline. This phenomenon may be attributed to higher concentrations of PAH at both low and high temperatures, which can suppress GI values. This trend is consistent with previous research on total soil PAHs (Ctot). Specifically, biochar produced at 300−500 °C demonstrated a significant reduction in the carbon content of PAHs by 16.1% in comparison to biochar produced at temperatures exceeding 500 °C, whereas biochar generated below 300 °C demonstrated limited effectiveness[60]. In addition, a higher C/N ratio is also associated with reduced PAH content, contributing to the improvement of GI when paired with appropriate pyrolysis conditions[61,62].
Meanwhile, five initial compost parameters, such as WT (p < 0.001), and IC/N (p < 0.001), exhibited significant influence on the response of compost GI to biochar amendment (Supplementary Fig. S4). It was noteworthy that both WT (FW) and IC/N (20−24) positively impacted the GI value of mature compost, resulting in increases of 73.45% and 73.95%, respectively (Fig. 1b-2). This improvement related to WT (FW) may be attributed to the lower presence of toxic substances and the higher content of nutrients in food waste[63]. Similarly, an initial C/N ratio of 20–24 helps maintain temperatures necessary for pathogen removal, thereby reducing nitrogen loss and improving compost GI[64].
When using GI as the maturity indicator to evaluate the impact of biochar amendment on compost maturity, the recommended properties were the initial compost parameters WT (FW) and IC/N (20−24), and biochar properties C/N (100−200), and PV (< 0.02).
Maturity indicator of NO3-−N
-
Nitrogen transformation plays a critical role in evaluating compost maturity, with NO3−−N serving as a vital indicator in this assessment[65]. In the present study, the amendment of biochar led to a significant increase in NO3−−N (+32.54%) in the compost (Fig. 1c). Overall significance analysis (Supplementary Fig. S4) revealed that biochar properties such as PV (p < 0.001) and initial compost including parameters IMC (p < 0.001), IpH (p < 0.001), and IC/N (p < 0.001) could significantly affect NO3−−N. Specifically, biochar PV (< 0.02) was found to enhance NO3−−N content by an extraordinary 193.58% (Fig. 1c-1). Moreover, IMC (55−60) and IpH (< 7) corresponded with increases in NO3−−N content of 172.16% and 120.85%, respectively. This enhancement can be primarily attributed to the reduction of ammonium accumulation under slightly acidic and optimal moisture conditions, which together favor aerobic nitrification. Adequate moisture is essential for facilitating microbial activity while avoiding anaerobiosis, and a slightly acidic pH further promotes the conversion of NH4+ to NO3−[66,67]. Conversely, IC/N (20-24), WT (FW), and IMC (< 55) exhibited significant reductions in NO3−−N levels, with decreases of 46.54%, 40.85%, and 39.07%, respectively (Fig. 1c-2).
Based on the assessment of compost maturity on NO3−−N, we recommend considering biochar property of PV (< 0.02) and initial compost parameters IpH (< 7) and IMC (55−60). However, the use of WT (FW), IC/N (20−24), and IMC (< 55) is not recommended.
Maturity indicator of NH4+−N
-
NH4+−N is another crucial indicator of compost maturity reflecting nitrogen transformation[2]. Under aerobic conditions, the nitrification process converts highly reduced NH4+ into NO3−[68]. A decrease in NH4+−N concentrations throughout composting indicated an increase in stability and maturity[69]. The amendment of biochar resulted in a substantial reduction in NH4+−N (−34.96%) (Fig. 1d). This outcome may be attributed to biochar's capacity to enhance the pore structure and aeration of the compost matrix, thereby promoting the growth and reproduction of nitrifying microorganisms while inhibiting denitrifying microbial activity[70]. The overall significance analysis (Supplementary Fig. S4) showed that PV (p < 0.001), C/N (p < 0.05), and IMC (p < 0.05) exerted significant influences on the NH4+−N content of compost. Subsequent analysis revealed (Fig. 1d-1) that biochar with PV (< 0.02), and C/N (100–200) resulted in significant reductions of NH4+−N content of compost by 65.31% and 57.14%, respectively. The IMC (55–60) (Fig. 1d-2) exerted a more pronounced influence on NH4+−N dynamics during composting, leading to a reduction of 61.99%. This may be attributed to biochar with a moderate C/N ratio, which, when applied under optimal initial composting conditions, creates mildly aerobic microenvironments due to its relatively low porosity. Such conditions may favor microbial utilization of available NH4+−N as an energy source.
When evaluating compost maturity utilizing NH4+−N as an indicator, the recommended biochar properties include C/N (100−200), PV (< 0.02), and initial compost parameters with an IMC (55−60).
Effect of biochar amendment on compost external maturity indicators
-
The incorporation of biochar, alterations in temperature or pH levels, and the enhancement of local anaerobic-aerobic zones within compost piles can influence the volatilization, nitrification, and denitrification processes associated with compost gas emissions[2]. These factors contribute to variations in the release of greenhouse gases (including CO2, CH4, and N2O), and NH3 from composting systems.
Maturity indicator of CO2
-
Organic carbon in compost is a critical energy and carbon source for microorganisms, facilitating their conversion into CO2 under aerobic conditions[71]. Previous studies have reported inconsistent effects of biochar on CO2 emissions during the composting process. For instance, one study demonstrated that the amendment of biochar to pig manure compost resulted in a 26.1% reduction in CO2 emissions, while another study reported an increase of 53.2%[72,73]. However, the present findings, derived from the forest map, indicate that the inclusion of biochar did not significantly impact compost CO2 emissions (Fig. 2a), which aligns with previous research that has documented conflicting results regarding the influence of biochar additives on CO2 emissions[72,73]. These inconsistencies may be attributed to the dual role of biochar in carbon mineralization. On one hand, improved aeration and microbial colonization can enhance respiration, leading to increased CO2 emissions during the initial stage of composing. On the other hand, biochar facilitates humification and the formation of stable organic matter complexes, which helps reduce overall CO2 emissions[74].
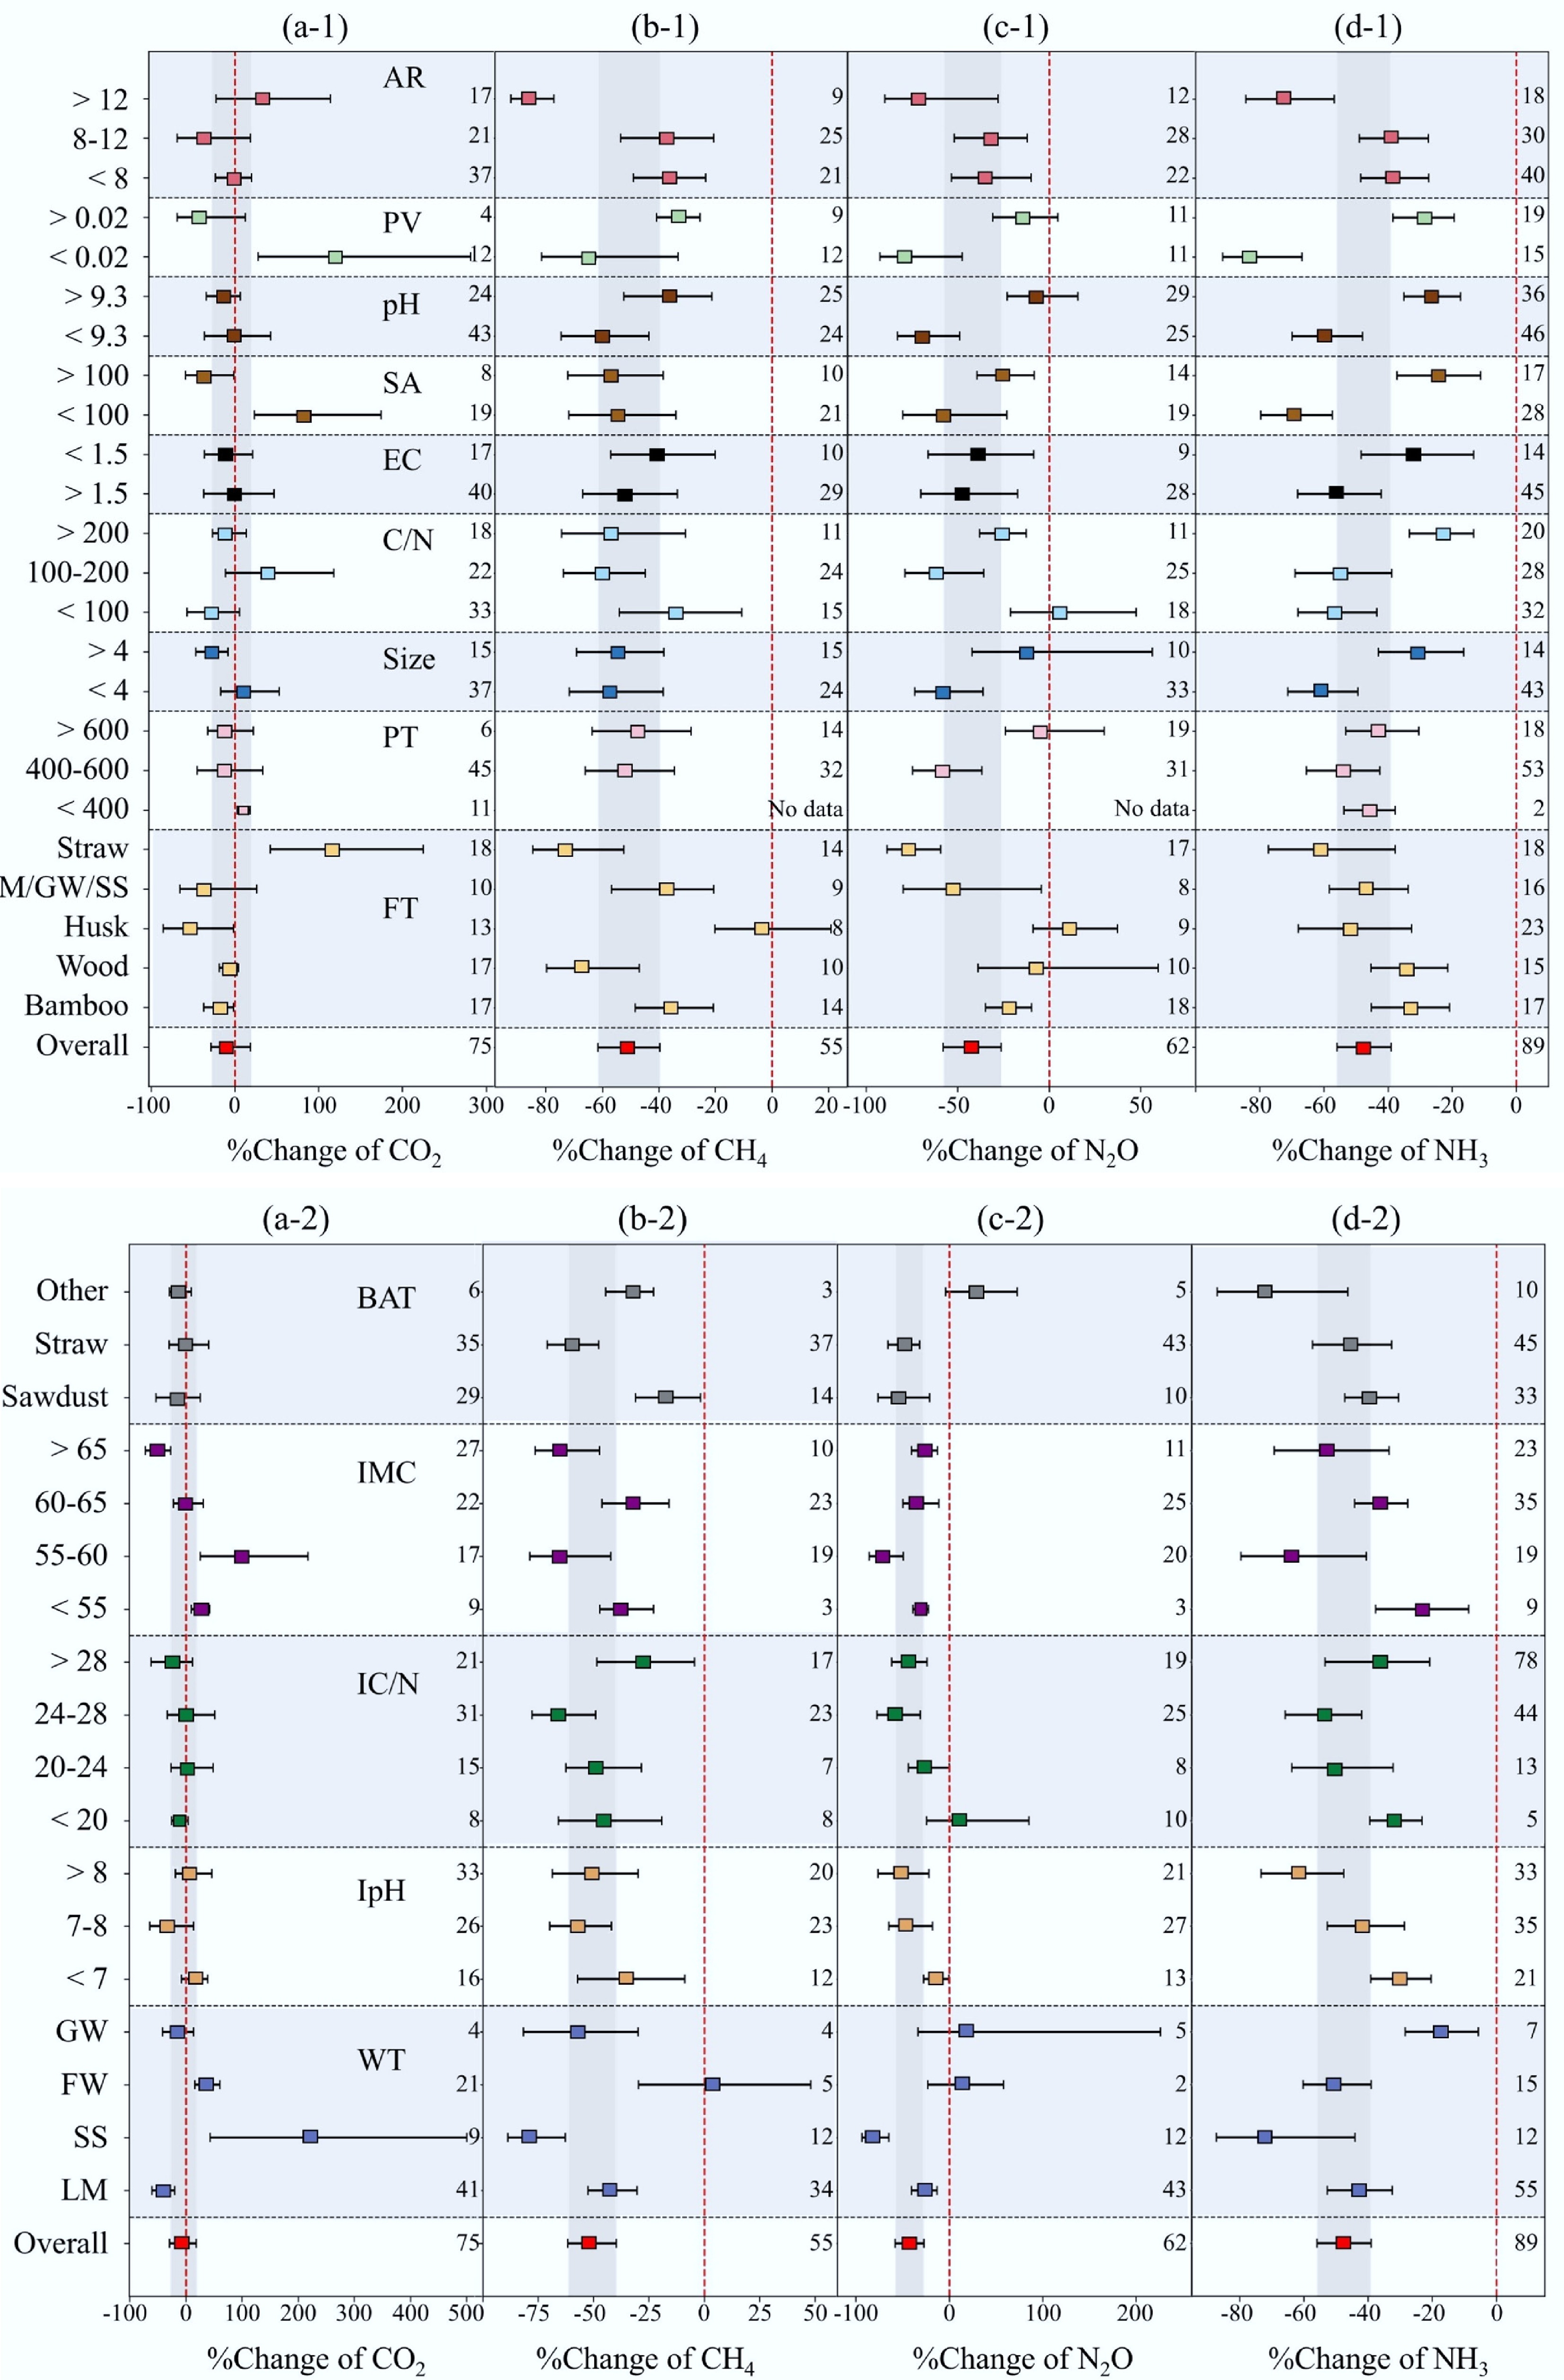
Figure 2.
Impact of (1) biochar, and (2) initial compost parameters on the external maturity indicators of compost. (a) CO2; (b) CH4; (c) N2O; (d) NH3. Note: the overall impact is shown at the bottom of each panel. The square represents the subgroup response value; the error bars represent the 95% confidence interval; and the vertical gray area represents the 95% confidence interval for the overall impact. The responses are displayed vertically according to the various categories of biochar properties. The numbers on the right side of the graph represent the amount of data observed for subgroups or overall dataset. (FT, feedstock type; PT, pyrolysis temperature; C/N, carbon to nitrogen; EC, electrical conductivity; SA, surface area; PV, pore volume; AR, amendment rate; WT, waste type; IpH, initial pH; IC/N, initial carbon to nitrogen; IMC, initial moisture content; BAT, bulking agent type).
Maturity indicator of CH4
-
The emission of CH4 during the composting process is regulated by both its production via methanogenic bacteria and its consumption through methane-oxidizing bacteria[3]. The incorporation of biochar resulted in a significant reduction (–51.31%) in CH4 emissions during composting (Fig. 2b). The reduction can be attributed to several aspects, including the modification of the redox potential of biochar, enhanced permeability, inhibited activity of methanogenic bacteria, and promoted methane oxidation, all of which contribute to lower in CH4 emissions[75]. In particular, biochar improves porosity and oxygen diffusion, which suppresses anaerobic conditions that favor methanogenesis. It also stimulates the activity of methanotrophic microorganisms, facilitating the oxidation of CH4 into CO2 and further reducing net CH4 release[74]. The present overall significance analysis (Supplementary Fig. S4) reveals that the impact of AR (p < 0.001) of biochar and WT (p < 0.001) of initial compost have a statistically significant impact on CH4. Moreover, based on the forest map analysis, an amendment rate of biochar AR (> 12), and WT (SS) can significantly reduce compost CH4 emissions by 86.05% and 79.24%, respectively (Fig. 2b). These optimal amendment rates are consistent with previous findings[25]. Additionally, composting sludge contains more stable organic matter, inhibitory compounds, and better aeration, all of which help further reduce CH4 emissions[76].
Maturity indicator of N2O
-
The emission of N2O is primarily associated with the process of nitrification and denitrification in composting[77]. The amendment of biochar resulted in a significant reduction in N2O emission of the compost, with a decrease of 43.49% (Fig. 2c). This phenomenon can be attributed to three potential factors. First, the presence of biochar decreased the availability of inorganic nitrogen for nitrifying and denitrifying bacteria by capturing NH4+ and NO3−, which led to the reduced emissions of N2O[78]. Moreover, biochar enhances oxygen availability, promoting complete nitrification and limiting denitrification intermediates responsible for N2O production[74]. Second, the surface of biochar has the capacity to adsorb N2O and facilitate its conversion back to N2 through biological or non-biological reactions[79]. During the composting process, the amendment of biochar decreased the abundance of nirS and nirK genes, which encode enzymes responsible for N2O production, while simultaneously increasing the abundance of AOB-amoA and nosZ genes that are associated with ammonia oxidation and N2O reduction, respectively[80]. Collectively, these microbial shifts contribute to the mitigation of N2O emissions during composting.
Overall significance analysis indicated that both the type of biochar FT (p < 0.01), and the initial WT (p < 0.001) of the compost exert a significant influence on N2O emission (Supplementary Fig. S4). Specifically, FT (Straw), and WT (SS) demonstrated substantial reductions in N2O emissions of 76.50% and 84.66%, respectively (Fig. 2c). These findings indicate that the incorporation of straw-based biochar into sludge-based compost is an effective strategy for mitigating N2O emissions, consistent with previous research[25].
Maturity indicator of NH3
-
The volatilization of ammonia is a major pathway for nitrogen loss during composting, with NH3 being the primary nitrogen compound released in this process. Under anaerobic conditions, NH3 contributes to 47%−54% of the total nitrogen loss[81]. The results of this study demonstrate that the amendment of biochar significantly reduced NH3 emissions by 47.59% (Fig. 2d). This reduction can be attributed to the adsorption of NH3 and NH4+ facilitated by the acidic functional groups on the surface of biochar, in addition to the enhancement of the composting environment and stimulation of nitrifying bacteria activity[16]. These factors facilitate the conversion of ammonia into nitrate, effectively enhancing nitrogen retention within the compost matrix[82]. Furthermore, the high cation exchange capacity of biochar aids in ammonium retention, thereby reducing NH3 volatilization[74].
Overall significance analysis revealed that various properties of biochar, including C/N (p < 0.001), SA (p < 0.001), pH (p < 0.001), PV (p < 0.001), and AR (p < 0.001), have a significant impact on NH3 emissions during composting (Supplementary Fig. S4). It was noteworthy that AR (> 12), SA (< 100), and PV (< 0.02) resulted in substantial reductions in ammonia emissions, quantified at 72.60%, 69.19%, and 82.88%, respectively (Fig. 2d-1). This substantial effect may stem from the addition of high-dose biochar with a relatively low specific surface area and pore volume, which enhances moisture retention. In a more humid environment, NH3 is more likely to dissolve into NH4+ rather than volatilize into the atmosphere.
Additionally, the results indicated that biochar with PV (> 0.02), pH (> 9.3), SA (> 100), and C/N (> 200) also led to significant reduction in NH3 emissions from compost, with respective reduction rates of 28.83%, 26.27%, 24.50%, and 23.72%. However, these reductions did not reach the overall effect level, highlighting the greater efficacy of AR (> 12), SA (< 100), and PV (< 0.02) in mitigating NH3 emissions.
Moreover, the initial parameters of the compost, including WT (p < 0.001), IpH (p < 0.001), IC/N (p < 0.01), and IMC (p < 0.001) exhibited significantly influence on NH3 emissions (Supplementary Fig. S4). Specifically, conditions such as IMC (< 55), IC/N (< 20), IpH (< 7), and WT (GW) effectively reduced NH3 levels in the compost, albeit with a mean reduction effect below −23.58%, −32.25%, −30.15%, and −17.70%, respectively (Fig. 2d-2). In conclusion, the biochar properties of SA (< 100), pH (> 9.3), AR (> 12), and PV (< 0.02) are recommended for the assessment of compost maturity when utilizing NH3.
The forest map analysis (Fig. 3) revealed that specific biochar properties, including FT (Straw), PT (> 400), C/N (100−200), PV (< 0.02), SA (< 100), and AR (> 12), had a notable positive influence, thus identified as recommended indicators for enhancing compost maturity. Regarding initial compost parameters, ICN (24−28), WT (SS), and IMC (55−60) were associated with improved compost maturity.
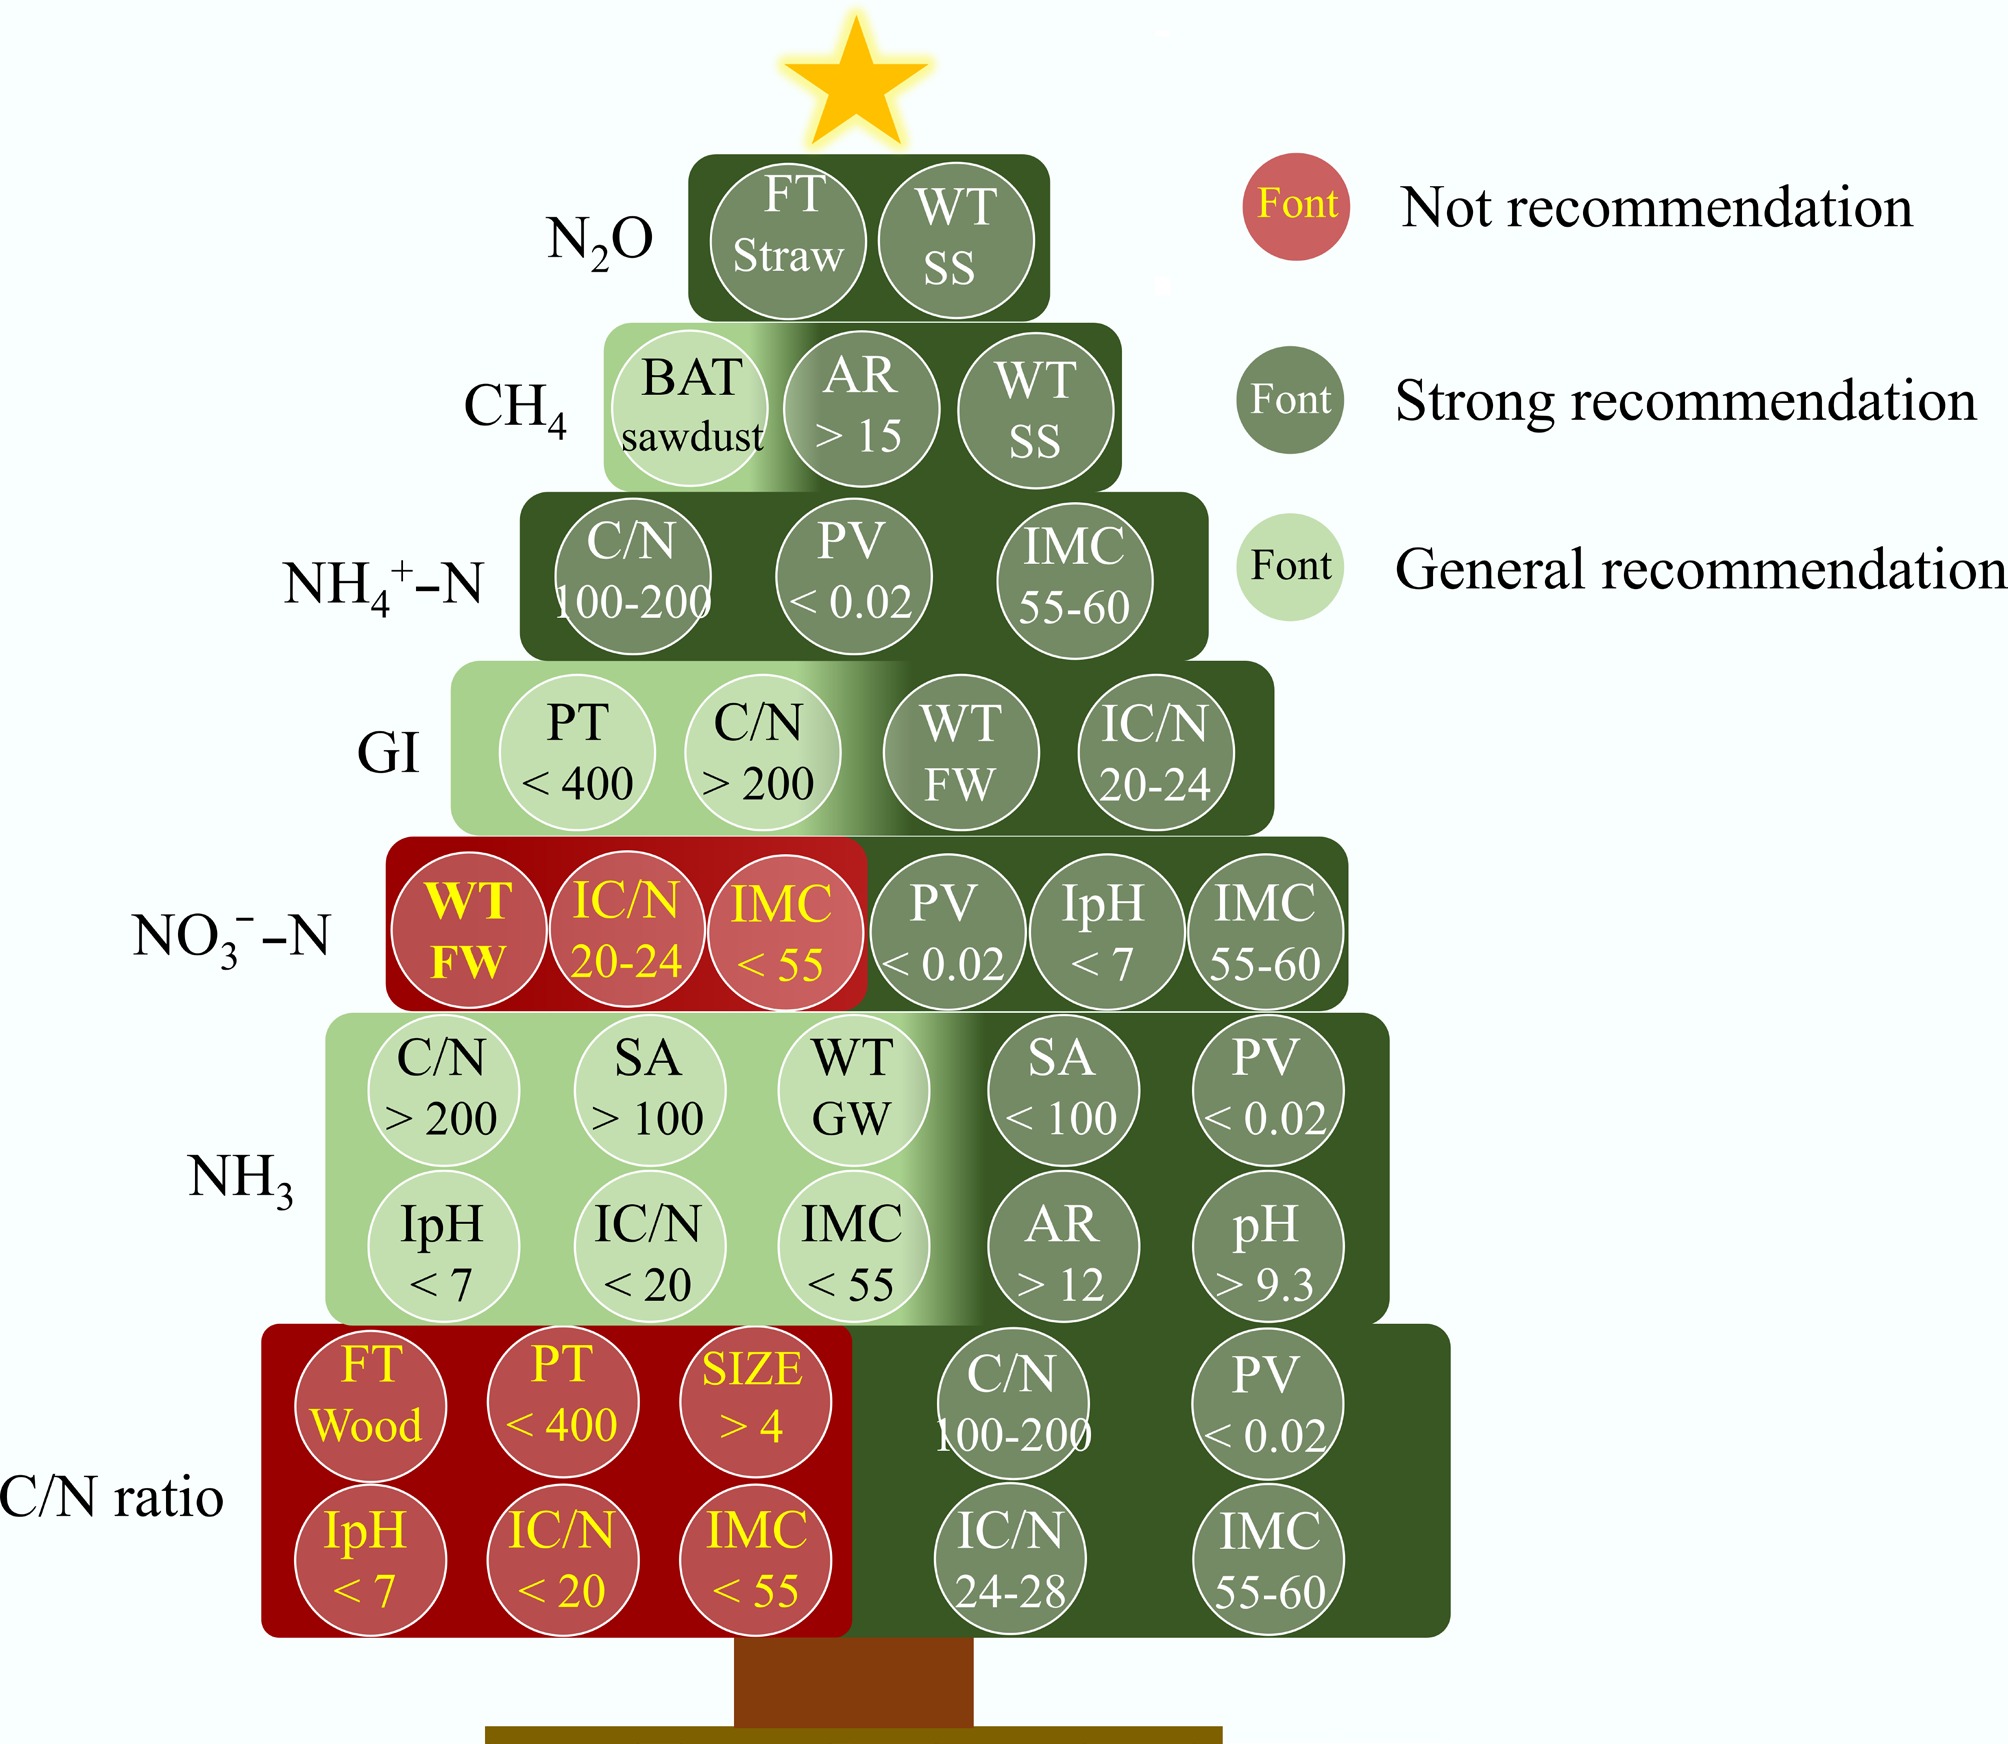
Figure 3.
Recommended properties of biochar and initial compost by considering the impact of seven compost maturity indicators based on forest map analysis. Note: CO2 is not included in this figure because it did not show statistical significance in the meta-analysis forest plots. FT, feedstock type; PT, pyrolysis temperature; C/N, carbon to nitrogen ratio; EC, electrical conductivity; SA, surface area; PV, pore volume; AR, amendment rate; WT, waste type; IpH, initial pH; IC/N, initial carbon to nitrogen ratio; IMC, initial moisture content; BAT, bulking agent type.
The importance ranking of key properties affecting the compost maturity based on SEMs
-
By conducting Pearson correlation analysis, significance analyses was obtained (Supplementary Fig. S5) to assess the relationships among indicators of compost maturity. The C/N ratio exhibited a significant correlation with GI, NH4+−N, CO2, CH4, N2O, and NH3. Simultaneously, GI demonstrated a highly significant positive association with NO3−−N and CO2, CH4, N2O, and NH3. Notably, NH4+−N displayed substantial correlation with NO3−−N, CO2, CH4, and N2O emissions throughout the composting process. A significant correlation was also identified among the four external maturity indicators. The statistically significant linear correlations between GI and C/N; NH4+−N and NO3−−N; CO2 and CH4; as well as N2O and NH3 suggest that the potential utilization of significance analysis outcomes among indicators as a foundation for combining indicators in constructing SEMs.
Subsequently, SEMs were constructed to rank the above-identified key properties based on the significant relationships among compost maturity indicators (as shown in Fig. 4). The result indicated that the PV of biochar exerted a direct and significant positive influence on the C/N ratio (λ = 0.432, p < 0.001) (Fig. 4a), NH4+−N levels (λ = 0.926, p < 0.05) (Fig. 4b), and NH3 levels (λ = 0.420, p < 0.05) (Fig. 4d) in the compost. Conversely, it exerted notable negative effects on NO3−−N levels (λ = −0.935, p < 0.05) (Fig. 4b), CO2 emissions (λ = −0.935, p < 0.001) (Fig. 4c), and CH4 emissions (λ = −0.789, p < 0.001) (Fig. 4c). Other properties of biochar, namely PT and SA, exhibited a direct and significant impact on both the C/N ratio (λ = −0.264, p < 0.001) and NO3−−N (λ = 0.959, p < 0.001) levels in the compost. Moreover, SA indirectly influenced NH4+−N levels through its effect on PV levels (Fig. 4b). FT of biochar had a direct and statistically significant effect on the compost C/N ratio (λ = −0.264, p < 0.001) and N2O levels (λ = −0.288, p < 0.05). AR of biochar significantly negatively influenced CH4 (λ = −0.610, p < 0.001) and NH3 (λ = −0.326, p < 0.001), and also exerted indirect effect on CO2 emissions via CH4, as well as on N2O levels through NH3 (Fig. 4c and d). IMC showed a significant direct effect on NO3−−N (λ = −0.168, p < 0.05) (Fig. 4b). WT had a significant direct impact on NH4+−N (λ = −0.411, p < 0.05), NH3 (λ = −0.324, p < 0.05), CH4 (λ = 0.534, p < 0.05), and CO2 (λ = 0.844, p < 0.001). WT and also exerted indirect effects on NO3−−N and N2O levels through its influence on NH4+−N and NH3, respectively (Fig. 4b–d). The C/N ratio of biochar demonstrated a significant direct effect on NO3−−N (λ = 0.382, p < 0.01).
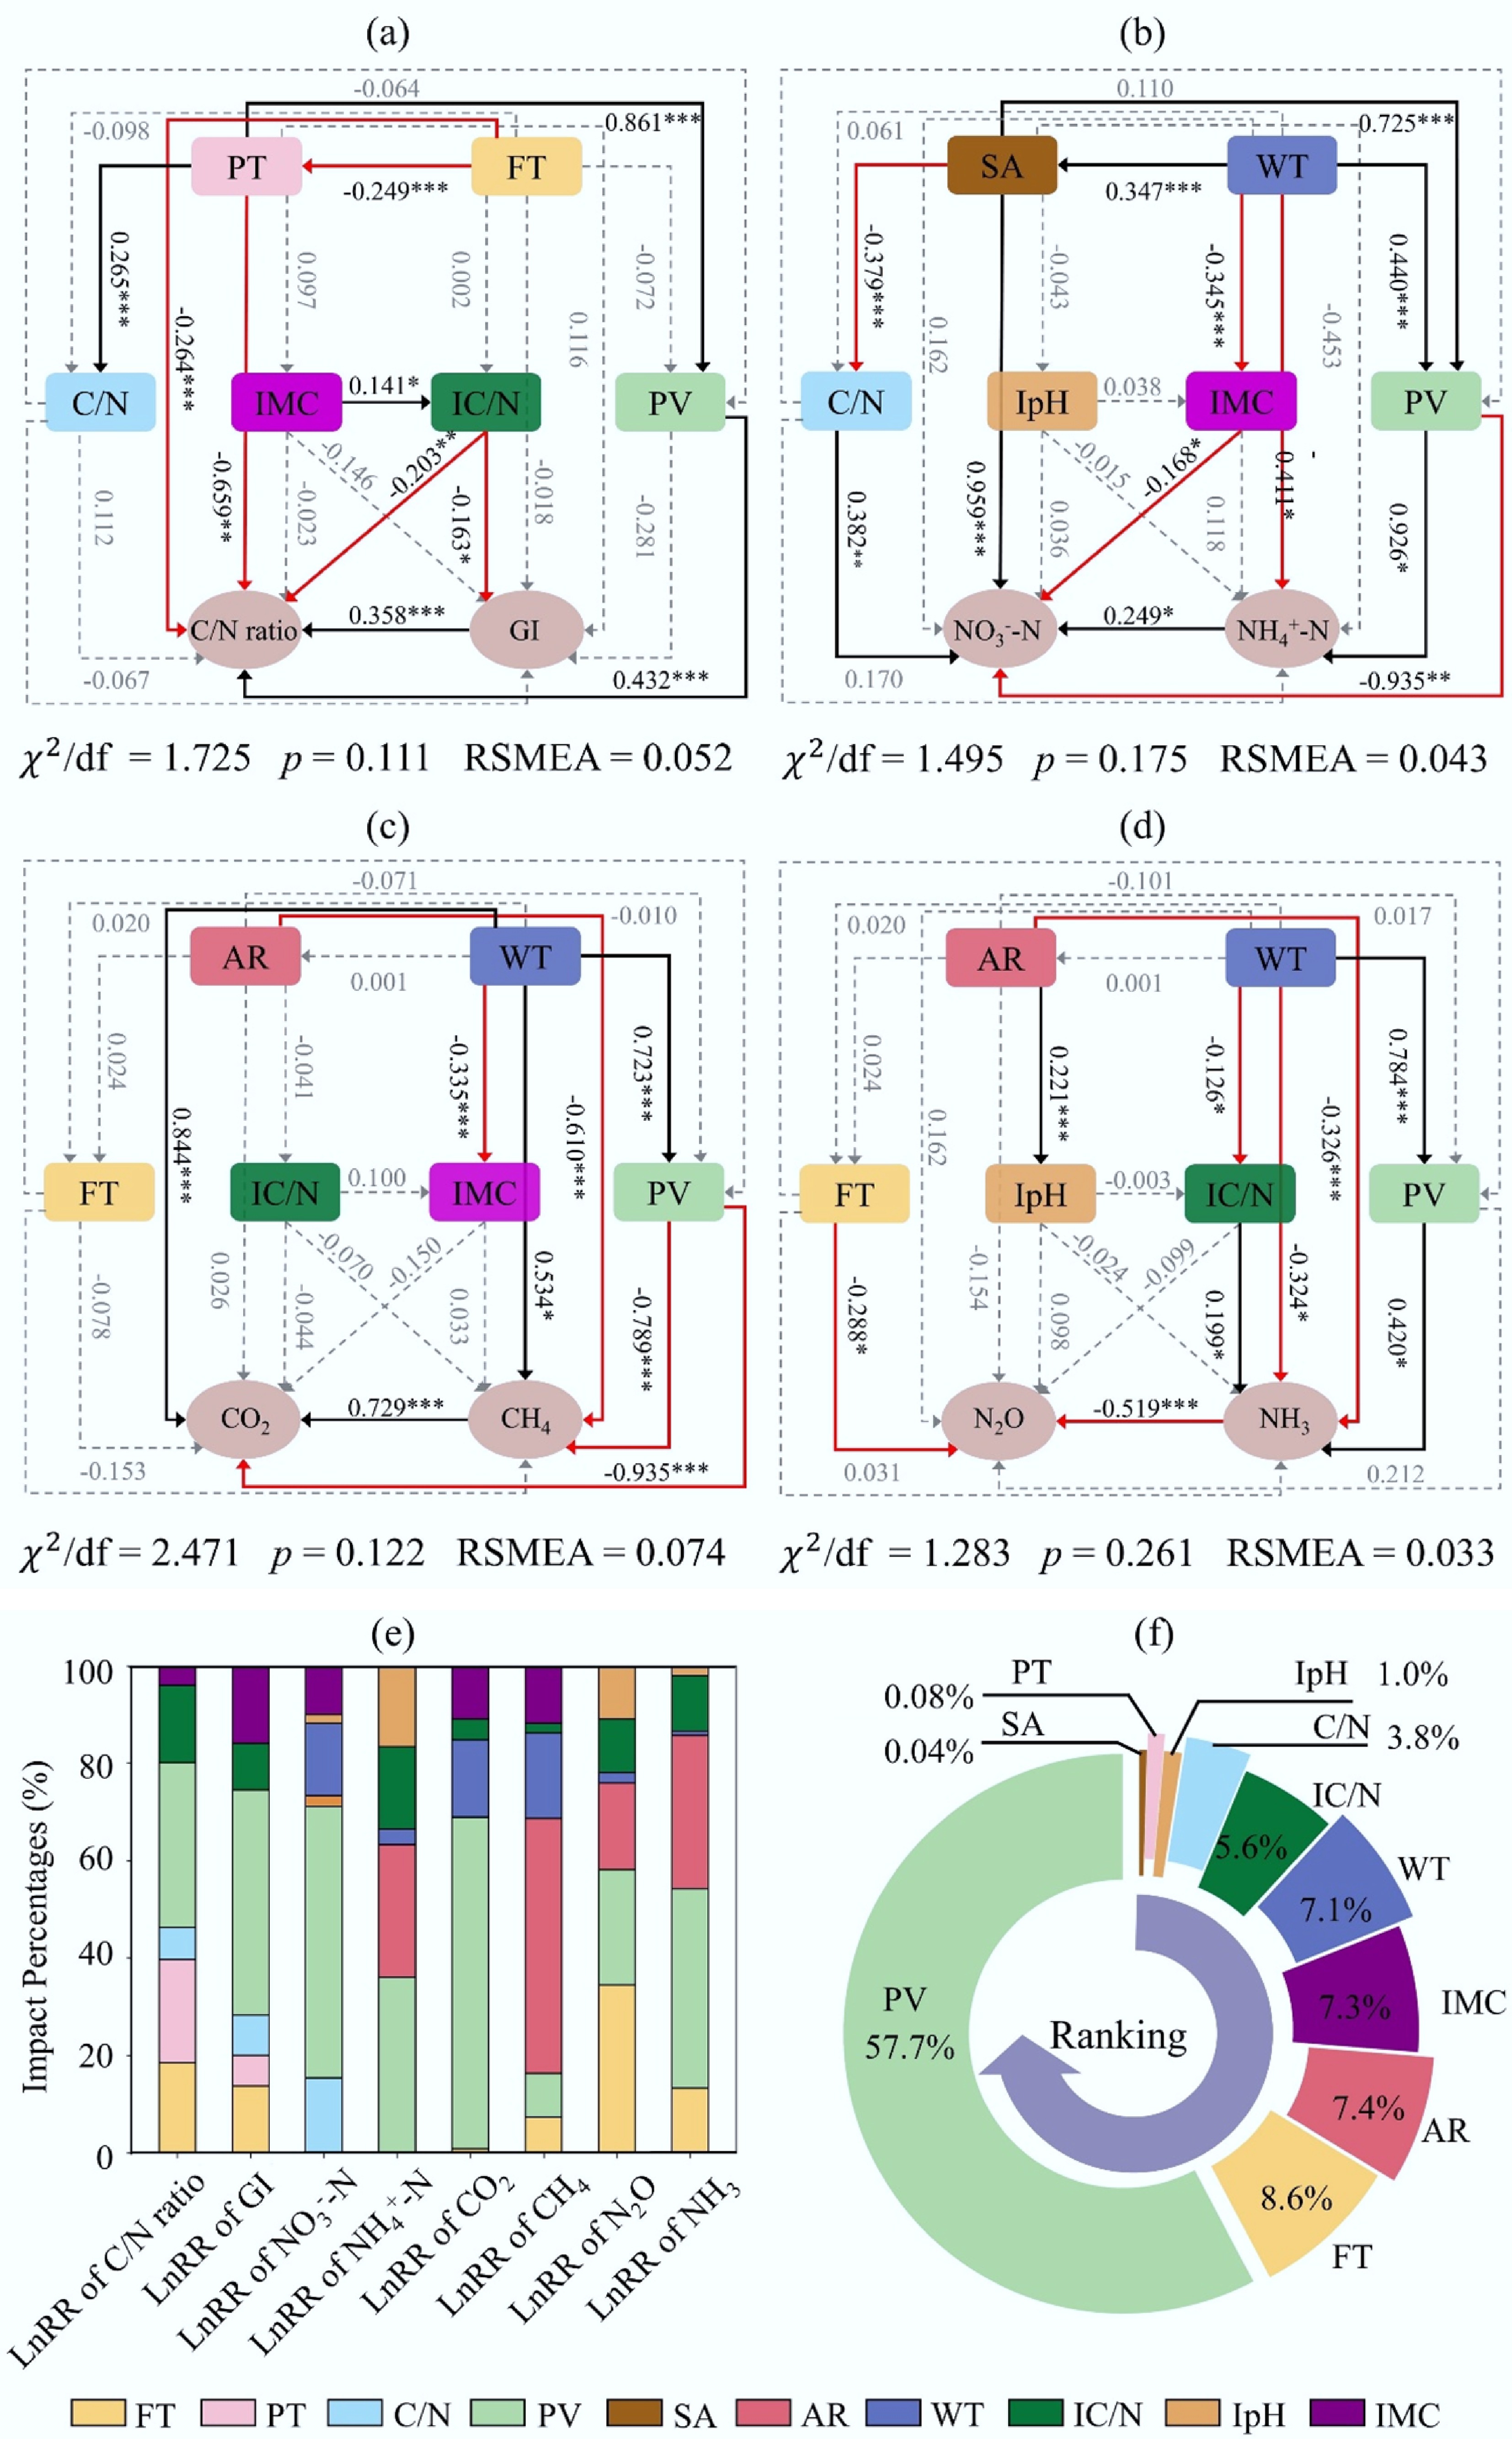
Figure 4.
Ranking of the key properties based on SEMs. (a)–(d) Establishment of SEMs integrating two maturity indicators. Note: the black and red solid arrows indicate significant positive and negative correlations, respectively; the dotted arrow indicates non-significant correlations; and the number next to the arrow is the normalized path coefficient (λ). Significance levels are: * p < 0.05, ** p < 0.01, *** p < 0.001. (e) Relative contribution of key impact properties to the eight individual indicators of compost maturity based on total standardized effects. (f) Ranking of key properties based on their percentage contributions to all eight compost maturity indicators, considering both direct and indirect effects.
Furthermore, the standardized total effects (the sum of the direct and indirect effects of standardization) of PV were calculated to determine the percentage of its influence on the maturity indicators (Fig. 4e). The results confirmed that the influence of various indicators of biochar PV was notably strong. To gauge the overall impact of PV on compost maturity indicators, the impact frequency was calculated (i.e., number of impact indicators/number of overall indicators) during modeling. Then, the impact percentage of PV was derived by multiplying the cumulative absolute standardized total effects on various maturity indicators by its frequency of occurrence across eight maturity indicators. Similarly, the impact percentages of other influencing properties on the maturity indicators were calculated and compared using the same method. Finally, the importance of the key properties was ranked (Fig. 4f). This ranking was established by evaluating the integrated impact of each key quality attribute on the eight maturity indicators, thereby quantifying the contribution of each property. The results revealed that the biochar property PV exerted the most significant influence on compost maturity, followed by FT, AR, and IMC, WT, IC/N, C/N, IpH, PT, and SA.
The results indicated that among the key properties of biochar (e.g., PV, FT, AR) are the principal factors influencing compost maturity. Their impact is more significant than that of initial compost parameters (e.g., IMC, WT, IC/N). The SEM results, combined with the comprehensive analysis from forest plots, clearly demonstrated that high biochar addition rates (> 12%) of porous straw−derived biochar significantly enhanced composting efficiency under optimal conditions (initial moisture content: 55%−60%; initial C/N: 24−28). This finding not only substantiates the crucial regulatory role of biochar addition in accelerating the composting process but also underscores its functional advantages and practical value within the composting system. The characteristic ranking system developed through SEMs clarify the key mechanisms by which biochar influences compost maturity and provides a solid theoretical foundation for optimizing biochar application strategies in practical compost production. This importance ranking can significantly enhance the efficiency of biochar utilization, consequently promoting the overall effectiveness and controllability of the composting process.
-
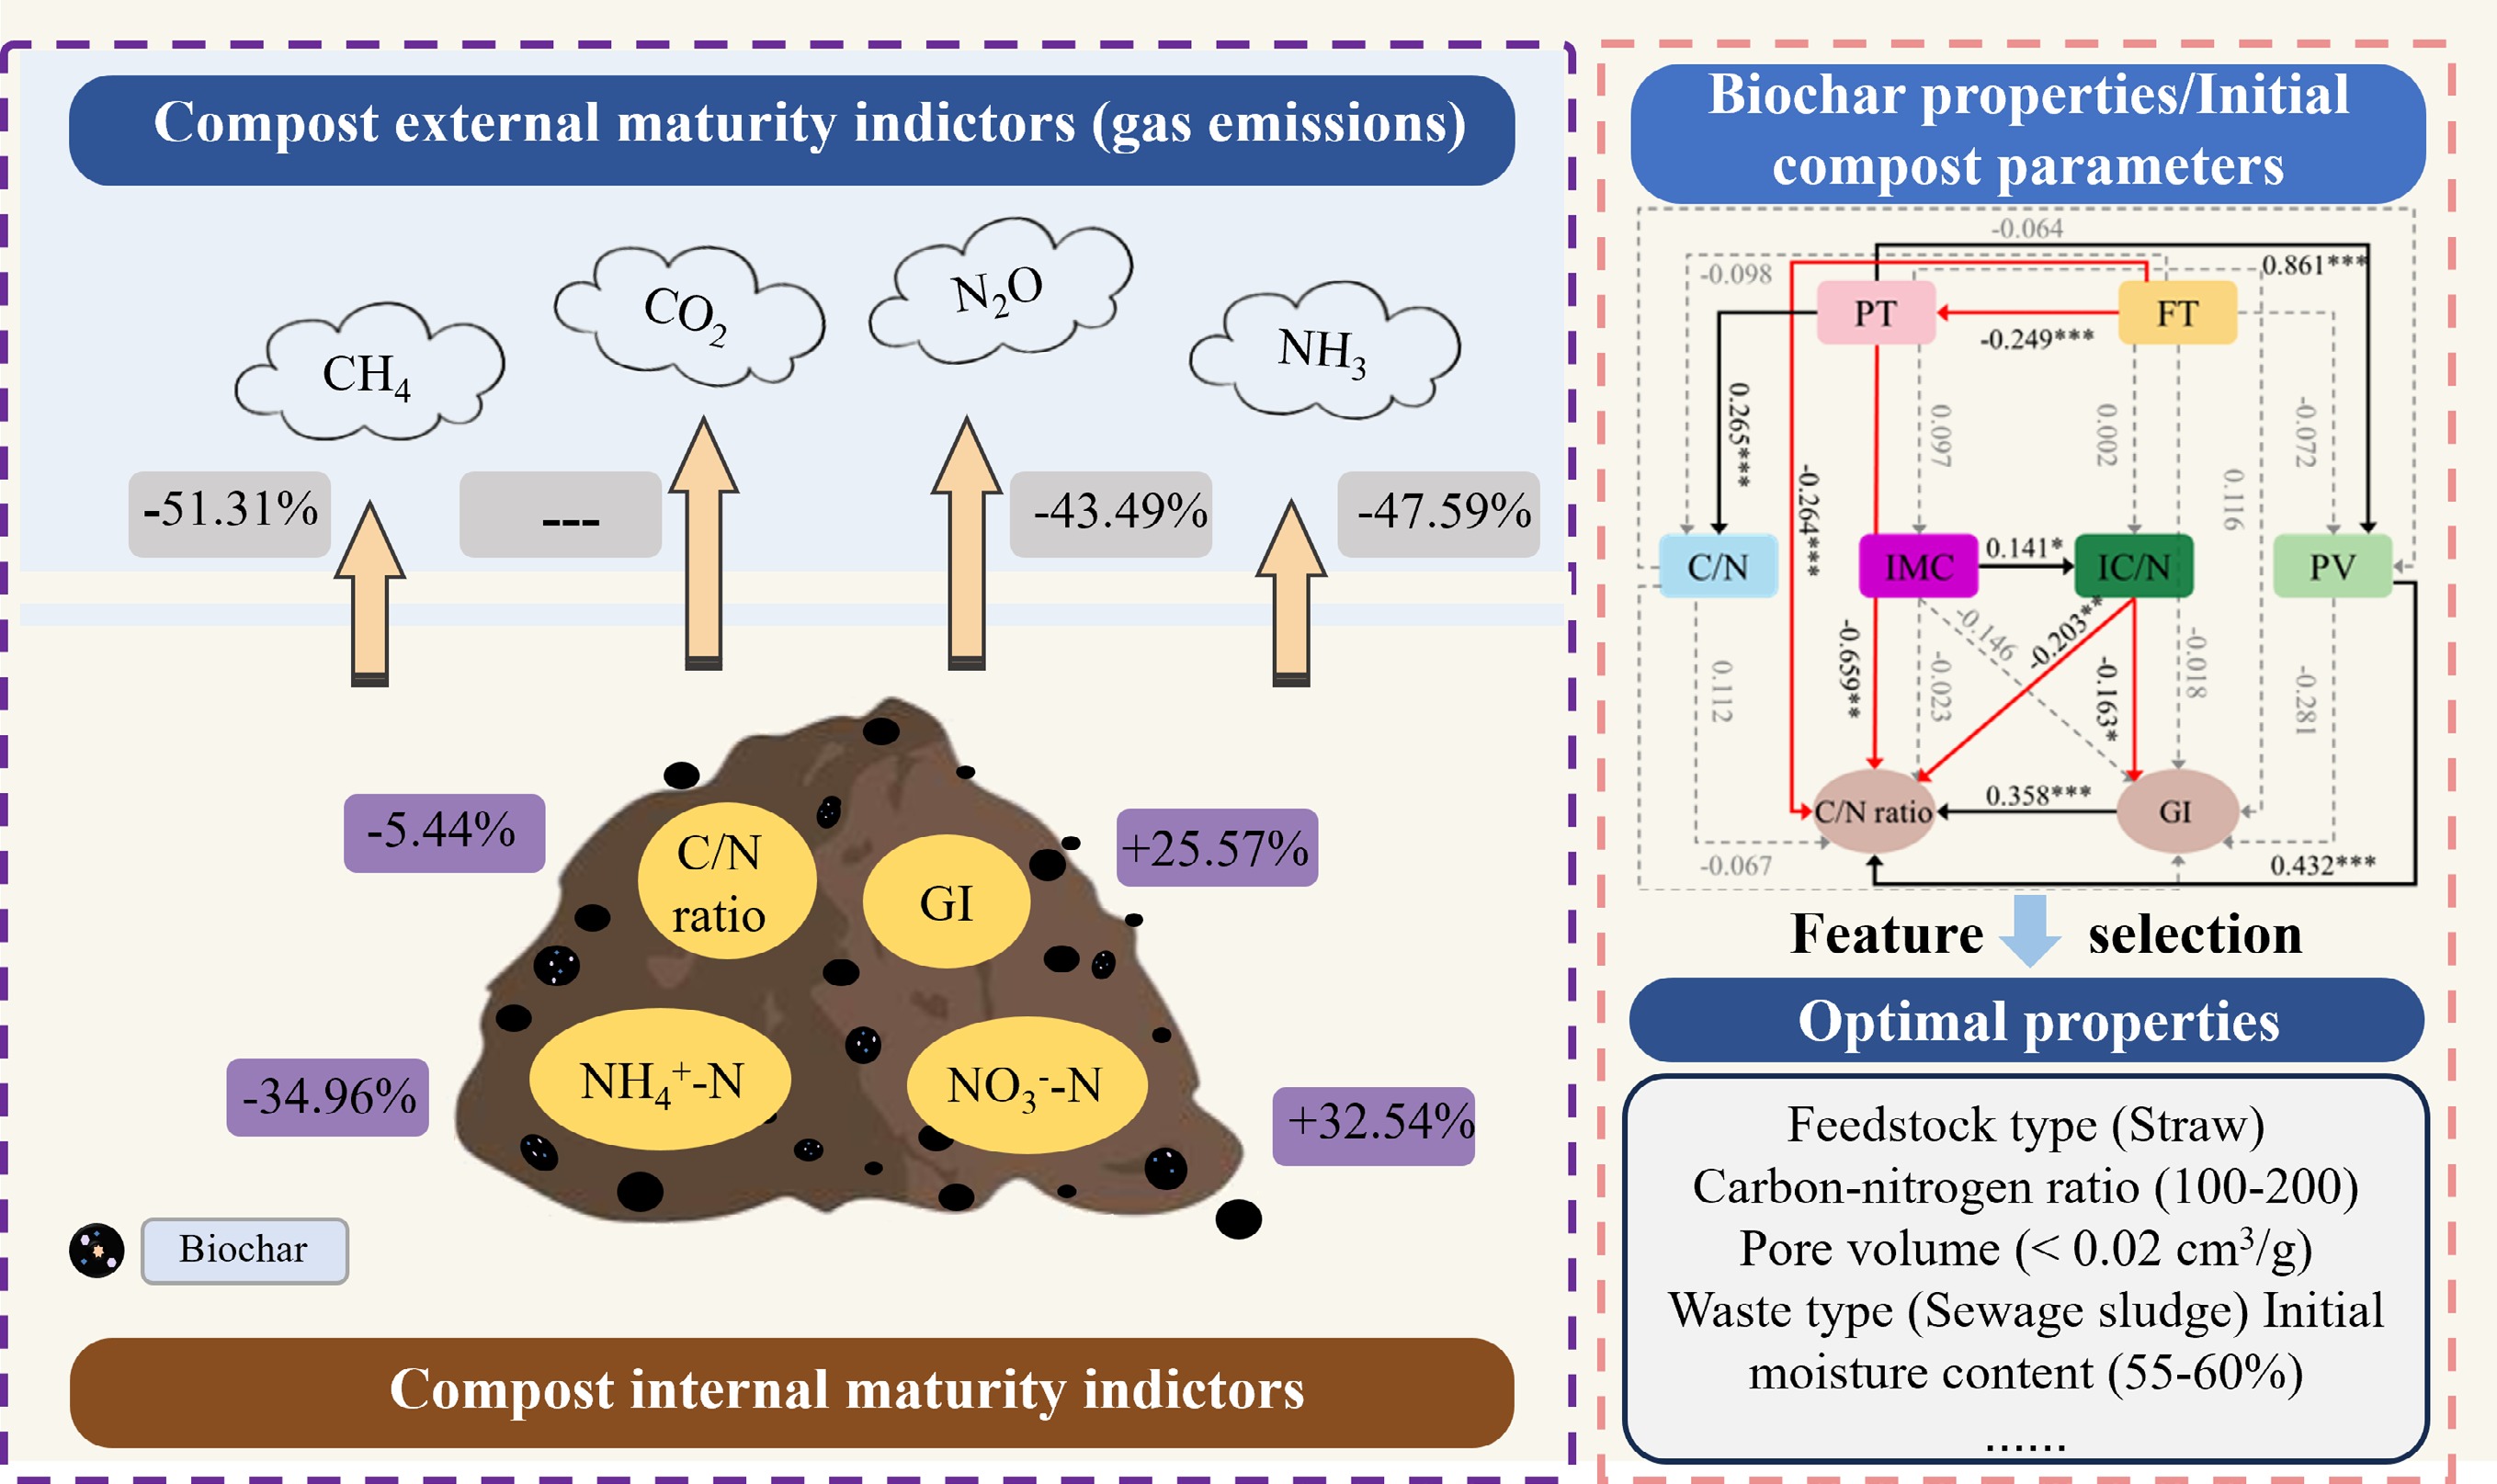
This study employed a comprehensive meta-analysis to systematically evaluate the influence of biochar properties and initial compost parameters on compost maturity. The results demonstrate that biochar addition not only significantly accelerates the maturation process but also effectively reduces gas emissions. Specifically, biochar increased the GI by 25.57% and NO3−−N by 32.54%, while reducing the C/N ratio by 5.44% and NH4+−N by 34.96%. Additionally, CH4, N2O, and NH3 emissions were reduced by 51.31%, 43.49%, and 47.59%, respectively. Among biochar properties, optimal ranges were identified for FT (straw), PT (> 400 °C), C/N (100−200), PV (< 0.02 cm3/g), SA (< 100 m2/g), and AR (> 12%). Key initial compost parameters included IC/N (24−28), waste type (sewage sludge), and IMC (55%–60%). SEMs further revealed that pore volume, feedstock type, and amendment rate exerted the strongest influence on compost maturity. These results provide practical guidelines for optimizing both biochar selection and composting conditions. Future studies should incorporate additional maturity indicators, such as HA/FA and dissolved organic carbon (DOC). More attention is also needed on variations in composting conditions, including scale, aeration, and turning, as these may contribute to variability in results. Efforts to enhance data quality and broaden the evidence base are required for more robust meta-analytic conclusions. Overall, this research contributes to the advancement of waste management strategies by improving efficiency, enhancing compost quality, and promoting environmental sustainability.
-
It accompanies this paper at: https://doi.org/10.48130/bchax-0025-0005.
-
Not applicable.
-
All authors contributed to the study conception and design. The writing, editing and review were carried out by Jianmei Zou. Material preparation, data collection, and analysis were performed by Yihao Hua, Yushu Cheng, Shengui Tang, and Fanrui Chen. The first draft of the manuscript was written by Jianmei Zou and Yihao Hua. All authors commented on previous versions of the manuscript. The results and final version of the manuscript were reviewed by Jinsong He, Mei Huang, Li Zhao, and Fei Shen.
-
The datasets used or analyzed during the current study are available from the corresponding author upon reasonable request.
-
The authors acknowledge funding provided by the National Key Research and Development Program of China - Key Technologies and Equipment for Collaborative Emission Reduction of Ammonia/Greenhouse Gases and New Pollutants (Grant No. 2023YFD1701600).
-
The authors declare that they have no conflict of interest.
-
Full list of author information is available at the end of the article.
- Supplementary File 1 Structural equation models (SEMs).
- Supplementary Table S1 Keywords used for literature review.
- Supplementary Table S2 A compilation of 125 papers with publication years and DOIs.
- Supplementary Table S3 Subgroups of biochar properties with their empirical thresholds.
- Supplementary Table S4 Subgroups of initial composting properties with their empirical thresholds.
- Supplementary Table S5 Statistical results of the heterogeneity test for biochar properties and initial composting properties among the maturity indictors.
- Supplementary Table S6 Statistical results of publication bias for biochar properties and initial composting properties among the maturity indicators.
- Supplementary Fig. S1 Flowchart of literature screening.
- Supplementary Fig. S2 Density map of the studies included in this research.
- Supplementary Fig. S3 Subgroup classification of the biochar properties and initial compost properties.
- Supplementary Fig. S4 Overall significance analysis of biochar properties and initial compost properties on eight maturity indicators of compost.
- Supplementary Fig. S5 Significance analysis to interpret the interactions and non-linear relationships between compost maturity indicators.
- Copyright: © 2025 by the author(s). Published by Maximum Academic Press, Fayetteville, GA. This article is an open access article distributed under Creative Commons Attribution License (CC BY 4.0), visit https://creativecommons.org/licenses/by/4.0/.
-
About this article
Cite this article
Zou J, Hua Y, Cheng Y, Mo L, Tang S, et al. 2025. A holistic assessment of biochar amendment effects on compost maturation: a meta-analysis. Biochar X 1: e005 doi: 10.48130/bchax-0025-0005 

A holistic assessment of biochar amendment effects on compost maturation: a meta-analysis
- Received: 01 July 2025
- Revised: 08 August 2025
- Accepted: 10 September 2025
- Published online: 16 October 2025
Abstract: Biochar is a promising additive for enhancing compost production. However, its varied physicochemical properties, along with differences in raw materials and composting conditions (Xs), introduce complexity to the evaluation of multiple maturity indicators (Ys). To address this issue, a global meta-analysis was conducted, incorporating 269 observations from 125 studies, to systematically evaluate the impact of diverse biochar properties and initial compost parameters on compost maturation. The results revealed that the addition of biochar significantly improves key internal maturity indicators of compost. Notably, the germination index (GI) increased by 25.57%, while NO3−−N levels rose by 32.54%. Concurrently, the C/N ratio was reduced by 5.44%, and NH4+−N levels decreased by 34.96%. Additionally, the incorporation of biochar was effective in mitigating gas emissions during the composting process, resulting in reductions of 51.31% in CH4, 43.49% in N2O, and 47.59% in NH3. Forest plot analyses identified optimal ranges of critical factors that promote compost quality. These factors included specific biochar properties, such as feedstock type (straw), pyrolysis temperature (> 400 °C), C/N (100–200), pore volume (< 0.02 cm3/g), surface area (< 100 m2/g), and amendment rate (> 12%). Key initial compost parameters included an initial C/N (24–28), waste type (sewage sludge), and initial moisture content (55%–60%). Finally, structural equation models ranked these key factors, indicating that a high amendment rate (> 12%) of porous straw-derived biochar significantly enhances composting performance under optimal moisture (55%–60%) and initial C/N (24–28) conditions. These findings provide valuable insights for optimizing both biochar properties and composting parameters, thereby improving compost maturity and process efficiency.
-
Key words:
- Biochar /
- Compost maturity /
- Meta-analysis /
- Properties ranking