


-
Glass is commonly used as a host matrix for the immobilisation and permanent disposal of contaminants, such as radionuclides in vitrified waste glasses within a highly engineered geological disposal facility or chromium-bearing industrial waste glasses in landfill sites[1,2]. Over geological timescales, groundwater is expected to contact these waste glasses. As metastable phases, glasses undergo a series of dissolution-precipitation reactions when in contact with aqueous solutions, transforming into more thermodynamically stable phases (e.g., phyllosilicates) following Ostwald's rule of stages[3,4]. In turn, glass dissolution by groundwater presents an important pathway for contaminant release into the geosphere. However, accurately predicting contaminant release rates and subsequent transport processes requires a complete understanding of glass alteration mechanisms[5−9].
Some authors have extended an interface-coupled dissolution-precipitation model from silicate minerals to borosilicate glasses[10]. Such models broadly describe glass dissolution as (1) congruent hydrolysis of the glass, (2) localised supersaturation of an interfacial film of water with respect to silica phases (e.g., amorphous silica), (3) polymerised silica species nucleation and growth to form an altered layer, (4) colloidal particle aggregation maturing the altered layer, and (5) slowed transport through the altered layer until it presents a rate-limiting mechanism[10−14]. The solid-state diffusion of water species into the glass and subsequent ion exchange with glass species can only become rate-limiting once the rate of congruent dissolution, controlled by transport effects, slows below the rate of solid-state diffusion[15].
Some works have observed apparent diffusion profiles of mobile glass species, such as boron (B), anticorrelated with protons (H+)[16,17], suggesting diffusion presented a significant release mechanism[17−21]. 'Classical' diffusion models consider interdiffusion as a significant mechanism: the inward diffusion of water species, ion-exchange between H+ and glass network modifying or charge compensating species (e.g., alkali metals) and the outward diffusion of reacted glass species[22−24]. Ion-exchange with charge compensating species associated with tetrahedral [BO4]− units (e.g., Na+[BO4]−) destabilises bridging B-O-B/Si bonds[25]. Further, the lower energy barrier for B-O-B/Si bond hydrolysis than for Si-O-Si bonds at near-neutral pH allows the former to initially hydrolyse at a similar rate to alkali metal interdiffusion[26]. In this view, interdiffusion and B-O-B/Si network bond hydrolysis rapidly create a hydrated glass layer denuded of more mobile glass species[25,27]. The increase in solution pH then favours incomplete hydrolysis of the hydrated glass network Si-O-Si bonds to create a 'gel' structure[28,29], which, alongside condensation and precipitation reactions, creates an altered layer[30−33]. Dissolution then slows due to increasingly limited transport through the altered layer and a decreasing thermodynamic affinity for hydrolysis[19,34−36]. At long times, a component of the altered layer may restructure into a nanoporous barrier that limits dissolution to the diffusion of water species and reacted glass species alongside secondary mineral precipitation[16,20,27,37−40].
Note that the above mechanisms are not mutually exclusive: previous works observed altered layer structures not strictly attributable to a single model throughout time[41−44]. Previous lithium (Li) isotope tracer studies showed that Li was predominantly released through diffusive processes at short times[45,46], whilst results reported for an analogue waste glass (7-component) and a simulant waste glass (24-component) at long times (> 28 d) were consistent with Li release predominantly through diffusion across the altered layer and through congruent hydrolysis coupled with secondary mineral precipitation, respectively[46,47]. Overall, the effects of glass composition and experimental conditions on diffusion as a rate-limiting mechanism and the role of B diffusion during glass alteration remain poorly understood.
In dilute aqueous solutions, B is predominantly present as boric acid, B(OH)3, and monoborate anions, [B(OH)4]−, with a pKa ~9.2[48−50]; polymerised species form at approximately ≥ 20 mM total B[51−53]. The large relative mass difference (~10%) between the two stable isotopes of B, 10B and 11B, is associated with substantial mass-dependent isotope fractionation (~ ±50‰) in low-temperature terrestrial environments[54,55], allowing B isotopes to be used as sensitive tracers of fluid-rock interactions[56−59]. Tetrahedrally coordinated B (e.g., aqueous [B(OH)4]− or solid phase [BO4]− units) is enriched in 10B relative to trigonally coordinated B (e.g., aqueous B(OH)3 or solid phase [BO3] units) through an equilibrium isotope effect[56,60−62]. Previous works have shown the sorption of aqueous B(OH)3 and [B(OH)4]− species onto secondary mineral surfaces (e.g., silica gels) and the structural incorporation of B as tetrahedral [BO4]− units (e.g., in aragonite) results in an enrichment of 10B in the solid phase whilst 11B is preferentially retained in solution (fractionation ~ +40‰)[49,60,63−73]. This fractionation has a strong dependence on pH through aqueous B(OH)3-[B(OH)4]− and sorption complex structure distributions[48,49,55,64,67,74,75].
B isotopes can also fractionate kinetically during diffusion: the faster diffusion of 10B than 11B between diffusion couples of pegmatite forming melts was reported at 100 MPa and 850–1,250 °C (empirical parameter β = 0.032 ± 0.002)[76]. Whilst interdiffusion has been observed to fractionate Li isotopes during glass dissolution at short times[45,46], no such effect has been observed for B isotopes. Further, isotopic fractionation has not been observed to accompany boron release during low-temperature, congruent primary phase dissolution during silicate mineral weathering[59,68], but incongruent dissolution of a phase or mineral assemblage may result in isotopic fractionation[77].
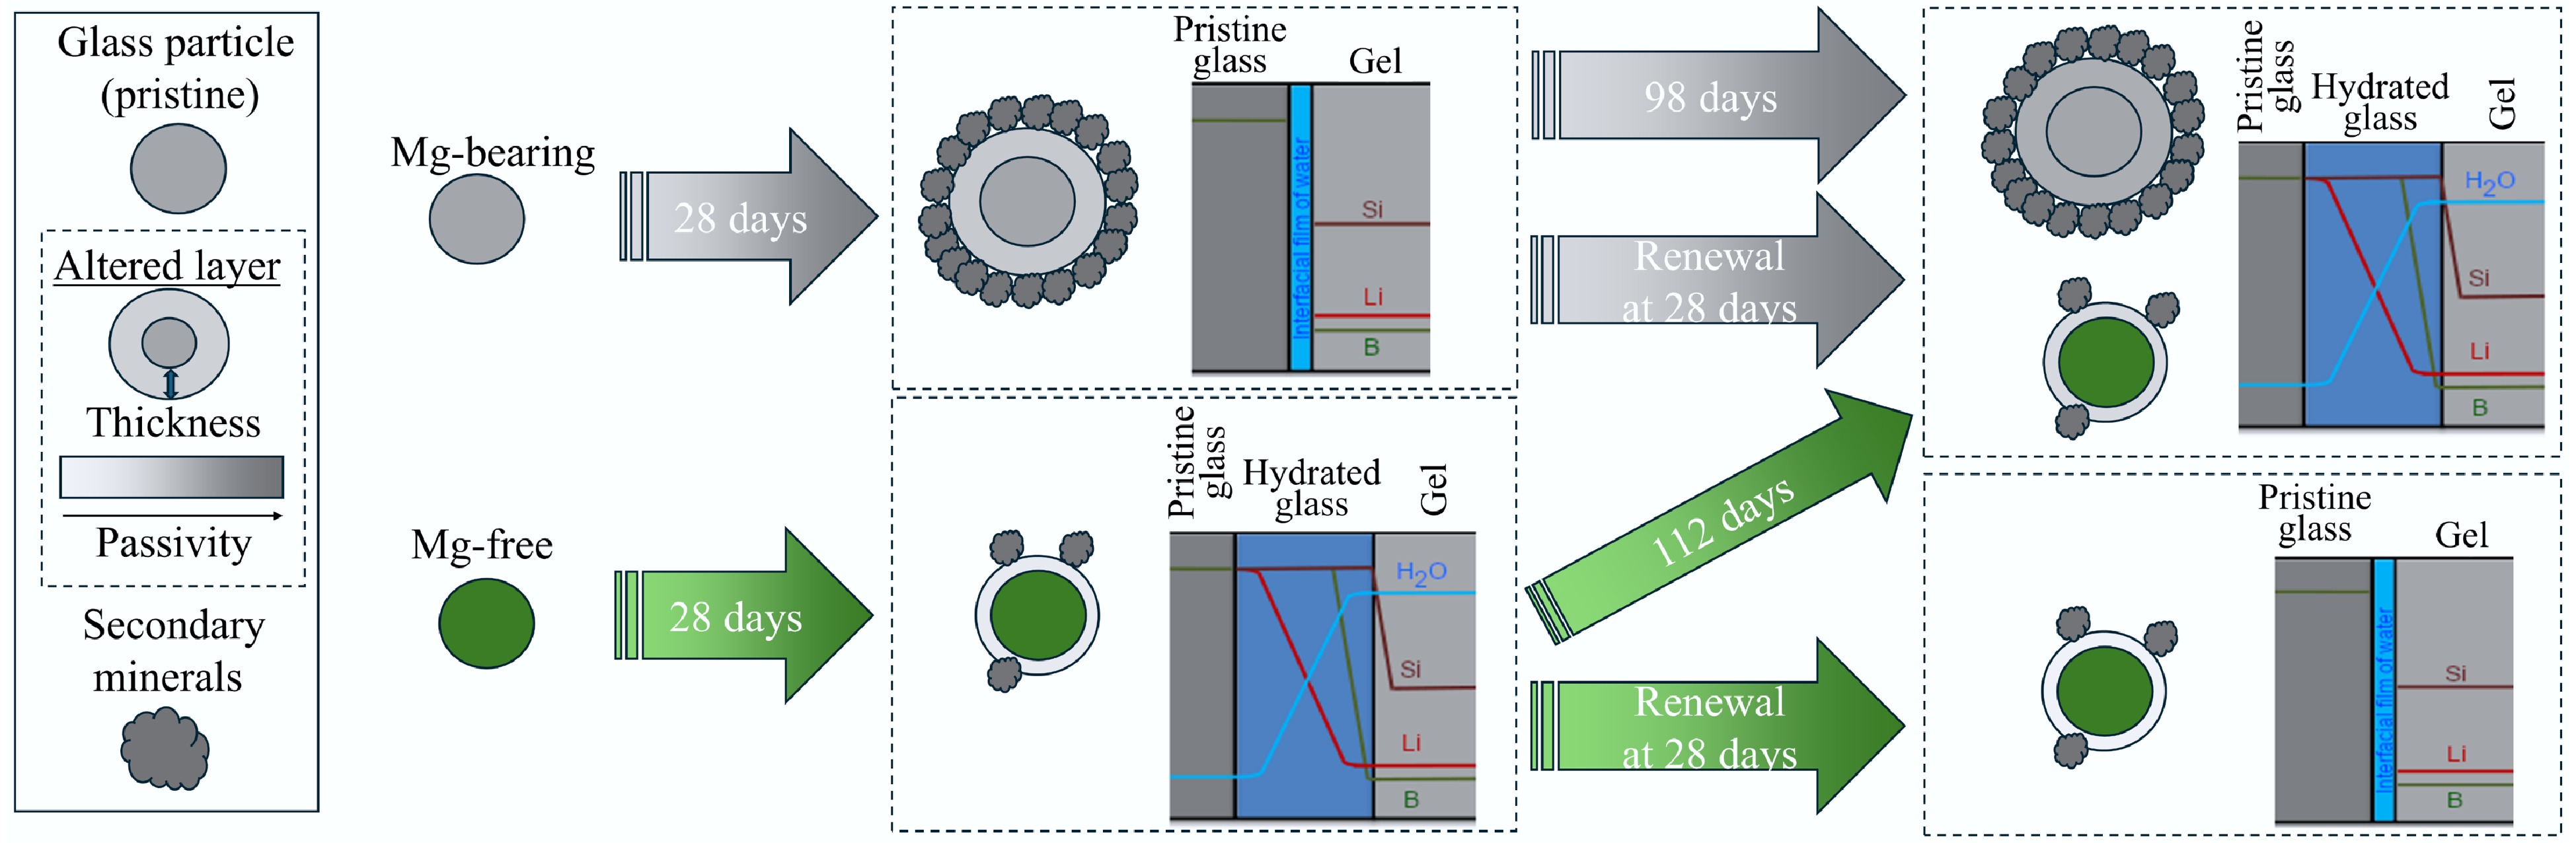
Here, this work aimed to (i) use isotope fingerprinting techniques to trace B diffusion during glass dissolution, (ii) compare B isotope fractionation effects for magnesium-rich (rapid phyllosilicate precipitation)[78] and magnesium-free glasses (limited secondary mineral precipitation)[79], and (iii) investigate whether numerical diffusion models can account for observed trends in isotopic fractionation. Two glass compositions were studied herein: (1) 10B-ISG, representing the magnesium-free reference glass International Simple Glass (ISG)[6] but spiked with 10B, and (2) 6Li-Mg-EM, representing a magnesium-rich waste glass[47,80]. Dissolution experiments took place in unbuffered deionised water at 90 °C for 0.25 to 112 d, with solution renewal experiments after 28 d to investigate whether the altered layers presented protective barriers against further dissolution. B isotope fingerprinting techniques were applied to the resulting solutions to investigate the diffusive release of B in situ as a function of glass composition and time.
-
Two glasses were studied herein: 10B-ISG with a composition nominally identical to that of ISG[6] but spiked with 10B to a nominally equimolar 11B/10B ratio (nominal mol% composition: 3.8% Al2O3, 8.0% 10B2O3, 8.0% 11B2O3, 5.7% CaO, 12.6% Na2O, 60.2% SiO2 and 1.7% ZrO2), and 6Li-Mg-EM with a 11B/10B ratio nominally at natural abundance (nominal mol% composition: 3.2% Al2O3, 18.3% B2O3, 1.2% La2O3, 5.1% Li2O, 8.7% MgO, 5.1% Na2O and 58.4% SiO2).
10B-ISG was synthesised as a single batch by heating dried precursor powders (99.99% Al2O3, 99.99% B2O3 with a 11B/10B ratio assumed to be at natural abundance, B2O3 enriched to 99.61% 10B atoms, 99.995% CaCO3, 99.5% Na2CO3, 99.9% SiO2 and 99.99% ZrO2) to 1,300 °C for 4 h in a 90% Pt 10% Rh crucible using a laboratory chamber furnace (Lenton UAF 16/10). The glass melt was poured onto graphite-coated stainless-steel plates, and this procedure was repeated prior to annealing at 569 °C for 6 h, crushing with an agate mortar and pestle and sieving with stainless-steel test sieves to a 75 to 150 µm fraction. Powders were checked for magnetic particles and then washed to remove adhering fine particles by repeated sonication and sedimentation using absolute ethanol (99.99%, Alfa Aesar, US) before drying at 90 °C for 16 h.
6Li-Mg-EM was synthesised as a single batch following a similar procedure to 10B-ISG but with differences in the precursor powders (99.99% Al2O3, 99.98% B2O3, 99.999% La2O3, 99.998% (natural abundance Li isotopes) and 95.77% 6Li atoms (Euriso-top) Li2CO3, 99.99% MgO, 99.95% Na2B4O7 and 99.9% SiO2) and the furnace heating profile. Dried precursors were first heated to 750 °C for 3 h before heating to 1,500 °C and immediately pouring the melt onto graphite-coated stainless-steel plates. This procedure was then repeated once more without holding for 3 h before pouring the melt onto graphite-coated stainless-steel plates heated to 250 °C. Annealing took place at 550 °C for 2 h, and powders were prepared to a 75 to 150 µm fraction following the same procedure as 10B-ISG above. Further details on the synthesis and characterisation of 6Li-Mg-EM are given in a previous study[47]. Whilst 6Li-Mg-EM underwent dissolution experiments in a previous study[47], the B concentrations and B isotopic measurements presented herein for 6Li-Mg-EM are reported here for the first time alongside data for 10B-ISG.
Glass characterisation
-
All acids used in this study were distilled in a Teflon sub-boiling still (single distilled for HF and double distilled for HNO3 and HCl). All water used, including in the dissolution experiments and for diluting acids, was deionised water (18.2 MΩ·cm, Milli-Q).
Prepared 10B-ISG powders were weighed (0.12500 and 0.03125 g) into 15 mL perfluoroalkoxy alkane (PFA; Savillex, US) vials before concentrated HCl (~12.0 M, 9 mL), HNO3 (~15.9 M, 3 mL) and HF (~28 M, 1 mL) were added and heated at 150 °C for 20 min. Digests were analysed by inductively coupled plasma optical emission spectrometry (ICP-OES; Ciros Vision, SPECTRO Analytical Instruments, Germany) for all glass species. Recoveries for 10B-ISG were within 1% and 10% of their nominal values for B and all other elements, respectively, with relative standard deviations of ≤ 2% on all values. The characterisation of 6Li-Mg-EM is presented in a previous study[47].
Archimedes' Principle was used to measure glass densities in triplicate using an analytical balance with a weigh-below hook (Pioneer, Ohaus, US). A density of 2.47 ± 0.10 g cm−3 was measured for 10B-ISG, which was comparable to those of ISG (2.50 ± 0.01 g cm−3)[79] and 6Li-Mg-EM (2.47 ± 0.03 g cm−3)[47].
X-ray powder diffraction (D8 Advance, Bruker, US) was used to ensure the pristine glasses were amorphous. Approximately 100 mg of powder was analysed on a glass slide. A range of 10 to 60° (2θ) was analysed in 978 steps of 0.05° using Cu Kα radiation (λ = 0.15046 nm) and an aperture slit size of 0.600 mm.
Ambient temperature 11B magic angle spinning nuclear magnetic resonance (MAS-NMR) took place on 6Li-Mg-EM powders after 0, 28 and 98 d of alteration at a spectrometer frequency of 160.32 MHz on a Varian Infinity Plus spectrometer with an 11.7 T magnet following previously described procedures[80].
Scanning electron microscopy (SEM) was used to study secondary mineral precipitation, with secondary electron (SE) images of 6Li-Mg-EM (0 and 98 d) and 10B-ISG surfaces (0 and 112 d) acquired using a FEI QEMSCAN 650F. Samples were analysed uncoated under low vacuum using a spot size of 4.0, 13 mm working distance and 20.0 kV accelerating voltage with a secondary electron large field detector (LFD).
Dissolution experiments
-
Static-batch glass alteration experiments were started following the ASTM product-consistency test method B methodology (PCT-B, ASTM C1285-1414)[81]. Experiments took place in deionised water at geometric glass surface area to leachant volume (SA/V) ratios of 1,500 and 2,000 m−1 for 10B-ISG (2.78 g powder, 40.0 mL deionised water) and 6Li-Mg-EM (4.00 g powder, 42.5 mL deionised water), respectively. Experiments were maintained at 90.0 °C (QBH2 Al dry block heaters, Grant Instruments, UK) for the test duration and were duplicated alongside duplicate experiment deionised water blanks. Leaching vessels were 60 mL PFA (Savillex, US) standard jars. Aliquots of 100 µL solution were taken using PFA tubing at 0.25, 0.5, 1, 7, 28 and 112 d for 10B-ISG and 0.25, 0.5, 7, 28 and 98 d for 6Li-Mg-EM. Solution renewal experiments were used to probe the protective properties of the formed altered layers against further dissolution: after 28 d for one replicate, all accessible leachant was removed without disturbing the glass powders and the same volume of deionised water was then added. Aliquots of these solution renewal experiments were taken at 1, 7, 14, 21 and 28 d (29, 35, 42, 49 and 56 d of total alteration time) for 10B-ISG and once after 70 d (98 d total alteration time) for 6Li-Mg-EM. Mass loss due to evaporation was less than 5.0% during the experiments.
Aliquot preparation and concentration analysis
-
For all 10B-ISG aliquots except those at 112 d, samples were gravimetrically diluted using 0.1 M HNO3 and 0.3 M HF and analysed for all glass species alongside matrix-matched calibration curves by inductively coupled plasma mass spectrometry (ICP-MS; Element XR, Thermo Fisher Scientific, US). B concentrations in the 112-day aliquots were instead analysed by multi-collector ICP-MS (MC-ICP-MS) using a 10 ng mL−1 NIST SRM 951 standard (further details given in subsequent sections). The concentration analysis methodology of the 6Li-Mg-EM solution aliquots is presented in previous works[47]. Experimental deionised water blanks yielded concentrations < 65 pg mL−1 for Li and B, < 15 ng mL−1 for Na, Al, Ca and Zr and < 60 ng mL−1 for Si. As aliquot volumes were insufficient for pH measurements, pH90°C at each sampling point were calculated using measured solution concentrations with PHREEQC software and the LLNL database[82] assuming equilibrium with atmospheric O2 (209 mmol mol−1) and CO2 (410 µmol mol−1)[83]. An uncertainty of ± 0.2 pH units was assigned to each calculated pH90°C value, with this uncertainty conservatively encompassing the ranges of calculated pH values obtained when considering the uncertainties associated with the measured solution concentrations used in these calculations. Note that this approach was used to examine trends in the pH90°C values with time as a function of solution composition, rather than provide independently accurate pH90°C values; the accuracy of these calculated pH90°C values at a given time should otherwise be treated with caution.
Concentrations of each element i in the aliquots, CiSample, were normalised to the mass fraction of i in the pristine glass, fi, and geometric SA/V ratios, SA/V, to yield normalised elemental releases, NLi (g m−2), following Eq. (1)[81]. Changes in the NLB with time were used to calculate normalised release rates, NRB (g m−2 d−1), through least squares regressions (IGOR Pro, WaveMetrics, US) at each time interval using standard deviations (1SD) as weights. The fractions of each element i dissolved from the glass, LFi (mg mg−1), were calculated using Eq. (2), where V and m represent the initial solution volume and glass powder mass, respectively. Assuming glasses were spheres of initial radius r0 (56.25 µm) that were uniformly altered, LFB was used to estimate altered layer thicknesses, eB (µm), using Eq. (3)[84].
$ {\mathit{N}\mathit{L}}_{\mathit{i}}=\dfrac{{\mathit{C}}_{\mathit{i}}^{\mathit{S}\mathit{a}\mathit{m}\mathit{p}\mathit{l}\mathit{e}}}{{\mathit{f}}_{\mathit{i}}\dfrac{\mathit{S}\mathit{A}}{\mathit{V}}} $ (1) $ {\mathit{L}\mathit{F}}_{\mathit{i}}=\dfrac{{\mathit{C}}_{\mathit{i}}^{\mathit{S}\mathit{a}\mathit{m}\mathit{p}\mathit{l}\mathit{e}}{\mathit{V}}_{}}{{\mathit{m}\mathit{f}}_{\mathit{i}}} $ (2) $ {{\mathit{e}}_{\mathit{B}}={\mathit{r}}_{0}\left(1-\sqrt[3]{(1-{\mathit{L}\mathit{F}}_{\mathit{B}})}\right)} $ (3) B micro-distillation and solution δ11B analysis
-
Samples for isotope ratio measurements were prepared under class 1000 clean laboratory conditions in a specialised low-B suite at the University of Cambridge, UK. All 10B-ISG and 6Li-Mg-EM solution aliquots underwent B micro-distillation to prepare mono-elemental B solutions following Misra et al.[85]. Briefly, samples were gravimetrically diluted with 0.5 M HCl, and the volumes required for 50 ng B (< 70 µL in all cases) underwent micro-distillation using 7 mL PFA vials (Savillex, US) on a hotplate at 95 °C for 16 h. Distillate fractions were then taken up in 400 µL 0.5% HF and diluted to 10 ng mL−1 B using 0.5% HF prior to analysis. The use of an HF matrix resulted in HBF4·H2O (boiling point ~129 °C) as the dominant B species, thereby addressing issues associated with B volatility (i.e., high instrumental blanks), poor tolerance for other matrix species and surface sorption (i.e., memory effects) during analysis[85]. Instrumental drift and mass bias effects were addressed using a sample-standard bracketing (SSB) technique with a matrix-matched (0.5% HF) standard, as detailed below.
B isotope ratios for all solutions and B concentrations for the 112-d 10B-ISG solutions were measured by MC-ICP-MS (Neptune Plus, Thermo Fisher Scientific, US) at the University of Cambridge using a concentration-matched (10 ng mL−1) SSB technique with NIST SRM 951. Analysis used a PFA single-pass Scott-type spray chamber, C-flow self-aspirating nebuliser (50 µL min−1), Pt injector and Pt X and JET sampler and skimmer cones, respectively. An RF power of 1,350 W was used, measuring 10B and 11B on the L3 and H3 Faraday cups, respectively, with 1013 Ω amplifiers[85−87]. Each sample measurement comprised one block of 30 cycles with an integration time of 8.4 s, with a 0.5% HF wash and then a 0.5% HF blank measurement bracketing each sample or standard measurement. Typical beam sizes were ~45 and ~210 mV for 10B and11B. Blank corrected sample isotope ratios, 11B/10BSample, were used to calculate δ11B values using the average of the bracketing standard measurements following Eq. (4). ERM-AE121 was analysed in each session as a secondary standard, yielding a long-term value across all sessions (19.68 ± 0.17‰, 2SD, n = 43) in agreement with its compiled value (19.9 ± 0.6‰)[88,89].
$ {\delta}^{11}\mathit{B}=\left[\left(\dfrac{{}_{}{}^{11}\mathit{B}/{{}_{}{}^{10}\mathit{B}}_{\mathit{S}\mathit{a}\mathit{m}\mathit{p}\mathit{l}\mathit{e}}}{{}_{}{}^{11}\mathit{B}/{{}_{}{}^{10}\mathit{B}}_{\mathit{S}\mathit{t}\mathit{a}\mathit{n}\mathit{d}\mathit{a}\mathit{r}\mathit{d}}}\right)-1\right]{10}^{3} $ (4) Pristine glass δ11B analysis
-
Pristine 10B-ISG and 6Li-Mg-EM pieces (~1 cm2) were mounted in two-part epoxy resin (EpoFix, Struers, Denmark) and polished to 3 µm using diamond pastes. Laser ablation MC-ICP-MS (LA-MC-ICP-MS) took place at the University of Western Australia using a 193 nm ArF laser with a large two-volume sample cell (COMPexPro 110 Excimer laser ablation system, Coherent) attached to an MC-ICP-MS (Neptune Plus, Thermo Fisher Scientific, US). At least nine 900 µm2 squares were ablated across three randomly selected regions for each sample. Ablation took place at a rate of 5 s−1 and a fluence of 3 J cm−2 for an analysis time of approximately 41 s per square, including ten pre-ablation pulses to remove contamination. δ11B values were calculated with respect to bracketing NIST SRM 610 measurements[90−92] by ablating 490 µm2 squares with an analysis time of approximately 120 s per square, with triplicate measurements bracketing each set of three sample measurements. Measurements took place at low resolution using 1013 Ω amplifiers with the L4 and H4 Faraday cups for 10B and 11B, respectively. NIST 610 has a compiled range of 0.00 to −0.78‰ relative to NIST 951[89]. In turn, it was assumed NIST 610 was at 0.00‰ relative to NIST 951, and an additional uncertainty (2SD) of 0.78‰ was propagated onto the pristine glass measurements. NIST 610 measurements had an uncertainty of 0.96‰ (2SD, n = 9).
Diffusion models
-
To investigate whether the δ11B values measured for the 10B-ISG solutions could be explained solely following a diffusion mechanism, three numerical diffusion models were used to fit the measured δ11B values. These models were based upon those used by Gin et al. to fit B depth profiles measured across altered ISG cross-sections using time-of-flight secondary ion mass spectroscopy (ToF-SIMS)[17]. Model 1 is a solution to Fick's second law for diffusion, assuming the glass presents a non-stationary, unreactive, semi-infinite planar source, wherein the apparent diffusivity of each B isotope is assumed to be constant both spatially across the altered layer and with time. This model represents the diffusion of B and water species across an altered layer which is uniform in its properties both spatially and temporally. Model 2 extends Model 1 by assuming the apparent diffusivities of the B isotopes were spatially constant but decreased as a function of time as described by the release rate of B. Whilst this model still represents diffusion across a spatially uniform, bulk altered layer, it aims to account for changing altered layer properties with time through densification and porosity closure affecting the diffusion of B. Finally, Model 3 extends Model 1 by assuming the apparent diffusivities of the B isotopes are a function of rate-limiting water species concentration (approximated as the inverse of total B concentration at each point in the altered layer), allowing apparent diffusivities to vary spatially across the altered layer as a function of time. Through relaxing the assumption of spatially constant apparent diffusivities, this model represents an altered layer structure which undergoes spatially non-uniform densification and porosity closure, with access to water species required for the hydrolysis of B network bonds and the subsequent diffusive release of B varying as a function of distance. That is, the apparent diffusivity of a B isotope in the altered layer is represented by a single diffusivity at each point in the altered layer as a function of time, rather than a single bulk apparent diffusivity as in Models 1 and 2. Models were fitted to measured 11B/10B values through least squares curve fitting with uncertainties (1SD) as weights using IGOR Pro software (WaveMetrics, US), assuming a 11B/10B ratio of 4.044 for NIST 951[93]. The equations describing these models, further assumptions on their forms and details on the fitting procedures are given in Supplementary File 1 (Method 1.1).
-
Solution pH, B concentrations and δ11B values are summarised in Supplementary Table S1. Alteration at 6 h was characterised by the rapid release of B into solution with no measurable differences between 6Li-Mg-EM and 10B-ISG, with normalised B releases, NLB, of 0.72 ± 0.45 g m−2 and 0.22 ± 0.05 g m−2, respectively (1SD, n = 6). These releases were associated with calculated altered layer thicknesses, eB (Eq. [3]), of 0.29 ± 0.18 µm and 0.09 ± 0.02 µm (1SD, n = 6), respectively (Fig. 1a, b). This indicated differences in pristine glass structure did not produce measurable changes in initial dissolution kinetics, in agreement with previous works showing that changes in glass [Ca]/[Mg] ratios did not measurably affect glass alteration rates at short times[94].
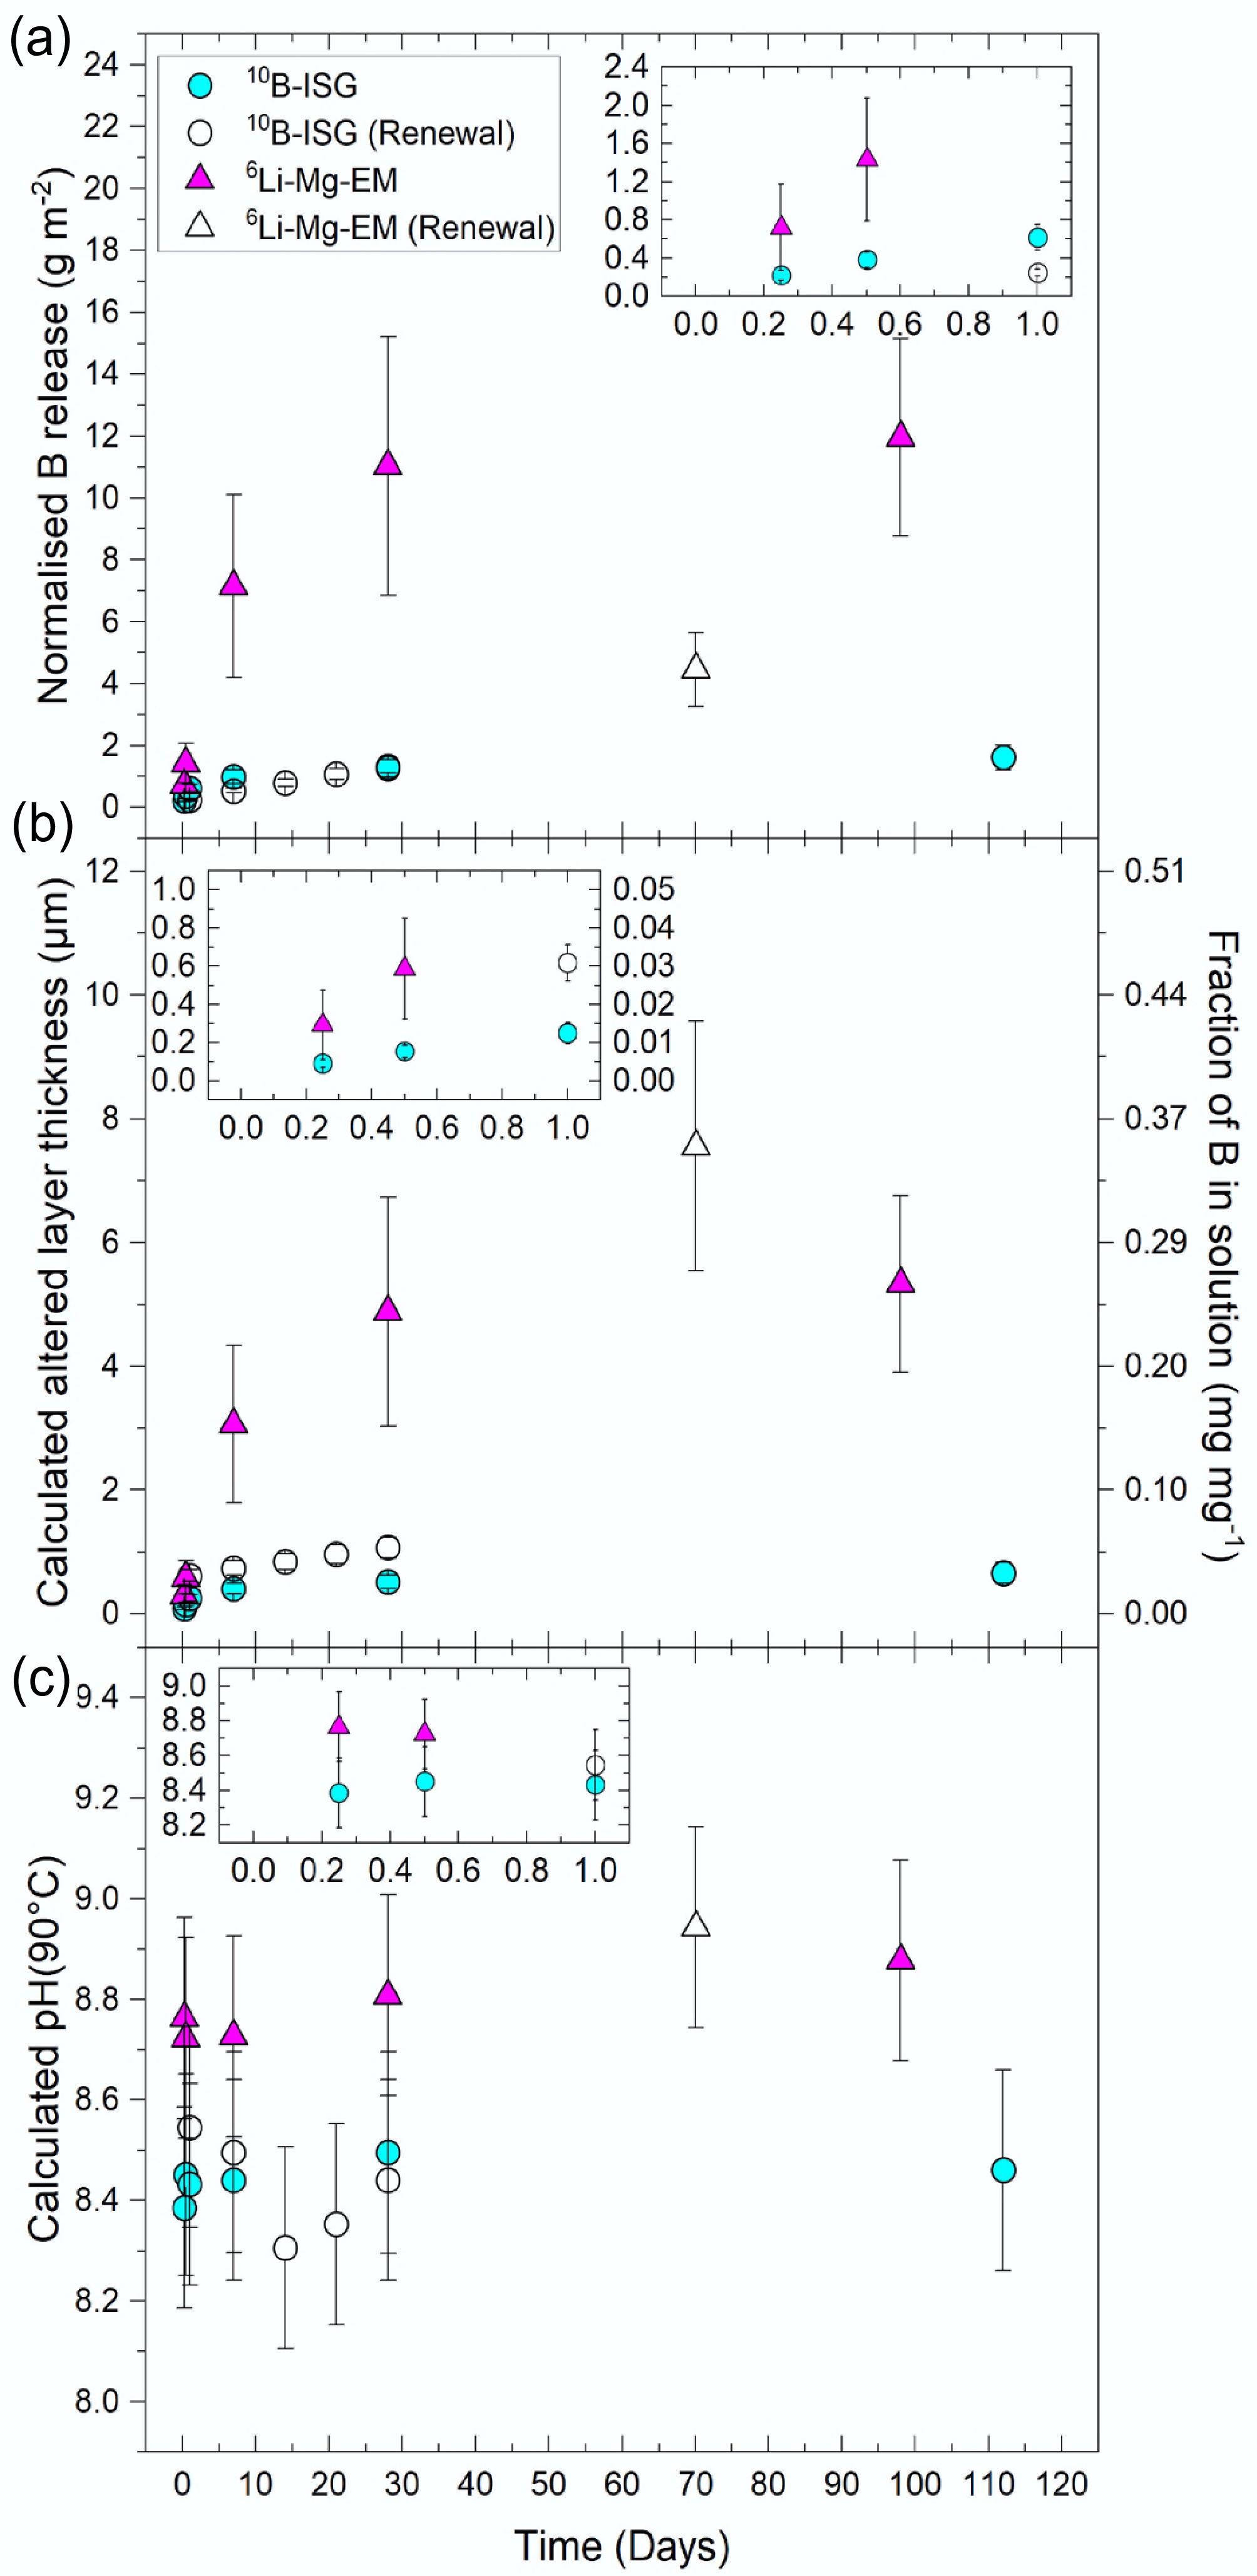
Figure 1.
The (a) normalised boron (B) releases, (b) altered layer thicknesses (primary vertical axis) calculated from the leached fractions of B (secondary vertical axis), and (c) calculated solution pH90°C from PHREEQC modelling using the measured solution concentrations as a function of time for 10B-ISG and 6Li-Mg-EM. Normalised B releases were calculated by normalising B concentrations to experiment geometric SA/V ratios and elemental mass fractions of B in the pristine glasses. Points are given as averages (n ≥ 3), with uncertainties on (a) and (b) propagated from 1SD associated with the concentration measurements, geometric surface areas and pristine glass compositions (26.7% relative SD for 6Li-Mg-EM, 15.5% relative SD for 10B-ISG). Uncertainties on the calculated pH90°C values are given to ±0.2 pH units, with this uncertainty encompassing the calculated pH value ranges obtained from the uncertainties associated with the measured solution concentrations used in calculating these pH90°C values (data not shown). Insets in each subplot include the same data but at times of up to 1 d. Altered layer thicknesses for the solution renewal experiment samples are presented as cumulative values that include the initial 28 d before renewal.
The calculated solution pH90°C rapidly increased from its deionised water starting value (measured pH25°C 5.9 ± 0.2, 1SD, n = 12; calculated pH90°C 5.8 ± 0.2) to 8.4 ± 0.2 and 8.8 ± 0.2 after 6 h for 10B-ISG and 6Li-Mg-EM, respectively, whereafter it remained constant (1SD, n = 11 and 6, respectively) with time (Fig. 1c). This is consistent with previous experiments on comparable glass compositions (i.e., ISG and (Li-)Mg-EM) under similar conditions to those used herein, which showed that a steady-state pH25°C/pH90°C was attained from the shortest sampling time (≤ 1 d) onwards[79,94,95]. In turn, changes in B concentrations and δ11B values as a function of time herein cannot be attributed to a measurable change in the calculated solution pH90°C as a function of time (with respect to an uncertainty of ±0.2 pH units). Note that these calculated pH90°C values were used to examine pH trends as a function of time, as opposed to providing independently accurate values. As hydrolysis of the glass network is increasingly favoured with higher solution pH[33], a larger solution pH90°C than calculated by PHREEQC (Fig. 1c) would correspond to a larger than expected contribution of network hydrolysis to the measured B release rates. However, the accuracy of these calculated pH90°C values did not otherwise affect the interpretation or discussion of the measured data presented herein, including the B concentrations, normalised releases and δ11B values.
Normalised B releases of 0.38 ± 0.08 g m−2 and 1.43 ± 0.64 g m−2 were measured after 12 h for 10B-ISG and 6Li-Mg-EM, respectively, whereafter normalised B releases for 6Li-Mg-EM at longer times were a factor of ~8 higher than those for 10B-ISG. Similar deviations in B releases at long times have been previously observed for magnesium (Mg)-bearing and Mg-free glasses[96,97], where Mg can promote phyllosilicate precipitation to maintain thermodynamic affinity for glass network hydrolysis reactions[78,98−101]. Indeed, secondary electron images of altered 6Li-Mg-EM (98 d) showed porous secondary minerals consistent with a Mg phyllosilicate precursor phase (Supplementary Fig. S1a, b), whilst few, sparsely distributed secondary mineral precipitates were observed for altered 10B-ISG (112 d) (Supplementary Fig. S1c, d).
After 7 d, normalised B releases and altered layer thicknesses increased to 0.99 ± 0.22 g m−2 and 0.41 ± 0.08 µm, respectively, for 10B-ISG, and to 7.15 ± 2.94 g m−2 and 3.06 ± 1.27 µm, respectively, for 6Li-Mg-EM (Fig. 1a, b). Notably, these values did not measurably change (1SD) from 7 d onwards, corresponding to pseudo-steady state normalised B releases and altered layer thicknesses (mean ≥ 7-d values) of 1.22 ± 0.26 g m−2 and 0.50 ± 0.11 µm, respectively, for 10B-ISG and 9.66 ± 2.40 g m−2 and 4.24 ± 1.13 µm, respectively, for 6Li-Mg-EM. However, B concentrations continued to measurably change up to 28 d for both compositions, attaining pseudo-steady state B concentrations of 99.7 ± 10.0 µg mL−1 and 1,452.9 ± 181.6 µg mL−1 for 10B-ISG and 6Li-Mg-EM, respectively (see also next section). This coincided with aqueous Si concentrations reaching a pseudo-steady state after approximately 7 and 28 d for equivalent non-spiked 10B-ISG and 6Li-Mg-EM experiments, respectively (Supplementary Fig. S2)[79,80,102].
Overall, these results indicated substantially higher normalised B releases and a correspondingly thicker estimated altered layer thickness for 6Li-Mg-EM than 10B-ISG, as driven by the precipitation of Mg-bearing secondary minerals for the former sustaining a higher rate of glass network hydrolysis reactions.
Congruent and diffusive boron releases
-
LA-MC-ICP-MS measurements yielded a pristine glass δ11B value of −0.89 ± 0.96‰ (11B/10B ratio of 4.045 ± 0.004 mol mol−1; 2SD, n = 12) for 6Li-Mg-EM. Experiment solution δ11B values from 6 h to 7 d were not measurably (2SD) fractionated relative to the pristine glass (Fig. 2b), indicating the release of B isotopes at short times occurred congruently. Similarly, the congruent leaching of Li isotopes was previously reported at 6 h for 6Li-Mg-EM[47]. This agreement supports the conclusion that B isotopes initially leached congruently, as opposed to kinetic isotope effects during primary phase dissolution (e.g., the faster diffusion of 10B enriching the solution in 10B)[76] being masked by equilibrium isotope effects during aqueous B-solid phase interactions (e.g., the preferential sorption of aqueous 10B onto secondary minerals enriching the solution in 11B)[75].
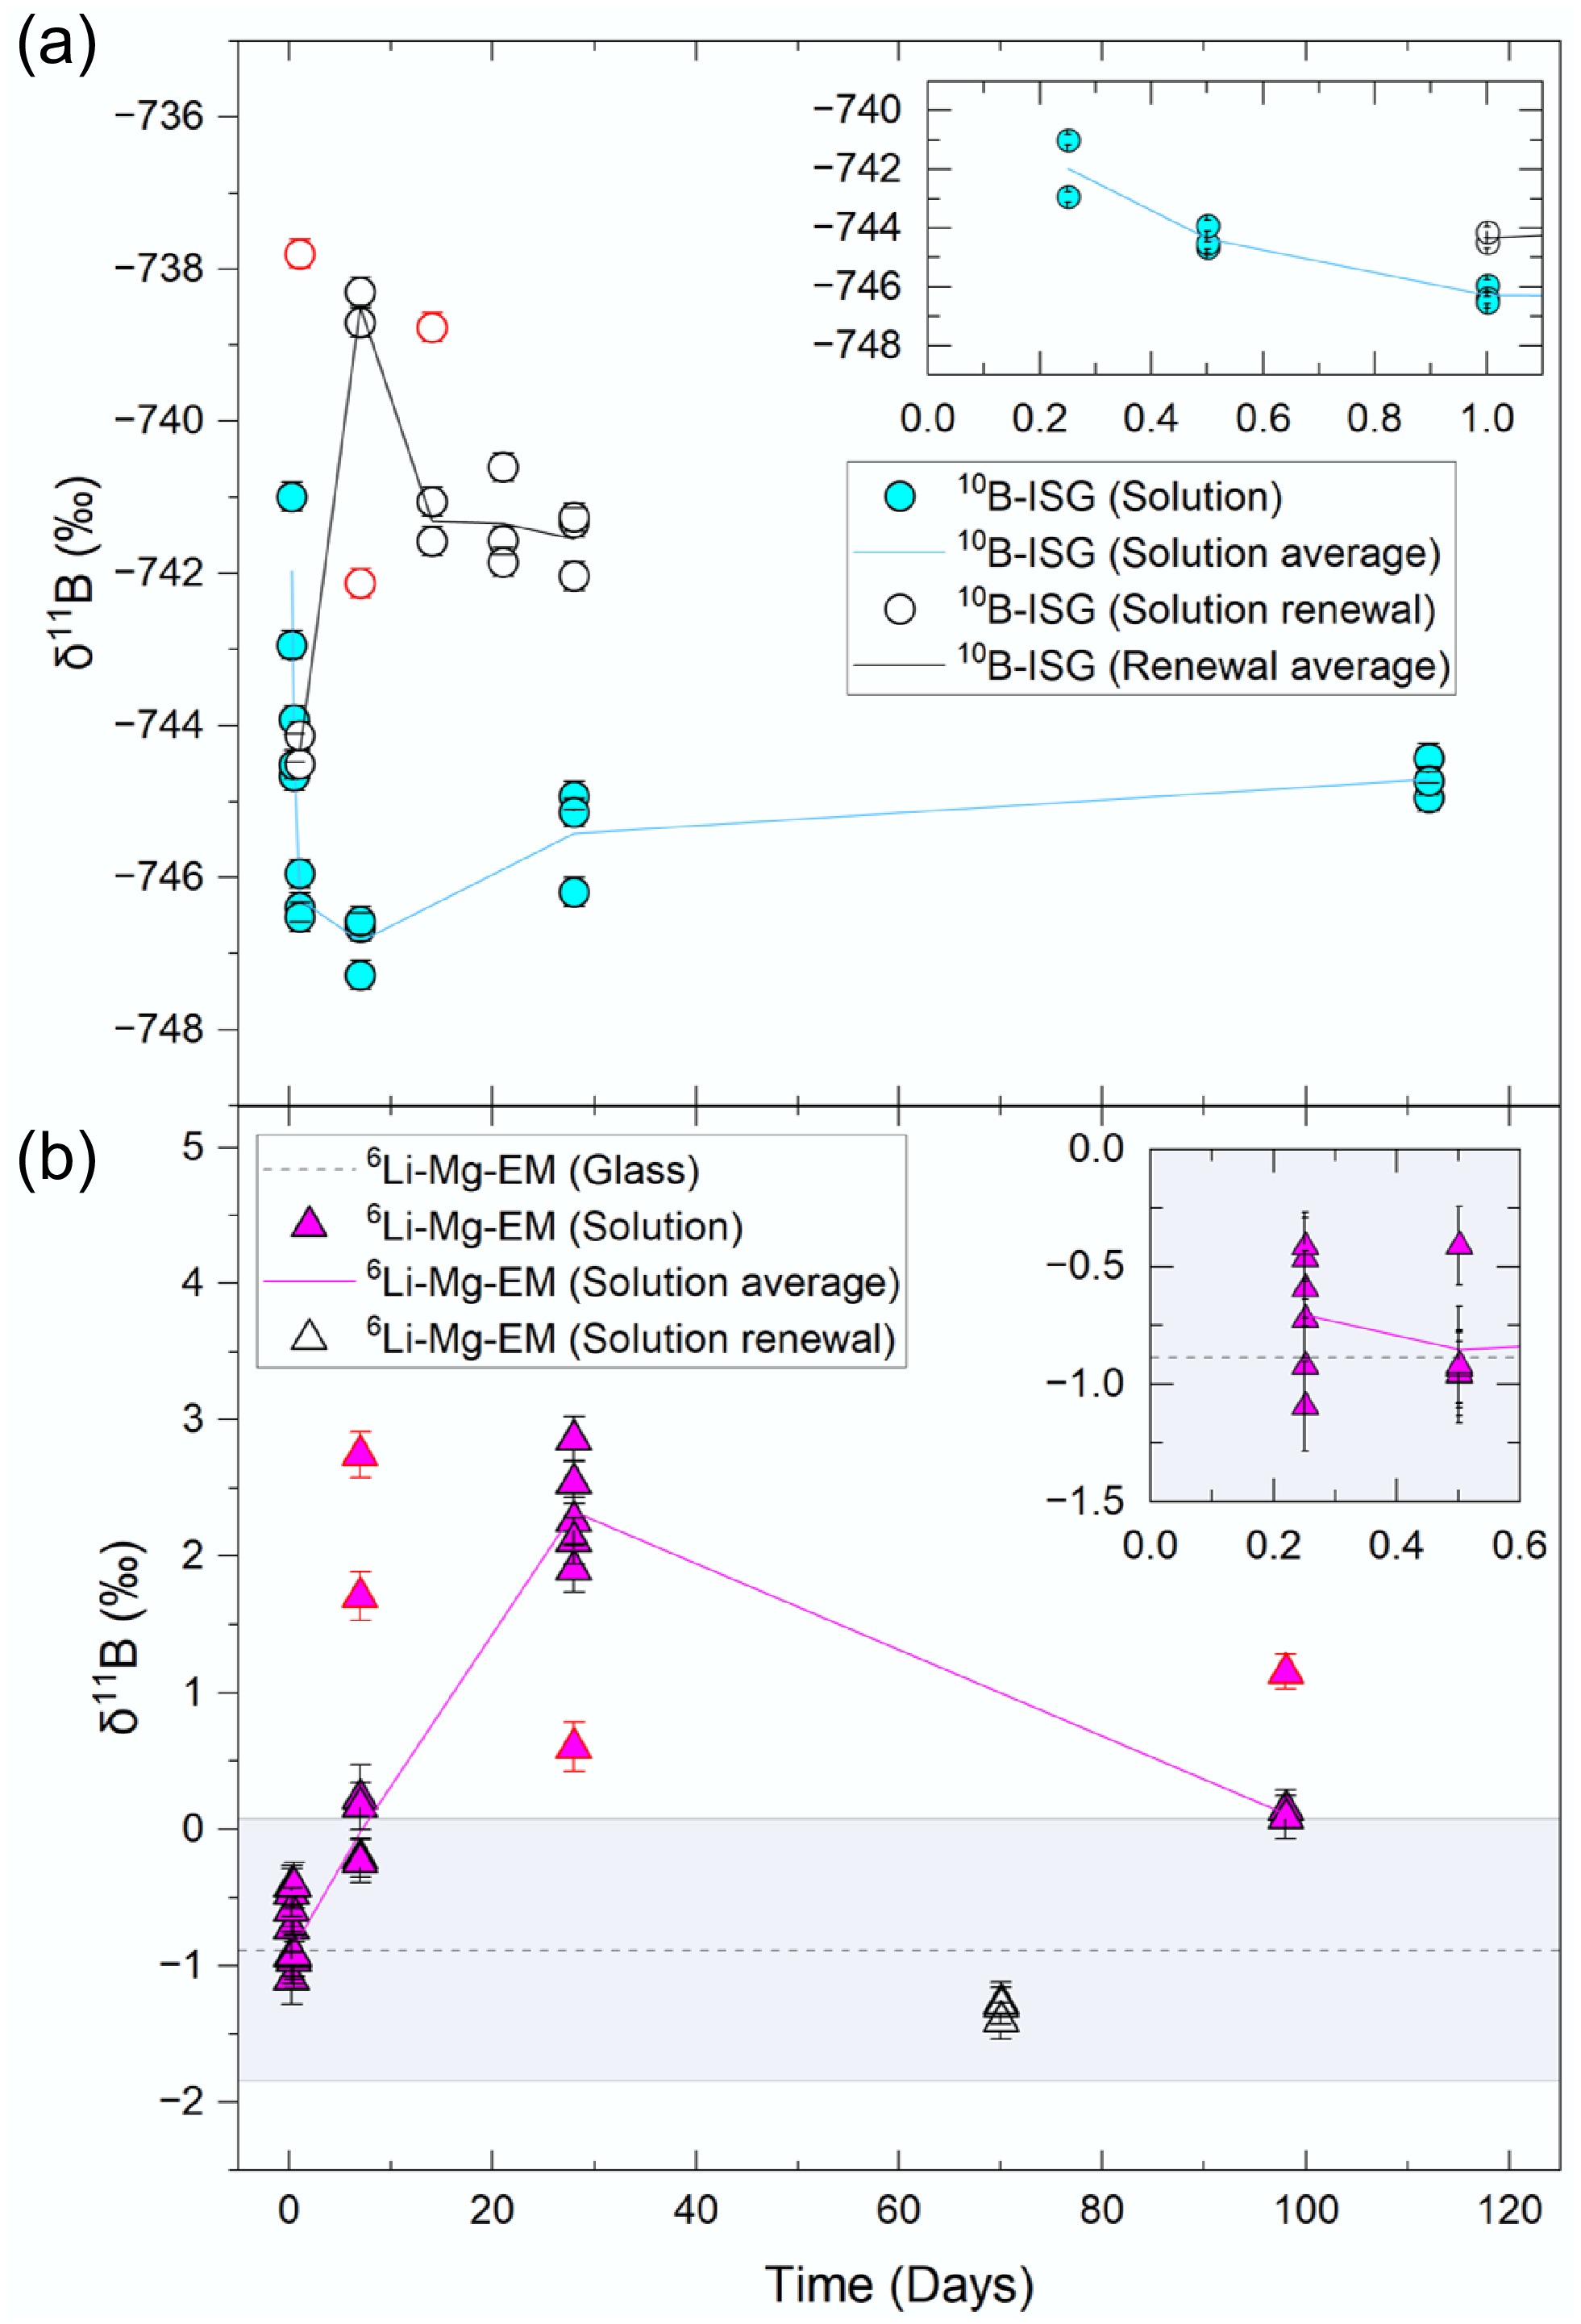
Figure 2.
Solution δ11B values for the (a) 10B-ISG and (b) 6Li-Mg-EM experiments relative to their respective pristine glass values. Individual points are given for each aliquot analysed, with uncertainties given to 2SD. Outliers are shown as points with red borders. Lines represent the mean value of all aliquots (excluding outliers) at a given time. The measured pristine glass value is shown for 6Li-Mg-EM as a dotted line (mean) with the shaded region representing the uncertainty (2SD) associated with this value. The measured pristine glass value for 10B-ISG (−767.54 ± 6.44‰) is not visible on the scale used.
Altered 6Li-Mg-EM powder (28 and 98 d) 11B MAS-NMR spectra showed a decrease in trigonal BO3 unit doublet intensities (~10 ppm; note that the true isotropic chemical shift value was not extracted for this study) relative to tetrahedral [BO4]− unit peak intensities (~0 ppm), indicating BO3 units dissolved preferentially to [BO4]− units (Fig. 3). This agreed with previous studies that showed BO3 units are associated with faster release kinetics during glass alteration than [BO4]− units[103,104], with the preferential release of BO3 units from Li-Mg-EM (natural abundance) previously shown to occur to a constant extent at all dissolution times studied ([BO3]/[BO4]− ratios 1.718 ± 0.072, 1.577 ± 0.067 and 1.564 ± 0.066 mol mol−1 at 0, 7 and 112 d, respectively)[80]. Whilst 10B may preferentially associate with tetrahedral [BO4]− units over trigonal BO3 units in the pristine glass[66,105], these results were inconsistent with the preferential dissolution of BO3 units resulting in measurable changes in solution δ11B values at times ≤ 7 d.
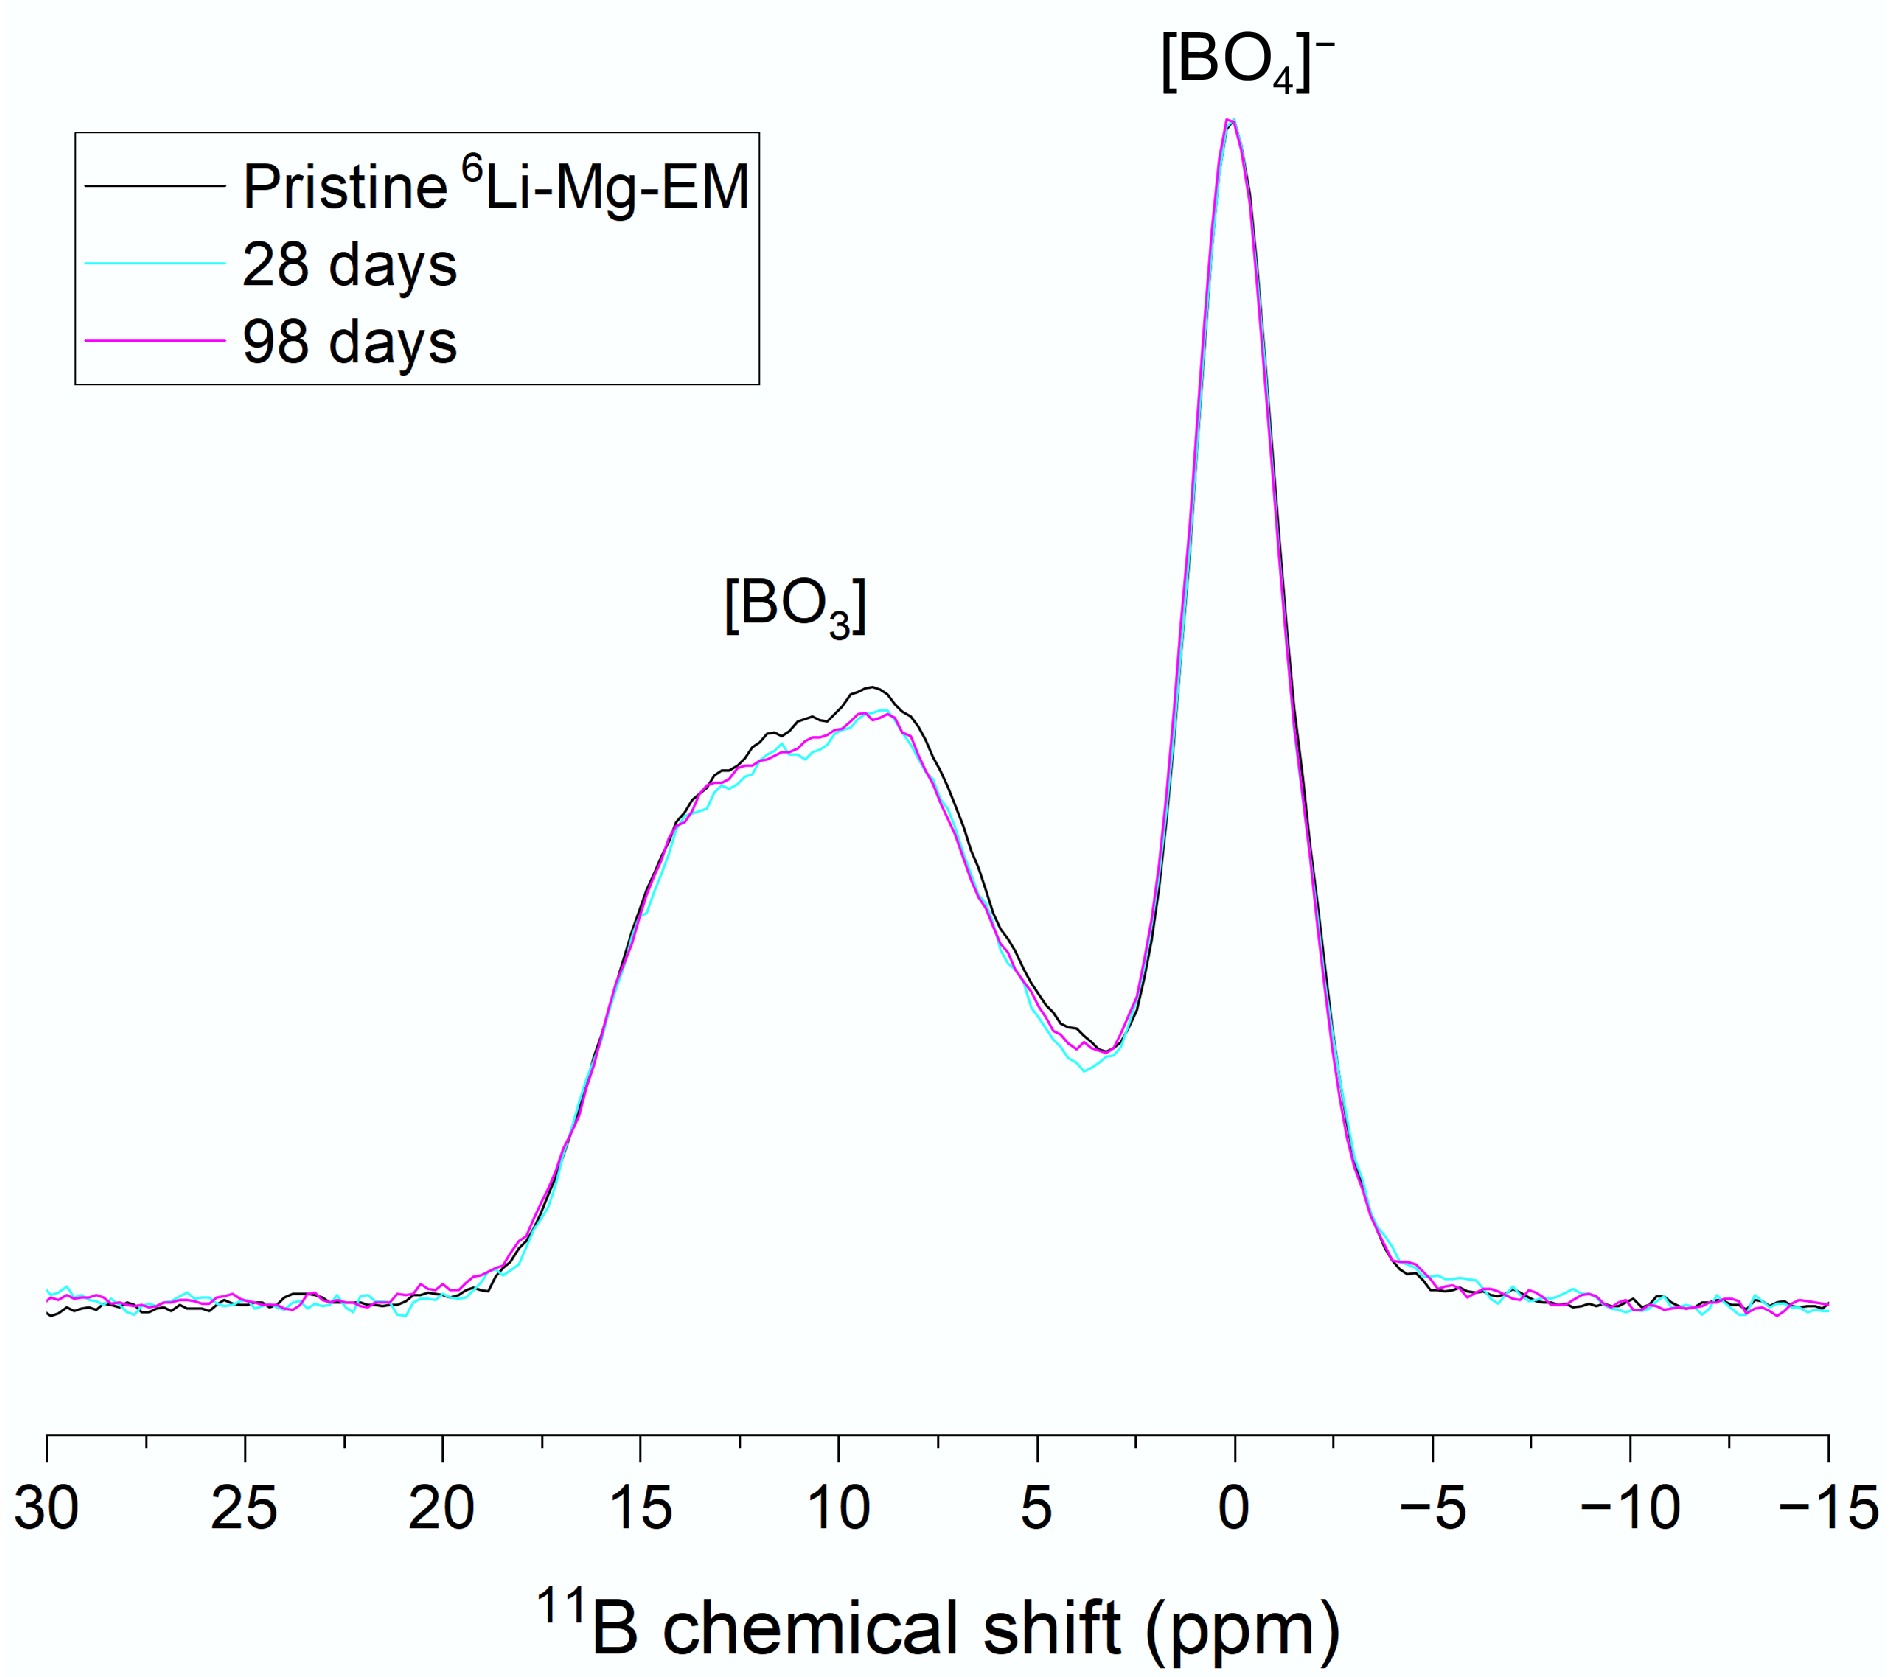
Figure 3.
11B MAS-NMR spectra of 6Li-Mg-EM after 0 (black line), 28 (cyan line) and 98 d (magenta line) of alteration. Labels indicate the positions of the [BO4]− unit peaks and the [BO3] unit doublet. Spectra were normalised to a given [BO4]− peak intensity to compare changes in [BO3] doublet intensities.
After 28 d, 6Li-Mg-EM experiment solution δ11B values increased to +2.34 ± 0.74‰ (2SD, n = 5) (Fig. 2b) alongside a small increase in B concentration (868.9 ± 208.9 µg mL−1 and 1,340.2 ± 240.0 µg mL−1 at 7 and 28 d, respectively; Fig. 4a). Notably, congruent dissolution of the primary phase or diffusion cannot result in the solution δ11B values exceeding the pristine glass value, indicating other processes controlled this increase.
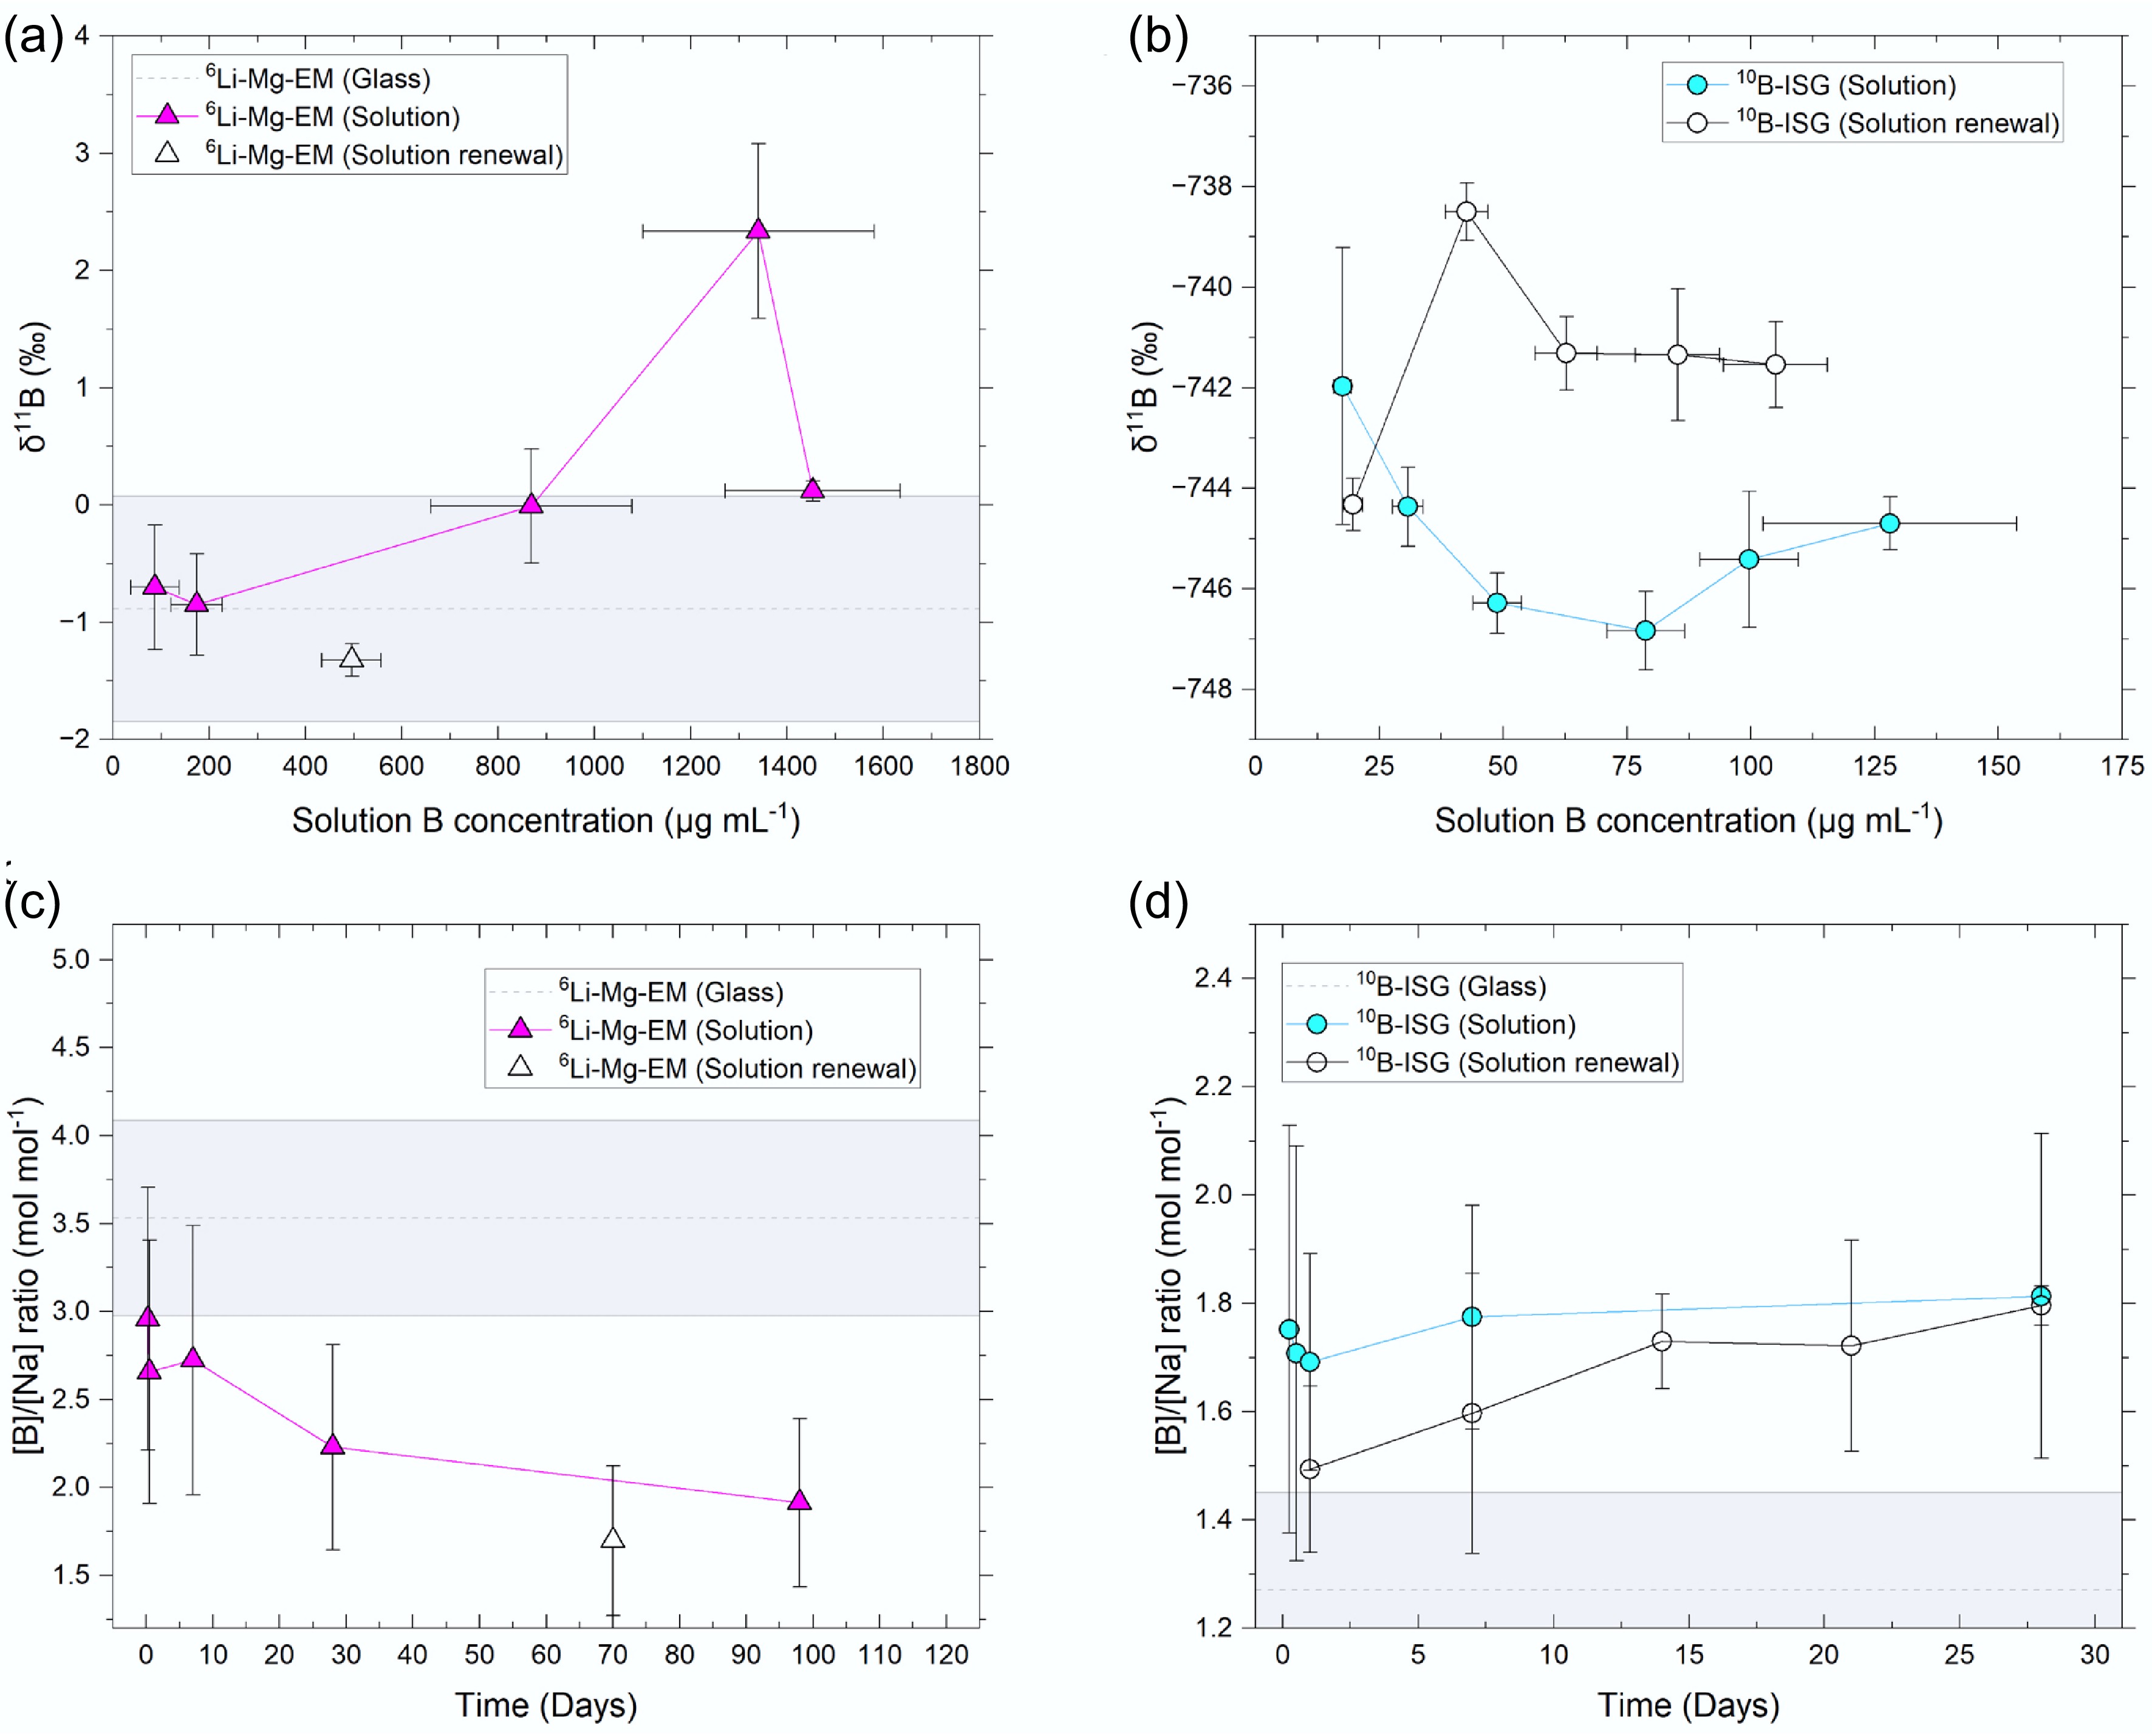
Figure 4.
Solution δ11B values plotted against B concentrations for the (a) 6Li-Mg-EM and (b) 10B-ISG experiments, and solution B to Na concentration ratios against time for the (c) 6Li-Mg-EM and (d) 10B-ISG experiments. Uncertainties are given to 1SD on concentrations and 2SD on δ11B values. Measured pristine glass values are shown as dotted lines (mean) with the shaded region representing the uncertainties on the measurements. The pristine glass δ11B value for 10B-ISG (−767.54 ± 6.44‰) was not visible on the scale used.
The solution [B]/[Na] ratio decreased to below the pristine glass value (1SD) after 28 d and remained below this value at 98 d (Fig. 4c). Whilst Na is expected to be incorporated into secondary minerals (e.g., Na silicate hydrates and Mg-phyllosilicates)[79], this decrease confirmed the net release of B and Na was incongruent with time. This is partly attributable to the sorption of B onto secondary minerals (Supplementary Fig. S1) or the altered glass surface (i.e., the gel layer), or the structural incorporation of B into secondary minerals during coprecipitation[69,75,106,107]. Further, porosity closure in the altered layer under pseudo-steady state solution Si concentrations is a potential pathway for high B concentrations to be retained in the altered layer[39]. These aqueous B-solid phase interactions can lead to the preferential removal of 10B from solution and an increase in solution δ11B values[108], as detailed below.
The absence of measurable B isotope fractionation in the 6Li-Mg-EM leachates at earlier durations suggested that the leaching of B from 6Li-Mg-EM continued to be congruent at 28 d. In turn, the increase in the solution δ11B value at 28 d was attributable to the continued congruent release of B isotopes during dissolution of the primary phase alongside the preferential removal of 10B from solution during interactions with secondary minerals: (1) the sorption of B to secondary minerals (i.e., Mg-phyllosilicates or Na-silicates) or the altered glass surface, where either the preferential outer-sphere sorption of aqueous [B(OH)4]− or inner-sphere sorption could preferentially remove 10B from solution[49,60,71,72,75]; (2) the structural incorporation of B into secondary minerals (coprecipitation), where both the preferential uptake of [B(OH)4]− anions or bond length considerations can lead to the preferential incorporation of 10B[65,73,109]; and (3) the retention of B in the altered layer under pseudo-steady state solution Si concentration conditions, where (a) in situ condensation and precipitation reactions under these conditions lead to porosity closure in the altered layer, (b) local B concentrations increase in closed pores due to transport constraints, and (c) Ca-borates or boron hydroxides subsequently precipitate, potentially preferentially incorporating 10B from solution with the remaining aqueous B species diffusing towards the bulk solution[39]. Based upon observations of precipitates at shorter times for Li-Mg-EM under similar conditions[102], it was anticipated that the above sorption and coprecipitation effects, as (1) and (2) above, occurred at earlier times but in amounts insufficient to produce measurable isotope fractionation.
The solution δ11B values at 98 d decreased to + 0.12 ± 0.09‰ (2SD, n = 2; Fig. 2b), with no measurable (1SD) change in B concentration between 28 and 98 d (Fig. 4a). Note that, as glass is a metastable phase, the release rate of B does not reach zero until glass alteration is effectively complete[110]. Rather, B release at long times can proceed at a low rate, which requires substantially longer timescales between solution samplings than those used herein to resolve (e.g., compare ~200 and ~4500 d in Curti et al.[96]). This indicated the preferential release of 10B into solution at 98 d occurred in concentrations insufficient (1SD) for detection relative to the 28-d values. Conservatively assuming all sorption and coprecipitation processes ceased after 28 d, mass balance calculations were used as a first-order approximation to study whether congruent dissolution of the pristine glass alone could account for this δ11B value decrease (Supplementary File 1, Method 1.2). Assuming an increase in solution B concentration at 98 d equal to the sum of the uncertainties (1SD) on each of the 28- and 98-d values resulted in a calculated 98-d solution δ11B value of +1.57 ± 1.22‰ (2SD), showing that congruent dissolution alone could not account for this decreased solution δ11B value. Further, as the 98-d solution [B]/[Na] ratio remained lower than the pristine glass value (Fig. 4c) and previous 6Li MAS-NMR spectra indicated the precipitation of Li-bearing secondary phases continued during this time[47], these results suggested substantial desorption of sorbed B fractions or dissolution of B-bearing secondary minerals (both reservoirs enriched in 10B) did not occur.
The 70-d 6Li-Mg-EM solution renewal experiments evidenced the altered layer formed after 28 d protected the glass from further dissolution: normalised B releases after 70 d following solution renewal (4.46 ± 1.19 g m−2) were within uncertainty (1SD) of the non-renewed 7-d value (7.15 ± 2.94 g m−2) and lower than the 28-d value (11.03 ± 4.18 g m−2) (Fig. 1a), with no measurable change in calculated altered layer thicknesses for the 98-d non-renewal (5.33 ± 1.42 µm) and 70-d renewal experiments (7.56 ± 2.02 µm) (Fig. 1b) or calculated solution pH90°C (Fig. 1c). Notably, this coincided approximately with a pseudo-steady state Si concentration being attained in solution (Supplementary Fig. S2), suggesting condensation and precipitation reactions under such conditions developed part of the altered layer into a protective component through densification and porosity closure with time[37,39,111].
In this view, these results are consistent with the decrease in solution δ11B values at 98 d being attributable to a kinetic isotope effect wherein 10B diffused preferentially to 11B from the hydrated glass (i.e., B dissolution front) across the altered layer into the bulk solution. It is postulated here that glass network hydrolysis at short times was maintained at a high rate by Mg-phyllosilicate precipitation, leading to similar rates of interdiffusion and preferential B-O-B/Si bond hydrolysis to the rate of congruent glass network hydrolysis and the release of B following a congruent dissolution model without substantial diffusion across the altered layer. At longer times, it is proposed that condensation and precipitation reactions in the altered layer under a pseudo-steady state solution Si concentration resulted in substantial altered layer densification and porosity closure, leading to a component of the altered layer presenting a nanoporous molecular sieve which limited the release of B through its structure largely to solid-state diffusion. Alongside a substantially decreased thermodynamic affinity for glass network hydrolysis under these conditions, diffusion through the altered layer then presented a significant release mechanism for B to result in the observed diffusive isotopic fractionation at long times. Indeed, it has been previously proposed that the diffusion of reactive water species and reacted glass species across a nanoporous altered layer component, presenting an 'active zone' at the hydrated glass-gel interface, under such conditions constituted a rate-limiting release mechanism[39].
Overall, constant solution δ11B values for 6Li-Mg-EM up to 7 d followed by an increased δ11B value alongside a decreased solution [B]/[Na] concentration ratio at 28 d were consistent with the predominantly congruent release of B, where 10B was preferentially sorbed to the surface of secondary minerals or the altered glass, structurally incorporated into secondary minerals, or retained in the altered layer. The δ11B values from mass balance calculations, alongside solution renewal experiments showing that the altered layer after 28 d was passivating against further dissolution, showed that the decreased δ11B values at 98 d were consistent with kinetic isotope fractionation during the diffusion of B across a passivating altered layer component.
Spatially separated boron and lithium dissolution fronts
-
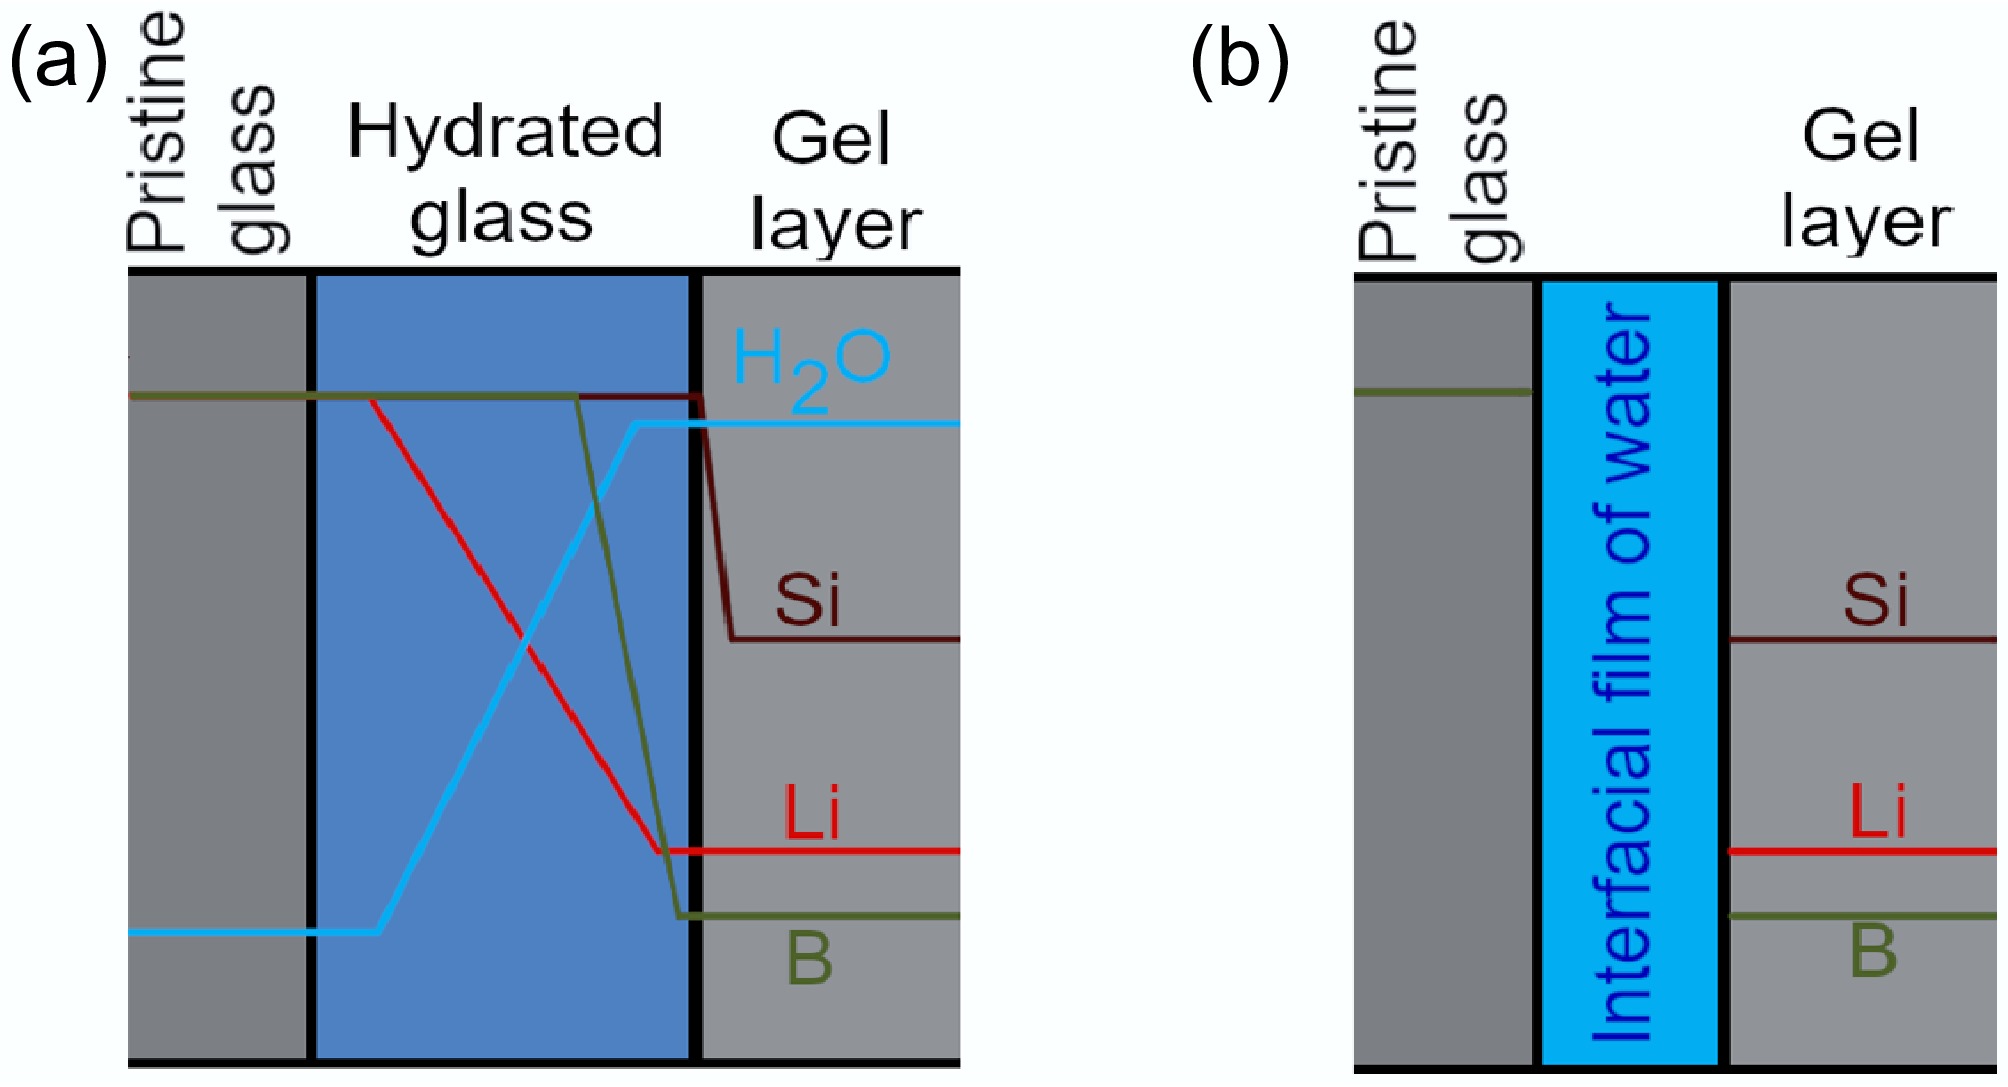
The mechanisms outlined in 'classical' interdiffusion models and the interface-coupled dissolution-precipitation model predict substantially different elemental profiles for mobile glass species (Fig. 5). The former predicts interdiffusion and similarly rapid B hydrolysis lead to a dissolution front for mobile glass species spatially separated from glass network (i.e., siloxane bond) hydrolysis, in turn forming a hydrated glass layer denuded of B, network modifying, and charge compensating species ahead of a gel layer. A component of this hydrated glass layer, such as an 'active zone' at the hydrated glass-gel interface, may undergo densification and porosity clogging through condensation and precipitation reactions to mature in its transport properties to present a nanoporous molecular sieve[17,27]. Contrastingly, following an interface-coupled dissolution-precipitation model, congruent hydrolysis by an interfacial film of water effectively presents a single dissolution front, with a passivating altered layer component later forming behind this front by precipitation[10−13]. Later formulations of this model considered interdiffusion processes, including the solid-state diffusion of reactive water species into the glass, to be rate-limiting at long times[15], wherein elemental dissolution fronts may be spatially separated.
The δ11B values initially indicating the congruent release of B isotopes from 6Li-Mg-EM with diffusive isotope fractionation at longer times were consistent with Li isotope analysis (δ7Li values) of the same solutions[47]. In these experiments, a maximum δ7Li value in solution was instead observed at 7 d, caused by the precipitation of Li-bearing Mg-phyllosilicate secondary minerals preferentially removing 6Li from solution, before the solution was enriched in 6Li back towards the pristine glass δ7Li value due to the faster diffusion of 6Li over 7Li across a passivating altered layer component between 7 and 98 d. In the absence of a measurable pH effect (Fig. 1c), the δ7Li and δ11B values for the same solutions decreasing back toward their respective pristine glass values at different times showed that this diffusive isotope fractionation for both B and Li was not caused by a passivating altered layer component behind a congruent dissolution front. That is, if B and Li leached congruently from the glass at the same dissolution front and simultaneously encountered the same diffusive barrier to dissolution, the solution δ7Li and δ11B values would decrease simultaneously. Rather, this result was consistent with models which predicted spatially separated dissolution fronts for Li and B, wherein the altered layer component about these fronts (i.e., the hydrated glass) becomes a passivating interphase at long times. In this view, it is postulated that the hydrated glass about the Li dissolution front began densifying into a diffusive barrier first, prior to the B hydrolysis front.
Overall, the decreasing solution δ11B and δ7Li values for 6Li-Mg-EM at different times were consistent with diffusion across a densified altered layer component that encompassed spatially separated Li and B dissolution fronts, as opposed to a single diffusive barrier to transport behind a congruent dissolution front.
Boron isotope releases and altered layer passivation in the absence of magnesium
-
A pristine glass δ11B value of −767.54 ± 6.44‰ (11B/10B ratio of 0.941 ± 0.026 mol mol−1; 2SD, n = 9) was measured for 10B-ISG by LA-MC-ICP-MS. Notably, 10B-ISG experiment solution δ11B values at 6 h (−741.97 ± 2.75‰; 2SD, n = 3) were fractionated +25.57 ± 7.00‰ (2SD) relative to the pristine glass (Fig. 2a), with no measurable change after 12 h (−744.37 ± 0.79‰; 2SD, n = 3). The apparent lower secondary mineral precipitate numbers observed for 10B-ISG than 6Li-Mg-EM at the end of the experiments (Supplementary Fig. S1), alongside this δ11B value greatly exceeding that attributable to B sorption or incorporation into secondary phases at 28 d during the 6Li-Mg-EM experiments (+2.34 ± 0.74‰; 2SD, n = 5; Fig. 2b), suggested that this fractionation was inconsistent with interactions with secondary mineral precipitates. Further, previous 11B MAS-NMR studies on ISG compositions under similar experimental conditions provided no evidence of [BO3] units leaching preferentially to [BO4]− units[102]. As such, this initial fractionation was attributable to either (1) 10B-ISG powder surfaces (> 1.1 µm, from the 28-day solution renewal experiment eB values; Fig. 1b) being depleted in 10B during sample preparation, (2) disagreement between the NIST 610 and NIST 951 standard value scales (Eq. [4]) for isotopically spiked samples, or (3) a large fraction of released B being sorbed to the altered layer surface in the absence of precipitates resulting in substantial isotope fractionation[75]. Similarities between the 6 and 12 h solution δ11B values (−741.97 ± 2.75‰ and –744.37 ± 0.79‰, respectively; 2SD, n = 3) and the solution renewal experiment 1-day δ11B value (−744.32 ± 0.52‰; 2SD, n = 2) supported the view that either mechanism (1) or (2) produced this fractionation, but these results could not precisely elucidate the underpinning mechanism.
Solution δ11B values at 1 and 7 d decreased to −746.29 ± 0.60‰ and − 746.83 ± 0.78‰, respectively, indicating these solutions were enriched in 10B relative to the 6 and 12 h solutions (Fig. 2a), with B concentrations increasing from 30.7 ± 3.1 µg mL−1 at 12 h (1SD, n = 3) to 78.8 ± 7.9 µg mL−1 at 7 d (1SD, n = 3) (Fig. 4b). Whilst no change in the 10B-ISG solution δ11B values was observed after 28 d, alongside a slight increase in solution B concentration (Figs 2a & 4b), the solution [B]/[Na] ratio increased to above (1SD) the pristine glass value (Fig. 4d). Contrary to the 6Li-Mg-EM experiments, this increased ratio suggested limited interactions occurred between B and secondary minerals or the altered layer. Whilst the solution B concentration did not change measurably (1SD) between 28 and 112 d, the δ11B value increased relative to the 7-day value and was within uncertainty (2SD) of the initial 6 and 12 h values.
To test whether congruent dissolution at a measured pristine glass δ11B value of −767.54 ± 6.44‰ alongside sorption or coprecipitation processes alone could account for these results, a mass balance approach was applied using the 6 h solution δ11B values and the molar amounts of B in solution at each subsequent time (further details given in Supplementary File 1, Method 1.3). Assuming 14% of the total leached B was retained as B in either a sorbed or coprecipitated fraction[39], these calculations showed that a sorbed or coprecipitated fraction δ11B value of −122.64‰ at 12 h and −137.64‰ at 112 d would be required to recreate the observed trends. This suggested the effective pristine glass δ11B value more closely corresponded to that observed at short alteration times.
Whilst the normalised B releases at 1 d in the 10B-ISG solution renewal experiment showed the altered layer had a modest protective effect against further dissolution, B releases subsequently increased almost linearly with time until the normalised B releases in the non-renewed and solution renewal experiments were within uncertainty (1SD) at 28 d (Fig. 1a). This showed the altered layer formed on 10B-ISG after 28 d was not yet sufficiently protective, as controlled by properties such as gel density and porosity[112], to limit transport to the pristine glass at longer times after solution renewal. Indeed, the absence of a substantial decrease in solution δ11B values at > 28 d, as observed for the 6Li-Mg-EM solutions, suggested diffusion through a nanoporous altered layer component at longer times did not occur for 10B-ISG (Figs 2a & 4b). Further, the solution renewal experiment δ11B values (1) at 1 d (−744.32 ± 0.52‰; 2SD, n = 2) was within uncertainty of the 6 h non-renewed experiment value (−741.97 ± 2.75‰; 2SD, n = 3), (2) increased at 7 d (−738.50 ± 0.57‰; 2SD, n = 2), and (3) decreased to a pseudo-steady state value at 14, 21 and 28 d (−741.41 ± 0.91‰; 2SD, n = 8) within uncertainty of the non-renewed experiment 6 h value.
Overall, solution [B]/[Na] concentration ratios for 10B-ISG suggested secondary mineral or altered glass surface-aqueous B species interactions were comparatively limited in the absence of Mg. Further, the altered layer, whilst initially protective following solution renewal, did not remain protective against further dissolution at long times. To further investigate the mechanisms underpinning these changes in solution δ11B values, numerical diffusion models were fitted to the 10B-ISG experiment δ11B values, as described in the following section.
Temporally and spatially dependent apparent diffusivities
-
Three numerical models were fitted to the10B-ISG experiment solution (non-renewal) δ11B values to investigate whether diffusion alone could account for the observed trends (Fig. 6). All models represented solutions to Fick's second law for diffusion assuming that the glass presents a non-stationary, unreactive, semi-infinite planar source[17], but differed in their assumed apparent diffusivities for the B isotopes as a function of time and distance across the altered layer. Whilst Model 1 assumed a single apparent diffusivity for each B isotope across the altered layer as a function of time, Model 2 extended Model 1 through allowing diffusivities to vary temporally with the release of B but still assumed a single apparent diffusivity across the altered layer. Model 3 also extended Model 1 but through varying apparent diffusivities spatially across the altered layer as a function of water species concentration (approximated as the inverse of total B concentration at each point), where these spatial diffusivities also evolved as a function of time. In this view, Model 1 (constant diffusivities) represented a bulk altered layer structure that remained constant in its properties with time. Model 2 (temporally dependent diffusivities) accounted for decreasing apparent diffusivities as the altered layer densified but assumed that this densification and the evolution of altered layer porosity were spatially constant across a bulk altered layer. Finally, Model 3 (spatially dependent diffusivities) represented an altered layer which non-uniformly densified and underwent porosity closure such that access to rate-limiting water species for the hydrolysis of B network bonds and the subsequent diffusive release of B, and hence apparent diffusivities, was a function of distance through the altered layer. Further details on these models are given in the methodology section and Supplementary File 1 (Method 1.1), and fitting parameters and fitting results are reported in Supplementary Table S2.
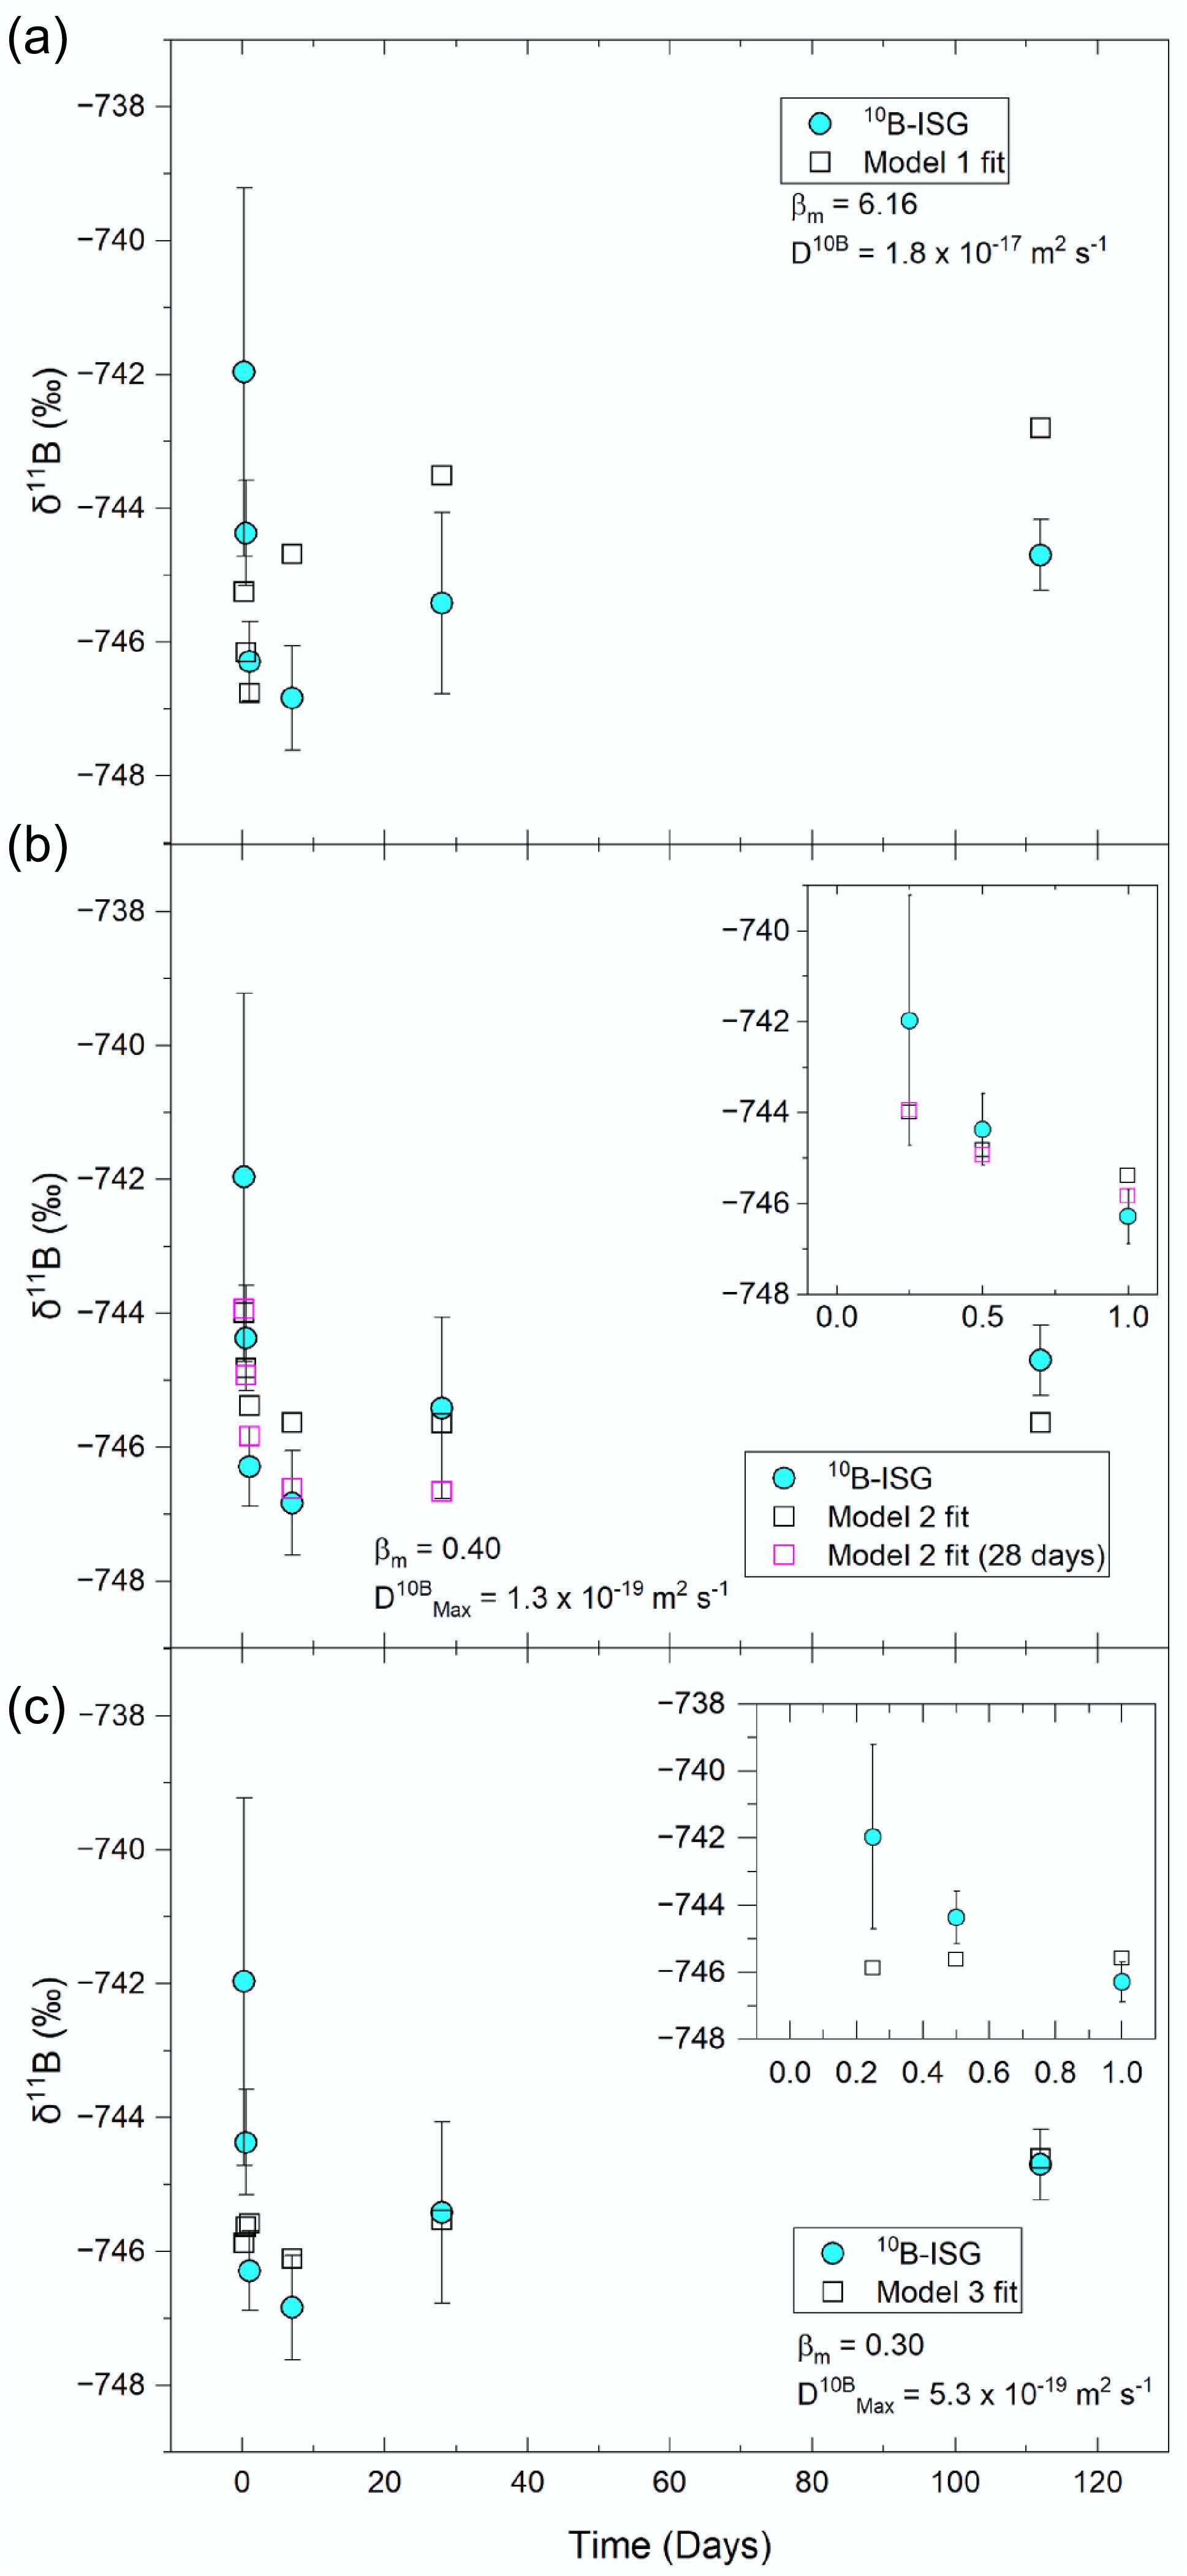
Figure 6.
Representative diffusion model fits to the measured 10B-ISG (non-renewal) experiment solution δ11B values using (a) Model 1, (b) Model 2, and (c) Model 3 (data provided in Supplementary Table S2). Model 1 assumed a constant bulk apparent diffusivity of B in the altered layer, Model 2 assumed a bulk apparent diffusivity which was time-dependent, and Model 3 assumed apparent diffusivities were spatially dependent in the altered layer upon access to water species. Fits varied βm and D10B using eB as distance (Model 1), varied βm whilst holding D10BMax using eB-eSi as distance (Model 2), and varied βm, βc, α and D10BMax using eB as distance (Model 3) (data for these fits are given in rows 2, 5 and 7 of Supplementary Table S2, respectively). For Model 2, additional fits are given for the model fitted to the ≤ 28-d data (excluding the 112-d value).
The mass balance calculations of the previous section indicated that sorbed fraction δ11B values < −100‰ would be required to fit these values, assuming a pristine glass δ11B value equal to that measured by LA-MC-ICP-MS. As such, a pristine glass δ11B value equal to the average of the 6-hour non-renewed experiments and solution renewal experiment 14, 21 and 28-d values (−741.54‰) was assumed for modelling.
Model 1 was a solution to Fick's second law for diffusion from a semi-infinite planar source[113] and assumed a constant apparent diffusion coefficient for B across the altered layer (spatially) and with time[114]. This model was unable to account for the observed δ11B values and instead predicted initially lower δ11B values which gradually increased with time (Fig. 6a). In Models 1 and 2, the apparent diffusivity, D, of 11B is related to that of 10B by the inverse ratio of their respective masses, m, and an empirical parameter, βm, following Eq. (5)[115−117]. Note that a βm of 0.500 is applicable to ideal gases at low pressure, and a value of 0.032 ± 0.002 has been reported for B diffusion between pegmatite forming melt diffusion couples at 850 to 1250 °C and 100 MPa[76]. The βm > 1 produced in the Model 1 fits indicated that a single, constant apparent diffusivity could not explain these results.
$ {\mathit{D}}^{11\mathit{B}}={{\mathit{D}}^{10\mathit{B}}\left(\dfrac{{\mathit{m}}^{10\mathit{B}}}{{\mathit{m}}^{11\mathit{B}}}\right)}^{{\mathit{\beta }}_{\mathit{m}}} $ (5) Extending this model by assuming a time-dependent bulk D10B in the altered layer which was proportional to the release rate of B (Model 2) fitted the measured values to within 2SD when times ≤ 28 d were considered, but this model could not fit the δ11B value at 112 d (Fig. 6b). Conversely, assuming that D10B was spatially dependent on the local concentration of water species within the altered layer (approximated as the inverse of the B concentration modelled at each point)[17], Model 3 fitted the δ11B values at ≥ 7 d to within 2SD and was able to account for the increase in δ11B values between 7 and 112 d but overestimated fractionation at shorter times (Fig. 6c). These fits suggested that solution δ11B values could be described as a diffusion process with either (1) a time-dependent D10B (Model 2) with B sorption, coprecipitation processes or congruent dissolution in the absence of diffusion at longer times (112 d), resulting in higher δ11B values, or (2) an initially time-dependent D10B (Model 2) that gradually transitioned to a spatially-dependent D10B between 7 and 112 d as altered layer properties evolved, such that access to water-species for B diffusion became increasingly rate limiting (Model 3). The latter view was consistent with reported literature data on B elemental profiles in cross sections of ISG coupons altered in solutions saturated with respect to amorphous silica, wherein B elemental profiles were fitted well at longer times (≥ 209 d) but not at shorter times (≤ 7 d) by a numerical diffusion model with similar assumptions to Model 3[17].
For both Model 2 and Model 3, βm (0.199 to 0.399) was an order of magnitude higher than that reported for diffusion under high temperature and pressure conditions in pegmatite forming melts (0.032)[76] and also an order of magnitude higher than that reported for Li isotope fractionation during glass dissolution at short times (0.019 to 0.078)[45]. This suggested additional processes contributed to the measured δ11B values: (1) the simultaneous congruent release of B during diffusion through glass network hydrolysis reactions[45], (2) reactive diffusion, wherein ion-exchange with charge compensators contributed to [BO4]− unit dissolution[25], (3) apparent diffusion, wherein B interacted with the altered layer as it diffused out of the glass and (4) B retention, wherein B was sorbed onto or coprecipitated with secondary minerals or was retained in the altered layer through transport effects. Whilst mass balance calculations could resolve these simultaneous processes (e.g.,[46]), further work is first required to constrain the molar quantities and δ11B values associated with these reservoirs as model inputs.
Assuming a pristine 10B-ISG δ11B value of −741.54‰, solution δ11B values in the solution renewal experiment could not be fitted solely using a diffusion model as they were enriched in 11B relative to the pristine glass at 7 d (Fig. 2). Applying Models 2 and 3 to the solution renewal experiment δ11B values using parameter values obtained from fitting these models to the non-renewed experiment δ11B values yielded fit residuals which approximately followed the same trend as the measured solution renewal experiment δ11B values (Supplementary Figs S3 & 4), suggesting that diffusion did not contribute substantially to these δ11B value trends. In turn, these results were consistent with the release of B from 10B-ISG following solution renewal being predominantly congruent. In this view, the increase in the solution renewal experiment δ11B value at 7 d coincided with the congruent dissolution of an altered layer component enriched in 11B through the preferential outward diffusion of 10B prior to solution renewal, whilst the return to the 6 h (non-renewed) δ11B value from 14 d onwards suggested this 11B-rich region had been congruently dissolved. The absence of a protective altered layer for 10B-ISG may be attributed to the extent of dissolution and the altered layer thickness (0.52 ± 0.11 µm and 4.88 ± 1.85 µm for 10B-ISG and 6Li-Mg-EM, respectively, at 28 d) for 10B-ISG being insufficient for such a layer to form through in situ condensation reactions and precipitation[32].
Overall, solution δ11B values for 10B-ISG were fitted well with numerical diffusion models at ≤ 28 d, assuming temporally dependent apparent diffusivities for B isotopes across the bulk altered layer, and at ≥ 7 d, assuming spatially dependent apparent diffusivities for B isotopes as a function of water species concentration in the altered layer. However, relatively high corresponding empirical βm parameters indicated other mechanisms also contributed to solution δ11B values. Following solution renewal, δ11B values were most consistent with a congruent release mechanism for B.
-
Understanding the dissolution mechanisms of glasses is crucial for predicting the long-term release rates of contaminants from waste glasses during aqueous dissolution by groundwater, such as the release of radionuclides from vitrified waste glasses in a highly engineered geological disposal facility over geological timescales. Here, B isotope tracing techniques applied to the resulting solutions from alteration experiments on 6Li-Mg-EM and 10B-ISG glasses showed that the dominant B release mechanisms were different between these two glasses throughout time. For the former, stable solution δ11B values at ≤ 7 d, which increased at 28 d, were consistent with the congruent release of B isotopes controlled by congruent glass network hydrolysis driven by Mg-phyllosilicate precipitation coupled with B-solid phase interactions (i.e., sorption or coprecipitation), enriching the solutions in 11B. However, decreasing δ11B values at > 28 d were inconsistent with mass balance calculations assuming congruent dissolution, even when conservatively considering the absence of sorption or B coprecipitation processes. Alongside solution renewal experiments evidencing that the altered layer at 28 d strongly inhibited further dissolution, these results were consistent with diffusion across a protective altered layer component at 98 d predominantly controlling the long-term release of B. Further, differences in the timing of this apparent diffusive isotopic fractionation between the δ11B values (98 d) and δ7Li values (28 d) of the same solutions suggested this barrier to diffusion encompassed spatially separated Li and B dissolution fronts. For 10B-ISG, whilst high initial δ11B values and associated mass balance calculations suggested differences between the measured pristine coupon and powder δ11B values, accounting for this difference showed δ11B values initially decreased at times ≤ 7 d before increasing again up to 112 d. A diffusion model considering a time-dependent bulk apparent diffusion coefficient in the altered layer fitted the measured δ11B values well at times ≤ 28 d, but at 112 d either (a) congruent dissolution in the absence of further diffusion, (b) further B sorption or coprecipitation processes, or (c) a spatially dependent apparent diffusion coefficient in the altered layer was required to account for an increase in the δ11B value. However, solution renewal experiments showed that the altered layers of 10B-ISG were not protective following 28 d of dissolution, consistent with the apparent absence of a sharp decrease in the solution δ11B values, attributable to diffusion through a protective, densified altered layer component, as observed for 6Li-Mg-EM. These results highlight the importance of composition as a control on glass dissolution mechanisms and support the concept of a unified mechanistic model comprising both incongruent and congruent dissolution paradigms throughout time.
We thank Giulio Lampronti (Department of Materials Science & Metallurgy, University of Cambridge), and Iris Buisman (Department of Earth Sciences, University of Cambridge) for their technical support during the XRD and SEM measurements, and Aleksey Sadekov (School of Earth Sciences, University of Western Australia) for LA-MC-ICP-MS analysis of the samples.
-
It accompanies this paper at https://doi.org/10.48130/ebp-0025-0004.
-
Not applicable.
-
The authors confirm their contributions to the paper as follows: conceptualization: Farnan I; methodology: Goût TL, Guo R, Misra S; validation: Goût TL, Guo R; investigation: Goût TL, Guo R, Misra S, Bohlin MS; writing - original draft: Goût TL, Guo R, Tipper ET, Bohlin MS, Farnan I; writing - review & editing: Goût TL, Guo R, Misra S, Tipper ET, Bohlin MS, Hu Y, Farnan I; resources: Misra S, Tipper ET, Farnan I; supervision: Tipper ET, Farnan I; formal analysis, visualization: Goût TL; funding acquisition: Goût TL, Farnan I. All authors reviewed the results and approved the final version of the manuscript.
-
The data that support the findings of this study are available from the corresponding author upon reasonable request.
-
Thomas L. Goût was supported by the National Natural Science Foundation of China (NSFC) Research Fund for International Young Scientists programme (RFIS-I, Grant No. W2433099). The authors acknowledge financial support from UKRI EPSRC under an Industrial CASE award with Nuclear Waste Services (Grant No. EP/M507350/1).
-
The authors declare that they have no conflict of interest.
-
Full list of author information is available at the end of the article.
- Supplementary File 1 Diffusion models. Mass balance calculations: 98-day 6Li-Mg-EM solutions. Mass balance calculations: 10B-ISG solutions.
- Supplementary Table S1 Solution pH90°C, B concentrations, B to Na ratios, normalised boron releases, altered layer thicknesses and δ11B values as a function of time for the 6Li-Mg-EM and 10B-ISG experiments
- Supplementary Table S2 Fit parameters and results from the diffusion models applied to the 10B-ISG non-renewed solution 11B/10B ratios.
- Supplementary Fig. S1 Secondary electron images of pristine 6Li-Mg-EM (a), 98-day altered 6Li-Mg-EM (b), pristine 10B-ISG (c), and 112-day altered 10B-ISG (d).
- Supplementary Fig. S2 Solution Si concentrations from equivalent experiments under the same conditions used herein on glasses without isotopic spiking (Li-Mg-EM and Li-ISG); experiments given in Gin et al. 2012 and Goût et al. 2019a, b[6,10,11].
- Supplementary Fig. S3 Residuals from applying Model 2 to the 10B-ISG solution renewal experiment solution δ11B values.
- Supplementary Fig. S4 Residuals from applying Model 3 to the 10B-ISG solution renewal experiment solution δ11B values.
- Copyright: © 2025 by the author(s). Published by Maximum Academic Press, Fayetteville, GA. This article is an open access article distributed under Creative Commons Attribution License (CC BY 4.0), visit https://creativecommons.org/licenses/by/4.0/.
-
About this article
Cite this article
Goût TL, Guo R, Misra S, Tipper ET, Bohlin MS, et al. 2025. Boron isotope tracers of diffusion during glass dissolution. Environmental and Biogeochemical Processes 1: e005 doi: 10.48130/ebp-0025-0004 

Boron isotope tracers of diffusion during glass dissolution
- Received: 02 July 2025
- Revised: 07 August 2025
- Accepted: 21 August 2025
- Published online: 30 September 2025
Abstract: The dissolution of waste glasses by groundwater presents a key mechanism for immobilised or encapsulated contaminant release over geological timescales. Accurately predicting glass dissolution rates remains a challenge to waste management, where a complete understanding of glass dissolution mechanisms is required to model the release and fate of contaminants. Here, this work investigated the suitability of boron isotope fingerprinting techniques for studying glass dissolution mechanisms, focussing on solid-state diffusion processes during boron release. Two glasses (magnesium-free 10B-ISG and magnesium-bearing 6Li-Mg-EM) were altered in deionised water at 90 °C for 0.25 to 112 d. Solution renewal experiments were used to further study altered surface layer properties. At ≤ 28 d, solution boron isotope (11B/10B) ratios for 6Li-Mg-EM were consistent with the apparent congruent release of boron alongside sorption/coprecipitation processes with secondary minerals, but decreasing solution 11B/10B ratios at > 28 d suggested diffusion occurred across the altered layer at a dissolution front spatially separated from that of lithium. Contrastingly, solution 11B/10B ratios for 10B-ISG at ≤ 28 d were fitted well using a diffusion model assuming a time-dependent apparent diffusion coefficient, but those at > 28 d were better explained by either sorption/coprecipitation processes with secondary minerals or a spatially-dependent apparent diffusion coefficient. The altered layer formed for 10B-ISG after 28 d was not protective following solution renewal, and renewed solution 11B/10B ratios were instead consistent with an apparent congruent release mechanism. This study presents boron isotopes as in situ tracers for studying glass dissolution mechanisms, assisting in predicting contaminant releases during waste glass-aqueous solution interactions.
-
Key words:
- Boron isotopes /
- Glass /
- Dissolution /
- Diffusion /
- Contaminant release /
- Surface contamination /
- Poisons and heavy metals