












-
Saline-alkali soils are a major constraint on agricultural productivity and ecosystem sustainability worldwide. Compared with neutral salt stress, which is mainly associated with osmotic stress and ion toxicity, alkaline stress, caused predominantly by NaHCO3 and Na2CO3, additionally exposes plants to high pH. The combined effects of high pH, ionic imbalance, and osmotic stress interfere with nutrient acquisition, disrupt cellular homeostasis, and cause severe growth inhibition and oxidative damage[1−6]. However, the genetic and molecular mechanisms underlying plant responses to alkaline stress remain less well understood than those associated with neutral salt stress.
A major advance in understanding alkaline tolerance was the identification of Alkaline Tolerance 1 (AT1), which encodes an atypical heterotrimeric G-protein γ subunit homologous to the rice grain size regulator GS3[7−9]. AT1 orthologs have also been characterized in multiple plant species, including rice[10], Arabidopsis[11], and soybean[12], where they play essential roles in overall plant development, particularly in reproductive organ formation and abiotic stress adaptation. Functional analyses have demonstrated that AT1 acts as a negative regulator of alkaline tolerance: overexpression of AT1 increases alkaline sensitivity, whereas knockout or genetic modification of AT1 enhances alkaline tolerance in several major graminaceous crops, including sorghum, rice, maize, millet, and wheat[7,13]. Mechanistic evidence further indicates that AT1/GS3 affects reactive oxygen species homeostasis through its association with PIP2 aquaporins, thereby influencing oxidative damage under alkaline conditions[7]. These studies establish AT1 as an important and conserved genetic regulator of alkaline tolerance, but current functional evidence has been obtained primarily from annual cereal crops.
Major grain crops such as rice and wheat experience substantial growth and yield impairments under saline-alkali conditions. Even salt-tolerant cultivars may fail to maintain stable yields as soil salinity and sodicity increase[14]. Crops such as maize and soybean exhibit even lower tolerance to these conditions[15,16]. In contrast, forage grasses—particularly naturally salt-tolerant species such as Leymus chinensis and Puccinellia tenuiflora—demonstrate superior salt tolerance[17,18].
Leymus chinensis is a dominant perennial forage grass widely distributed across the Eurasian Steppe and is naturally adapted to saline-alkali soils, drought, cold, and nutrient-poor environments. Its strong tolerance to alkaline conditions and its ecological and forage value make it an important species for studying stress adaptation and for the restoration and utilization of saline-alkali land[17−19]. Although several stress-responsive genes have been investigated in L. chinensis, the molecular basis of its exceptional alkaline tolerance remains insufficiently characterized[20,21]. To our knowledge, the AT1 homolog in L. chinensis has not been functionally characterized, and it remains unclear whether the negative regulatory function established in cereal crops is conserved in a naturally alkali-tolerant perennial forage grass.
In the present study, we cloned the AT1 homolog from L. chinensis, designated LcAT1, and analyzed its sequence characteristics, tissue-specific expression, and transcriptional response to alkaline stress. We subsequently evaluated its function by heterologous overexpression in rice and compared alkaline-stress phenotypes, superoxide accumulation, chlorophyll and malondialdehyde contents, antioxidant enzyme activities, and osmotic regulatory substances between transgenic and wild-type plants. This study was designed to determine whether LcAT1 retains the negative regulatory function reported for AT1 genes in cereal crops and to extend current knowledge of the AT1 family to a naturally alkali-tolerant perennial forage grass.
-
Leymus chinensis plants were obtained from the Ecological Grassland Animal Husbandry Research Center, College of Grassland Science, Shanxi Agricultural University (Taigu, Shanxi, China). The plants were clonally propagated through rhizomes derived from a single stock plant. Healthy ramets with uniform growth at the vegetative stage were selected and cultivated in a substrate consisting of vermiculite and peat at a volume ratio of 1:1. Roots were gently washed with sterile water to remove residual substrate, and plants were maintained in sterile water for 3 d to allow equilibration before alkaline stress treatment. The alkaline treatment consisted of a 75 mmol/L mixed-alkali solution containing 62.5 mmol/L NaHCO3 and 12.5 mmol/L Na2CO3 at a molar ratio of 5:1. The concentration and composition were adopted from the primary AT1 study by Zhang et al.[7], in which 75 mmol/L mixed alkali was selected following a concentration screening and was shown to reliably discriminate alkaline tolerance among sorghum accessions. The final pH and electrical conductivity of the solution were not measured during the original experiments. We therefore do not report estimated values, because both parameters may vary with the water source, temperature, and treatment matrix. Samples were collected at 0, 1, 3, 6, 12, 24, and 48 h post-treatment, immediately frozen in liquid nitrogen, and stored for subsequent real-time quantitative PCR (qRT-PCR) analysis.
Three-week-old wild-type rice (Oryza sativa L. cv. Zhonghua 11) and LcAT1-overexpressing transgenic rice plants with comparable growth status were used for the alkaline-stress experiments. Plants were subjected to the same alkali stress treatment protocol as described for L. chinensis. Samples were collected at the same seven time points and stored in liquid nitrogen for qRT-PCR analysis. For phenotypic and physiological analyses, 3-week-old plants were transplanted into pots containing a 1:1 mixture of garden soil and peat and allowed to establish for 2 weeks. The plants were then irrigated with the 75 mmol/L mixed-alkali solution for 7 d, whereas the corresponding control plants were irrigated with water. Samples were collected after treatment, immediately frozen in liquid nitrogen, and stored at −80 °C until physiological and biochemical analyses.
Cloning and sequencing of the LcAT1 gene in Leymus chinensis
-
Total RNA was extracted from fresh L. chinensis leaves using the OMEGA Plant RNA Extraction Kit (R6827). Approximately 100 mg of leaves were ground into powder using liquid nitrogen, then RNA was extracted following the kit protocol. Integrity was assessed via agarose gel electrophoresis, concentration was measured by spectrophotometry, and the extract was stored at −80 °C for later use. Total RNA was reverse transcribed using the TAKARA PrimeScript™ Reverse Transcription Kit (RR047A). Following genomic DNA removal, cDNA was synthesized and stored at −20 °C.
Based on the conserved sequences of AT1 homologs in species such as wheat and barley, primers were designed using Primer Premier 5.0. PCR amplification was performed using TAKARA PrimeSTAR GXL DNA Polymerase (R050Q). Amplification products were verified by agarose gel electrophoresis, followed by gel digestion and recovery of target fragments. Purification and concentration were performed using the SIMGEN Gel Recovery Kit (2001050). The recovered and purified DNA fragments were modified at their 3' ends using the TAKARA DNA A-Tailing Kit (No.6109), then ligated into the pMD19-T vector. The ligation product was transformed into DH5α competent cells, spread onto LB solid medium containing ampicillin, X-gal, and IPTG, and incubated overnight at 37 °C. Single colonies were picked for colony PCR verification. Positive clones were sent to Shanghai Life Science for sequencing. Verified bacterial cultures were expanded and stored at −80 °C with 50% glycerol.
Bioinformatics analysis and phylogenetic tree construction
-
The nucleotide sequence of the gene ORF region was translated into an amino acid sequence using the Translate tool on the ExPASy platform. The physicochemical properties of the protein (such as molecular weight and isoelectric point) were analyzed using the ProtParam tool, while the transmembrane domains were predicted using the TMHMM online tool. Subsequently, the secondary structure of the protein (such as α-helices and β-folds) was predicted using SOPMA. To further elucidate the three-dimensional conformation, the tertiary structure was predicted using homology modeling based on SWISS-MODEL. Finally, the LcAT1 protein sequence was submitted to NCBI for BLAST alignment to identify the most similar homologous sequences. These sequences were downloaded and used to construct a phylogenetic tree with MEGA software, clarifying its evolutionary relationships.
Analysis of LcAT1 expression levels
-
Healthy, uniformly growing L. chinensis plants were selected. Samples of roots, rhizomes, leaves, and stems were collected and rapidly frozen in liquid nitrogen. Three biological replicates were established for each tissue. Simultaneously, L. chinensis subjected to alkaline stress was sampled at specific time points and rapidly frozen in liquid nitrogen for later use. Total RNA was extracted from all samples and reverse-transcribed into cDNA to serve as qPCR templates.
Specific primers were designed based on the cloned LcAT1 gene sequence, with the L. chinensis Actin gene serving as the internal control. The qPCR reaction utilized TAKARA's TB Green® Premix Ex Taq™ II (RR820L), with a 25 μL reaction volume comprising 12.5 μL premix, 1.0 μL forward and reverse primers, 2.0 μL cDNA template (< 100 ng), and 8.5 μL sterile water. The program was set as follows: 95 °C pre-denaturation for 30 s, 40 cycles of 95 °C for 5 s, 55 °C for 30 s, and 72 °C for 30 s, followed by a final extension at 72 °C for 10 s. After the reaction, amplification specificity was analyzed via melting curve analysis. Data were processed using the 2−ΔΔCᴛ method to calculate relative gene expression levels.
Samples of transgenic rice subjected to alkali stress were collected at designated time points, rapidly frozen in liquid nitrogen, and processed for total RNA extraction using the same method as for L. chinensis. cDNA was reverse transcribed from the total RNA and used as a template. LcAT1 qPCR primers and rice Actin gene primers were employed, with reaction protocols and systems identical to those for L. chinensis real-time quantitative PCR.
Plant expression vector construction
-
The plant expression vector pBWA(V)H2STMVΩ was digested with BamHI and BsaI/EcoIII. The reaction mixture contained 20 μL (4.0 μL vector, 1.0 μL enzyme, 2.0 μL buffer, and 12.0 μL nuclease-free water). After 1 h of digestion at 37 °C, the digested products were purified. The target gene fragment was mixed with the linearized vector at an equimolar ratio. Biorun 2× EasyClone Mix (10.0 μL) was added to a total volume of 20 μL, and the mixture was incubated at 37 °C for 30 min for recombination. The recombinant product was transformed into DH5α E. coli competent cells, spread onto LB solid medium containing kanamycin (Kan), and incubated at 37 °C for 12 h.
A single colony was picked for PCR verification. Amplified products were analyzed by agarose gel electrophoresis. The culture containing the target band of approximately 4,675 bp was sent for sequencing verification. The correctly sequenced strain was expanded, and the plasmid was extracted and stored at −20 °C for future use.
Agrobacterium-mediated rice transformation
-
Plump rice seeds were selected, the husks removed, and sequentially disinfected with 75% ethanol for 2 min, followed by sterilization with 0.15% mercuric chloride for 15 min. After rinsing, the seeds were inoculated onto a callus induction medium and cultured at 26 °C under light for 20 d. Concurrently, Agrobacterium tumefaciens was activated on LB medium containing 50 mg/L kanamycin (cultured at 28 °C for 2 d). Prior to infection, Agrobacterium was transferred to a suspension medium (OD600 = 0.2) and co-infected with callus tissue (induced for 5−10 d) for 1.5 min. After absorbing excess bacterial solution, it was covered with sterile filter paper and air-dried in a laminar flow hood for 30 min. Subsequently, it was transferred to a co-culture medium (incubated overnight at 20 °C in the dark, then continued dark incubation at 25 °C for 2 d).
After co-culture, the callus was washed eight times with sterile distilled water (the last three washes soaked for 3−5 min), then immersed in a 500 mg/L cefonicid (Cn) solution for 30 min to remove residual Agrobacterium. After drying, it was transferred to selection medium (cultured at 32 °C with light for 14 d). Resistant callus was then transferred to differentiation medium (28 °C, 14-h light/10-h dark). When regenerated seedlings reached 3−4 cm in height, they were transferred to a rooting medium for cultivation into complete plants. Finally, genomic DNA from rice was extracted using the CTAB method, and positive plants were validated by PCR amplification of target fragments.
NBT staining of transgenic rice
-
After treating wild-type and transgenic rice with 75 mmol/L alkali solution for 60 h, leaf and root tip tissues were collected, rinsed with tap water, and blotted dry. The material was then immersed in NBT staining solution and stained at room temperature in the dark for 2−6 h until positive regions appeared deep blue, while negative regions showed light blue or retained their original color. After staining, the material was rinsed 3−5 times with distilled water, patted dry, and immersed in 95% ethanol (40 °C) for decolorization for 3−16 h (replacing ethanol periodically to thoroughly remove background pigments). Finally, the material was rinsed and stored in NBT sample preservation solution, photographed, and documented.
Determination of physiological and biochemical indicators in genetically modified rice
-
Catalase (CAT) activity assay: Using the Solarbio Catalase (CAT) Activity Detection Kit (BC0205), a 1 mL sample of the extraction solution was added to the samples and homogenized on ice. It was then centrifuged at 8,000 × g for 10 min at 4 °C. The supernatant was then transferred to ice for later use. The microplate reader was preheated for 30 min, and the measurement wavelength was set to 240 nm. A mix was made using 10 μL of the sample with 190 μL of working solution; a timer was started, and the initial absorbance values A1 and A2 were recorded after 1 min, and ΔA = A1 − A2 was calculated. CAT activity was calculated using the formula: CAT (U/g mass) = (ΔA × V_[reactant] ÷ [ε × d] × 106) ÷ ([V_(sample) ÷ V_(total sample)] × W) ÷ T = 459 × ΔA ÷ W.
Superoxide dismutase (SOD) activity assay: The Solarbio superoxide dismutase (SOD) activity assay kit (BC0175) was employed, following the same procedure as for CAT. The inhibition percentage was calculated using the formula: (ΔA_[blank] − ΔA_[sample]) ÷ ΔA_(blank) × 100%. SOD activity is calculated using the following formula: SOD activity (U/g mass) = (Inhibition percentage ÷ [1 − Inhibition percentage] × V reverse total) ÷ 1 mL ÷ (W × V sample ÷ V total sample) × F = 10 × Inhibition percentage ÷ (1 − Inhibition percentage) ÷ W × F.
Peroxidase (POD) activity determination: The Solarbio Peroxidase (POD) Activity Detection Kit (BC0095) was used, following the same procedure as for CAT. POD activity is calculated using the following formula: POD activity (U/g mass) = ΔA ÷ 0.01 × V_(reactant total) ÷ (W × V_[sample total] × V_[sample]) = T = 4,900 × ΔA ÷ W.
Malondialdehyde (MDA) content assay: Use the Solarbio malondialdehyde (MDA) content assay kit (BC0025), following the same procedure as for CAT. MDA content is calculated using the following formula: MDA content (nmol/g mass) = ΔA × V_(rev_total) ÷ (ε × d) × 103 ÷ (W × V_[sample] ÷ V_[ext]) × F = 32.258 × ΔA ÷ W × F.
Proline (Pro) content determination: The Boxbio Proline (Pro) content detection kit (AKAM003M) was used, following the same procedure as for CAT. Pro content is calculated using the following formula: Proline content (μg/g) = (x × V total sample)/W = x/W.
Betaine content determination: The Boxbio betaine content detection kit (AKAO019M) was used. Absorbance is measured as per the manual instructions. Betaine content is measured using the following formula: Betaine content (mg/g) = (x × V extraction)/W.
Soluble sugar content determination: The Solarbio soluble sugar content detection kit (BC0035) was used. Absorbance is measured as per the manual instructions. Soluble sugar content is measured using the following formula: Soluble sugar (mg/g mass) = (x × V1) ÷ (W × V1 ÷ V2) = 10 × x ÷ W.
Chlorophyll content determination: The Solarbio chlorophyll content detection kit (BC0995) was used. Absorbance was measured as per the instructions. Total chlorophyll content (mg/g mass) was calculated using the following formula: (33.7 × A645 + 13.4 × A663) × Vtit × F ÷ W ÷ 1,000 = 0.01 × (33.7 × A645 + 13.4 × A663) × F ÷ W.
Amino acid (AA) content determination: The Solarbio amino acid (AA) content detection kit (BC1575) was used. Absorbance was measured as per the manual instructions. Amino acid content (μmol/g mass) was calculated using the following formula: Amino acid content (μmol/g mass) = ΔA_(test tube) × (C standard ÷ ΔA standard tube) × V sample ÷ (W ÷ total V sample × V sample) × F = 1.25 × ΔA test tube ÷ ΔA standard tube ÷ W × F.
Soluble protein concentration determination: Solarbio's Bradford protein concentration assay kit (PC0010) was used. Absorbance was measured as per the instructions. Soluble protein concentration was calculated using the standard curve.
Statistical analysis
-
For the physiological and biochemical measurements, the experiment followed a two-factor factorial design consisting of two genotypes, wild-type rice and LcAT1-overexpressing rice, and two treatment conditions, control and 75 mmol/L alkaline treatment. Data are presented as the mean ± SD of n = 3 independent biological replicates. For each response variable, the effects of genotype, treatment, and the genotype×treatment interaction were evaluated using two-way analysis of variance (ANOVA). Differences were considered statistically significant at p < 0.05.
-
The complete coding sequence (CDS) of LcAT1 from L. chinensis is 495 nucleotides in length and encodes a protein of 164 amino acids. Physicochemical properties of the deduced LcAT1 protein were analyzed using the ProtParam online tool. The predicted molecular weight is 16,950.67 Da, and the theoretical isoelectric point (pI) is 8.46. Charged amino acids constitute 29% of the total residues, with negatively charged residues (Asp and Glu) accounting for 11% and positively charged residues (Arg and Lys) accounting for 18%. Among the 19 amino acid types present, cysteine (Cys) has the highest proportion (15.9%), followed by glycine (Gly) at 12.8%. Methionine (Met) has the lowest proportion, at only 0.6%. The instability index is 64.94, and the grand average of hydropathicity (GRAVY) is 0.009, indicating that the LcAT1 protein has a relatively high predicted instability index and hydrophobic characteristics. Transmembrane domain prediction using the TMHMM server suggested that LcAT1 contains no transmembrane domains. Secondary structure prediction with the SOPMA online tool indicated that the protein consists of 27.44% α-helix and 72.56% random coil. Tertiary structure modeling using SWISS-MODEL revealed that LcAT1 could be modeled using wheat (Triticum aestivum) GS-7A as a homologous template, which showed 95.12% sequence identity with LcAT1.
Sequence alignment identified 14 highly similar homologous protein sequences from the following species: Triticum aestivum (XP_044438014.1), Triticum dicoccoides (XP_037459998.1), Aegilops tauschii (XP_020199303.1), Hordeum vulgare (XP_044956204.1), Brachypodium distachyon (XP_014751957.1), Lolium perenne (XP_051214704.1), Lolium rigidum (XP_047046934.1), Oryza sativa (XP_015630073.1), Sorghum bicolor (XP_002465152.1), Zea mays (XP_020405097.1), Panicum hallii (XP_025797819.1), Panicum virgatum (XP_039825144.1), Setaria italica (XP_004984061.1), and Setaria viridis (XP_034571759.1). Multiple sequence alignment of LcAT1 with these homologous proteins was performed, and a phylogenetic tree was constructed using MEGA software (Fig. 1). Phylogenetic analysis revealed that LcAT1 from L. chinensis is most closely related to the orthologs from wheat, T. dicoccoides, barley, and A. tauschii, while it is more distantly related to those from sorghum, maize, and rice.
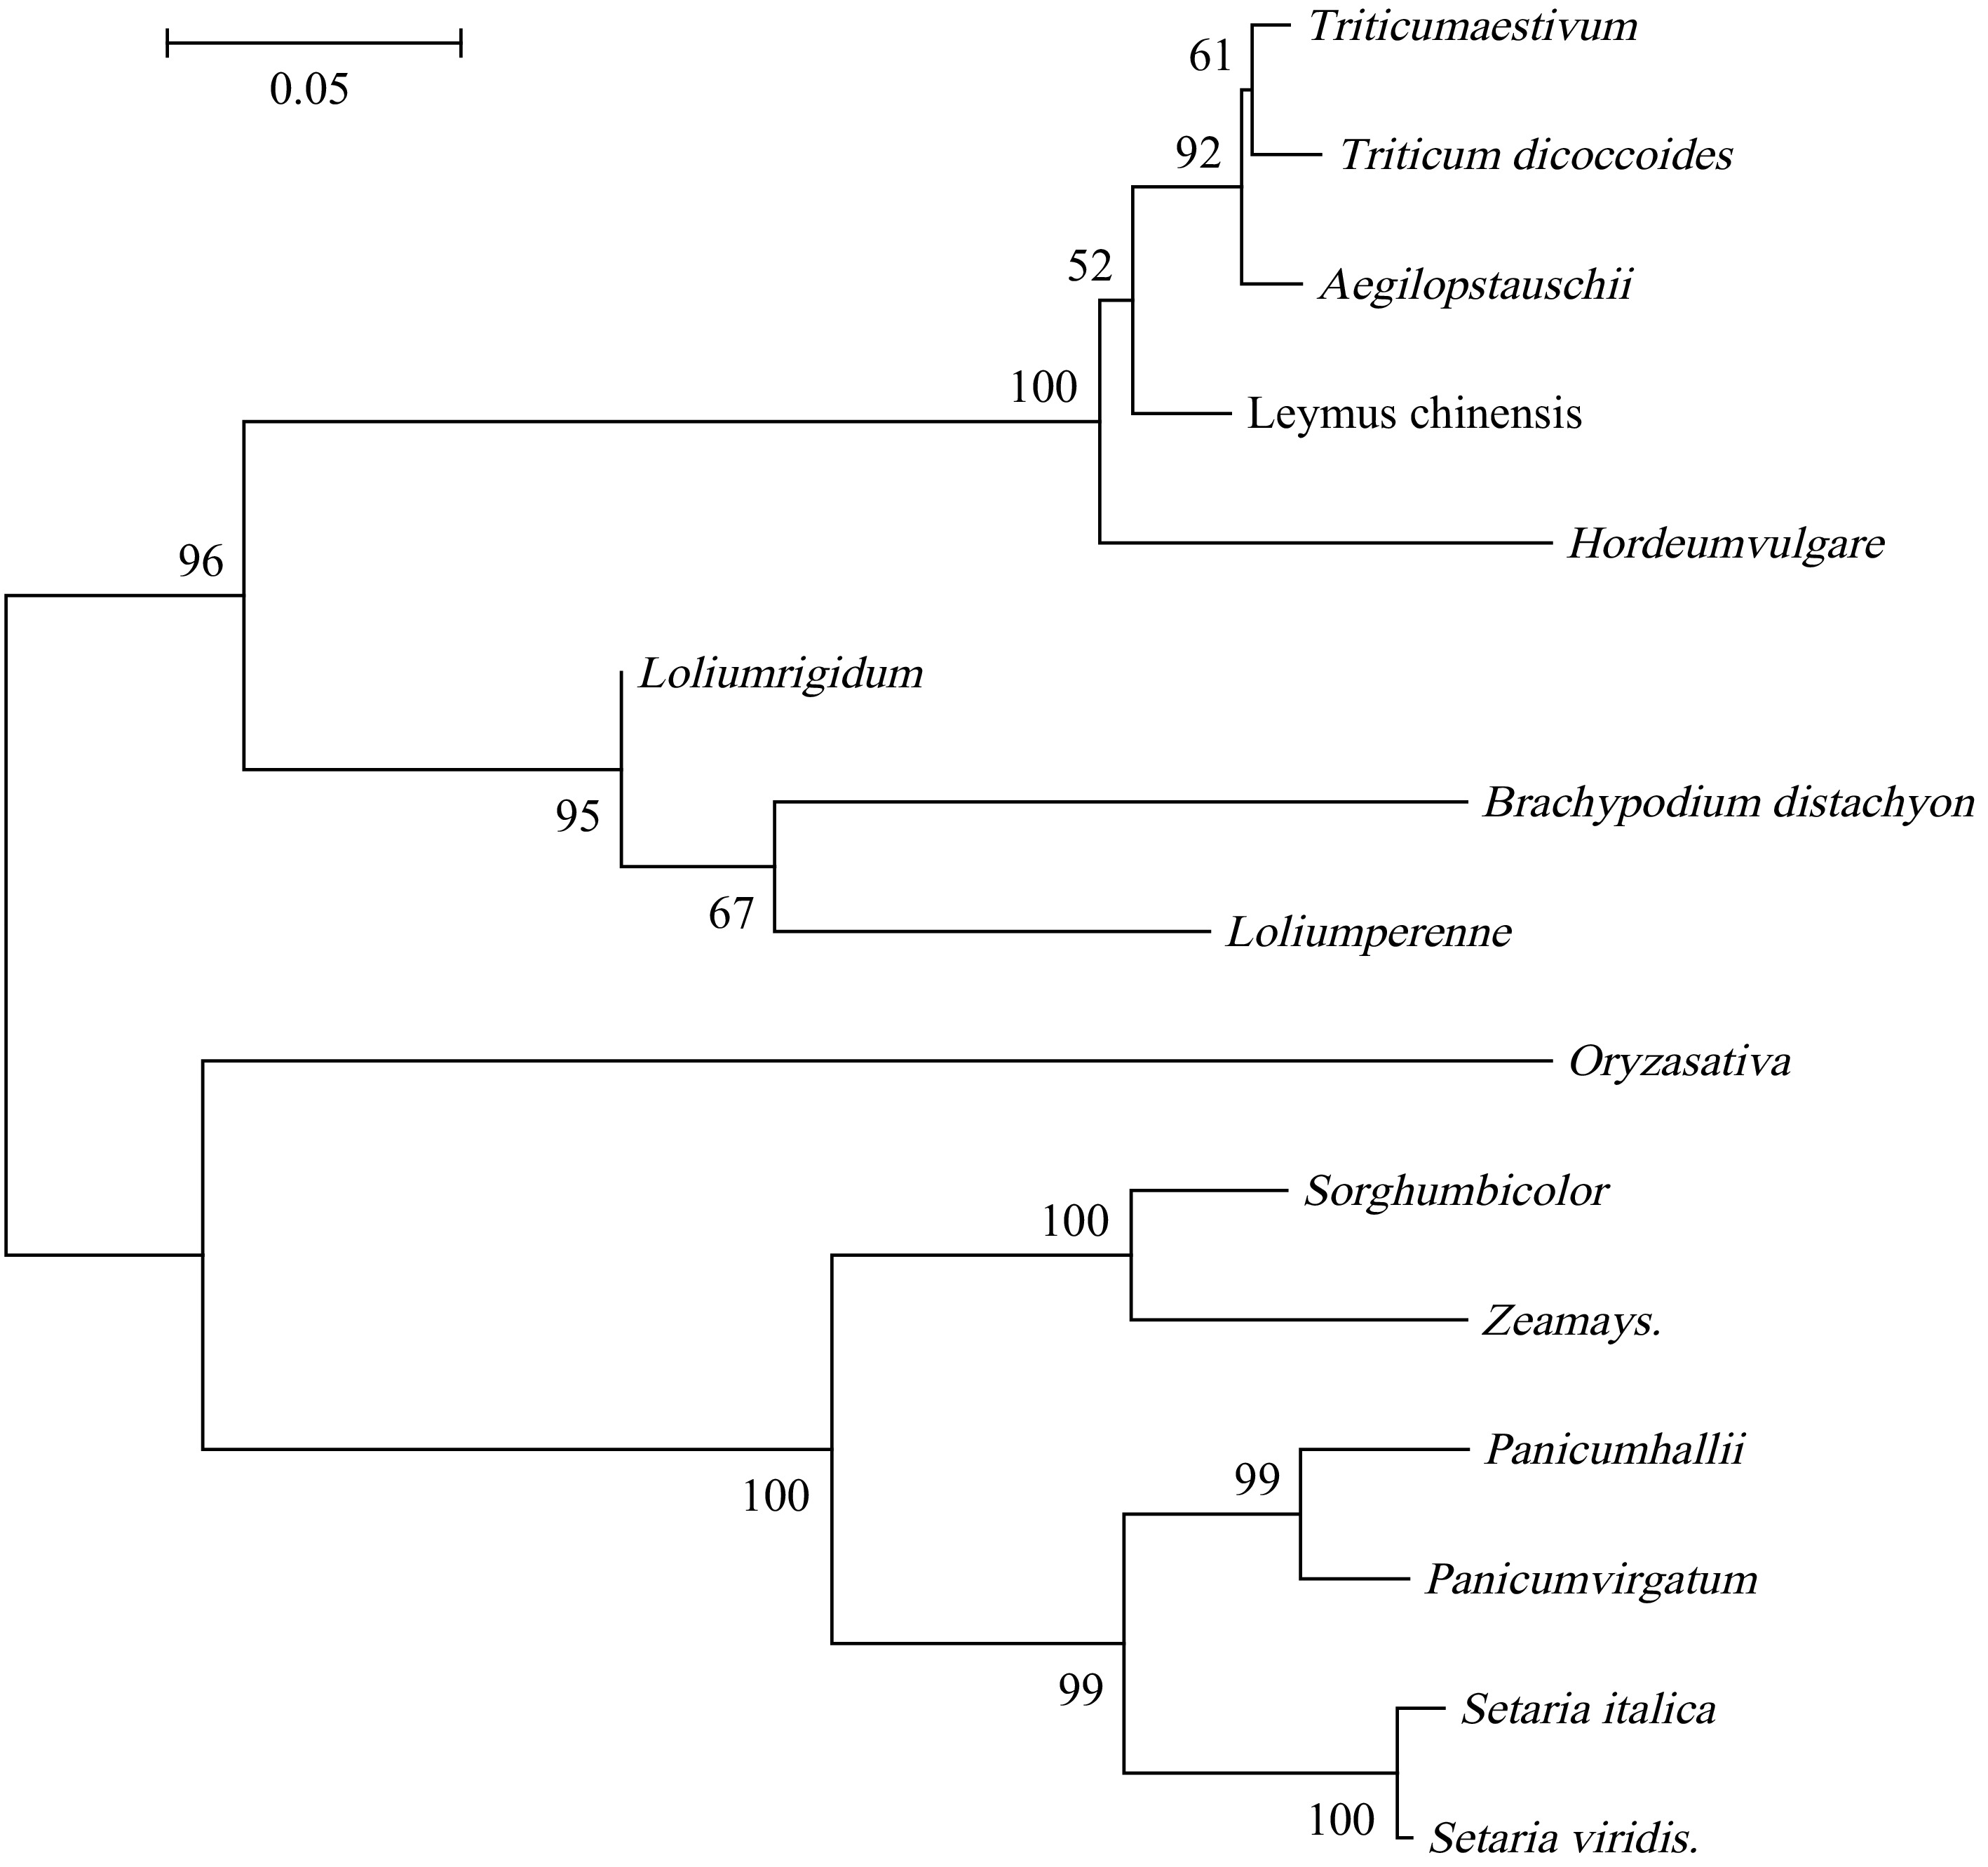
Figure 1.
Phylogenetic tree constructed based on multiple alignments of homologous sequences.
Tissue-specific expression of LcAT1 in Leymus chinensis and its induction by alkaline stress
-
To investigate the tissue-specific expression pattern of LcAT1 in L. chinensis, real-time quantitative PCR (qRT-PCR) was performed to examine its relative transcript levels in four distinct tissues: leaves, stems, fibrous roots, and underground stolons. The results revealed significant differences in LcAT1 expression among the tissues examined (Fig. 2a). The highest relative expression level was detected in underground stolons, followed by fibrous roots; both were significantly higher than those in aboveground leaves and stems. The lowest expression level was observed in stems. Specifically, the maximum expression in underground stolons was approximately 18.6-fold higher than the minimum expression in stems, while expression in fibrous roots was about 14.9-fold higher than in stems. Leaf expression was also slightly higher than that in stems. These findings indicate that LcAT1 exhibits a distinct tissue-specific expression pattern, with transcript accumulation predominantly localized in underground organs, including stolons and fibrous roots. Given the gene's association with alkali stress response, it is hypothesized that LcAT1 may contribute to the adaptation of L. chinensis to alkaline stress environments by modulating physiological processes in underground organs.
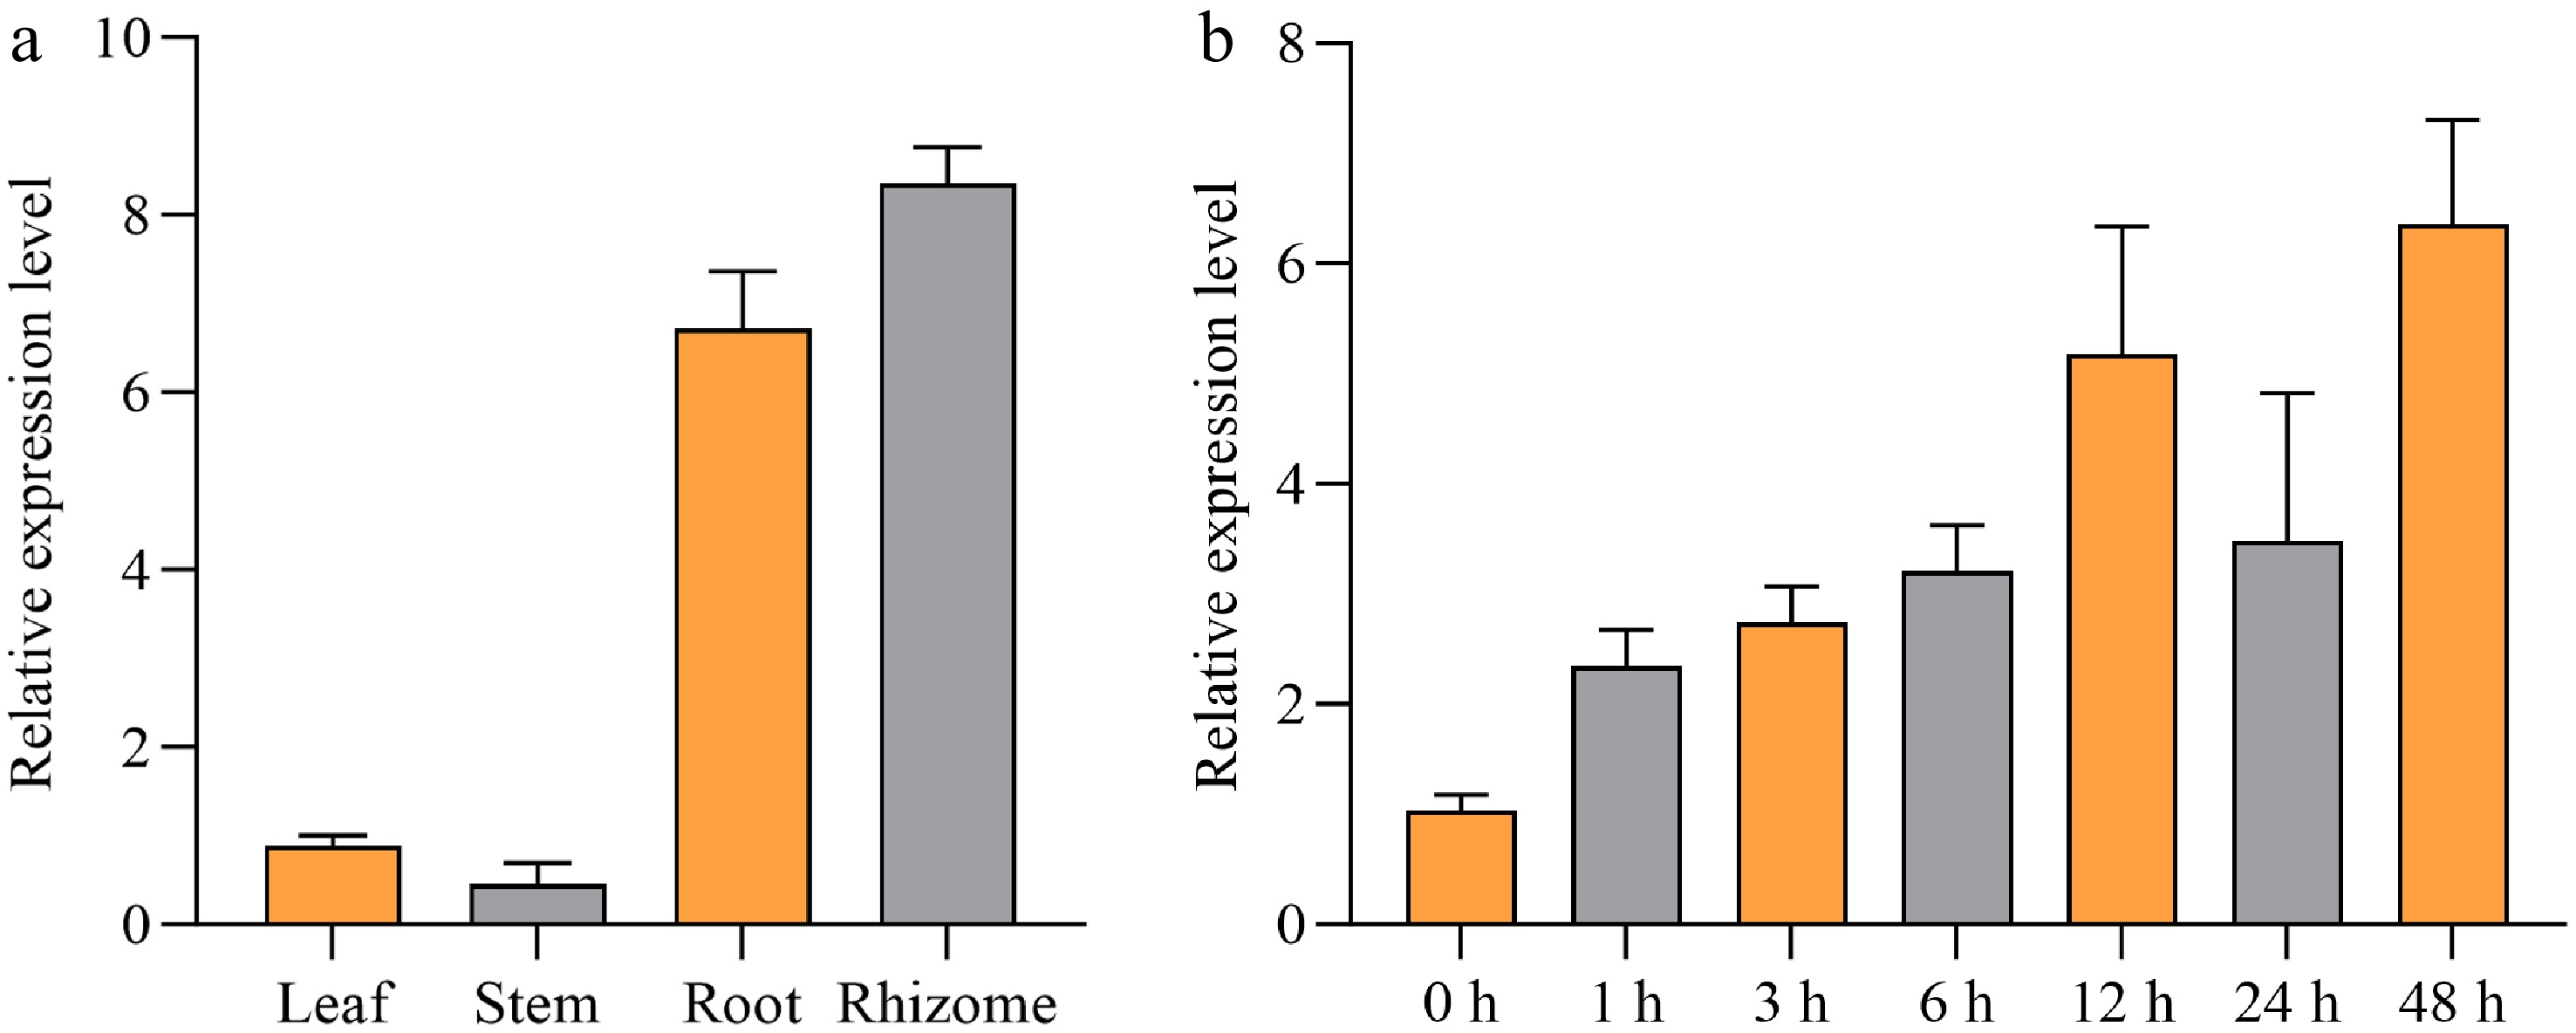
Figure 2.
Tissue-specific expression of LcAT1 in Leymus chinensis and its induction by alkaline stress. (a) qRT-PCR analysis of LcAT1 expression in leaves, stems, fibrous roots, and underground stolons under normal conditions. The Actin gene was used as an internal control. Values represent the mean ± SE of three biological replicates. (b) Time-course expression analysis of LcAT1 in roots of L. chinensis under 75 mmol/L alkaline stress at the indicated times (0−48 h). The Actin gene was used as an internal control. Values represent the mean ± SE of three biological replicates.
To investigate the expression dynamics of LcAT1 in response to alkaline stress, L. chinensis plants were treated with a 75 mmol/L alkaline solution. Root samples were collected at 0 h (control), 1, 3, 6, 12, 24, and 48 h post-treatment, and relative gene expression levels were quantified using qRT-PCR (Fig. 2b). Compared with the control (0 h), LcAT1 transcript levels showed a significant overall upregulation over time following alkali stress. Expression began to increase markedly after 1 h of treatment, continued to rise with prolonged stress duration, exhibiting a substantial surge at 12 h, and peaking at 48 h, reaching approximately 6.2-fold higher than the control level. Notably, expression at 24 h showed a slight decrease relative to 12 h but remained significantly higher than that in the control and at earlier time points. These results further confirm that LcAT1 is involved in the response of L. chinensis to alkaline stress, and its upregulation may be closely associated with the alkaline stress tolerance of this species.
Overexpression of LcAT1 increases the sensitivity of transgenic rice to alkaline stress
Expression pattern of LcAT1 in transgenic rice under alkaline stress
-
Transgenic rice plants overexpressing LcAT1 were subjected to alkaline stress using a 75 mmol/L alkaline solution. Samples were collected at 0 h (control), 1, 3, 6, 12, 24, and 48 h post-treatment, and the relative expression levels of LcAT1 were quantified via qRT-PCR. The results revealed distinct temporal dynamics of LcAT1 expression in response to alkaline stress. Compared with the control (0 h), LcAT1 transcript levels increased rapidly, peaking at 1 h post-stress at approximately 3.3-fold higher than the control level, followed by a sharp decline (Fig. 3). By 3 h, expression had decreased significantly from the 1 h peak, and at 6 h, it had returned to near-control levels. From 12 to 48 h, expression remained relatively stable, with no significant fluctuations. These findings indicate that the heterologously expressed LcAT1 in rice retains responsiveness to alkaline stress signals, with its response primarily concentrated in the early phase of stress exposure. This suggests that LcAT1 may be involved in early signal perception or in the initiation of the stress response during plant adaptation to alkaline conditions.
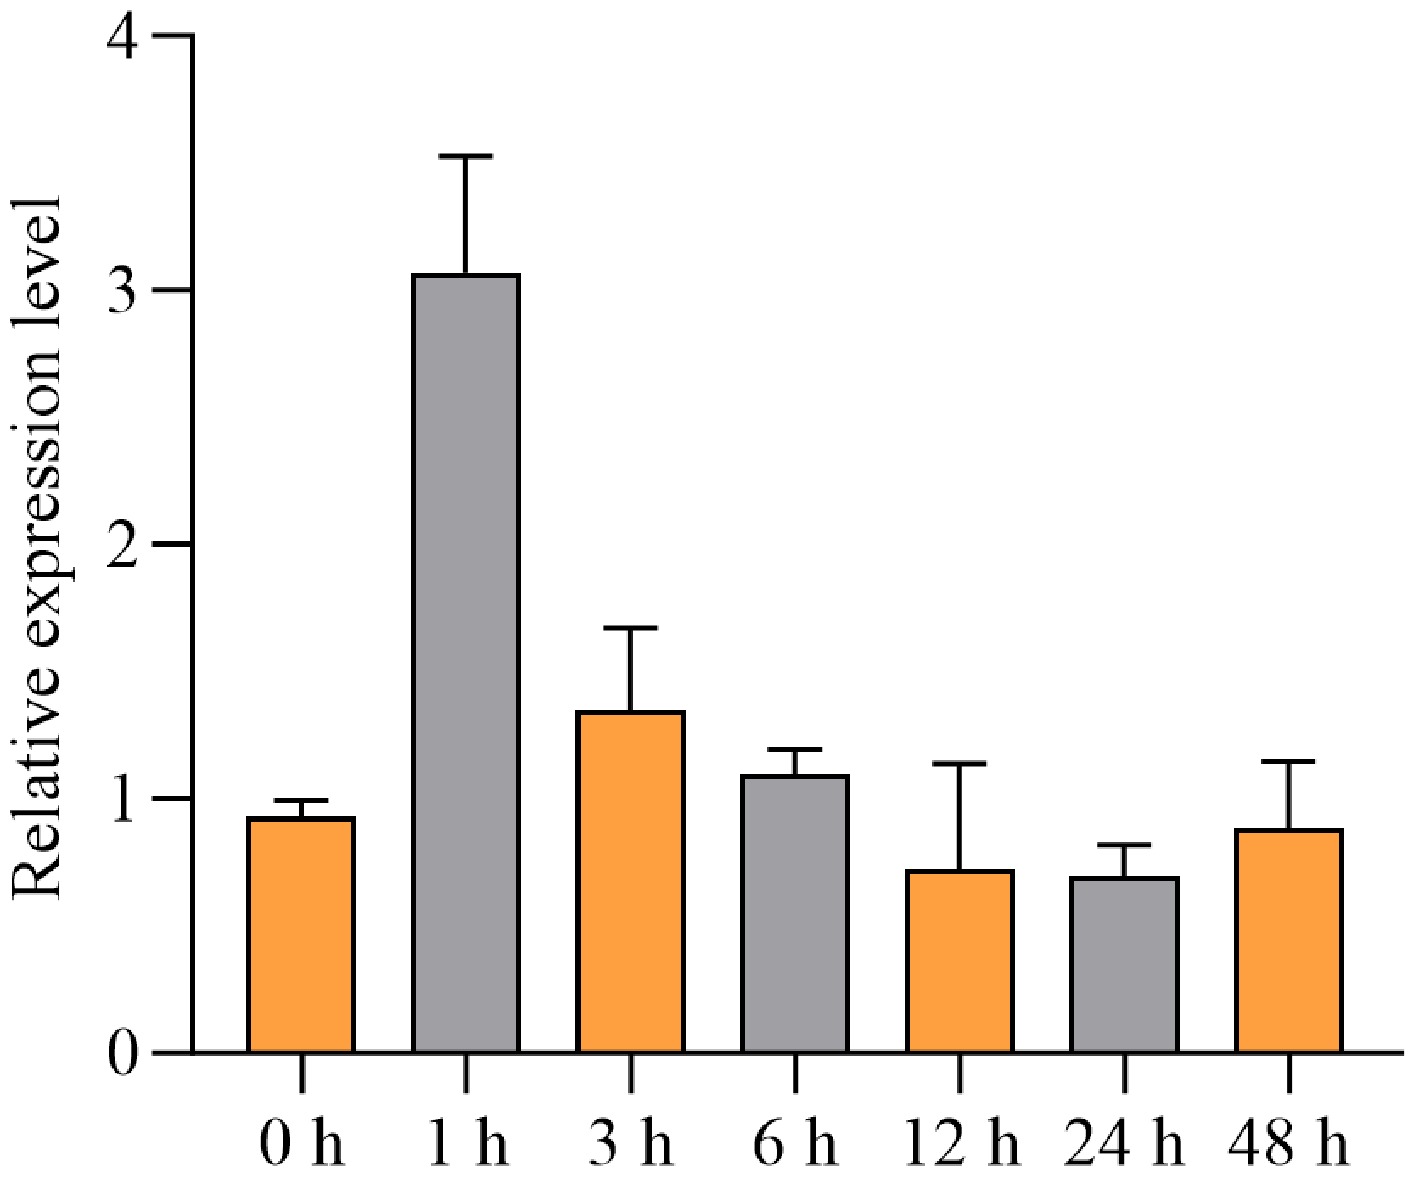
Figure 3.
Time-course qRT-PCR analysis of LcAT1 expression in roots of transgenic rice overexpressing LcAT1 following treatment with 75 mmol/L alkaline solution at the indicated times (0−48 h). The rice Actin gene was used as an internal control. Values represent the mean ± SE of three biological replicates.
NBT staining and alkaline stress cultivation
-
To assess the role of LcAT1 in alkaline stress tolerance, wild-type (WT) and transgenic rice overexpressing LcAT1 from L. chinensis were subjected to 75 mmol/L alkaline stress for 7 d. Under control conditions (plain water), no significant growth differences were observed between WT and transgenic plants. However, after 7 d of alkaline stress, the transgenic rice plants exhibited more severe wilting and chlorosis, whereas WT plants retained green leaves and did not completely wither (Fig. 4c, d), indicating that LcAT1 overexpression increased alkaline sensitivity in transgenic rice.
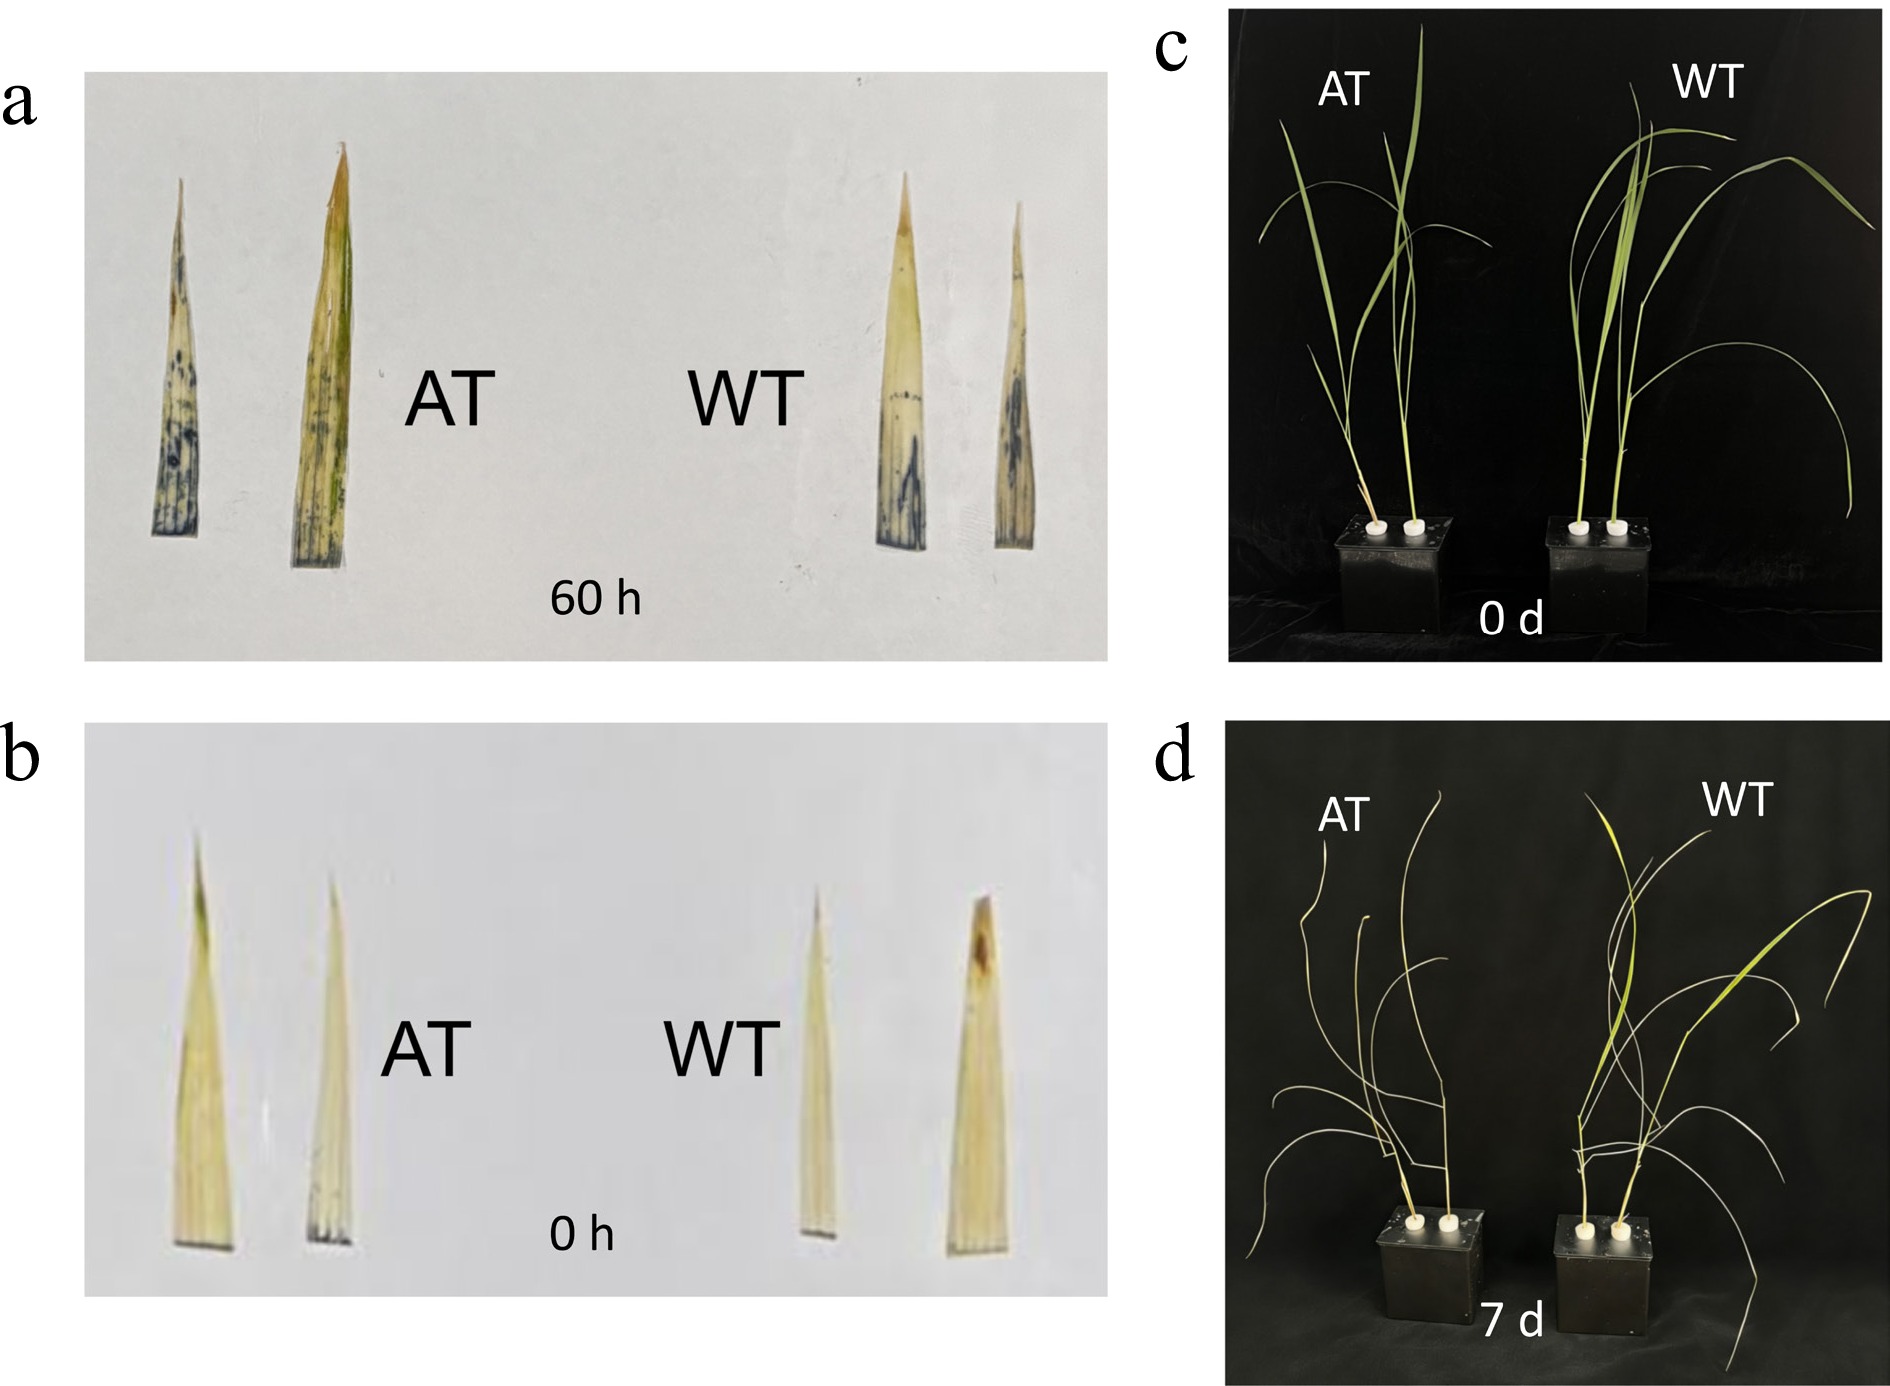
Figure 4.
Superoxide accumulation and phenotypic responses of wild-type and LcAT1-overexpressing rice under alkaline stress. NBT staining of leaves (a) before treatment and (b) after treatment with 75 mmol/L mixed alkali for 60 h. Dark blue coloration indicates superoxide anion (O2−) accumulation. (c) Wild-type (WT) and transgenic rice plants overexpressing LcAT1 before alkaline stress treatment. (d) WT and transgenic rice plants after treatment with 75 mmol/L alkaline solution.
Histochemical staining with nitroblue tetrazolium (NBT) was performed to detect reactive oxygen species (ROS) accumulation in rice leaves. Following alkaline stress, transgenic rice leaves exhibited higher levels of superoxide anion (O2−) and greater ROS accumulation compared to WT leaves (Fig. 4a, b), suggesting that LcAT1 may exacerbate oxidative damage under alkaline conditions.
Changes in chlorophyll content under alkaline stress
-
Two-way ANOVA revealed significant main effects of alkaline treatment, F(1, 8) = 153.0, p < 0.0001, and genotype F(1, 8) = 43.14, p = 0.0002, on chlorophyll content. However, the genotype × treatment interaction was not statistically significant, F(1, 8) = 1.526, p = 0.2518 (Fig. 5). Chlorophyll content was generally reduced under alkaline treatment, and the overall chlorophyll level differed between wild-type and LcAT1-overexpressing rice. However, the nonsignificant interaction indicated that the magnitude of the treatment-induced change did not differ significantly between the two genotypes.
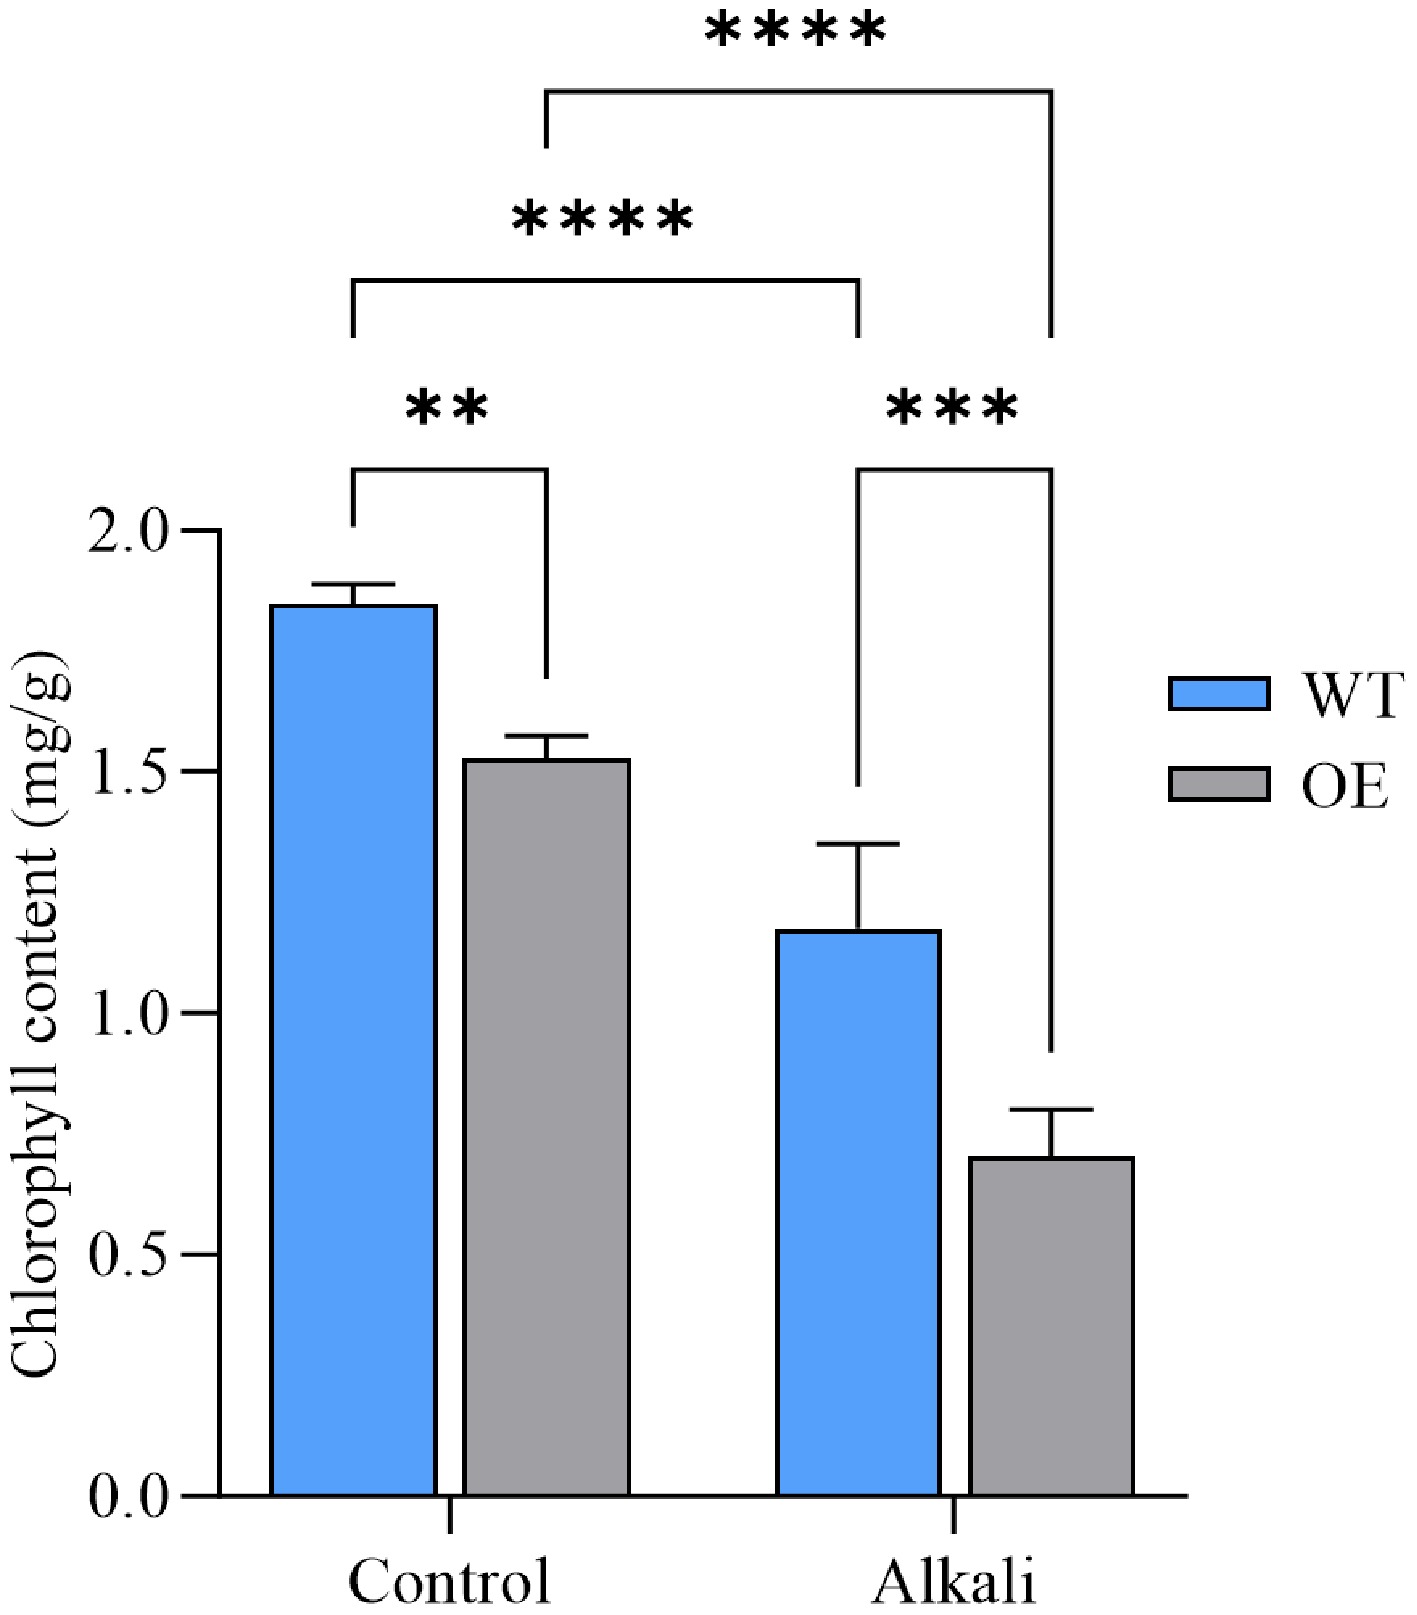
Figure 5.
Chlorophyll content in wild-type and LcAT1-overexpressing transgenic rice under alkaline stress. WT denotes wild-type rice, OE denotes LcAT1-overexpressing rice, and Control and Alkali denote treatment with water and 75 mmol/L alkaline solution, respectively. Data are means ± SD (n = 3). Two-way ANOVA with genotype and treatment as factors. ns, not significant; * p < 0.05; ** p < 0.01; *** p < 0.001; and **** p < 0.0001.
Effect of MDA content changes on cell membrane damage severity
-
MDA content was primarily affected by alkaline treatment. A significant treatment effect was detected, F(1, 8) = 89.47, p < 0.0001, whereas neither the genotype effect, F(1, 8) = 2.882, p = 0.1280 nor the genotype × treatment interaction F(1, 8) = 4.765, p = 0.0606 was statistically significant (Fig. 6). Consistent with the observed group means, MDA content increased following alkaline treatment, indicating enhanced membrane lipid peroxidation. However, the absence of significant genotype and interaction effects suggests that the overall MDA level and the magnitude of the treatment-induced increase did not differ significantly between wild-type and LcAT1-overexpressing rice.
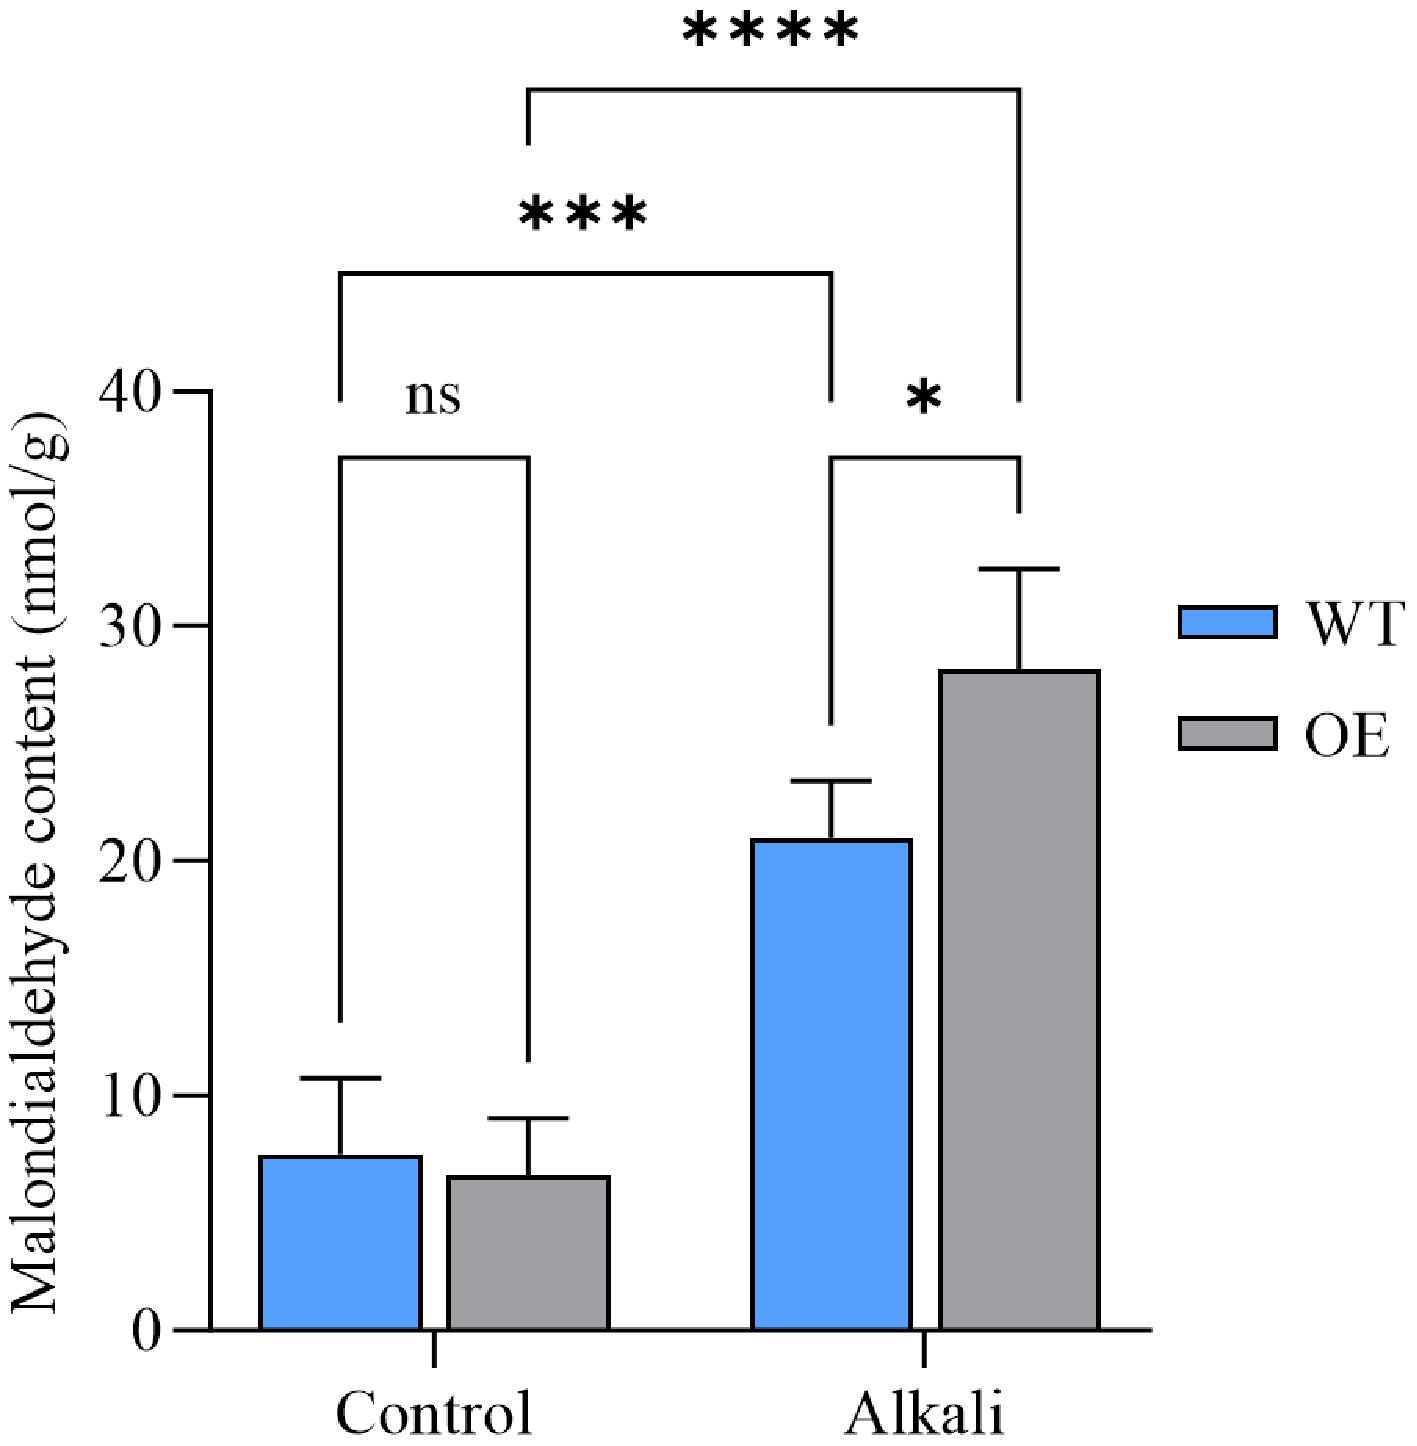
Figure 6.
Malondialdehyde (MDA) content in wild-type and LcAT1-overexpressing transgenic rice under alkaline stress. WT denotes wild-type rice, OE denotes LcAT1-overexpressing rice, and 'Control' and 'Alkali' denote treatment with water and 75 mmol/L alkaline solution, respectively. Data are means ± SD (n = 3). Two-way ANOVA with genotype and treatment as factors. ns, not significant; * p < 0.05; ** p < 0.01; *** p < 0.001; and **** p < 0.0001.
Changes in antioxidant enzyme activity and ROS accumulation
-
Two-way ANOVA revealed significant main effects of alkaline treatment, F(1, 8) = 235.2, p < 0.0001, and genotype, F(1, 8) = 8.668, p = 0.0186, on POD activity. A significant genotype × treatment interaction was also detected, F(1, 8) = 22.52, p = 0.0015 (Fig. 7), indicating that the effect of alkaline treatment on POD activity differed between wild-type and LcAT1-overexpressing rice.
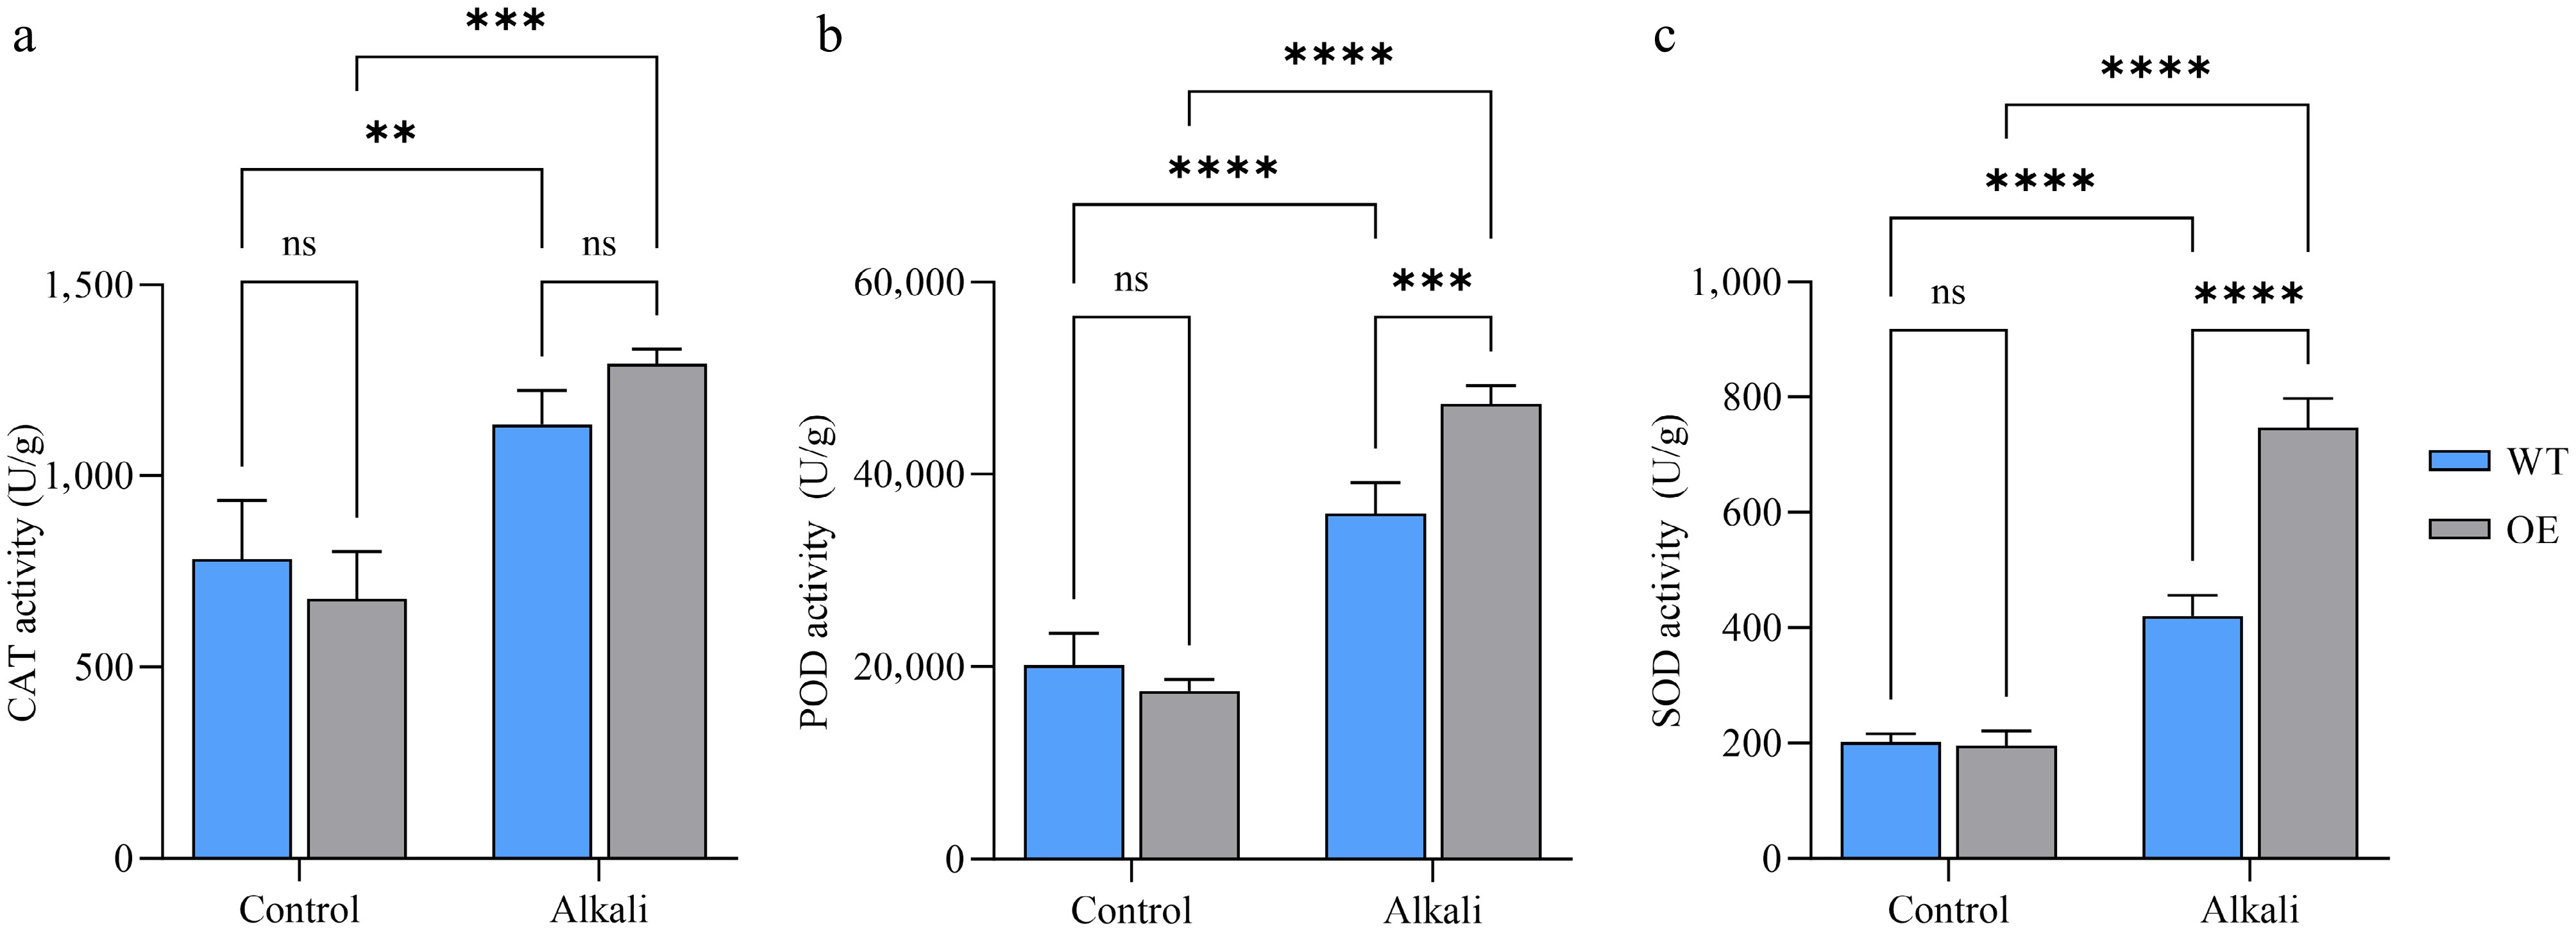
Figure 7.
Changes in antioxidant enzyme activity. (a) Changes in catalase activity. (b) Changes in peroxidase activity. (c) Changes in superoxide dismutase activity. WT denotes wild-type rice, OE denotes LcAT1-overexpressing rice, and 'Control' and 'Alkali' denote treatment with water and 75 mmol/L alkaline solution, respectively. Data are means ± SD (n = 3). Two-way ANOVA with genotype and treatment as factors. ns, not significant; * p < 0.05; ** p < 0.01; *** p < 0.001; and **** p < 0.0001.
For catalase (CAT) activity, two-way ANOVA revealed a significant main effect of alkaline treatment, F(1, 8) = 58.04, p < 0.0001. In contrast, neither the main effect of genotype, F(1, 8) = 0.1782, p = 0.6841, nor the genotype × treatment interaction, F(1, 8) = 4.286, p = 0.0722, was statistically significant (Fig. 7). These results indicate that alkaline treatment increased CAT activity irrespective of genotype, whereas LcAT1 overexpression did not significantly alter either the overall CAT activity or its response to alkaline treatment.
Two-way ANOVA revealed a significant genotype × treatment interaction for SOD activity, F(1, 8) = 72.02, p < 0.0001. Significant main effects of alkaline treatment, F(1, 8) = 387.2, p < 0.0001, and genotype, F(1, 8) = 67.29, p < 0.0001, were also detected (Fig. 7). These results indicate that the effect of alkaline treatment on SOD activity differed significantly between wild-type and LcAT1-overexpressing rice.
Based on the three indicators above, alkaline treatment had a significant main effect on the activities of all three antioxidant enzymes examined, including SOD, F(1, 8) = 387.2, p < 0.0001, POD, F(1, 8) = 235.2, p < 0.0001, and CAT F(1, 8) = 58.04, p < 0.0001 (Fig. 7). Significant main effects of genotype were detected for SOD F(1, 8) = 67.29, p < 0.0001 and POD F(1, 8) = 8.668, p = 0.0186, but not for CAT F(1, 8) = 0.1782, p = 0.6841. Moreover, significant genotype × treatment interactions were observed for SOD F(1, 8) = 72.02, p < 0.0001, and POD F(1, 8) = 22.52, p = 0.0015, indicating that the responses of these two enzymes to alkaline treatment differed between wild-type and LcAT1-overexpressing rice. In contrast, the genotype × treatment interaction was not significant for CAT activity, F(1, 8) = 4.286, p = 0.0722, suggesting that the effect of alkaline treatment on CAT activity was not statistically different between the two genotypes. Collectively, these results indicate that alkaline treatment activated the antioxidant enzyme system in rice, while LcAT1 overexpression was associated with genotype-dependent changes in the SOD and POD responses but did not significantly alter the CAT response to alkaline treatment.
Changes in osmotic regulatory substance content
-
Amino acid content showed a significant overall response to alkaline treatment. The main effect of treatment was significant, F(1, 8) = 11.75, p = 0.0090, whereas neither the main effect of genotype, F(1, 8) = 3.540, p = 0.0967, nor the genotype × treatment interaction F(1, 8) = 4.786, p = 0.0601 reached statistical significance (Fig. 8a). Consistent with the group means, amino acid content decreased overall under alkaline treatment. However, the nonsignificant genotype effect and interaction indicate that neither the overall amino acid level nor the magnitude of the treatment-induced change differed significantly between wild-type and LcAT1-overexpressing rice.
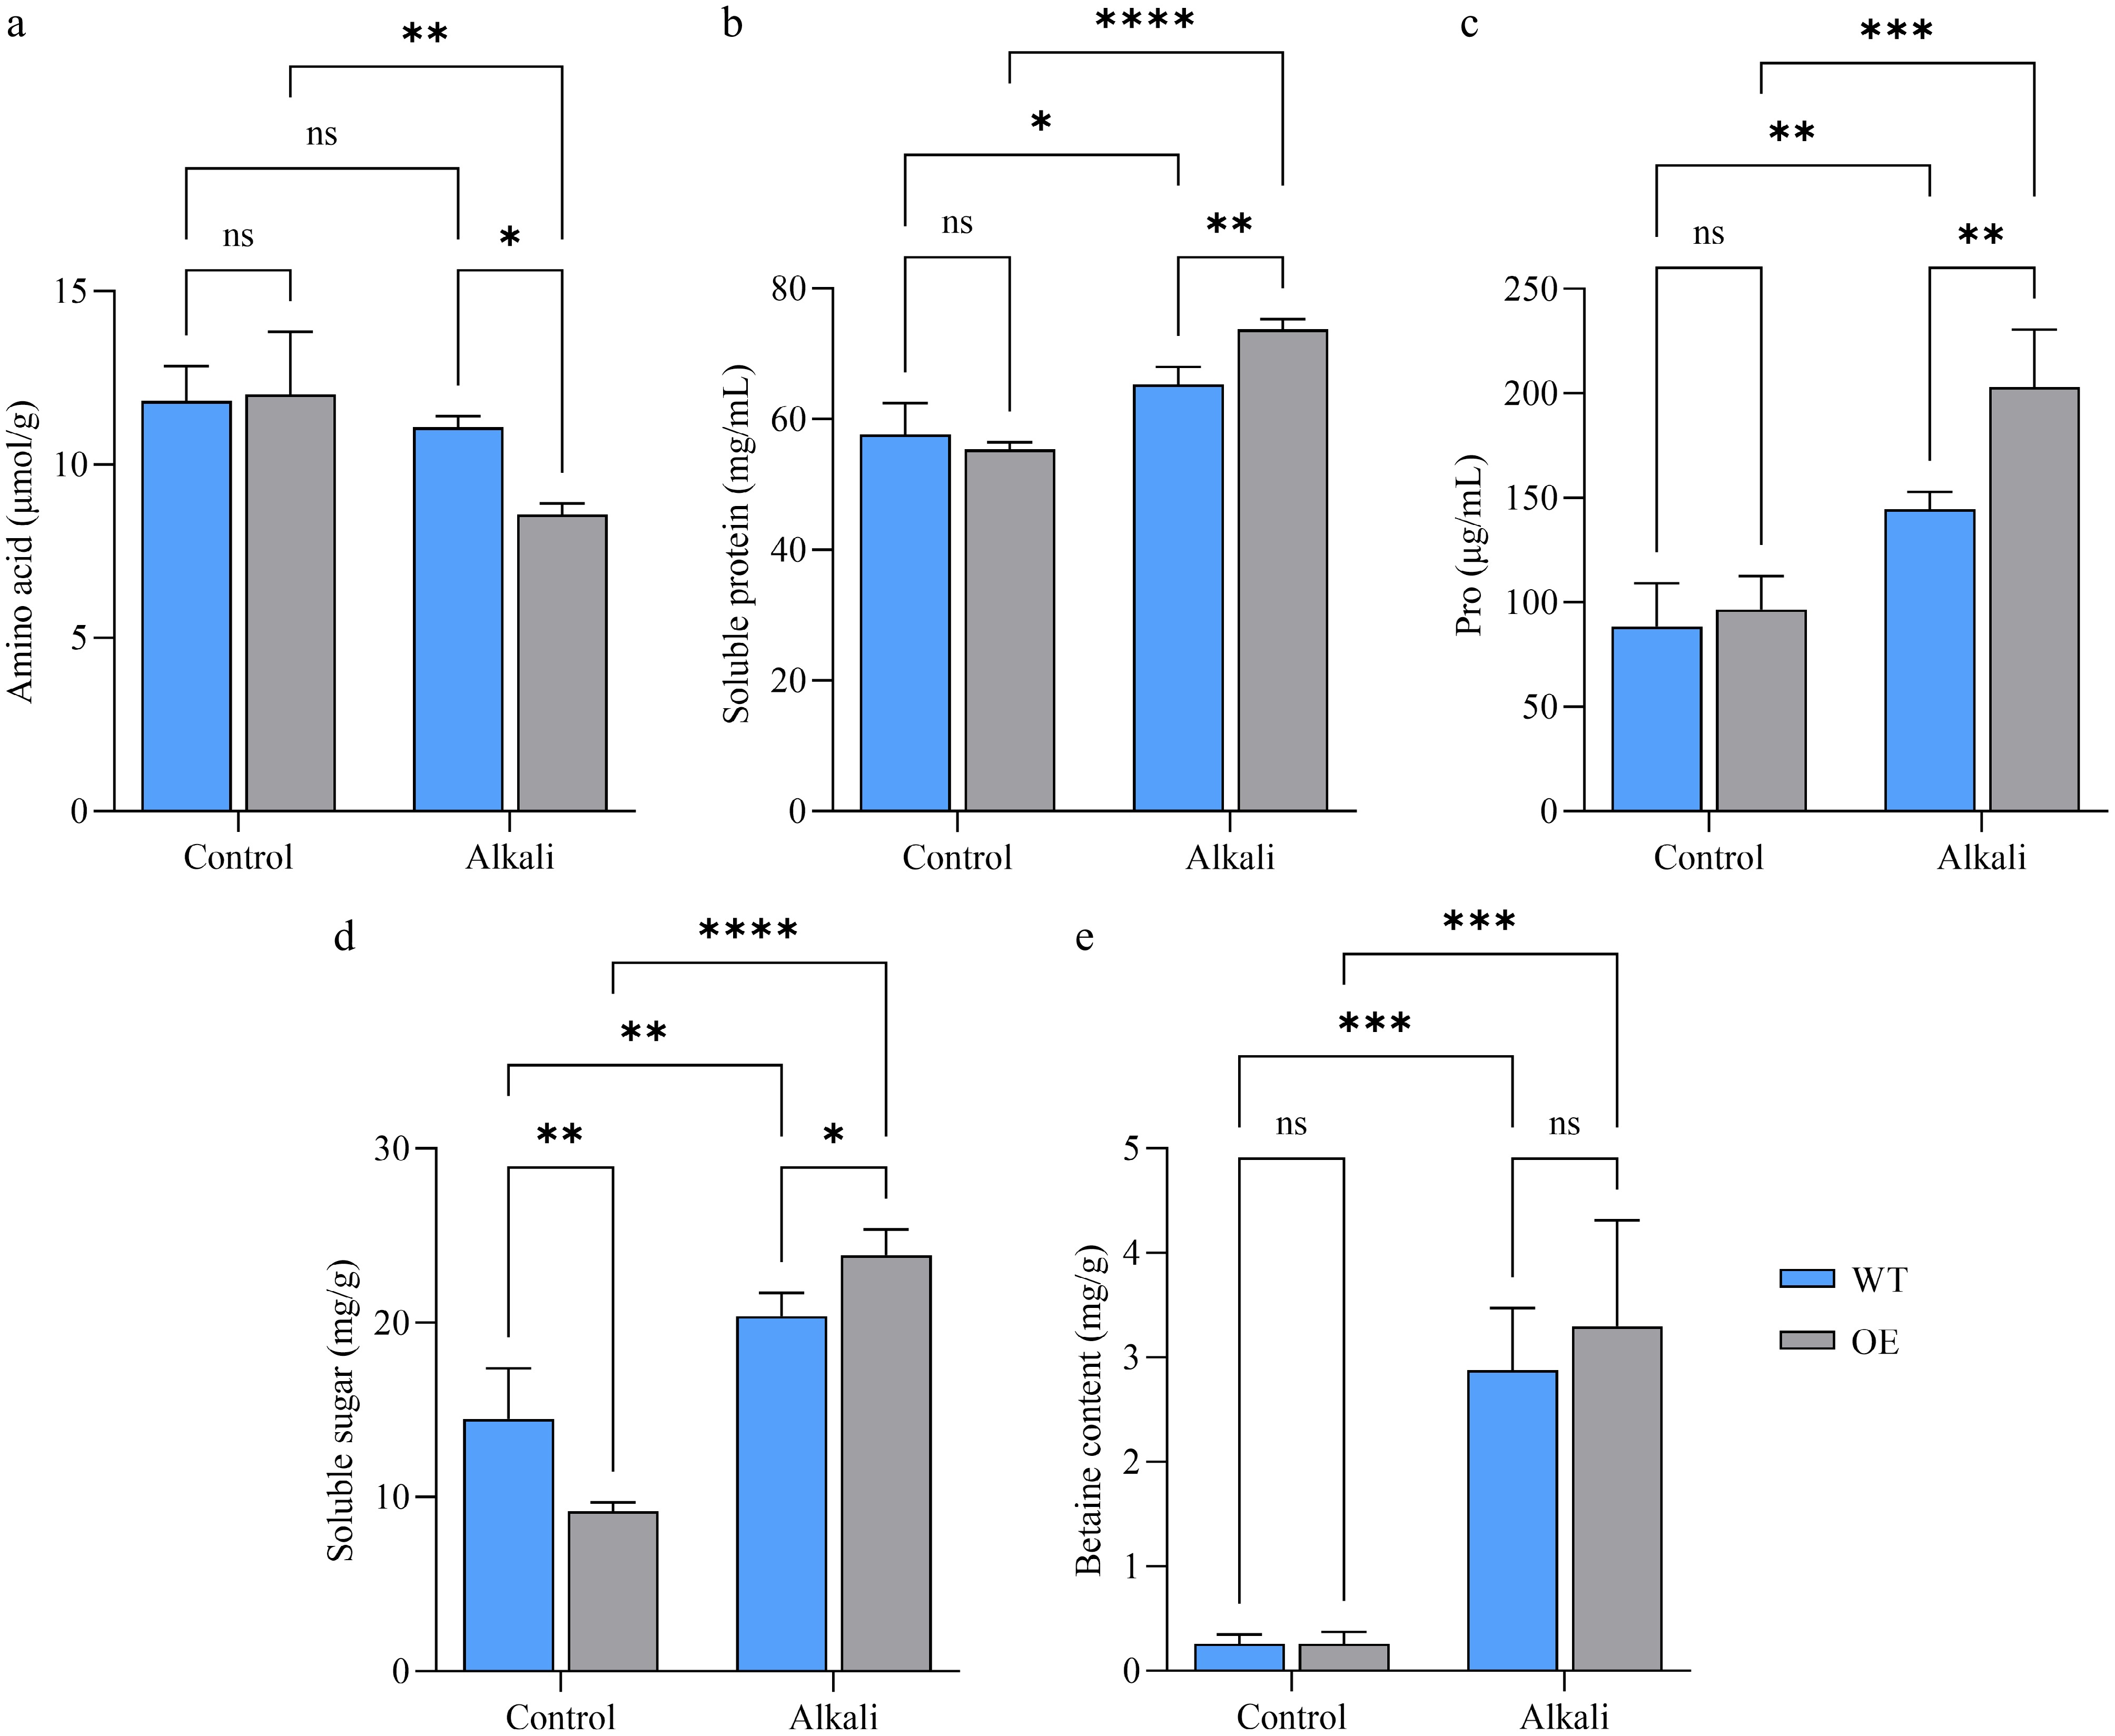
Figure 8.
Changes in osmoregulatory substance content. (a) Changes in amino acid content. (b) Changes in soluble protein content. (c) Changes in proline content. (d) Changes in soluble sugar content. (e) Changes in betaine content. WT denotes wild-type rice, OE denotes LcAT1-overexpressing rice, and 'Control' and 'Alkali' denote treatment with water and 75 mmol/L alkaline solution, respectively. Data are means ± SD (n = 3). Two-way ANOVA with genotype and treatment as factors. ns, not significant; * p < 0.05; ** p < 0.01; *** p < 0.001; and **** p < 0.0001.
Alkaline treatment altered soluble protein accumulation differently in wild-type and LcAT1-overexpressing rice. The genotype × treatment interaction was significant, F(1, 8) = 10.23, p = 0.0126, and a significant main effect of treatment was also detected, F(1, 8) = 60.22, p < 0.0001 (Fig. 8b). By contrast, the main effect of genotype was not significant, F(1, 8) = 3.414, p = 0.1018. These results indicate that alkaline treatment affected soluble protein content overall, while the magnitude of the response differed between wild-type and LcAT1-overexpressing rice.
Proline accumulation was strongly influenced by alkaline treatment and genotype. Significant main effects were detected for alkaline treatment, F(1, 8) = 52.43, p < 0.0001 and genotype, F(1, 8) = 8.853, p = 0.0177, whereas the genotype × treatment interaction did not reach statistical significance, F(1, 8) = 5.077, p = 0.0543 (Fig. 8c). Consistent with the group means, proline content increased overall under alkaline treatment, indicating the induction of an osmotic adjustment response. However, the nonsignificant interaction indicates that the magnitude of the treatment-induced change was not statistically different between wild-type and LcAT1-overexpressing rice.
Alkaline treatment reshaped soluble sugar accumulation in a genotype-dependent manner. A significant genotype × treatment interaction was detected, F(1, 8) = 18.46, p = 0.0026, together with a significant main effect of treatment, F(1, 8) = 101.6, p < 0.0001 (Fig. 8d). In contrast, the main effect of genotype was not significant, F(1, 8) = 0.7620, p = 0.4082. These findings indicate that alkaline treatment strongly affected soluble sugar content, but that the magnitude or pattern of this response differed between wild-type and LcAT1-overexpressing rice. The differential response suggests that LcAT1 overexpression may influence soluble sugar adjustment under alkaline stress.
Betaine content was governed predominantly by alkaline treatment rather than genotype. A significant main effect of treatment was detected, F(1, 8) = 68.73, p < 0.0001, whereas neither the main effect of genotype, F(1, 8) = 0.3788, p = 0.5554, nor the genotype × treatment interaction, F(1, 8) = 0.3788, p = 0.5554 was statistically significant (Fig. 8e). Consistent with the group means, betaine content increased overall following alkaline treatment, suggesting the induction of an osmotic adjustment response. However, the absence of significant genotype and interaction effects indicates that LcAT1 overexpression did not significantly alter either the overall betaine level or its response to alkaline treatment.
Overall, alkaline stress markedly altered amino acid, soluble protein, proline, soluble sugar, and betaine levels, reflecting broad metabolic and osmotic adjustment in rice. The effects of LcAT1 overexpression were selective rather than uniform: genotype-dependent responses were mainly observed for soluble protein and soluble sugar, while proline showed an overall genotype difference. In contrast, amino acid and betaine responses were primarily driven by alkaline treatment and were not significantly modified by LcAT1 overexpression.
-
Previous studies have established AT1/GS3 as a conserved negative regulator of alkaline tolerance in several major cereal crops. AT1 encodes an atypical heterotrimeric G-protein γ subunit homologous to the rice grain-size regulator GS3, and its overexpression increases alkaline sensitivity, whereas knockout or genetic modification enhances alkaline tolerance in sorghum, rice, maize, millet, and wheat[7,9,13]. However, current functional evidence has been obtained predominantly from annual cereal crops, and whether this regulatory function is retained in naturally alkali-adapted perennial forage grasses has remained unclear. Leymus chinensis is a perennial grass naturally adapted to saline-alkali soils[17−21], but the molecular basis underlying its strong alkaline tolerance is still insufficiently understood[22]. The present study therefore extends current knowledge of the AT1 family by characterizing LcAT1 from L. chinensis and evaluating its function through heterologous overexpression in rice.
LcAT1 was closely related to AT1 homologs from wheat and barley and was preferentially expressed in underground stolons and fibrous roots. Its transcript abundance also increased following alkaline treatment. These expression patterns indicate that LcAT1 is responsive to alkaline stress and may participate in stress-related processes in underground organs. Nevertheless, stress-induced expression does not necessarily imply a positive contribution to tolerance. Indeed, LcAT1-overexpressing rice exhibited more severe wilting and chlorosis under alkaline treatment than wild-type plants, supporting the conclusion that LcAT1 retains the negative regulatory property previously reported for AT1 homologs in cereal crops[7,13].
One proposed mechanism underlying AT1-mediated alkaline sensitivity involves the regulation of reactive oxygen species homeostasis. AT1/GS3 has been reported to associate with PIP2 aquaporins and to negatively affect aquaporin phosphorylation, thereby restricting hydrogen peroxide transport and promoting ROS accumulation under alkaline conditions[7]. In the present study, stronger NBT staining was observed in LcAT1-overexpressing leaves following alkaline treatment, indicating greater superoxide accumulation and supporting an association between LcAT1 expression and oxidative imbalance.
The statistical analyses indicate that the physiological effects of LcAT1 overexpression were selective rather than uniform. Alkaline treatment significantly reduced chlorophyll content and increased MDA content overall, consistent with impaired pigment maintenance and enhanced membrane lipid peroxidation under stress[23−25]. However, the genotype × treatment interactions for both chlorophyll and MDA were not statistically significant. Thus, although the transgenic plants displayed more severe visible injury, the current data do not demonstrate that LcAT1 overexpression caused a significantly greater treatment-induced reduction in chlorophyll or increase in MDA. The significant genotype main effect on chlorophyll content may instead indicate that constitutive LcAT1 expression affected the overall chlorophyll level across treatment conditions.
Interestingly, the LcAT1-overexpressing plants exhibited significantly lower chlorophyll content than the wild type even under normal growth conditions. This observation suggests that the biological function of LcAT1 is not restricted to alkaline stress responses. Previous studies have demonstrated that AT1 orthologs participate not only in abiotic stress adaptation but also in plant growth and development, particularly in reproductive development and other physiological processes. Therefore, the reduced chlorophyll content observed under non-stress conditions is more likely to reflect the pleiotropic role of LcAT1 in regulating plant physiological processes rather than a phenotype exclusively associated with alkaline stress. In addition, constitutive overexpression may have enhanced this developmental phenotype. Nevertheless, the molecular mechanism by which LcAT1 influences chlorophyll accumulation or photosynthetic regulation remains unclear and warrants further investigation.
Antioxidant enzyme activities also exhibited distinct response patterns. Alkaline treatment significantly affected SOD, POD, and CAT activities, consistent with activation of antioxidant defenses under saline-alkali stress[23,24]. Significant genotype × treatment interactions were detected for SOD and POD, indicating that the responses of these enzymes differed between wild-type and LcAT1-overexpressing rice. In contrast, CAT showed a significant treatment effect but no significant genotype effect or interaction. These findings suggest that LcAT1 overexpression modified specific components of the antioxidant response rather than uniformly altering the entire antioxidant enzyme system. Together with the stronger NBT staining and stress-sensitive phenotype, the altered SOD and POD responses may represent compensatory reactions to increased oxidative pressure. Increased enzyme activity alone, however, should not be interpreted as evidence of more effective ROS detoxification, because antioxidant enzymes can also be induced as a consequence of increased oxidative stress[26,27].
An important feature of this study is that LcAT1 was isolated from a perennial grass naturally adapted to saline-alkali environments, whereas most previous functional studies of AT1 have focused on endogenous genes in annual cereal crops[7,13]. The conservation of the stress-sensitive phenotype in rice suggests that the negative regulatory property of AT1 is retained across divergent members of the grass family. It should also be noted, however, that heterologous overexpression may not fully recapitulate the native regulatory, developmental, and protein-interaction context in which the gene functions in L. chinensis[28]. This type of discrepancy has previously been observed in rice. Overexpression of the rice transcription factor OsDREB2A in its native rice background significantly enhanced tolerance to osmotic, salt, and dehydration stresses, whereas heterologous overexpression in Arabidopsis failed to effectively activate the expected stress-responsive target genes. This discrepancy highlights that functional outputs of a gene can depend on host-specific regulatory networks, post-translational modifications, and molecular interactions, and therefore phenotypes observed in heterologous systems may not fully reflect its native function[29].
The preferential expression of LcAT1 in underground organs may indicate a role in root- or rhizome-associated responses, but this possibility was not functionally tested in the native species. Similarly, the predicted hydrophobicity, instability index, and structural features of LcAT1 were derived from computational analyses and should not be interpreted as direct evidence of its in vivo stability or biochemical activity.
Additionally, bioinformatic analysis revealed differences in the predicted instability indices between LcAT1 and OsAT1. However, whether these predicted differences affect protein stability or functional activity requires further experimental validation.
Future studies should investigate LcAT1 through loss- and gain-of-function approaches in L. chinensis, assess its interaction with PIP aquaporins, and directly examine ROS transport, protein stability, and downstream signaling. Despite these limitations, the present study provides gain-of-function evidence that LcAT1 retains a conserved negative association with alkaline tolerance and extends AT1 research from annual cereal crops to a perennial forage grass.
-
This study characterized the functional role of LcAT1, a homolog of the AT1 gene from L. chinensis, and demonstrated that its overexpression increases the sensitivity of transgenic rice to alkaline stress. This finding not only complements previous reports showing that knockout of AT1 family genes enhances alkaline tolerance—thereby confirming the conserved negative regulatory function of this gene family—but also reveals distinct stress response patterns resulting from heterologous expression. These results provide novel genetic resources and a theoretical foundation for elucidating the molecular networks underlying plant alkaline tolerance, as well as for the biological improvement of saline-alkali soils and the enhancement of alkaline tolerance in perennial plants.
-
Not applicable.
-
The authors confirm their contributions to the paper as follows: study conception and design: Hou XY, Lu FY; data collection: Lu FY, Cao JY; analysis and interpretation of results: Lu FY, Li SJ, Fan YF; draft manuscript preparation: Lu FY, Yang R. All authors reviewed the results and approved the final version of the manuscript.
-
The datasets generated during and/or analyzed during the current study are available from the corresponding author upon reasonable request.
-
The authors declare that they have no conflict of interest.
- Copyright: © 2026 by the author(s). Published by Maximum Academic Press, Fayetteville, GA. This article is an open access article distributed under Creative Commons Attribution License (CC BY 4.0), visit https://creativecommons.org/licenses/by/4.0/.
-
About this article
Cite this article
Lu FY, Li SJ, Cao JY, Yang R, Fan YF, et al. 2026. Heterologous expression of LcAT1, a homolog of the alkaline tolerance repressor gene AT1 from Leymus chinensis, increases alkaline sensitivity in transgenic rice. Grass Research 6: e031 doi: 10.48130/grares-0026-0025 

Heterologous expression of LcAT1, a homolog of the alkaline tolerance repressor gene AT1 from Leymus chinensis, increases alkaline sensitivity in transgenic rice
- Received: 28 April 2026
- Revised: 26 July 2026
- Accepted: 26 August 2026
- Published online: 14 October 2026
Abstract: Leymus chinensis is a dominant perennial forage grass widely distributed in the Eurasian Steppe, with strong tolerance to alkaline stress. However, the molecular basis underlying its alkaline tolerance remains largely unclear. In this study, we cloned and functionally characterized LcAT1, an ortholog of the alkaline tolerance repressor gene AT1 from Leymus chinensis. The complete coding sequence (CDS) of LcAT1 is 495 bp, encoding a 164-amino-acid protein predicted to be hydrophobic, with a high instability index based on computational analysis, that exhibits high sequence similarity (95.12%) to the wheat GS-7A protein template used for structural modeling. Phylogenetic analysis indicated that LcAT1 is closely clustered with its orthologs from wheat and barley. Tissue-specific expression analysis revealed that LcAT1 is mainly expressed in underground stolons and fibrous roots, and its transcription is significantly induced by 75 mmol/L alkaline treatment. To explore its function, we generated LcAT1-overexpressing transgenic rice lines. Under alkaline stress, transgenic plants exhibited severely decreased tolerance compared with the wild type, showing complete lethality, higher reactive oxygen species (ROS) accumulation, more severe chlorophyll degradation, and increased malondialdehyde (MDA) content. Although antioxidant enzyme activities (SOD and POD) and osmoprotectants (proline, soluble sugars, and betaine) were significantly elevated in transgenic plants, these responses failed to alleviate stress sensitivity. Our results indicate that LcAT1 acts as a conserved negative regulator of alkaline tolerance, and its heterologous expression in rice aggravates oxidative damage and stress susceptibility. This study provides new gene resources for dissecting alkaline tolerance mechanisms and molecular breeding of alkali-tolerant perennial forage grasses.
-
Key words:
- Leymus chinensis /
- Alkaline /
- Function verification