


-
Polygonatum hunanense H.H. Liu & B.Z. Wang, formerly known as Polygonatum kingianum var. grandifolium, is a perennial species in the genus Polygonatum (Liliaceae) demonstrating high rhizome productivity[1]. Native to the provinces of Hunan, Hubei, Chongqing, and Sichuan in China, this species was historically classified as a variant of P. kingianum[2]. Traditionally known as 'Huangjing', it possesses both medicinal and edible values[2,3].
The rhizomes of Polygonatum species, recognized as their primary medicinal organs, contain bioactive compounds including polysaccharides, alkaloids, and saponins[4]. These plants exhibit pharmacological properties such as Qi-tonifying, Yin-nourishing, kidney-tonifying, spleen-strengthening, antioxidant, hypoglycemic, and antitumor activities[5]. Unlike other Polygonatum species, P. hunanense exhibits dual-season sprouting (spring and autumn) while maintaining persistent foliar retention. This biological adaptation has led to its vernacular epithet 'Budaomiao Huangjing'[3]. The extended photosynthetic phase enhances biomass accumulation and agricultural productivity, demonstrating its cultivation potential as a dual-purpose medicinal-edible plant. Polygonatum species are widely processed into functional foods including wine, tea, instant granules, compressed candies, and oral solutions[6]. The perennial growth habit of these plants creates supply-demand disparities, highlighting the necessity to elucidate molecular mechanisms governing yield enhancement in P. hunanense.
P. hunanense exhibits autumnal resprouting capacity, maintaining viability until vernal shoot emergence[3]. Previous research found that, compared with P. kingianum, the endogenous abscisic acid (ABA) content in autumn buds of P. hunanense is low, while the gibberellin (GA) content is high. Numerous studies have indicated that a high ABA/GA ratio promotes seed dormancy, while a low ABA/GA ratio promotes seed germination[7]. Therefore, it is hypothesized that the autumn sprouting of P. hunanense is related to the metabolism of plant hormones ABA and GA.
Abiotic stresses including temperature extremes, drought, salinity, and heavy metal toxicity, which significantly constrain plant growth, distribution patterns, and agricultural productivity[8]. Hence, elucidating abiotic stress-induced gene expression changes in P. hunanense has become critical for understanding its adaptive strategies. Plants employ transcriptional regulation to mediate environmental adaptation under stress conditions[9]. Consequently, identifying stable reference genes across multiple abiotic stressors is imperative for precise analysis of target gene dynamics and molecular basis of stress resistance in this species.
Quantitative real-time PCR (qRT-PCR) utilizes fluorescent dyes or probes within the PCR reaction system. These fluorophores emit detectable signals upon binding to amplified DNA products, with fluorescence intensity correlating linearly with nucleic acid accumulation[10]. The cycle threshold (Cᴛ) value, defined as the amplification cycle number at which fluorescence surpasses a predetermined baseline level, serves as the primary determinant for quantifying target sequences[10]. Continuous fluorescence monitoring enables precise calculation of relative gene expression levels in experimental samples through Cᴛ value comparisons. This methodology demonstrates superior reproducibility, analytical sensitivity, and automated quantification capabilities compared to conventional endpoint PCR[11]. It has been widely applied in agriculture, customs, and the military, and also has an extremely broad application in medical pathology and molecular biology.
Reference genes play pivotal roles in governing growth, development, and metabolic regulation across organisms. In plant qRT-PCR methodologies, commonly adopted reference genes comprise Glyceraldehyde-3-phosphate dehydrogenase (GAPDH)[12], Actin (ACT)[12], β-Tubulin (TUB)[12], Ubiquitin (UBQ)[12], Ribosomal protein L (RPL)[12], Elongation factor 1-alpha (EF-1α)[13], Ubiquitin-conjugating enzyme (UBC)[13], α-Tubulin (TUA)[13], Histone H2A (H2A)[14], Protein Phosphatase 2A (PP2A)[15], and 18S ribosomal RNA (18S)[16]. The expression stability of reference genes refers to the maintenance of consistent transcript levels across varied biological materials, tissue types, developmental stages, and experimental conditions[17]. Furthermore, reference genes lack universal applicability, and inappropriate selection for qRT-PCR normalization may lead to significant analytical deviations or contradictory conclusions in gene expression profiling[18]. Systematic screening of stably expressed reference genes based on plant species specificity, tissue heterogeneity, and experimental variability is therefore essential to establish reliable normalization standards for target gene expression analysis[19].
Currently, no reference genes have been reported for P. hunanense, a gap that has hindered molecular-level investigations in this species. Here, we systematically evaluated the expression stability of 11 candidate reference genes (GAPDH, H2A, EF-1α, ACT, TUA, UBC, RPL, PP2A, 18S, TUB, and UBQ) in P. hunanense across various tissues, hormone treatments, and abiotic stress conditions. Leveraging transcriptomic data and qRT-PCR validation, the study employed software tools (GeNorm, NormFinder, Delta Cᴛ, BestKeeper, RefFinder) for stability ranking, with results further validated through expression profiling of six plant hormone metabolism-related enzyme genes. This work establishes the first validated reference gene panel for P. hunanense, providing a foundation for subsequent molecular biological studies in this species.
-
Plant materials of Polygonatum hunanense H.H. Liu & B.Z. Wang (authenticated by Associate Professor Limin Gong, voucher specimens deposited in our laboratory) were collected from Hunan University of Chinese Medicine's medicinal garden (Hunan, China).
Three-year-old P. hunanense plants with uniform growth vigor were randomly selected, and six distinct tissue samples—roots, stems, leaves, flowers, rhizomes, and buds—were collected and labeled as DTS. Sixty-day-old P. hunanense tissue-cultured seedlings were divided into two experimental groups: different hormonal treatments (DHT), involving foliar sprays of distilled H2O (dH2O), 2.89 μmol/L GA3, 10 μmol/L ABA, or a combination of 2.89 μmol/L GA3 + 10 μmol/L ABA, and different abiotic stress treatments (DAST) included low-temperature (4 °C), high-temperature (40 °C), 25,000 μmol/L PEG-6000 (drought simulation)[20], 150,000 μmol/L NaCl (salinity)[21], and 100 μmol/L CdCl2 (heavy metal)[22]. Whole-plant samples, including controls, were collected at 1 h and 24 h post-treatment, and immediately flash-frozen in liquid nitrogen, and stored at −80 °C. Each treatment had three biological replicates, with 10 plants per replicate.
Total RNA extraction and cDNA synthesis
-
Plant materials were ground in liquid nitrogen to a fine powder. Total RNA was extracted from distinct sample types using the RNAkeyTM Kit (Seven Biotech, China) according to the manufacturer's protocol. RNA integrity was assessed by RNA Integrity Number (RIN) analysis using an Agilent 5400 Bioanalyzer (Agilent Technologies, USA) and verified through 1% agarose gel electrophoresis. Purity and concentrations were determined using a NanoDrop™ One spectrophotometer (Thermo Fisher Scientific, USA). Total RNA was reverse transcribed into cDNA using the ReverTra Ace®qPCR RT Master Mix with gDNA Remover (Toyobo, Japan) in a 20 μL reaction system. The detailed steps are as follows: RNA (1 μg) was denatured at 65 °C for 5 min and rapidly chilled on ice. Subsequently, 4 μL of 4× DN Master Mix was added, and the reaction volume was adjusted to 16 μL with Nuclease-free Water, followed by incubation at 37 °C for 5 min to remove genomic DNA. Next, 4 μL of 5× RT Master Mix II was added, and reverse transcription was performed sequentially at 37 °C (15 min), 50 °C (5 min), and 98 °C (5 min). The cDNA was diluted to working concentrations and stored at −20 °C.
Screening of reference genes and primer design
-
Based on existing literature regarding reference genes, 11 candidate reference genes (GAPDH, H2A, EF-1α, ACT, TUA, UBC, RPL, PP2A, 18S, TUB, and UBQ) were selected. Six enzyme genes involved in plant hormone metabolism were concurrently chosen for reference gene validation: ent-kaurene oxidase (KO)[23], ent-kaurenoic acid monooxygenase (KAM)[23,24], gibberellin 13-oxidase (GA13-ox)[25], gibberellin 44-dioxygenase (GA44-dio)[26], aldehyde dehydrogenase family 7 member A1 (ALDH7A1)[27], indole-3-pyruvate monooxygenase (IPM)[27]. Candidate gene sequences were identified from P. hunanense transcriptome data through a two-phase screening strategy. In the initial phase, optimal sequences were selected via functional keyword matching against annotated databases including Gene Ontology (GO), Kyoto Encyclopedia of Genes and Genomes (KEGG), Non-Redundant Protein Sequence (NR), and others. Subsequently, via cross-species comparison of homologous gene lengths in NCBI databases. The qRT-PCR primers were designed using Primer Premier 5.0 under stringent design criteria: primer length (18–25 bp), GC content (40%–60%), Tm differential (≤ 2 °C), avoidance of secondary structures (e.g., hairpin loops), and G/C enrichment at the 3′ terminus. The primers were commercially synthesized by Sangon Biotech (China) and are detailed in Supplementary Tables S1 and S2. Amplification specificity and efficiency were validated through melting curve analysis and gradient PCR experiments, ensuring reliable reference gene selection.
qRT-PCR reaction conditions
-
The qRT-PCR analysis was performed on a QuantStudioTM 7 Flex system (Thermo Fisher Scientific, USA) using Hieff® qPCR SYBR Green Master Mix (Low Rox Plus) (Yeasen Biotech, China). The 20 μL reaction mixture contained 10 μL of Hieff® qPCR SYBR Green Master Mix (Low Rox Plus), 0.4 μL each of forward (F) and reverse (R) primers (10 μmol/L stock, 0.2 μmol/L final concentration), 1 μL cDNA template, and 8.2 μL double-distilled water (ddH2O), prepared on ice. Thermal cycling conditions consisted of: initial denaturation at 95 °C for 5 min; 40 cycles of 95 °C for 10 s, 60 °C for 20 s, and 72 °C for 20 s; followed by melting curve analysis (95 °C for 15 s, 60 °C for 10 min, 95 °C for 15 s). Three biological replicates with triplicate technical repetitions were analyzed per sample.
Analysis of primer specificity and amplification efficiency
-
A cDNA reference standard was prepared by pooling equal volumes from all samples, followed by 10-fold serial dilutions (10−1 to 10−6). Amplification data from qRT-PCR were used to construct a standard curve in Excel, with log10 (dilution factor) plotted on the x-axis versus Cᴛ values on the y-axis. The curve's slope (k) and coefficient of determination (R2) were used to calculate amplification efficiency: E = (10−1/k − 1) × 100%. Primer specificity was validated through melt curve analysis, where singular peaks confirmed target-specific amplification.
Stability evaluation of candidate reference genes
-
Raw Cᴛ values from P. hunanense tissues as well as hormone-treated and abiotic stress-treated samples were statistically analyzed using Microsoft Excel. 11 candidate reference genes were systematically evaluated for expression stability through five established algorithms: GeNorm[28], NormFinder[29], Delta Cᴛ[30], BestKeeper[31], and RefFinder[32]. This multi-algorithm framework successfully identified optimal reference genes, demonstrating consistent expression patterns across all experimental conditions.
Stability verification of candidate reference genes
-
The three top-ranked candidate reference genes were selected based on stability analysis. A total of six target genes involved in ABA and GA metabolism (KO, KAM, GA13-ox, GA44-dio, ALDH7A1 and IPM) were analyzed to validate reference gene performance across P. hunanense tissues, hormonal treatments and abiotic stress treatments. Target gene expression was quantified using qRT-PCR with primers detailed in Supplementary Table S1, following the established thermal cycling protocol. Relative expression levels (Q) were calculated as Q = 2−ΔΔCᴛ, where ΔΔCᴛ = ΔCᴛ (experimental group) − ΔCᴛ (control group), ΔCᴛ = Cᴛ (target gene) − Cᴛ (reference gene)[33].
-
In the DTS and DHT groups, RNA integrity numbers (RIN) of all samples fell within 7−10 (Supplementary Table S3), demonstrating acceptable RNA quality. For the DAST group, agarose gel analysis exhibited intact 28S and 18S rRNA bands (Supplementary Fig. S1), confirming preserved RNA structural integrity. RNA concentrations varied from 97.9 to 4,960 mg/L with A260/A280 ratios of 1.87−2.18 (Supplementary Table S3), meeting standard purity criteria. These parameters confirm that P. hunanense RNA extracts satisfied subsequent experimental requirements. Samples exceeding 500 mg/L were diluted to 500 mg/L working concentrations.
Specificity and amplification efficiency of gene primers
-
A total of 11 candidate reference genes from P. hunanense cDNA templates underwent primer specificity validation. qRT-PCR analysis demonstrated single-peak melting curves (Supplementary Fig. S2), with no detectable primer dimers in replicate amplifications, confirming primer specificity. Standard curves generated from Cᴛ values showed correlation coefficients (R2) of 0.9591−0.9990, amplification efficiencies of 92.56%−112.86%, and slopes (k) of −3.514 to −3.048 (Table 1), satisfying reference gene validation criteria for subsequent experimental applications.
Table 1. Primer amplification parameters of 11 candidate reference genes in P. hunanense.
Gene Slope (k) Correlation
coefficient (R2)Amplification
efficiency (%)GAPDH −3.416 0.9785 96.19 H2A −3.331 0.9827 99.63 EF-1α −3.137 0.9683 108.31 ACT −3.096 0.9990 110.40 TUA −3.048 0.9784 112.86 UBC −3.342 0.9771 99.16 RPL −3.514 0.9771 92.56 PP2A −3.165 0.9698 106.99 18S −3.251 0.9591 103.02 TUB −3.292 0.9628 101.25 UBQ −3.297 0.9849 101.05 Glyceraldehyde-3-phosphate dehydrogenase, GAPDH; Histone H2A, H2A; Elongation factor 1-alpha, EF-lα; Actin, ACT; Tubulin alpha, TUA; Ubiquitin-conjugating enzyme, UBC; Ribosomal protein L, RPL; Protein Phosphatase 2A, PP2A; 18S ribosome RNA, 18S; Tubulin beta, TUB; and Ubiquitin, UBQ. Cᴛ value analysis of candidate reference genes
-
Cᴛ values of the 11 candidate reference genes were analyzed across three groups (DTS, DHT, and DAST) to evaluate their expression stability and abundance. As shown in Fig. 1, the DTS group exhibited significant Cᴛ value variability, indicating poor overall stability. Specifically, H2A had the lowest Cᴛ value (18.93−25.08), reflecting the highest expression abundance, while RPL had the highest Cᴛ value (23.87−28.18), indicating the lowest expression abundance. In the DHT group, except for RPL, 18S, and TUB, which showed relatively poor stability, other reference genes demonstrated smaller fluctuations and better overall stability. Notably, UBC had the lowest Cᴛ value (21.02−26.60), indicating the highest expression abundance, whereas ACT had the highest Cᴛ value (26.11−30.43), indicating the lowest expression abundance. In the DAST group, Cᴛ values of the 11 candidate reference genes showed minimal variation, suggesting good stability. Particularly, RPL had a low Cᴛ value range (21.63−25.11) with minimal fluctuation, indicating high expression abundance and excellent stability. Conversely, TUB had the highest Cᴛ value (22.86−30.44), indicating the lowest expression abundance. These findings suggest that there are significant differences in the expression levels of different reference genes in P. hunanense under varying tissue conditions, hormone inductions, and abiotic stress treatments.
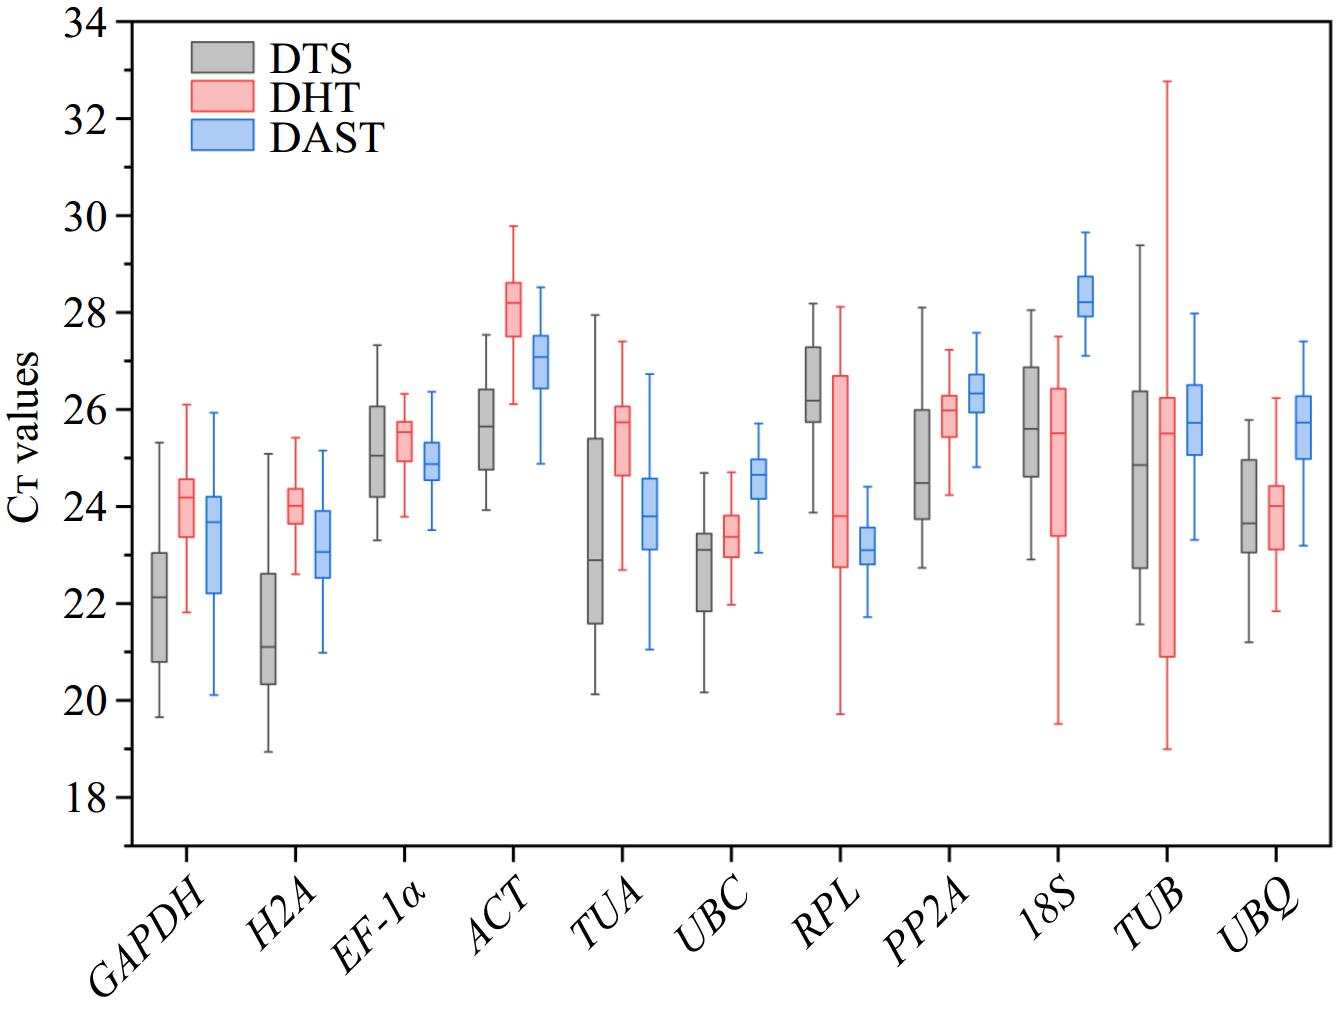
Figure 1.
The Cᴛ value distribution of 11 candidate reference genes in P. hunanense across three groups: DTS (roots, stems, leaves, flowers, rhizomes, buds), DHT (GA3, ABA, GA3 + ABA, dH2O), and DAST (high temperature, low temperature, drought, salinity, heavy metal stress). The center of the box represents the median; the upper edge of the box denotes the upper quartile; the lower edge of the box signifies the lower quartile; the top whisker indicates the maximum value; and the bottom whisker represents the minimum value.
Stability analysis of candidate reference genes
-
The Cᴛ values of P. hunanense samples were converted to relative expression quantities (Q) using the formula Q = 2−ΔCᴛ, where ΔCᴛ represents the difference between sample Cᴛ values and the minimum Cᴛ measurement. These Q values were subsequently analyzed through GeNorm (
https://seqyuan.shinyapps.io/seqyuan_prosper/ ) to calculate expression stability measures (M-values), with lower M-values indicating superior gene stability[34]. Based on established criteria, genes with M values below 1.5 were considered stable, while those exceeding this threshold (M > 1.5) were deemed unsuitable as reference genes. As illustrated in Fig. 2, all genes demonstrated stable expression across all samples, with the exception of RPL under GA3 treatment (M = 1.55). Tissue analysis within the DTS group revealed distinct stability patterns: GAPDH and TUA exhibited the lowest M-values in roots (M = 0.221), ACT and PP2A showed optimal stability in stems (M = 0.201), EF-1α and H2A displayed superior stability in leaves (M = 0.172), TUA and UBQ achieved peak stability in flowers (M = 0.083), 18S and TUB were most stable in rhizomes (M = 0.183), and EF-1α and UBQ maintained the lowest M-values in buds (M = 0.193). Notably, RPL consistently showed the highest M-values across roots, stems, rhizomes, and buds, while UBQ and UBC exhibited maximal instability in leaves and flowers, respectively. Under hormone treatments (DHT group), GAPDH displayed minimal values in dH2O (M = 0.286) and GA3 + ABA (M = 0.201) conditions, and H2A maintained stability across dH2O (M = 0.286), GA3 (M = 0.252), and ABA (0.329) treatments. EF-1α emerged as stable in GA3 (M = 0.252) and ABA (M = 0.329) exposures, with TUA showing optimal performance under GA3 + ABA (M = 0.201). Conversely, RPL exhibited maximal M-values under both GA3 (M = 1.55) and GA3 + ABA (M = 1.13) treatments, and TUB demonstrated the highest instability (M = 1.39) in dH2O controls, indicating their compromised stability under these respective conditions. The DAST group abiotic stress experiments identified GAPDH and EF-1α (M = 0.251) as most stable under high-temperature stress, EF-1α and PP2A (M = 0.349) under low-temperature conditions, RPL and 18S (M = 0.374) during drought, ACT and RPL (M = 0.378) under salinity stress, and RPL and PP2A (M = 0.217) in heavy metal exposure. Based on GeNorm analysis, EF-1α showed relatively high expression stability across different tissues. After hormone treatments, EF-1α and H2A exhibited relatively high stability. Under abiotic stresses, 18S and UBC demonstrated relatively high stability.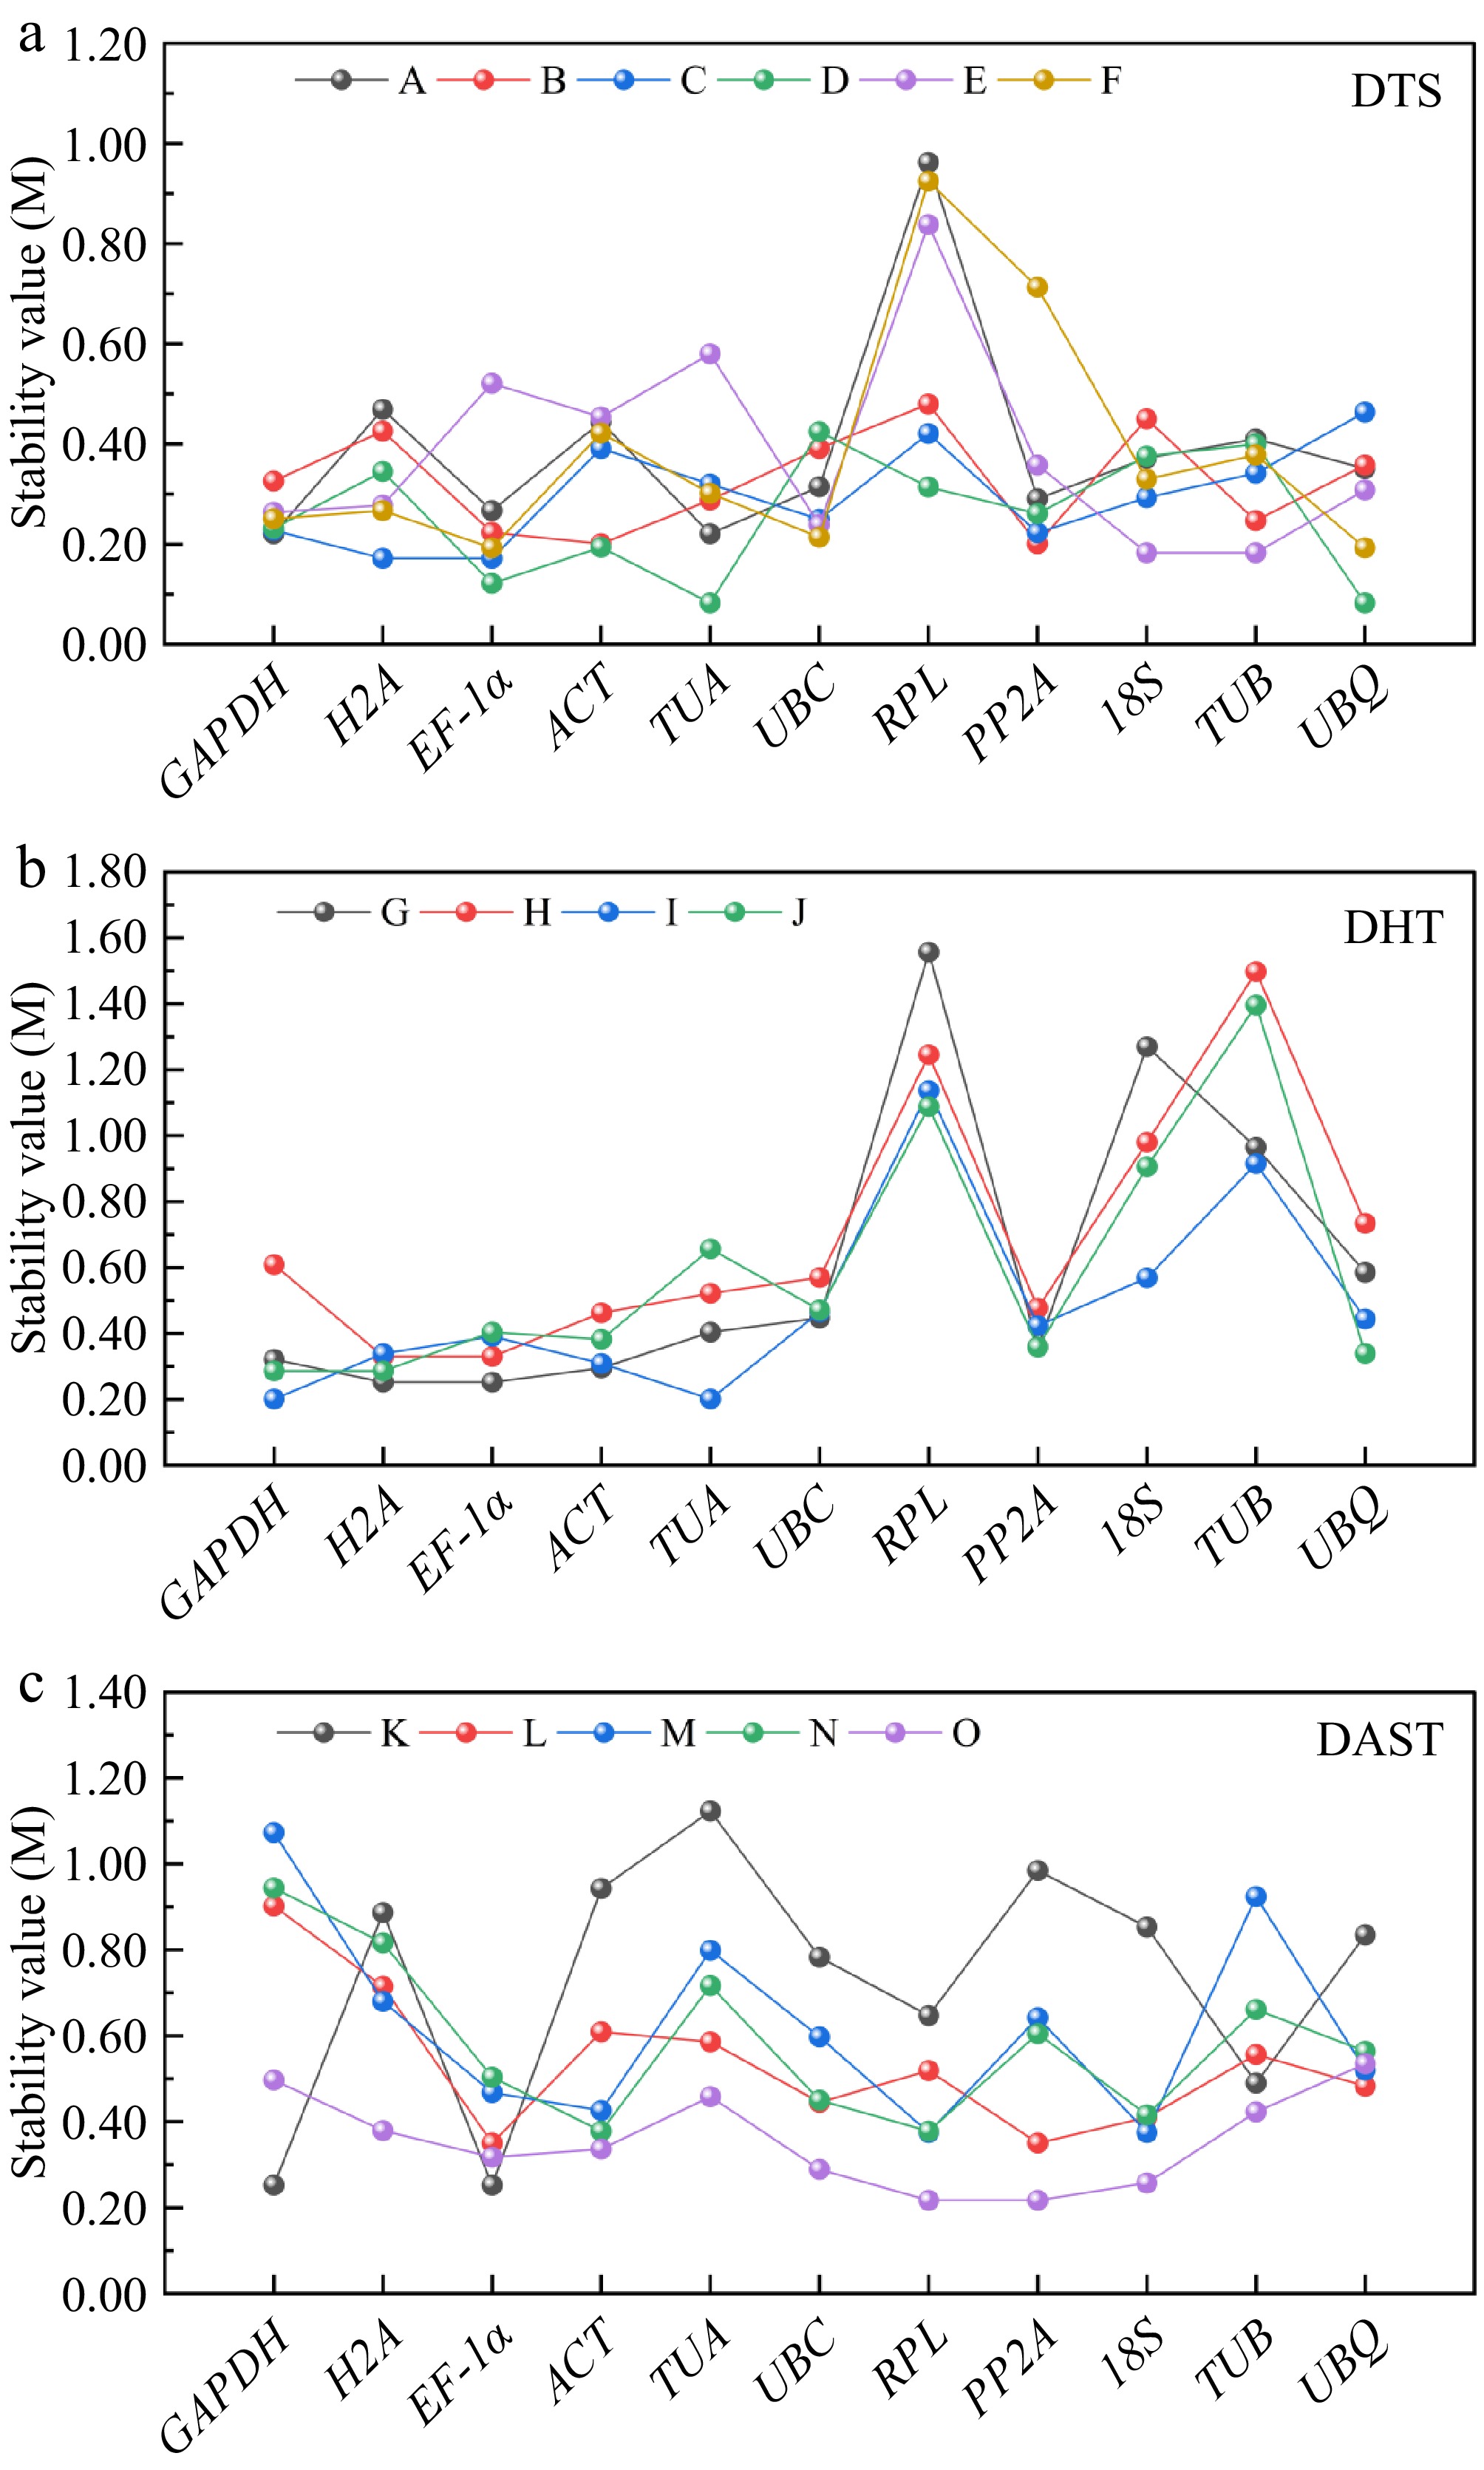
Figure 2.
Presents the stability evaluation of 11 candidate reference genes using GeNorm algorithm across three experimental groups: (a) tissues (DTS: root [A], stem [B], leaf [C], flower [D], rhizome [E], and bud [F]). (b) Hormonal treatments (DHT: GA3 [G], ABA [H], GA3 + ABA co-treatment [I], and dH2O control [J]). (c) Abiotic stresses (DAST: high-temperature [K], low-temperature [L], drought [M], salinity [N], and heavy metal [O]). The M-value metric, a well-established stability parameter in GeNorm analysis, inversely correlates with expression consistency, where values < 1.5 indicate superior stability.
GeNorm can also determine the most suitable number of reference genes by calculating the pairwise variation (Vn/n+1) of the normalization factors of candidate reference genes to obtain accurate and reliable results. When Vn/n+1 < 0.15, the represented genes can meet the requirements for correcting the expression levels of target genes[28]. As depicted in Fig. 3, the GeNorm analysis reveals that, with the exception of the high-temperature treatment condition, the V2/3 values under the 14 experimental conditions, encompassing six tissue sites, four hormone groups, and four abiotic stress groups, are all significantly lower than 0.15. This indicates that the application of a dual internal reference gene combination can offer adequate precision for standardization in these 14 samples, enabling normalization. This systematic assessment validates the adequacy of the dual reference gene set for precise quantification within these biological contexts.
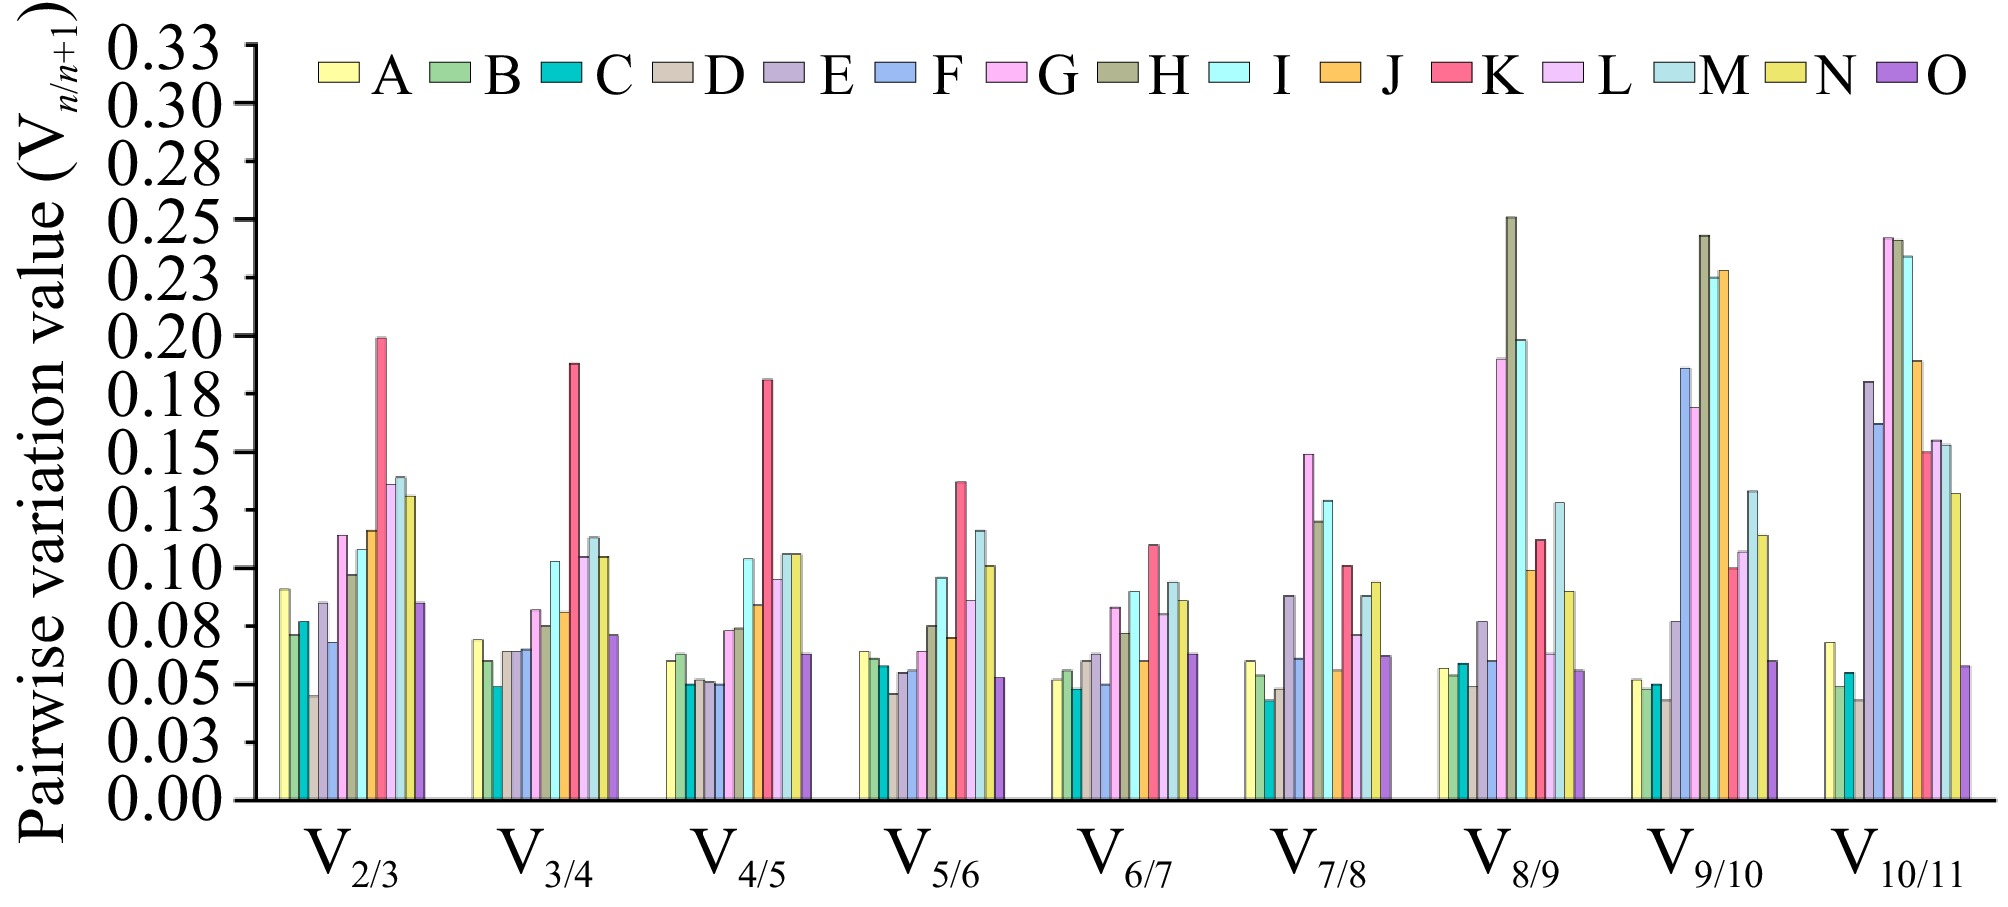
Figure 3.
The GeNorm algorithm was systematically applied to quantify sequential normalization factor variations (Vn/n+1) across 15 experimental conditions encompassing three biological dimensions: (A) root, (B) stem, (C) leaf, (D) flower, (E) rhizome, and (F) bud tissues; (G) GA3, (H) ABA, (I) GA3 + ABA, and (J) dH2O hormonal treatments; along with (K) high-temperature, (L) low-temperature, (M) drought, (N) salinity, and (O) heavy metal abiotic stress conditions. Using a predefined threshold of Vn/n+1 < 0.15 for stabilization validation, the minimum combinatorial requirement of reference genes was determined to ensure robust normalization of qRT-PCR datasets. This systematic evaluation established that dual reference gene combinations provided sufficient normalization precision across all examined biological scenarios, with GeNorm-derived stability values (M) consistently below the recommended cut-off threshold.
The NormFinder (
https://seqyuan.shinyapps.io/seqyuan_prosper/ ) program uses variance analysis to evaluate the expression stability of each reference gene in different samples. Its operating principle is similar to that of the GeNorm program. The smaller the M value showed, the better the expression stability of the gene was[29]. The Cᴛ values of the 11 candidate reference genes in each sample of P. hunanense were imported into NormFinder for calculation, and the M was obtained to evaluate their stability. The results demonstrated significant differences in the expression stability of the 11 candidate reference genes across the three groups. Specifically, TUB was identified as the most stable reference gene in the roots of P. hunanense, PP2A in the stems and leaves, UBQ in the flowers, and H2A in the rhizomes. EF-1α was the most stable reference gene in the buds. Under ABA and dH2O treatments, GAPDH exhibited the highest stability, while TUA and EF-1α were the most stable under GA3 and GA3 + ABA hormone treatments, respectively. In high-temperature stress conditions, RPL showed superior stability; under low-temperature stress, TUB demonstrated the best stability; under drought stress, EF-1α displayed the highest stability; and under salinity and heavy metal stresses, UBC presented the most stable expression characteristics, exhibiting the best stability among all genes. Overall, EF-1α had the highest expression stability across different tissues, followed by ACT. GAPDH had the highest stability under various hormone treatments, followed by EF-1α and H2A. Under different abiotic stresses, EF-1α showed the highest stability, followed by 18S (Fig. 4a).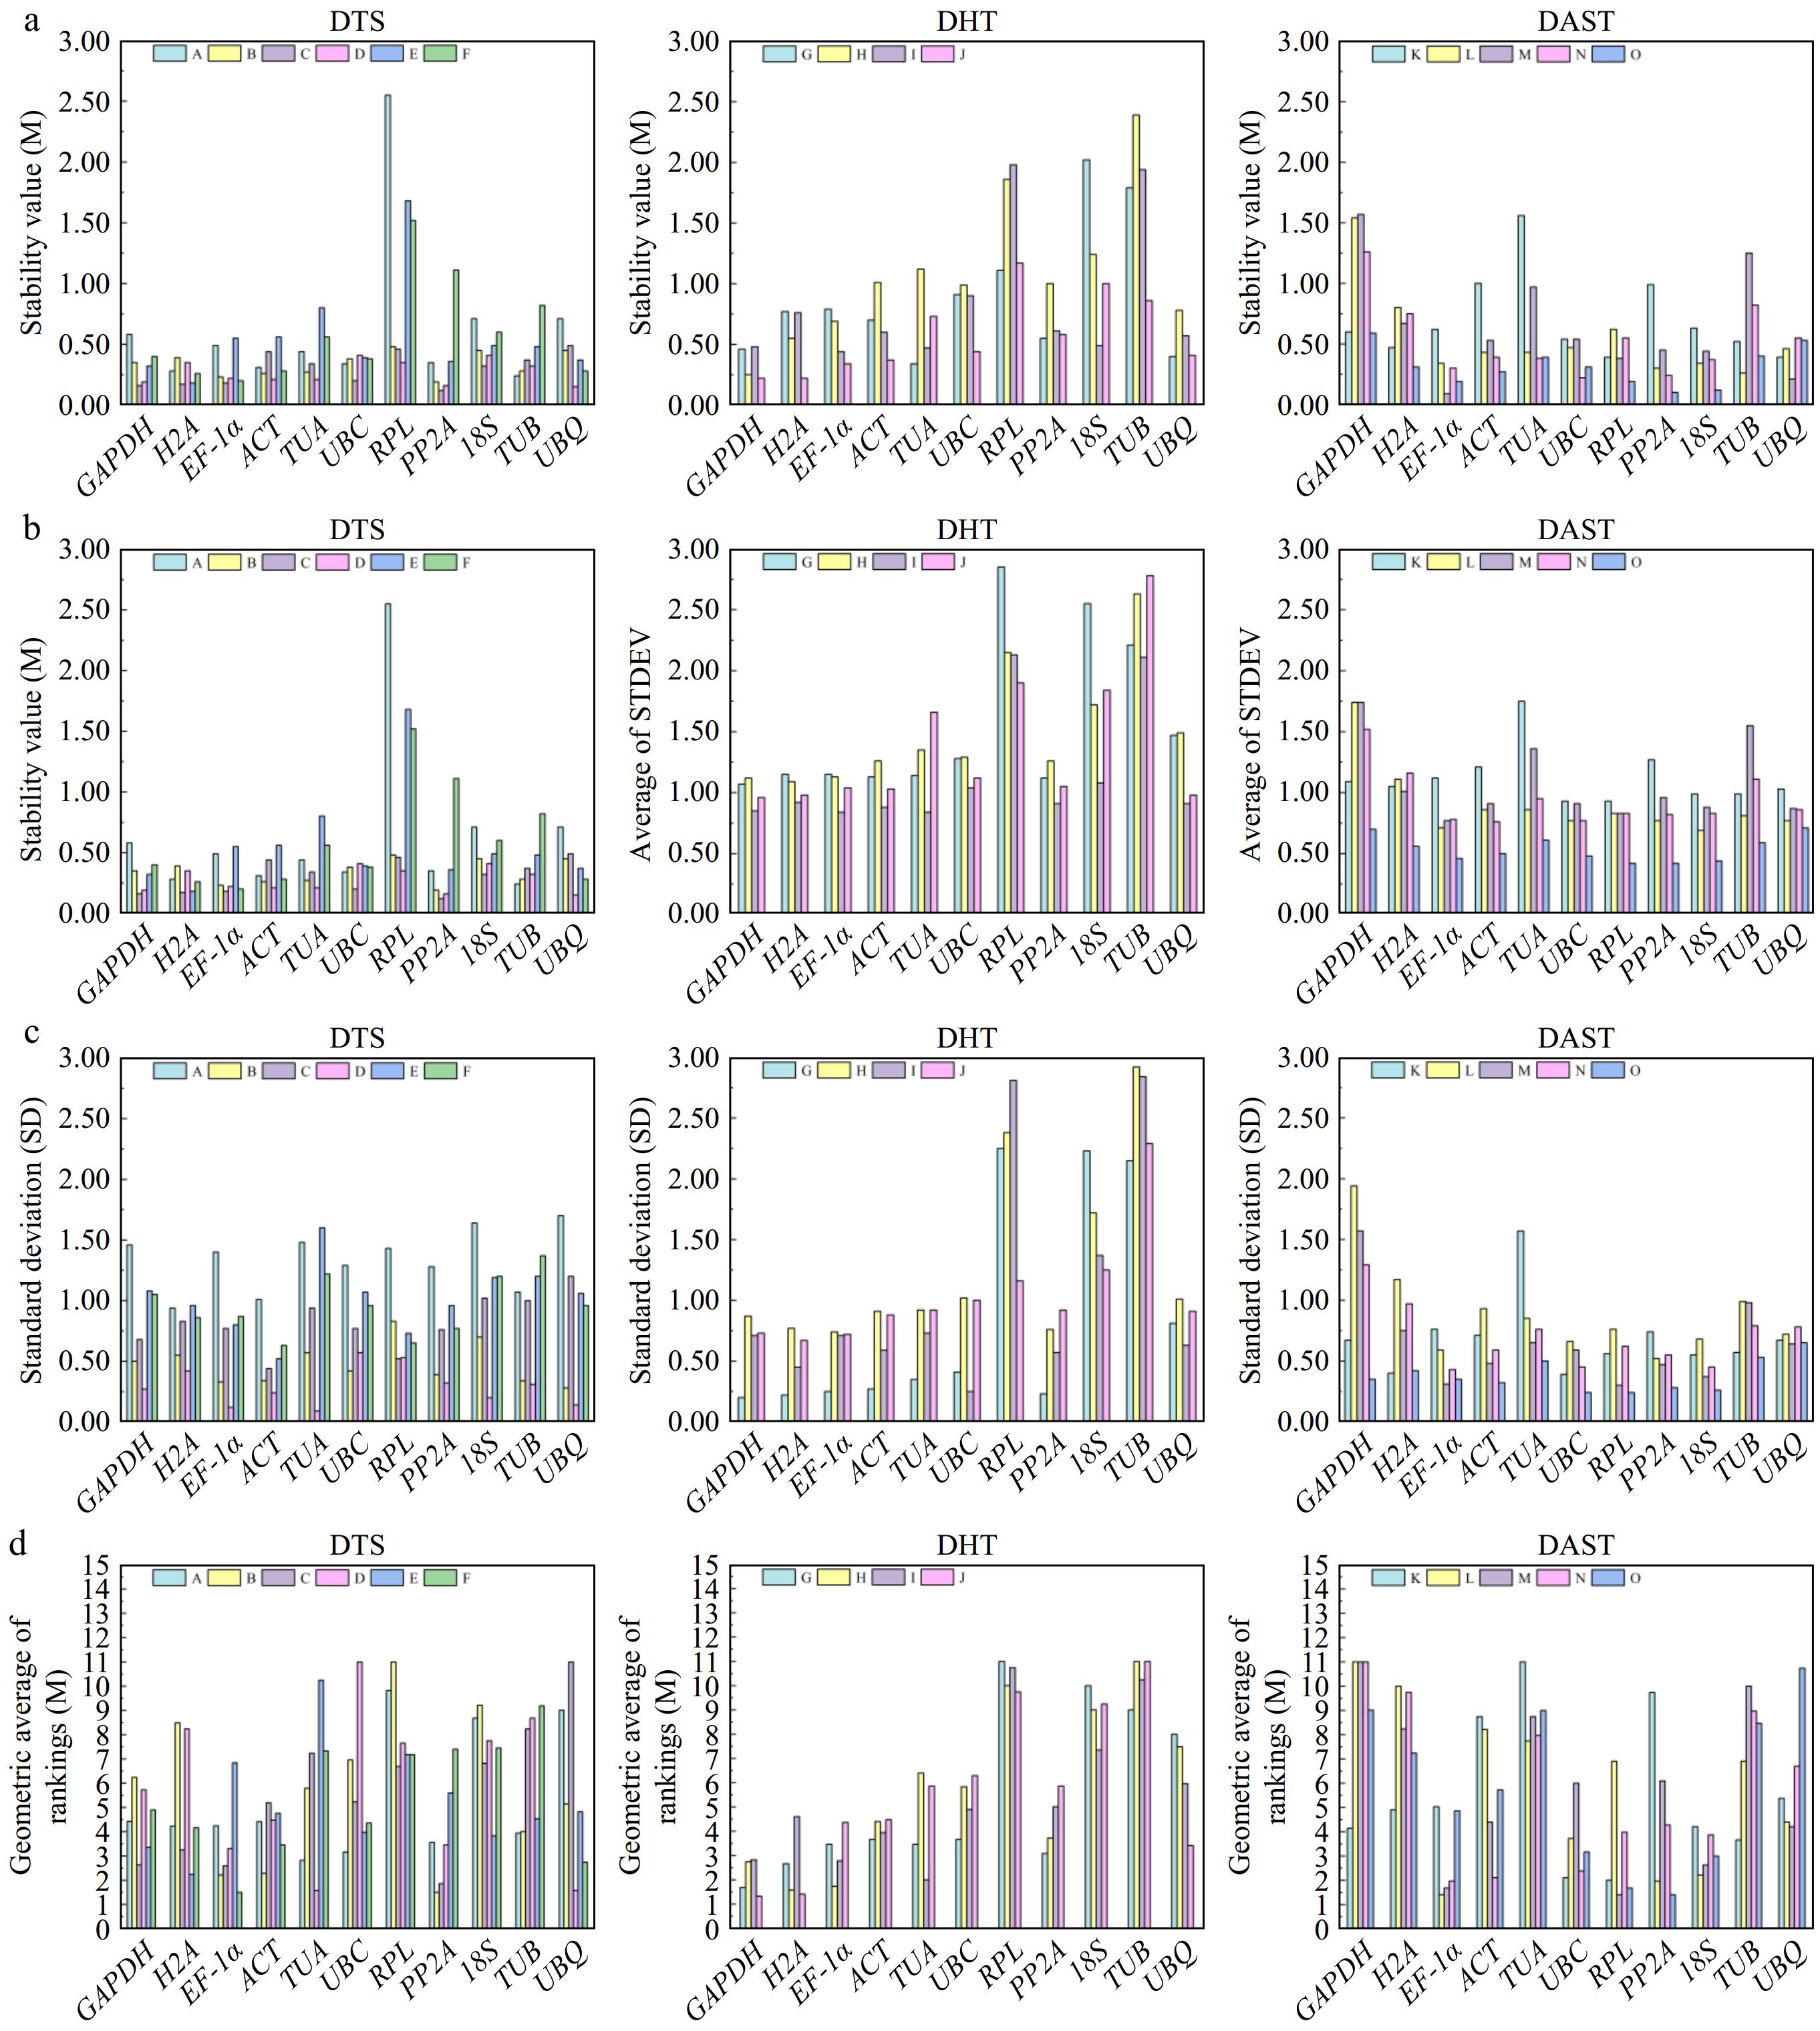
Figure 4.
Presents the stability analysis results of candidate reference genes for P. hunanense across diverse tissues, various hormone treatments, and different abiotic stresses using four software tools. Panels (a)−(d) respectively represent the results calculated by NormFinder, Delta Cᴛ, BestKeeper, and RefFinder. The lower the height of the rectangular column, the higher the stability of the reference gene. DTS includes (A) root, (B) stem, (C) leaf, (D) flower, (E) rhizome, and (F) bud. DHT consists of (G) GA3, (H) ABA, (I) GA3 + ABA , and (J) dH2O. DAST comprises (K) high-temperature stress, (L) low-temperature stress, (M) drought stress, (N) salinity stress, and (O) heavy metal stress.
Delta Cᴛ analysis involves pairwise comparisons of the Cᴛ values of housekeeping genes to evaluate the relative expression stability among them. This method calculates the average standard deviation (STDEV) of the Cᴛ values for each gene compared to others. A lower average standard deviation indicates higher gene expression stability[30]. The results revealed that EF-1α was the most stable reference gene in roots and buds, PP2A in stems and leaves, UBQ in flowers, and H2A in rhizomes. Under dH2O and GA3 treatments, GAPDH exhibited the highest stability. For ABA and GA3 + ABA treatments, H2A and TUA were the most stable reference genes, respectively. In high-temperature stress conditions, RPL demonstrated superior stability. Under low-temperature stress, 18S showed significantly higher stability compared to other genes. EF-1α was the most stable under drought stress. ACT and PP2A exhibited the greatest stability under salinity stress and heavy metal stress, respectively. The stability rankings of the 11 reference genes obtained through Delta Cᴛ analysis were largely consistent with those derived from NormFinder (Fig. 4b).
BestKeeper software directly calculates the Standard deviation value (SD) to measure the stability of gene expression. Generally, the smaller the SD value, the better the stability of gene expression[31]. Based on the analysis of standard deviation (SD) values, GAPDH, UBQ, and TUA were identified as the most stable reference genes in roots, stems, and flowers, respectively. ACT was determined to be the most stable reference gene in leaves, rhizomes, and buds. Under hormone treatments, GAPDH, EF-1α, and UBC exhibited the highest stability under GA3, ABA, and GA3 + ABA conditions, respectively. In the dH2O treatment group, ACT was the most stable reference gene. Under abiotic stress conditions, UBC showed the highest stability under high-temperature and heavy metal stresses, while PP2A, RPL, and EF-1α were the most stable reference genes under low-temperature, drought, and salinity stress, respectively. These findings differ to some extent from those obtained using GeNorm and NormFinder algorithms (Fig. 4c).
RefFinder (
http://blooge.cn/RefFinder/?type=reference ) is a comprehensive web-based algorithm for evaluating and screening candidate reference genes. It integrated four computing programs (GeNorm, NormFinder, Delta Cᴛ, BestKeeper) to rank the candidate reference genes[32]. Figure 4d presents the comprehensive stability ranking of candidate reference genes under various conditions. The results for different tissues and hormone induction treatments are largely consistent with those obtained from the aforementioned software analyses. However, there are slight variations in the stability rankings among different abiotic stress treatments. Specifically, under high-temperature stress, RPL exhibits the highest stability; under low-temperature stress, EF-1α shows significantly greater stability compared to other genes; under drought stress, RPL ranks first in stability; under salinity stress, EF-1α demonstrates the best stability; and under heavy metal stress, PP2A exhibits the most outstanding stability.Owing to the minor discrepancies in the ranking (R) of each reference gene within different software, the outcomes of the five assessment software were comprehensively evaluated through scoring. The selected reference genes differed under various conditions. Among the different tissue parts of P. hunanense, EF-1α was the most stable, followed by ACT and 18S, while the expression stability of TUB was the poorest (Table 2). In P. hunanense induced by different hormones, EF-1α was also the most stable reference gene, followed by H2A and PP2A, and the expression stability of TUB was also the poorest (Table 3). Under different abiotic stress treatments of P. hunanense, 18S was the most stable, followed by UBC and EF-1α, and the expression stability of GAPDH was the poorest (Table 4). Comprehensive analysis indicates that in the qRT-PCR studies of P. hunanense under different tissues, different hormone inductions, and different abiotic stress treatments, the transcription levels of EF-1α and 18S are relatively stable and can be utilized as reference genes for gene expression analysis of P. hunanense.
Table 2. Reference gene stability of different tissues were comprehensively analyzed.
Gene GeNorm NormFinder Delta Cᴛ BestKeeper RefFinder M Rank M Rank SD Rank SD Rank Stability Rank GAPDH 0.918 7 0.68 6 1.17 5 1.32 8 6.12 7 H2A 0.962 8 0.56 5 1.15 4 1.37 9 5.83 5 EF-1α 0.498 1 0.36 1 1.02 1 1.03 4 1.41 1 ACT 0.498 1 0.39 2 1.05 2 0.86 1 1.68 2 TUA 1.050 9 1.09 9 1.42 9 1.83 10 9.24 10 UBC 0.698 3 0.77 7 1.22 6 0.95 3 4.41 4 RPL 1.309 11 1.19 10 2.08 11 0.83 1 6.04 6 PP2A 0.862 6 0.49 3 1.23 7 1.05 6 6.24 8 18S 0.767 4 0.52 4 1.12 3 1.17 7 3.98 3 TUB 1.137 10 1.28 11 1.62 10 1.96 11 10.24 11 UBQ 0.813 5 0.83 8 1.32 8 1.03 4 6.32 9 Table 3. Reference gene stability of different hormone treatment was comprehensively analyzed.
Gene GeNorm NormFinder Delta Cᴛ BestKeeper RefFinder M Rank M Rank SD Rank SD Rank Stability Rank GAPDH 0.496 5 0.42 1 1.13 3 0.78 6 3.08 5 H2A 0.465 4 0.58 3 1.13 3 0.55 1 2.21 2 EF-1α 0.448 3 0.57 2 1.12 1 0.62 2 1.86 1 ACT 0.436 1 0.67 5 1.15 4 0.72 5 2.99 4 TUA 0.707 8 0.87 8 1.42 8 0.95 8 8.00 8 UBC 0.541 6 0.81 7 1.26 6 0.65 3 5.63 6 RPL 1.263 10 1.61 9 2.38 10 2.19 10 10.00 10 PP2A 0.436 1 0.69 6 1.16 5 0.65 3 2.94 3 18S 0.982 9 1.25 10 1.96 9 1.75 9 9.00 9 TUB 1.521 11 2.01 11 2.68 11 2.78 11 11.00 11 UBQ 0.632 7 0.59 4 1.33 7 0.83 7 6.74 7 Table 4. Reference gene stability of different abiotic stress treatments was comprehensively analyzed.
Gene GeNorm NormFinder Delta Cᴛ BestKeeper RefFinder M Rank M Rank SD Rank SD Rank Stability Rank GAPDH 1.071 11 1.15 11 1.52 11 1.20 11 11.00 11 H2A 0.871 9 0.70 8 1.19 9 0.92 9 8.74 9 EF-1α 0.676 6 0.34 1 0.91 4 0.50 2 2.63 3 ACT 0.618 4 0.55 7 0.97 6 0.64 6 5.42 5 TUA 0.970 10 0.95 10 1.42 10 1.09 10 10.00 10 UBC 0.553 1 0.47 4 0.89 2 0.49 1 1.86 2 RPL 0.593 3 0.45 3 0.89 2 0.55 5 3.08 4 PP2A 0.707 7 0.53 6 0.99 7 0.52 4 6.09 7 18S 0.553 1 0.40 2 0.88 1 0.50 2 1.57 1 TUB 0.784 8 0.70 8 1.18 8 0.84 8 8.24 8 UBQ 0.642 5 0.47 4 0.94 5 0.70 7 5.44 6 Stability verification of candidate reference genes
-
To further validate the stability of the candidate genes identified through comprehensive analysis, this study selected EF-1α, ACT, and 18S as reference genes for different tissue types; EF-1α, PP2A, and H2A for various hormone treatments; and EF-1α, UBC, and 18S for different abiotic stress conditions. The expression patterns of KO, KAM, GA13-ox, GA44-dio, ALDH7A1, and IPM in P. hunanense were analyzed using qRT-PCR.
In different tissues, KO, KAM, and GA44-dio showed similar expression patterns, with the highest relative expression in the roots; GA13-ox had the highest expression in the buds, while ALDH7A1 and IPM exhibited high expression levels in both roots and flowers. Under ABA treatment, the expression patterns of KO, GA13-ox, and IPM initially increased and then decreased, with significantly lower expression at 24 h compared to 1 h. GA44-dio also showed higher expression at 1 h than at 24 h, whereas KAM exhibited the opposite trend, with peak expression at 24 h. In the GA3 treatment group, the expression levels of KO, KAM, and GA13-ox were lower at 24 h compared to 1 h, while GA44-dio, ALDH7A1, and IPM showed higher expression at 24 h. In the combined GA3 + ABA treatment group, KAM and ALDH7A1 exhibited higher expression at 24 h compared to 1 h, while KO, GA44-dio, and IPM showed higher expression at 1 h. Under high-temperature stress, KO, GA13-ox, GA44-dio, and IPM showed an increasing trend, with the highest expression at 24 h, whereas KAM and ALDH7A1 exhibited decreasing trends, with lower expression at 24 h. Under drought stress, KO, KAM, GA13-ox, and GA44-dio showed a continuous decrease, with the lowest expression at 24 h, while ALDH7A1 and IPM showed higher expression at 24 h. Across other treatment conditions, the expression levels of the target genes at different time points also exhibited similar variations (Fig. 5).
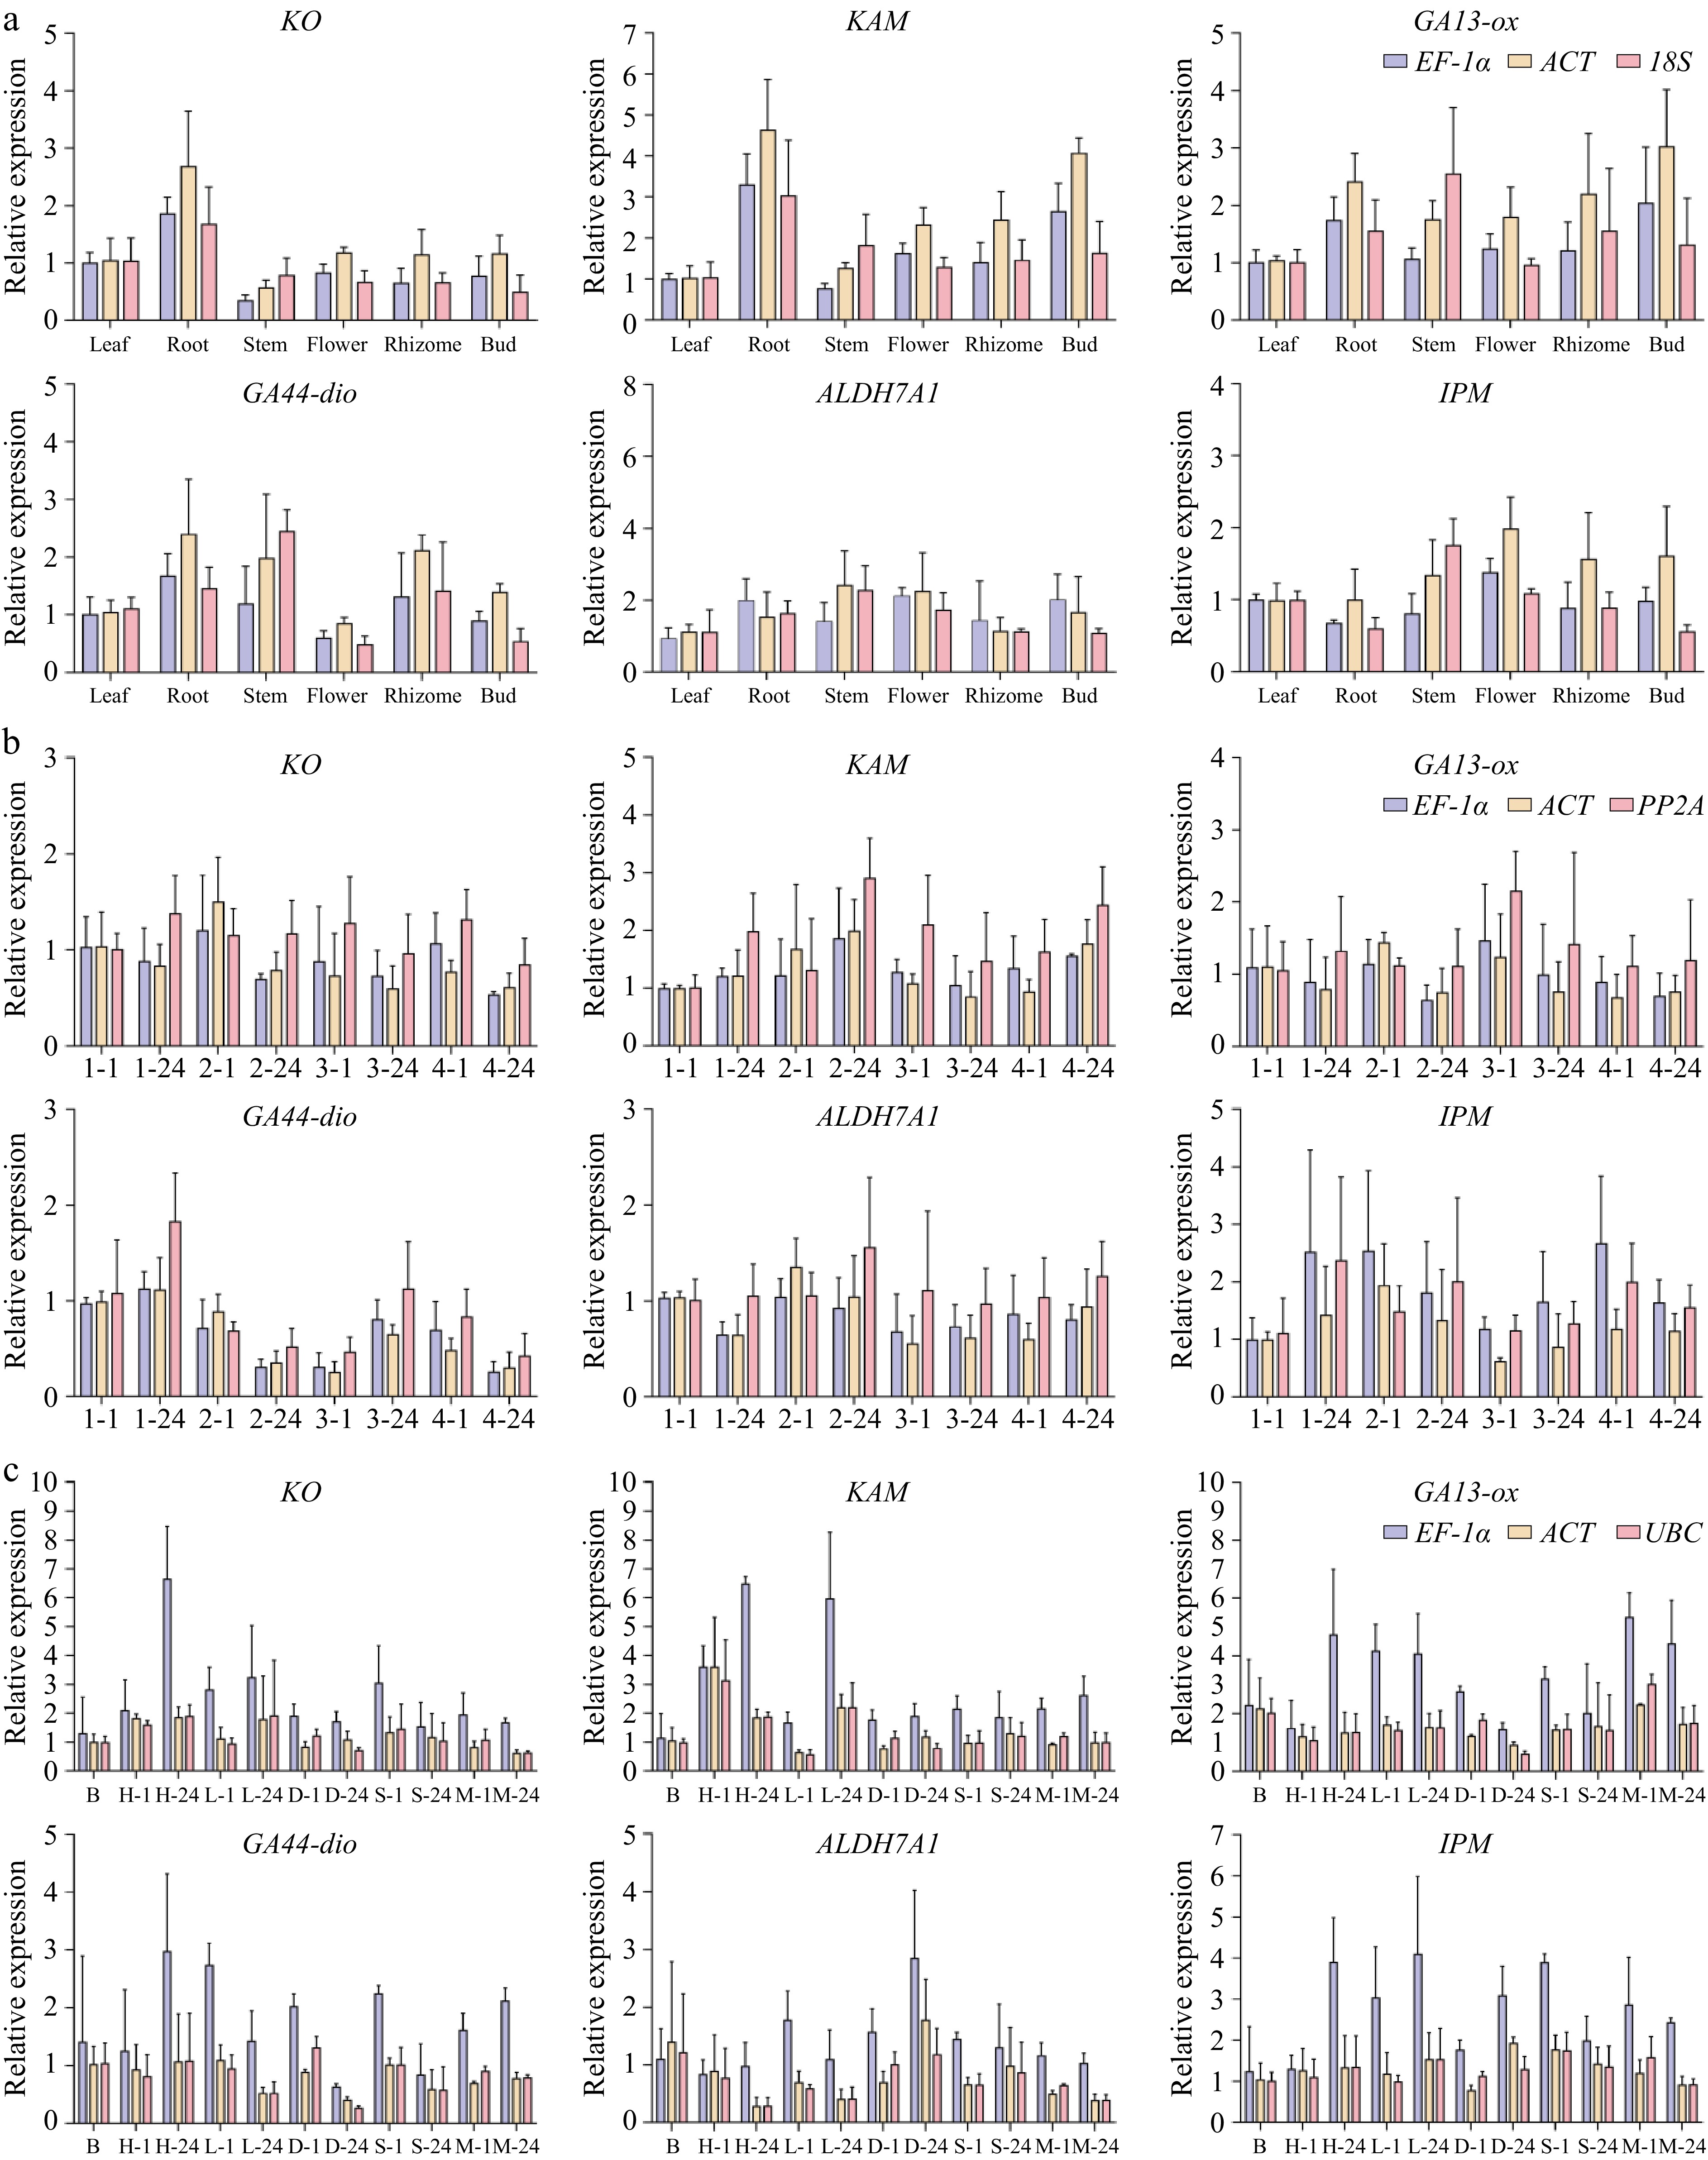
Figure 5.
Demonstrates the expression patterns of phytohormone metabolism-associated genes in P. hunanense across heterogeneous biological samples. (KO: ent-kaurene oxidase; KAM: ent-kaurenoic acid monooxygenase; GA13-ox: gibberellin 13-oxidase; GA44-dio: gibberellin 44-dioxygenase; ALDH7A1: aldehyde dehydrogenase family 7 member A1; IPM: indole-3-pyruvate monooxygenase) across three experimental dimensions, with all data points representing means ± standard error (n = 3). (a) Tissue expression was quantified in root, stem, leaf, flower, rhizome, and bud using the EF-1α, ACT and 18S normalization system. The relative expression of the target gene under distinct hormone inductions and time periods was calculated by taking EF-1α, PP2A, and H2A as internal references; (b) The relative expression of the target gene under distinct hormone inductions and time periods was calculated by taking EF-1α, PP2A, and H2A as internal references; the x-axis represents the various hormone induction conditions, from left to right being dH2O for 1 h, dH2O at 24 h, ABA at 1 h, ABA at 24 h, GA3 at 1 h, GA3 at 24 h, GA3+ ABA at 1 h, and GA3 + ABA at 24 h. (c) The relative expression of the target gene under different abiotic stress treatments and timeframes was determined using EF-1α, UBC, and 18S as internal references.The x-axis indicates the diverse treatment conditions, from left to right: blank control, high temperature at 1 h, high temperature at 24 h, low temperature at 1 h, low temperature at 24 h, drought at 1 h, drought at 24 h, salinity stress at 1 h, salinity stress at 24 h, heavy metal stress at 1 h and heavy metal stress at 24 h.
When each of the three groups independently selected three relatively stable genes as reference genes for normalization, the relative expression patterns of the target genes exhibited consistent trends. Therefore, the data obtained using the aforementioned algorithm are accurate and reliable.
-
In plants, qRT-PCR reference genes are typically Housekeeping genes, which are a class of genes expressed in all cells and whose products are essential for maintaining basic cellular life activities[35]. P. hunanense is evergreen throughout the year, has a high rhizome yield, and holds great development prospects. Analyzing the molecular mechanism of its unique germination pattern can lay a theoretical foundation for the study of plant growth and physiology. Currently, gene expression analyses in Polygonatum sibiricum[36], Polygonatum cyrtonema[37], P. kingianum[38], and Polygonatum odoratum[39] within the same genus have been reported. However, due to the complex genetic background of plants in the Polygonatum genus and the significant differences in gene transcription levels, the selection of reference genes varied. Wang et al. chose β-actin as the reference gene for qRT-PCR analysis of P. sibiricum[36], while Feng et al.[40] and Liao et al.[41] used 18S and GAPDH as references for gene expression analysis of P. sibiricum. Yang et al. discovered that UBQ-E2-10 and EF-1α2 are suitable for studying gene expression in the rhizomes of P. cyrtonema at different developmental stages and under abiotic stress, respectively[37]. Moreover, Qian et al. used Actin as a reference to study the transcriptomic response of the rhizomes of P. kingianum under drought stress[38]. Actin is also used as a reference gene in P. odoratum[42,43]. Lu et al. utilized EF-1α2 as a reference gene to analyze the genes related to the biosynthesis of polysaccharides and steroid saponins in the three medicinal Polygonatum species[44]. Thus, it is highly necessary to screen suitable reference genes for P. hunanense.
In this study, we selected 11 candidate reference genes (GAPDH, H2A, EF-1α, ACT, TUA, UBC, RPL, PP2A, 18S, TUB, UBQ) based on the commonly used reference genes in related species. These genes were identified from the transcriptome data of P. hunanense generated by our research group. The stability of these candidate reference genes was evaluated across different tissues, hormone treatments, and abiotic stress conditions using GeNorm, NormFinder, Delta Cᴛ, BestKeeper, and RefFinder software.
EF-1α is a protein factor that promotes polypeptide chain elongation and is the second most abundant protein in cells after Actin, whose expression regulation is highly conserved in different species[45]. He et al. demonstrated that EF-1α exhibited the highest expression stability in Benincasa hispida Cogn in different tissues[46]. 18S is a critical component of eukaryotic ribosomes, playing an essential role in ribosome assembly and function[47]. It is characterized by its relatively stable expression levels and high abundance. This stability has been corroborated by Pang et al.[48], who found that 18S was the most stable under high-temperature stress in Solanum melongena, and by Zhou et al.[49], who reported similar findings in different tissues and under various plant growth regulators in Solanum aculeatissimum. Actin is a type of highly conserved globular microfilament structural protein, and can be classified into three types in higher animal cells: α, β, and γ. Among them, β-actin is often used as a reference gene due to its highly conserved amino acid sequence, small variation in expression quantity in different tissues, and high expression level[50]. The histone gene H2A is a basic protein in the chromatin of eukaryotes and is stably expressed in organisms[37]. Studies have shown that H2A has been selected as the most suitable reference gene in many species, such as Vigna mungo[51], and Hypericum perforatum L. under heat treatment conditions[52]. PP2A is a widely specific serine/threonine phosphatase, and the protein dephosphorylation it mediates plays a crucial role in regulating both biotic and abiotic stress responses in plants[53]. Its utility as a reference gene has been extensively documented across various studies. For example, PP2A has been used under nitrogen stress, low temperature, and light stress conditions in Solanum lycopersicum[54], in Ganoderma lucidum treated with Methyl jasmonate and Salicylic acid[55], and during the adventitious root regeneration stage of poplar[56]. UBC is a key enzyme gene in the ubiquitin-proteasome degradation pathway, playing an essential role in plant growth and development, DNA repair, plant immune responses, and abiotic stress responses. It is ubiquitously expressed in cells[57]. Wang et al. identified ACT7 and UBC1 as the most suitable reference genes for functional studies of Achyranthes bidentata[58]. Evidently, genes such as EF-1α, ACT, 18S, H2A, PP2A, and UBC can all be widely employed as common reference genes, which is in line with the conclusion of this study.
-
This study provides the first evidence that EF-1α, 18S, and ACT can serve as reliable reference genes for gene expression analysis in different tissues of P. hunanense. Additionally, EF-1α, H2A, and PP2A are suitable as reference genes for expression analysis under various hormone treatments, while 18S, UBC, and EF-1α are appropriate for expression analysis under abiotic stress conditions. The stability of reference genes varies across different experimental conditions, including tissue types, hormone treatments, and abiotic stresses. Therefore, it is crucial to select appropriate reference genes based on specific experimental contexts or use multiple reference genes simultaneously to ensure accurate quantification of gene expression. Notably, EF-1α exhibits the highest stability among these reference genes, making it an ideal choice for gene expression studies in P. hunanense. This finding will facilitate further research into the molecular mechanisms underlying its high yield and provide a basis for comparative studies with other Polygonatum species.
This work was supported by the Natural Science Foundation of Hunan Province of China (Grant Nos 2023JJ60125, 2023JJ40482); the Science and Technology Popularization Special Project of Hunan Provincial Department of Science and Technology (2023ZK4028); the Department of Science and Technology of Hunan Province (2023SK2046); the Science and Technology Commissioner Service for Rural Revitalization Project of Hunan Province (2023NK4142); and the Innovation Project for Postgraduate Students of Hunan University of Chinese Medicine (2024CX003).
-
The authors confirm contribution to the paper as follows: study conception and design: Tan C, Peng C, Wang W, Ning L, Gong L; data collection: Tan C, Qin X, Xiao Q; analysis and interpretation of results: Tan C, Xiao Q. draft manuscript preparation: Tan C, Zhang R. All authors reviewed the results and approved the final version of the manuscript.
-
The data supporting the conclusions of this article are within the paper. The raw reads of RNA-seq were deposited in the SRA (NCBI Sequence Read Archive) database with the accession number PRJNA946346 (https://dataview.ncbi.nlm.nih.gov/object/PRJNA946346?reviewer=o0fcdre6cumui7jjo27imv5eg7).
-
The authors declare that they have no conflict of interest.
- Supplementary Tables S1 Details of primer sequences used in the qRT-PCR analysis.
- Supplementary Tables S2 FPKM and annotation of the selected genes from the transcriptome data.
- Supplementary Tables S3 Quality evaluation of total RNA in different tissues, under different hormone treatments and different abiotic stress treatments of P. hunanense.
- Supplementary Fig. S1 The total RNA electrophoretic gel under different abiotic stress treatments of P. hunanense.
- Supplementary Fig. S2 Specificity validation of reference gene amplifications. Melting curve analysis demonstrates single-peak profiles for all candidate reference genes, indicating specific amplification. The y-axis (−ΔF/ΔT) represents the temperature-dependent fluorescence decay rate, with peak temperatures (Tm) corresponding to product denaturation thresholds. The presence of single sharp peaks in melting curve profiles suggests primer specificity, while the absence of secondary peaks indicates no detectable formation of primer-dimers or other nonspecific amplifications.
- Copyright: © 2025 by the author(s). Published by Maximum Academic Press, Fayetteville, GA. This article is an open access article distributed under Creative Commons Attribution License (CC BY 4.0), visit https://creativecommons.org/licenses/by/4.0/.
-
About this article
Cite this article
Tan C, Qin X, Xiao Q, Zhang R, Peng C, et al. 2025. Screening and validation of reference genes for quantitative real-time PCR in Polygonatum hunanense. Medicinal Plant Biology 4: e021 doi: 10.48130/mpb-0025-0018 

Screening and validation of reference genes for quantitative real-time PCR in Polygonatum hunanense
- Received: 11 November 2024
- Revised: 16 April 2025
- Accepted: 07 May 2025
- Published online: 26 June 2025
Abstract: Polygonatum hunanense H.H. Liu & B.Z. Wang (syn. P. kingianum var. grandifolium), is a perennial Liliaceae species with ethnopharmaceutical and nutraceutical value. It exhibits traditional medicinal properties such as qi-tonifying, yin-nourishing, kidney-benefiting, and antioxidant activities. P. hunanense maintains evergreen foliage year-round and shows significantly higher biomass accumulation than congener taxa. These traits are linked to phytohormone regulation, as indicated by previous studies. The absence of validated reference genes in P. hunanense has hindered molecular-level investigations in this species to date. In this study, 11 candidate reference genes (GAPDH, H2A, EF-1α, ACT, TUA, UBC, RPL, PP2A, 18S, TUB, and UBQ) were identified from the P. hunanense transcriptome dataset. Expression profiles of these genes were analyzed by qRT-PCR across three experimental conditions: different tissues, hormone treatments, and abiotic stresses. Gene expression stability was analyzed using GeNorm, NormFinder, Delta Cᴛ, BestKeeper, and RefFinder software. The stability of candidate reference genes was validated through expression analysis of target genes (KO, KAM, GA13-ox, GA44-dio, ALDH7A1, IPM) involved in phytohormone metabolic pathways. Overall, the stability of the 11 candidate reference genes varied among different P. hunanense samples. EF-1α, 18S and ACT were identified as the most stable in tissue samples. EF-1α, H2A and PP2A showed the highest stability under hormone treatments, and 18S, UBC, and EF-1α exhibited consistent stability in abiotic stresses. This study establishes EF-1α as the optimal pan-experimental reference gene for qRT-PCR normalization in P. hunanense, demonstrating consistent expression stability across diverse tissues, hormone treatments, and abiotic stresses, thereby providing a significant reference for future gene expression studies.
-
Key words:
- Polygonatum hunanense /
- Reference gene /
- qRT-PCR /
- Gene expression /
- EF-1α