


-
Atmospheric nitrogen deposition is a key component of the global nitrogen cycle, acting as a sink for reactive nitrogen (Nr) in the atmosphere and as an external nutrient source for both terrestrial and marine ecosystems[1−3]. A substantial fraction of global nitrogen deposition enters the ocean, where it provides additional reactive nitrogen to phytoplankton and can influence marine productivity and the global carbon cycle[4−6]. Previous studies have suggested that anthropogenic nitrogen deposition has already made a measurable contribution to marine new production and the uptake of atmospheric CO2[5,7], although recent work points to large regional variations and substantial uncertainties associated with biogeochemical feedbacks and co-limitation by other nutrients such as phosphorus and iron[8,9]. Understanding the spatial variations and future evolution of atmospheric nitrogen deposition to oceans will help better constrain the interconnected carbon and nitrogen cycles.
Oceanic nitrogen deposition is ultimately controlled by reactive nitrogen emissions from both anthropogenic activities (e.g., fossil fuel combustion, agricultural fertilizer use, and livestock production) and natural sources (e.g., soils, lightning, and the ocean itself)[10−12]. These sources emit nitrogen primarily in reduced (NH3) and oxidized (NOx) forms and participate in atmospheric chemical processes that lead to the formation of nitrogen-containing aerosols, with implications for climate and air quality[13−17]. NH3 rapidly partitions with acidic species to form ammonium aerosols (NH4+), while NOx is oxidized to gas-phase nitric acid (HNO3) and particulate nitrate (NO3−). The reduced nitrogen family is collectively referred to as NHx (NH3 + NH4+), and the oxidized family as NOy (including NOx, HNO3, NO3−, and related species)[18,19]. These gases and aerosols are eventually removed by wet and dry deposition, delivering NHx and NOy to the surface ocean.
Over the past decades, anthropogenic Nr emissions have undergone strong regional trends driven by changes in energy use, agricultural activities, and environmental policies, leading to notable trends and variability in oceanic nitrogen deposition[17,20,21]. Recent modelling studies have shown that global oceanic NHx deposition increased by 89% during 1970–2018, while NOy deposition increased by 43% during 1970–2010 and then declined by 6% over 2010–2018 in response to anthropogenic NOx controls in developing countries[20]. Future emission pathways under different socioeconomic and climate-mitigation scenarios are expected to substantially alter atmospheric nitrogen deposition. Most existing studies on future nitrogen deposition have focused on global land-atmosphere budgets or regional air quality and ecosystem impacts[19,22,23], whereas comprehensive assessments of oceanic nitrogen deposition under shared socioeconomic pathways and its implications for marine productivity and climate-relevant gases such as N2O remain limited.
Meanwhile, there is growing policy interest in managing nitrogen pollution to achieve cleaner air, reduced biodiversity loss, and co-benefits for the climate[24−27]. Recent work has highlighted that ambitious nitrogen interventions can yield substantial benefits for PM2.5 air quality, biodiversity protection, and greenhouse gas mitigation[28−32]. Stringent nitrogen controls may also alter the strength and spatial distribution of nitrogen deposition to the oceans. Yet, it is still unclear how different combinations of NH3 and NOx emission reductions would propagate through the atmosphere to affect oceanic nitrogen deposition, and to what extent single-pollutant vs multi-pollutant control strategies differ in their impacts on oceanic nitrogen deposition.
In this study, the knowledge gaps are addressed using the global atmospheric chemistry transport model GEOS-Chem to: (1) quantify changes in global and regional oceanic nitrogen deposition between 2015 and 2050 under three CMIP6 future emission scenarios; (2) disentangle the atmospheric mechanisms by which NH3 and NOx emissions jointly determine NHx and NOy deposition to the oceans; and (3) estimate the potential impacts of these changes on ocean primary productivity and oceanic N2O emissions following an established biogeochemical framework[5]. By focusing specifically on the chemical compensation between NHx and NOy and its consequences for oceanic nitrogen inputs, it is found that the coordinated and joint control of NH3 and NOx is essential for effectively reducing total nitrogen deposition to the oceans. The results provide an earth-system-scale perspective on how future emission mitigation and nitrogen management strategies may unintentionally reshape marine ecosystems.
-
The Goddard Earth Observing System Chemistry (GEOS-Chem) 3-D global atmospheric chemistry transport model, version 12.9.3, was used to simulate global nitrogen deposition for 2015 and 2050 under various future emission scenarios. The model is driven by NASA MERRA-2 meteorological data, with a horizontal resolution of 2° × 2.5° and a vertical resolution of 47 layers extending from the surface to 0.01 hPa. The model employs a full chemistry mechanism that incorporates tropospheric ozone, nitrogen oxides, hydrocarbons, and aerosol chemistry[33].
GEOS-Chem links surface emissions of NH3 and NOx to their deposition through coupled chemical and physical processes. Emitted NH3 undergoes rapid gas-particle partitioning with sulfate and nitrate to form ammonium aerosols (NH4+), while NOx is oxidized by OH, O3, and HO2 to produce nitric acid (HNO3) and particulate nitrate (NO3−). Heterogeneous reactions, including N2O5 hydrolysis and aerosol-phase oxidation, further regulate the partitioning between oxidized nitrogen species. These chemical transformations, along with interactions with other atmospheric constituents, determine the forms and distributions of nitrogen available for deposition. Nitrogen is subsequently removed from the atmosphere via wet and dry deposition. Wet deposition, including convective scavenging, large-scale precipitation removal, and rainout, follows the parameterization of Liu et al.[34], whereas dry deposition of gases and aerosols is calculated using the standard resistance-in-series model[35].
Anthropogenic emissions are from the Coupled Model Intercomparison Project Phase 6 (CMIP6) emission inventory, which includes NH3, NOx, black carbon (BC), methane (CH4), carbon monoxide (CO), organic carbon (OC), sulfur dioxide (SO2), and various VOC species emissions from agricultural, energy, transportation, and industry sectors. To project future nitrogen deposition under representative emission pathways, three scenarios are selected, including SSP1-RCP2.6 (abbreviated as SSP126; low-emission scenario), SSP3-RCP7.0 (abbreviated as SSP370; high-emission scenario), and SSP4-RCP3.4 (abbreviated as SSP434; moderate-emission scenario). SSP126 represents a sustainable development pathway, assuming strict global emission-reduction policies that significantly lower greenhouse gas and NOx emissions[36]. SSP370 reflects rapid economic growth with insufficient environmental policies, leading to medium-to-high emissions[37]. SSP434 represents a moderate mitigation pathway with balanced climate and development goals, falling between SSP126 and SSP370[38]. Natural emission sources, including NOx from soil and lightning, NH3 emissions from seabirds and soils, and biomass burning emissions from the GFED4 fire database, are fixed at 2015 levels in future simulations[39,40].
A baseline simulation was conducted with the 2015 anthropogenic emissions, and three simulations with future-scenario (2050) emissions (SSP126, SSP434, and SSP370). The year 2015 was selected as the baseline year to align with the historical period of the CMIP6 emission inventories. Sensitivity experiments are conducted to evaluate the individual and combined effects of reductions in anthropogenic NH3 and NOx emissions on nitrogen deposition. Emissions of NH3 and NOx are reduced by 25%, 50%, and 100% as described in an earlier study[30]. Each simulation is run for one year and four months, with the first four months as a spin-up to achieve equilibrium. To focus on the impacts of changing anthropogenic emissions, all simulations are driven by the same meteorological fields, fixed for 2015.
Here, to characterize regional nitrogen deposition in both coastal and open oceans, four representative coastal regions (China coast, Indian coast, European coast, and US coast) and four adjacent open ocean regions (North Pacific Ocean, North Indian Ocean, East Atlantic Ocean, and Western Atlantic Ocean) are focused on as shown in Supplementary Fig. S1 following Liu et al.[20]. The simulated wet deposition fluxes of NH4+ and NO3− are validated in the 2015 baseline scenario against observational data from available global monitoring networks, including the National Trends Network (NTN,
http://nadp.slh.wisc.edu/data/NTN ), the Atmospheric Integrated Research Monitoring Network (AIRMoN,https://nadp2.slh.wisc.edu/data/AIRMoN ), the European Monitoring and Evaluation Program (EMEP,https://ebas-data.nilu.no/Default.aspx ), and the Monitoring Network in East Asia (EANET,www.eanet.asia ).Estimates of atmospheric nitrogen deposition induced potential oceanic productivity and N2O emissions
-
This study follows the approach of Duce et al.[5] to quantify the contribution of atmospheric nitrogen deposition to oceanic primary production and N2O emissions. The Redfield ratio (C : N : P = 106:16:1), which describes the typical elemental composition of marine organic matter in the proportion of 106 moles carbon (C), 16 moles nitrogen (N), and 1 mole phosphorus (P), is applied to estimate the potential oceanic productivity associated with new nitrogen inputs, assuming other nutrients (P and Fe) are adequate[5,41−44]. For N2O emissions, a linear scaling factor is adopted based on the estimate of mean global oceanic N2O flux (5.0 Tg N a−1) resulting from the total new nitrogen input to the surface ocean (167 Tg N a−1 from N2 fixation and atmospheric deposition)[5].
The impact of nitrogen deposition on new production (NP) is evaluated, which refers to productivity supported by new nutrients entering the euphotic zone. NP can be estimated by net primary productivity (NPP) using Eppley and Peterson's empirical formula[45]:
$ NP=\begin{cases} 0.0025\times {NPP}^{2},\;NPP\leqslant\;200\;\mathrm{mg\;C}\;{\mathrm{m}}^{-2}\;{\mathrm{d}}^{-1}\\ 0.5\times NPP,\;NPP \gt \;200\;\mathrm{mg\;C}\;{\mathrm{m}}^{-2}\;{\mathrm{d}}^{-1}\\ \end{cases} $ (1) Here, the dataset of marine NPP estimated by the Vertically Generalized Production Model is obtained, a widely-used chlorophyll-based model (VGPM,
http://orca.science.oregonstate.edu/1080.by.2160.monthly.hdf.vgpm.v.chl.v.sst.php ). The ratio of nitrogen deposition-induced production and the new production provides a more relevant estimate of the extent to which atmospheric nitrogen deposition potentially supports new oceanic production. -
Global reactive nitrogen (Nr; NH3 and NOx) emissions in 2015 are estimated to be 133.1 Tg N a−1 and marine emissions contribute 21.1 Tg N a−1 (16%) (Fig. 1). Marine N emissions include 10.4 Tg N a−1 as NH3 mostly from natural sources (e.g., phytoplankton activity and microbial processes) and 10.7 Tg N a−1 as NOx from anthropogenic sources such as shipping activities. It is demonstrated that the model simulated NH4+ and NO3− wet deposition fluxes are in reasonable agreement with ground-based observations (Supplementary Fig. S2; Fig. 2), with correlation coefficients of 0.75 for NH4+ deposition and 0.73 for NO3− deposition and normalized mean biases of 0.3% for NH4+ deposition and 15.6% for NO3− deposition. Model biases in Asia and Europe are slightly larger, with NH4+ wet deposition fluxes underestimated by 14.6%–19.2%. Such underestimation may result from inaccuracies in bottom-up NH3 estimations and NH3-NH4+ partitioning affected by aerosol precursor emissions and chemistry.
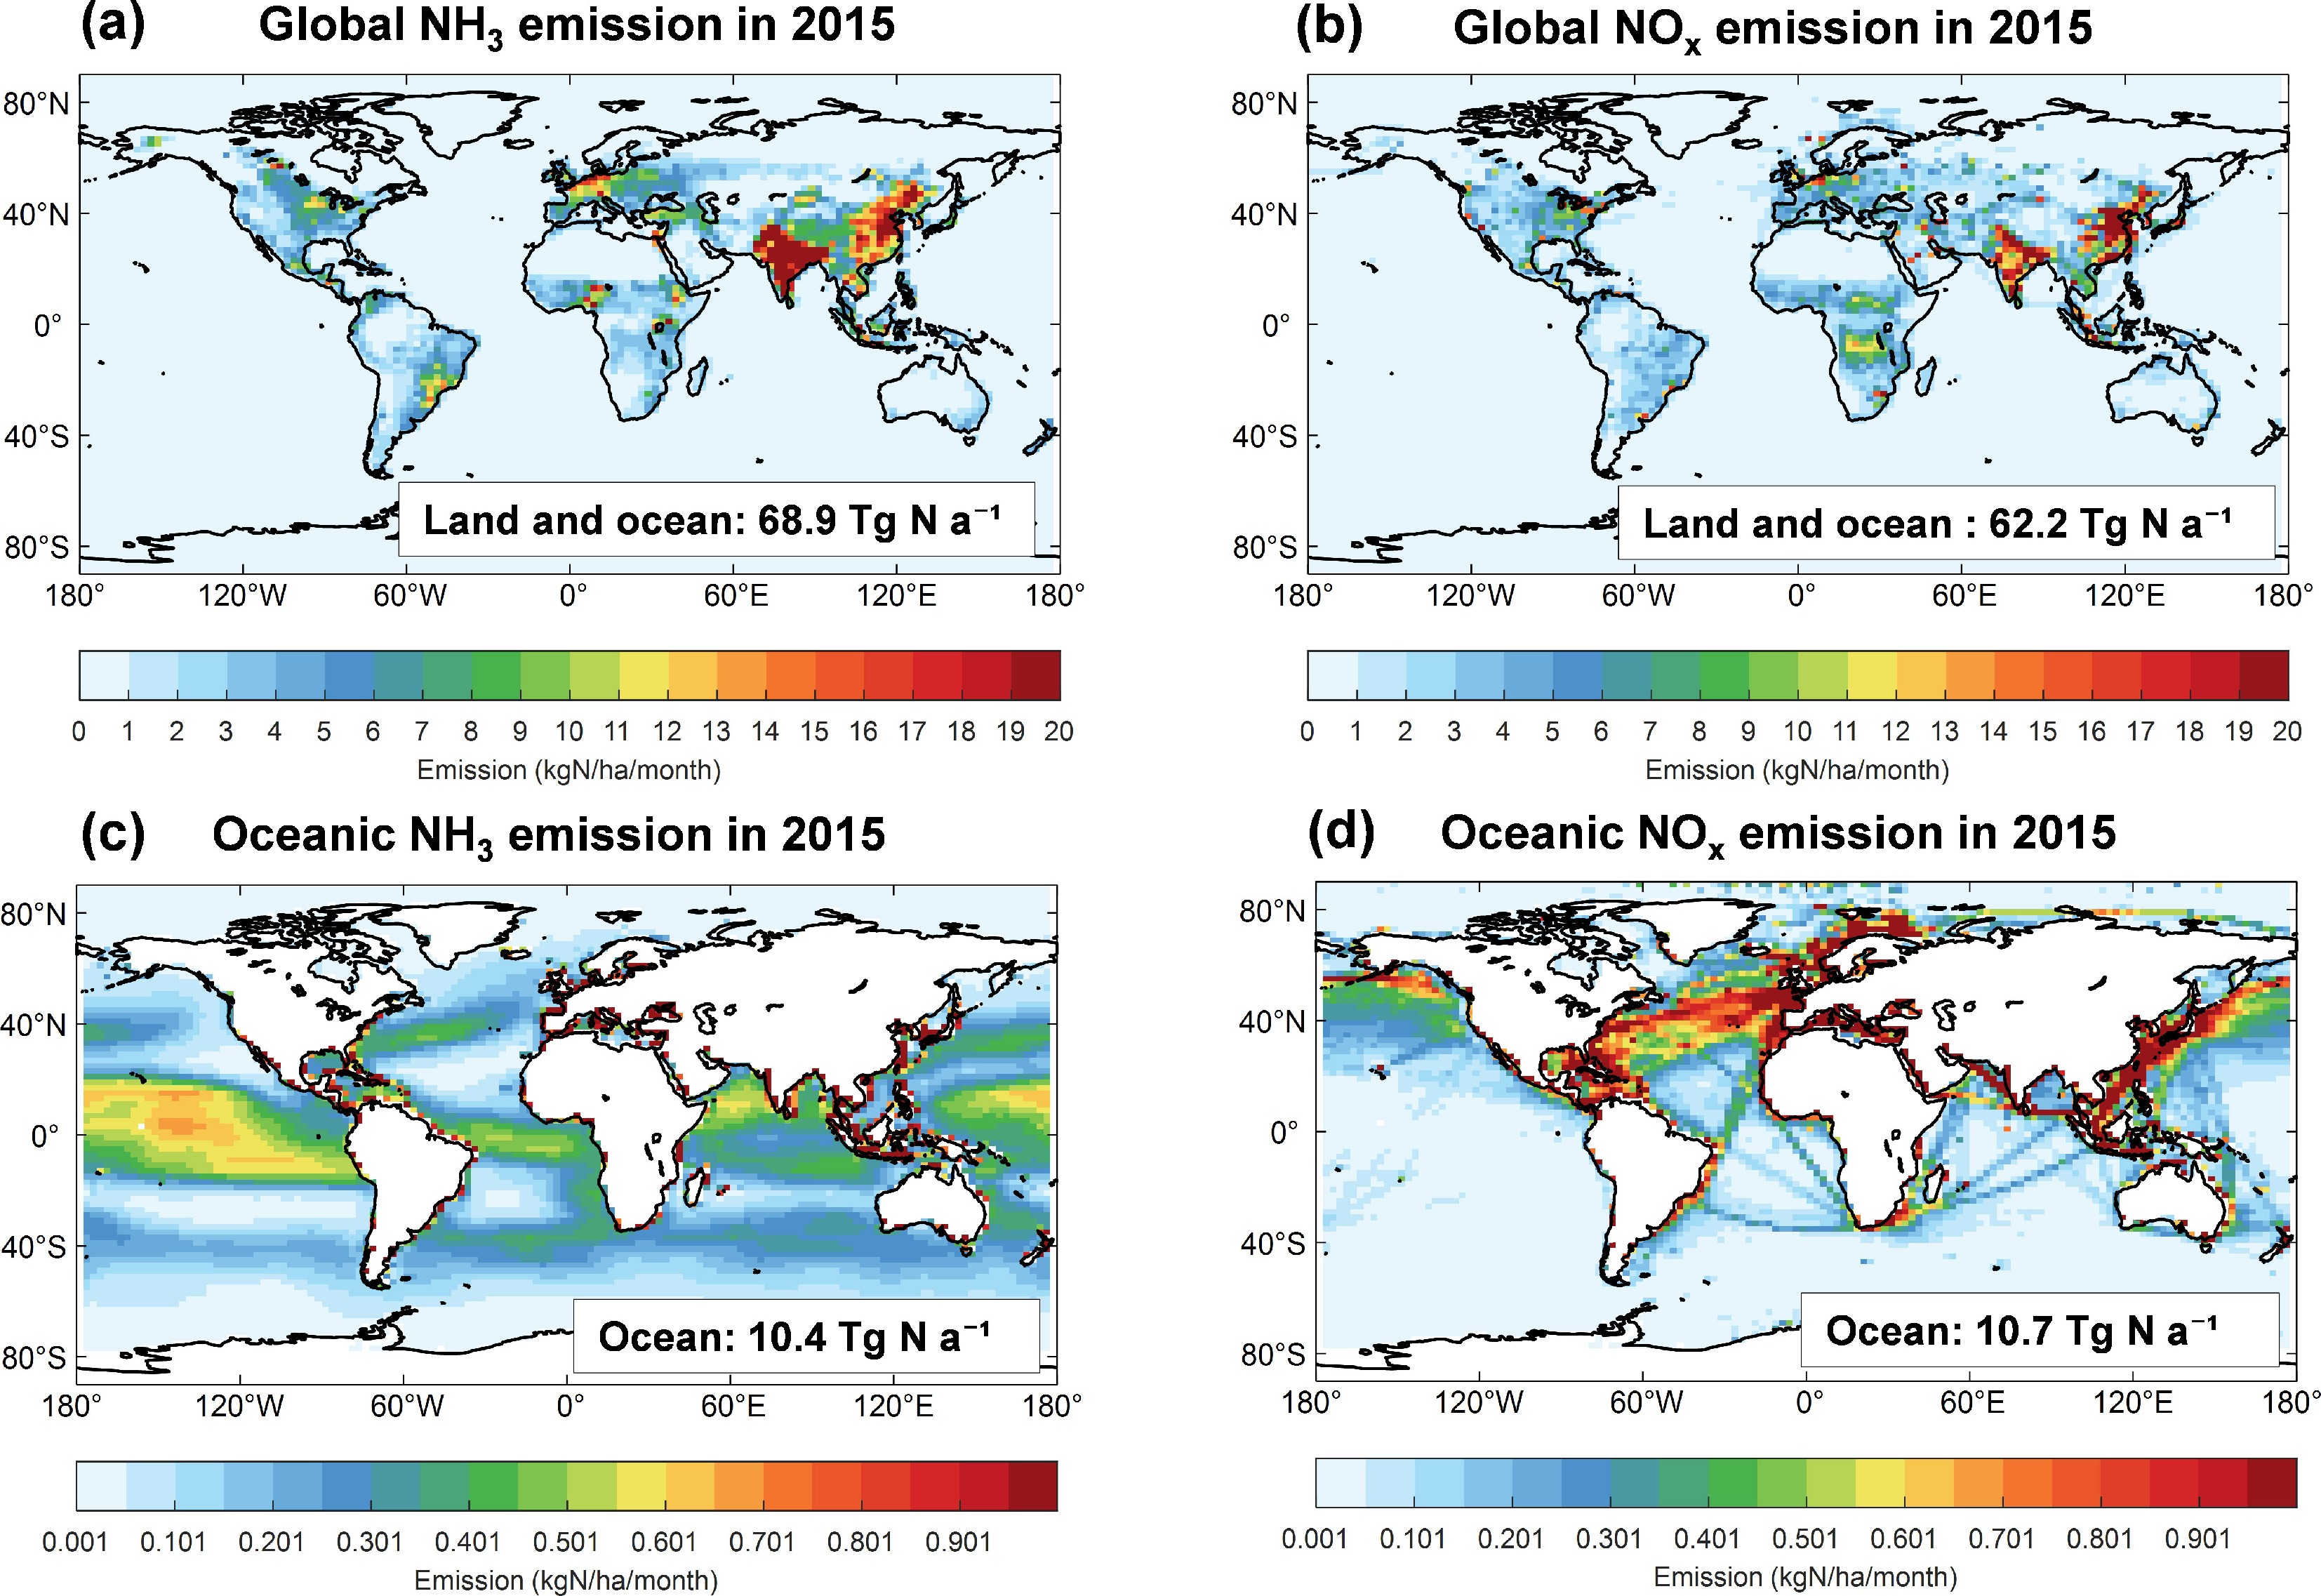
Figure 1.
Global and oceanic reactive nitrogen emissions in 2015. (a), (b) NH3 and NOx emissions from all sources (land and ocean); (c), (d) NH3 and NOx emissions from oceanic (marine) sources only, as a subset of the global totals.
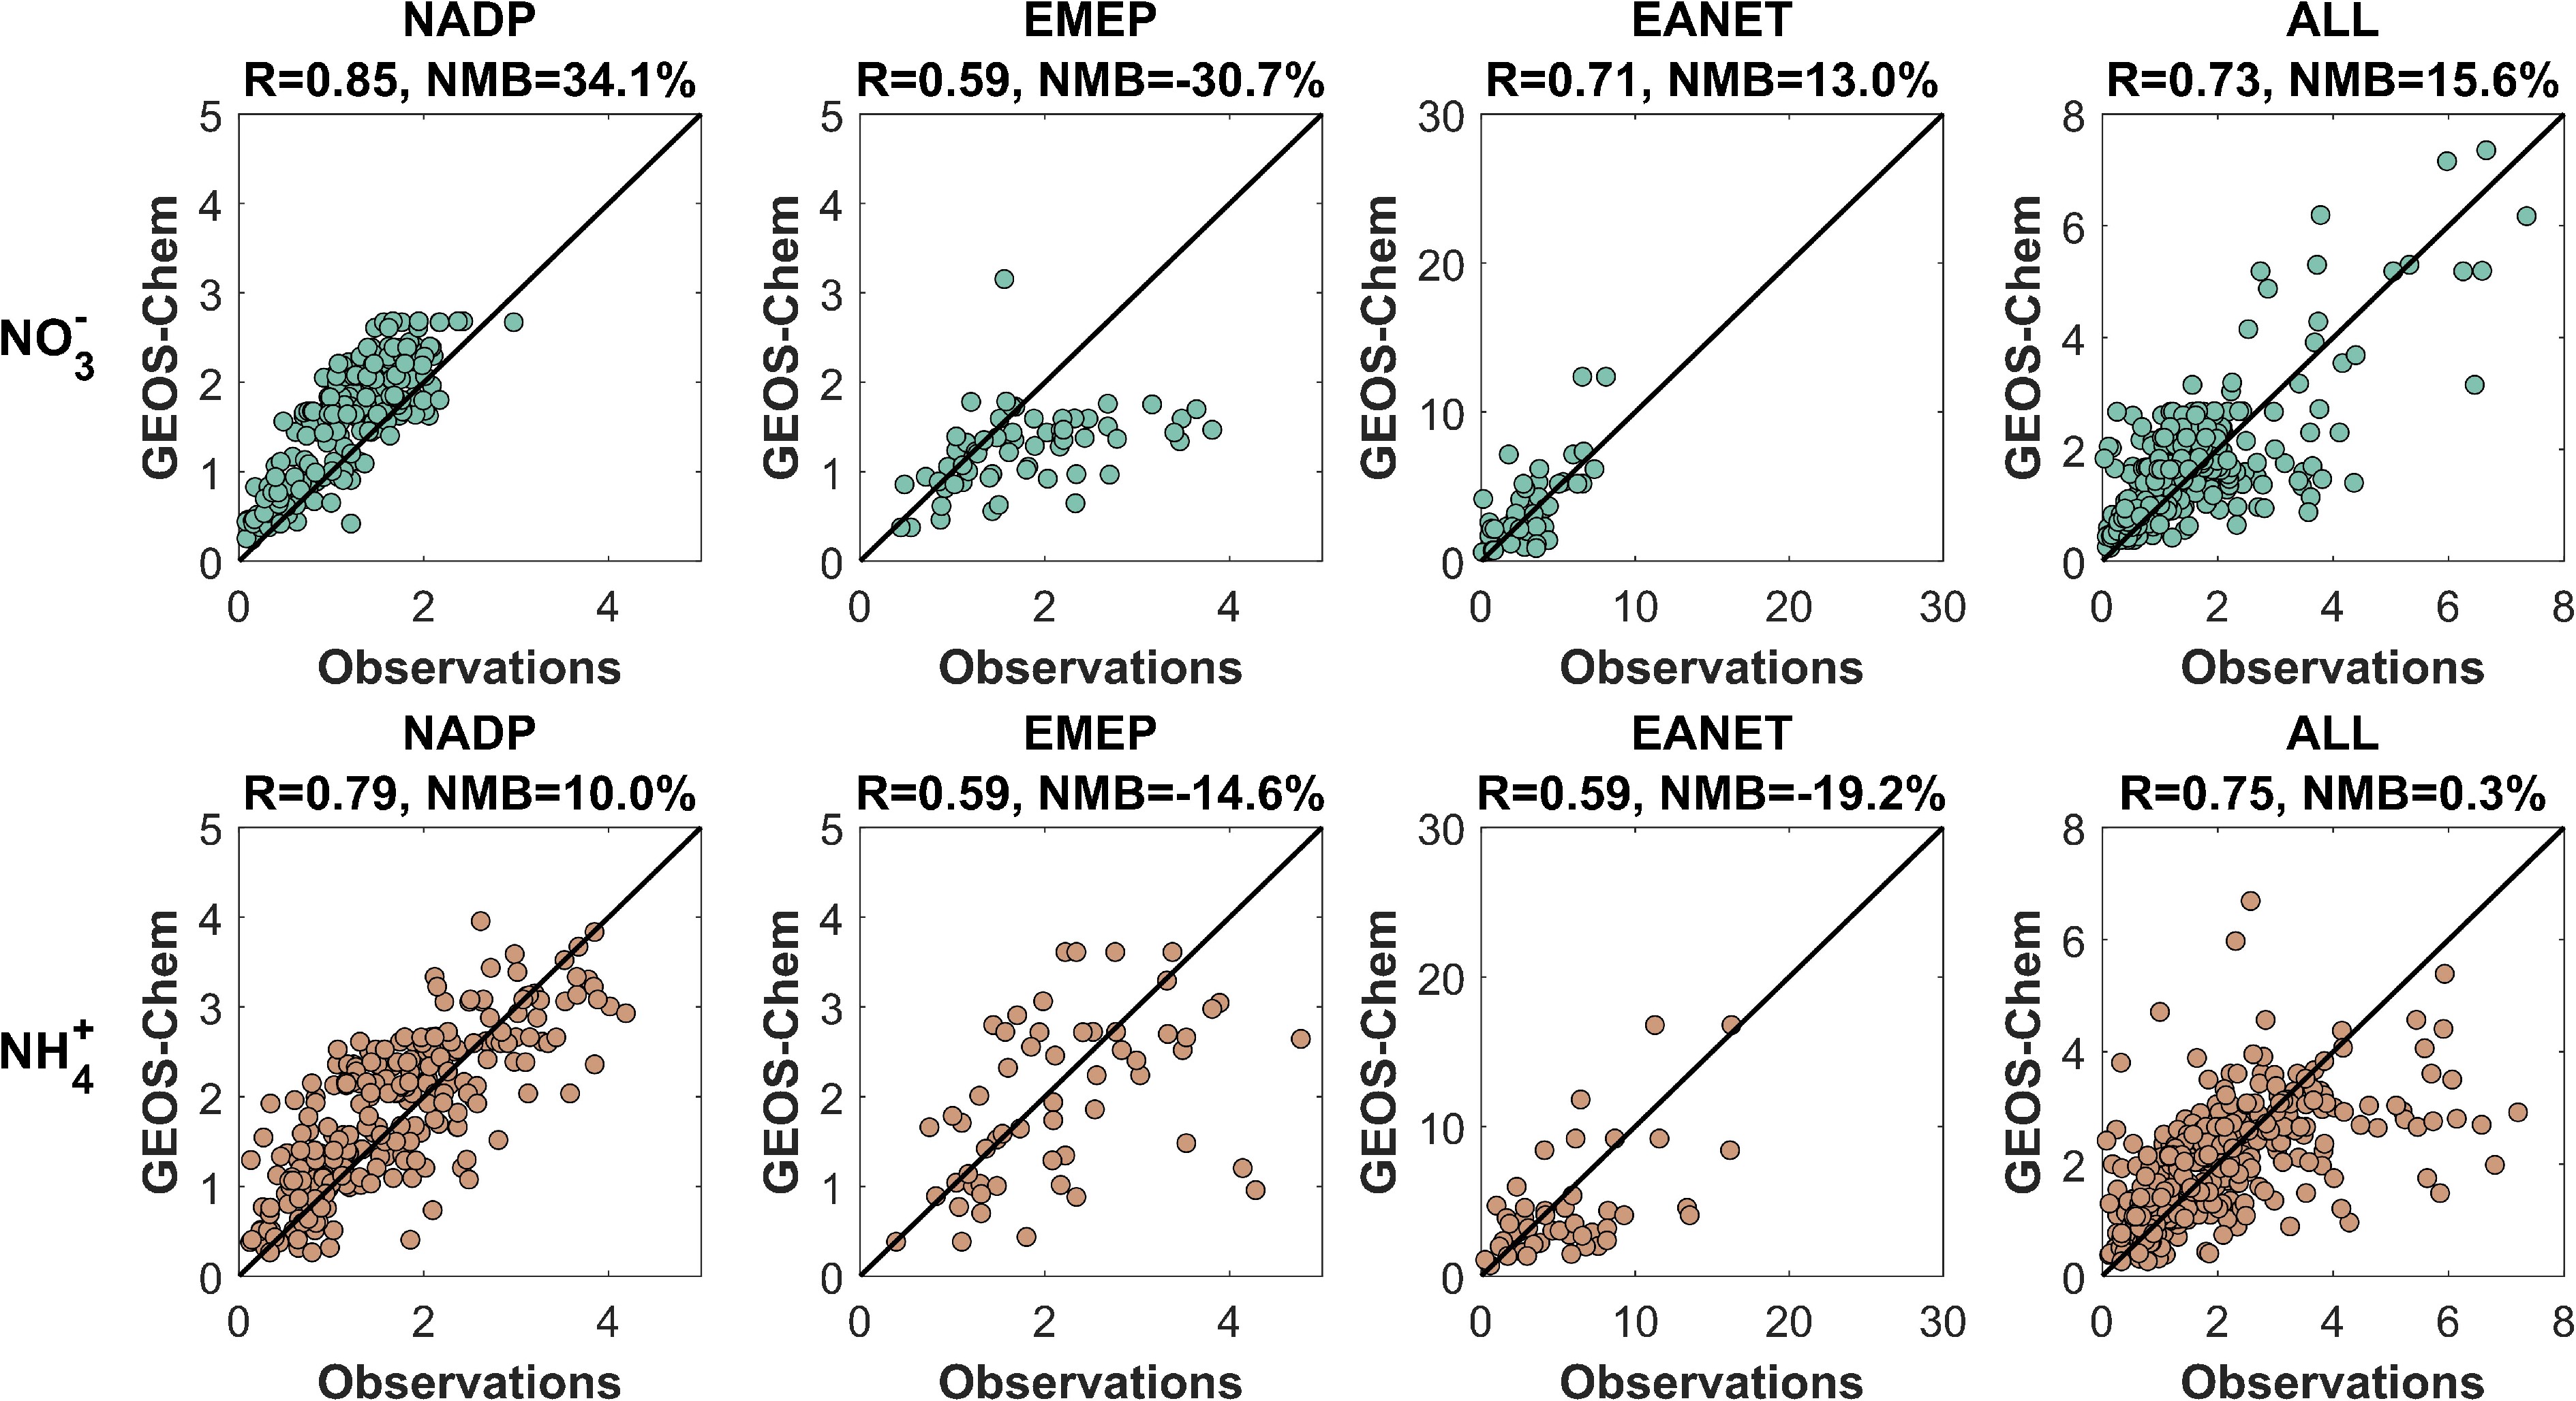
Figure 2.
Comparisons of observed and simulated wet nitrogen deposition fluxes. The first row shows NO3− wet deposition, and the second row shows NH4+ wet deposition in units of kg N ha−1 a−1. Model results are sampled along the observational stations from the NADP, EMEP, EANET, and combined networks.
The global oceanic nitrogen deposition in 2015 was estimated at 51.0 Tg N a−1, accounting for 39% of the global total nitrogen deposition (131 Tg N a−1) (Fig. 3a). Global oceanic nitrogen deposition is substantially greater than oceanic emissions, reflecting the dominant contributions from terrestrial nitrogen sources. Of nitrogen deposited over the ocean, reduced nitrogen deposition accounts for 48.7% (24.9 Tg N a−1), and wet deposition contributes 47.5% (28.9 Tg N a−1). Intense oceanic nitrogen deposition fluxes occur along the coasts of East Asia, India, the Eastern United States, Western Europe, Southeastern Brazil, and Western Africa. These high nitrogen deposition rates in coastal regions are due to shipping emissions and transport of upwind terrestrial emissions, while those in equatorial and subtropical oceans are also largely influenced by natural oceanic NH3 emissions.
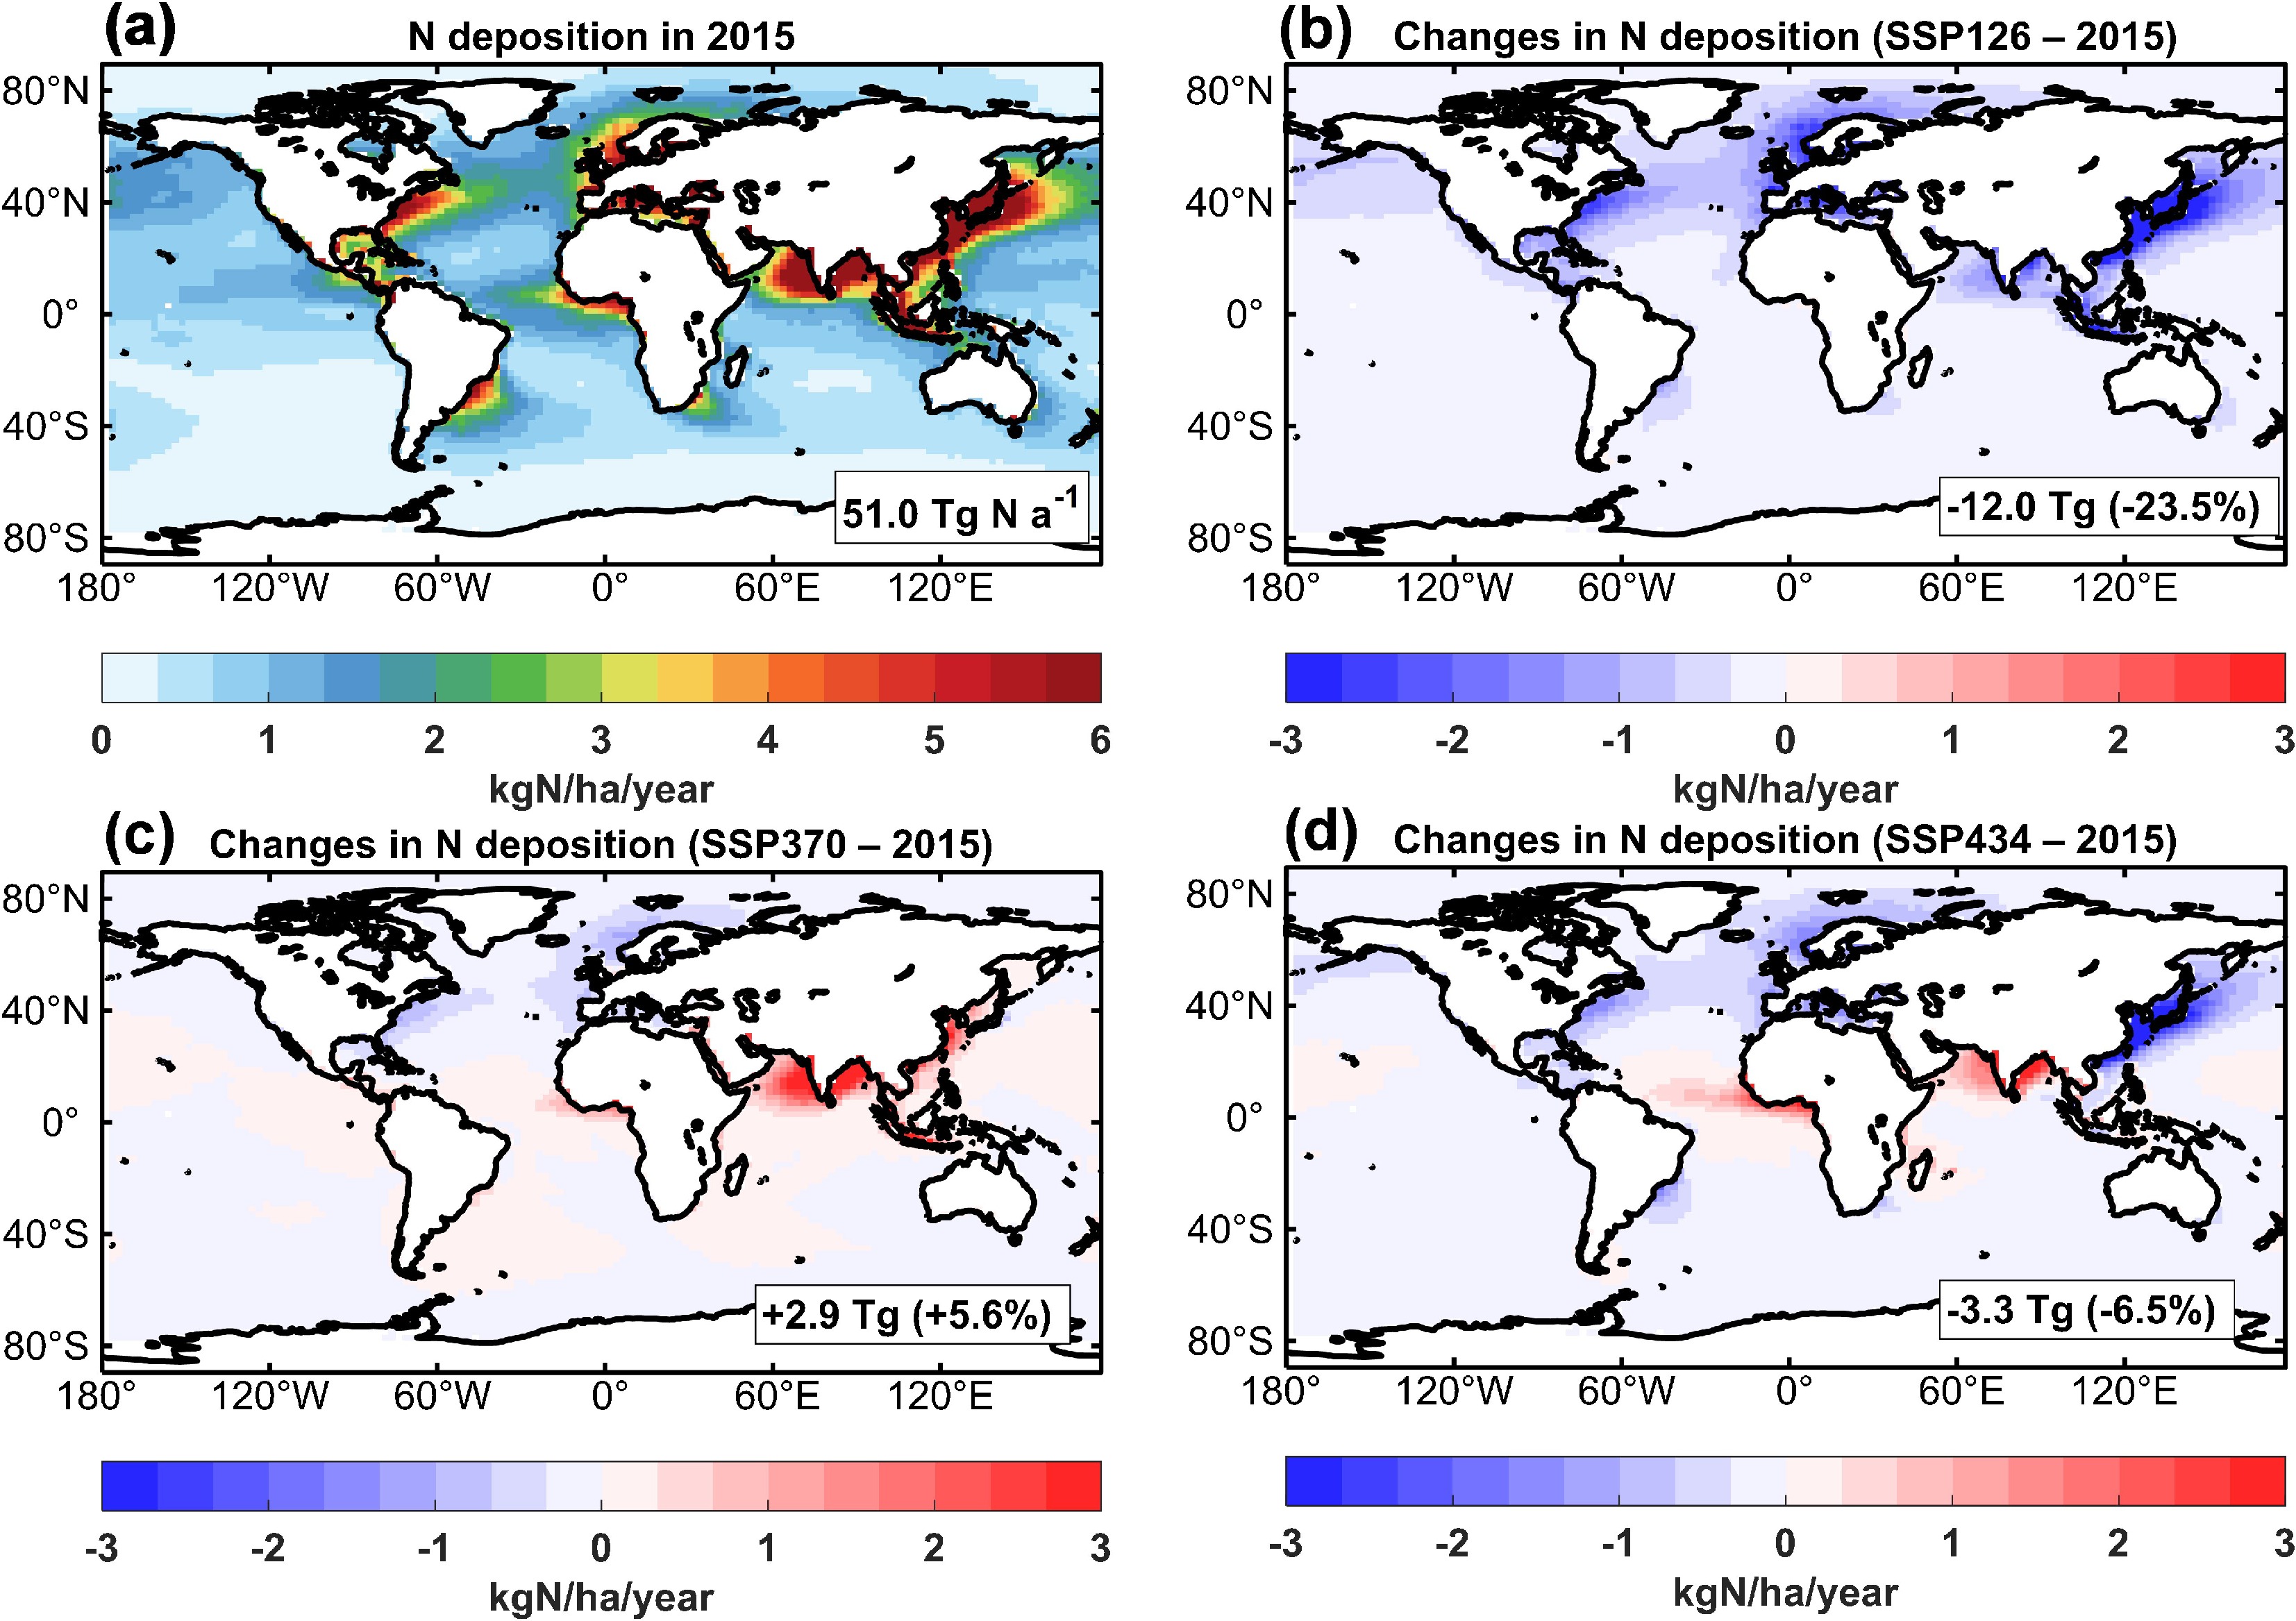
Figure 3.
(a) Model simulated spatial distribution of oceanic nitrogen deposition in 2015 and projected changes under future 2050 emission scenarios, including (b) SSP126, (c) SSP370, and (d) SSP434. The inset values are the total global oceanic nitrogen deposition or total changes (percentage changes in parentheses) relative to the 2015 condition.
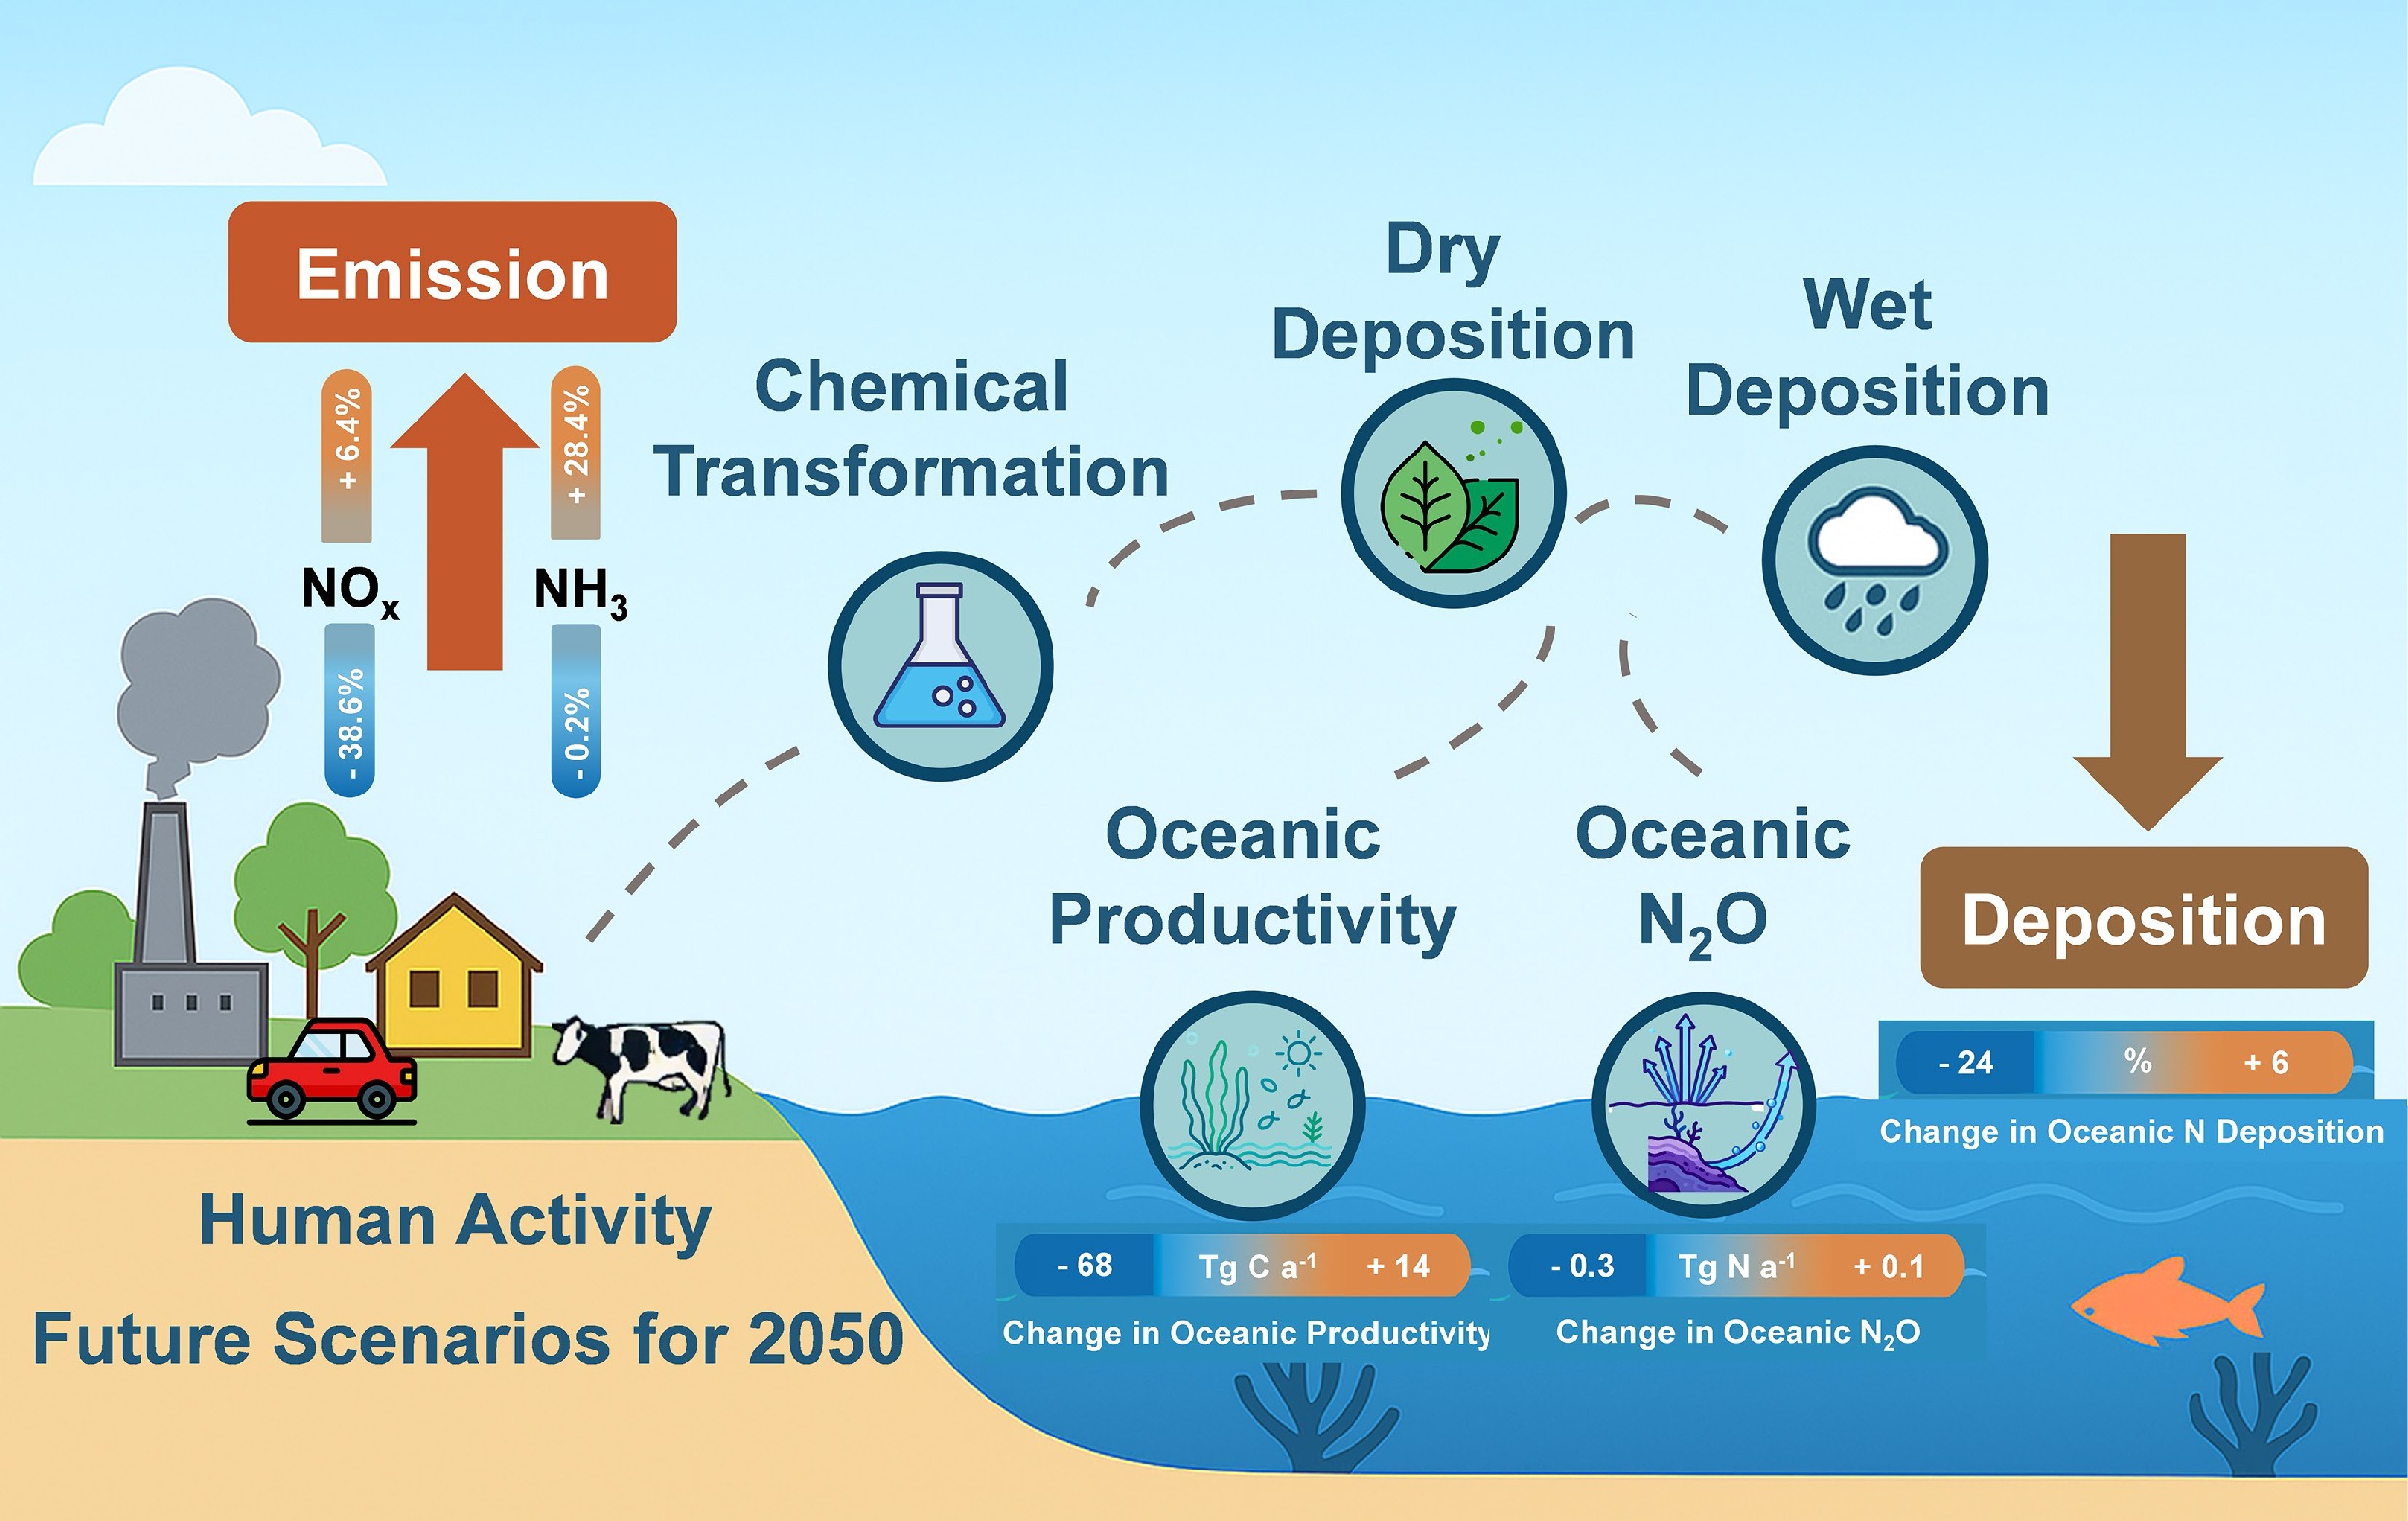
Across three future emission scenarios for the year 2050, global oceanic nitrogen deposition exhibits significant variations ranging from 39 to 54 Tg N a−1 (−24% to +6%, Fig. 3b–d). In the low-emission SSP126 scenario, total oceanic nitrogen deposition decreases by 12 Tg N a−1 (24%) compared to the 2015 baseline simulation, primarily driven by stringent NOx emission reductions (–38.6%, –24 Tg N a−1) while global NH3 emissions remain nearly unchanged (–0.2%, –0.1 Tg N a−1, Supplementary Fig. S3). In contrast, in the high-emission SSP370 scenario, total oceanic nitrogen deposition increases slightly (5.6%, 2.9 Tg N a−1) associated with substantial growth in NH3 emissions (16.9%, 11.6 Tg N a−1) and increases in net global NOx emissions (6.4%, 4.0 Tg N a−1). For the moderate-emission SSP434 scenario, substantial increases in global NH3 emissions (28%, 19.6 Tg N a−1) are offset by NOx emission reductions (–27.6%, –17.2 Tg N a−1), while global oceanic nitrogen deposition declines by 6.5% (–3.3 Tg N a−1). These differences partly reflect a nonlinear response of global oceanic nitrogen deposition to global nitrogen emissions, likely driven by interactions between NH3 and NOx chemistry, and will be discussed later.
Deposition characteristics in different ocean regions
-
Figure 4 shows regional mean nitrogen deposition components (wet and dry; reduced NHx and oxidized nitrogen, NOy) across eight oceanic regions for 2015 and three 2050 future emission scenarios. Coastal areas exhibit significantly higher nitrogen deposition rates (2.4–19.5 kg N ha−1 a−1) compared to open oceans (0.9–1.8 kg N ha−1 a−1). Among coastal regions, deposition rates along China and Indian coasts (9.5–19.5 kg N ha−1 a−1) are much higher than the coasts of Europe and the United States (2.4–5.6 kg N ha−1 a−1). NOy depositions in the year 2015 account for 63% of the nitrogen deposition to China's coasts, 40% to the Indian coasts, 46% to the European coasts, and 63% to the US coasts, respectively. Their contributions typically increase over the adjacent open oceans, i.e., NOy deposition contributions of 40% to 45%, 46% to 65%, and 63% to 64%, respectively, reflecting longer lifetimes and thus transport distances for NOy than NHx. Deposition pathways also differ considerably between coastal regions and open oceans. Wet deposition dominates in open oceans, while dry deposition is the main pathway in coastal areas. For example, 58%–62% of nitrogen is deposited through wet deposition in the North Pacific Ocean, compared to 46%–53% along the China coast.
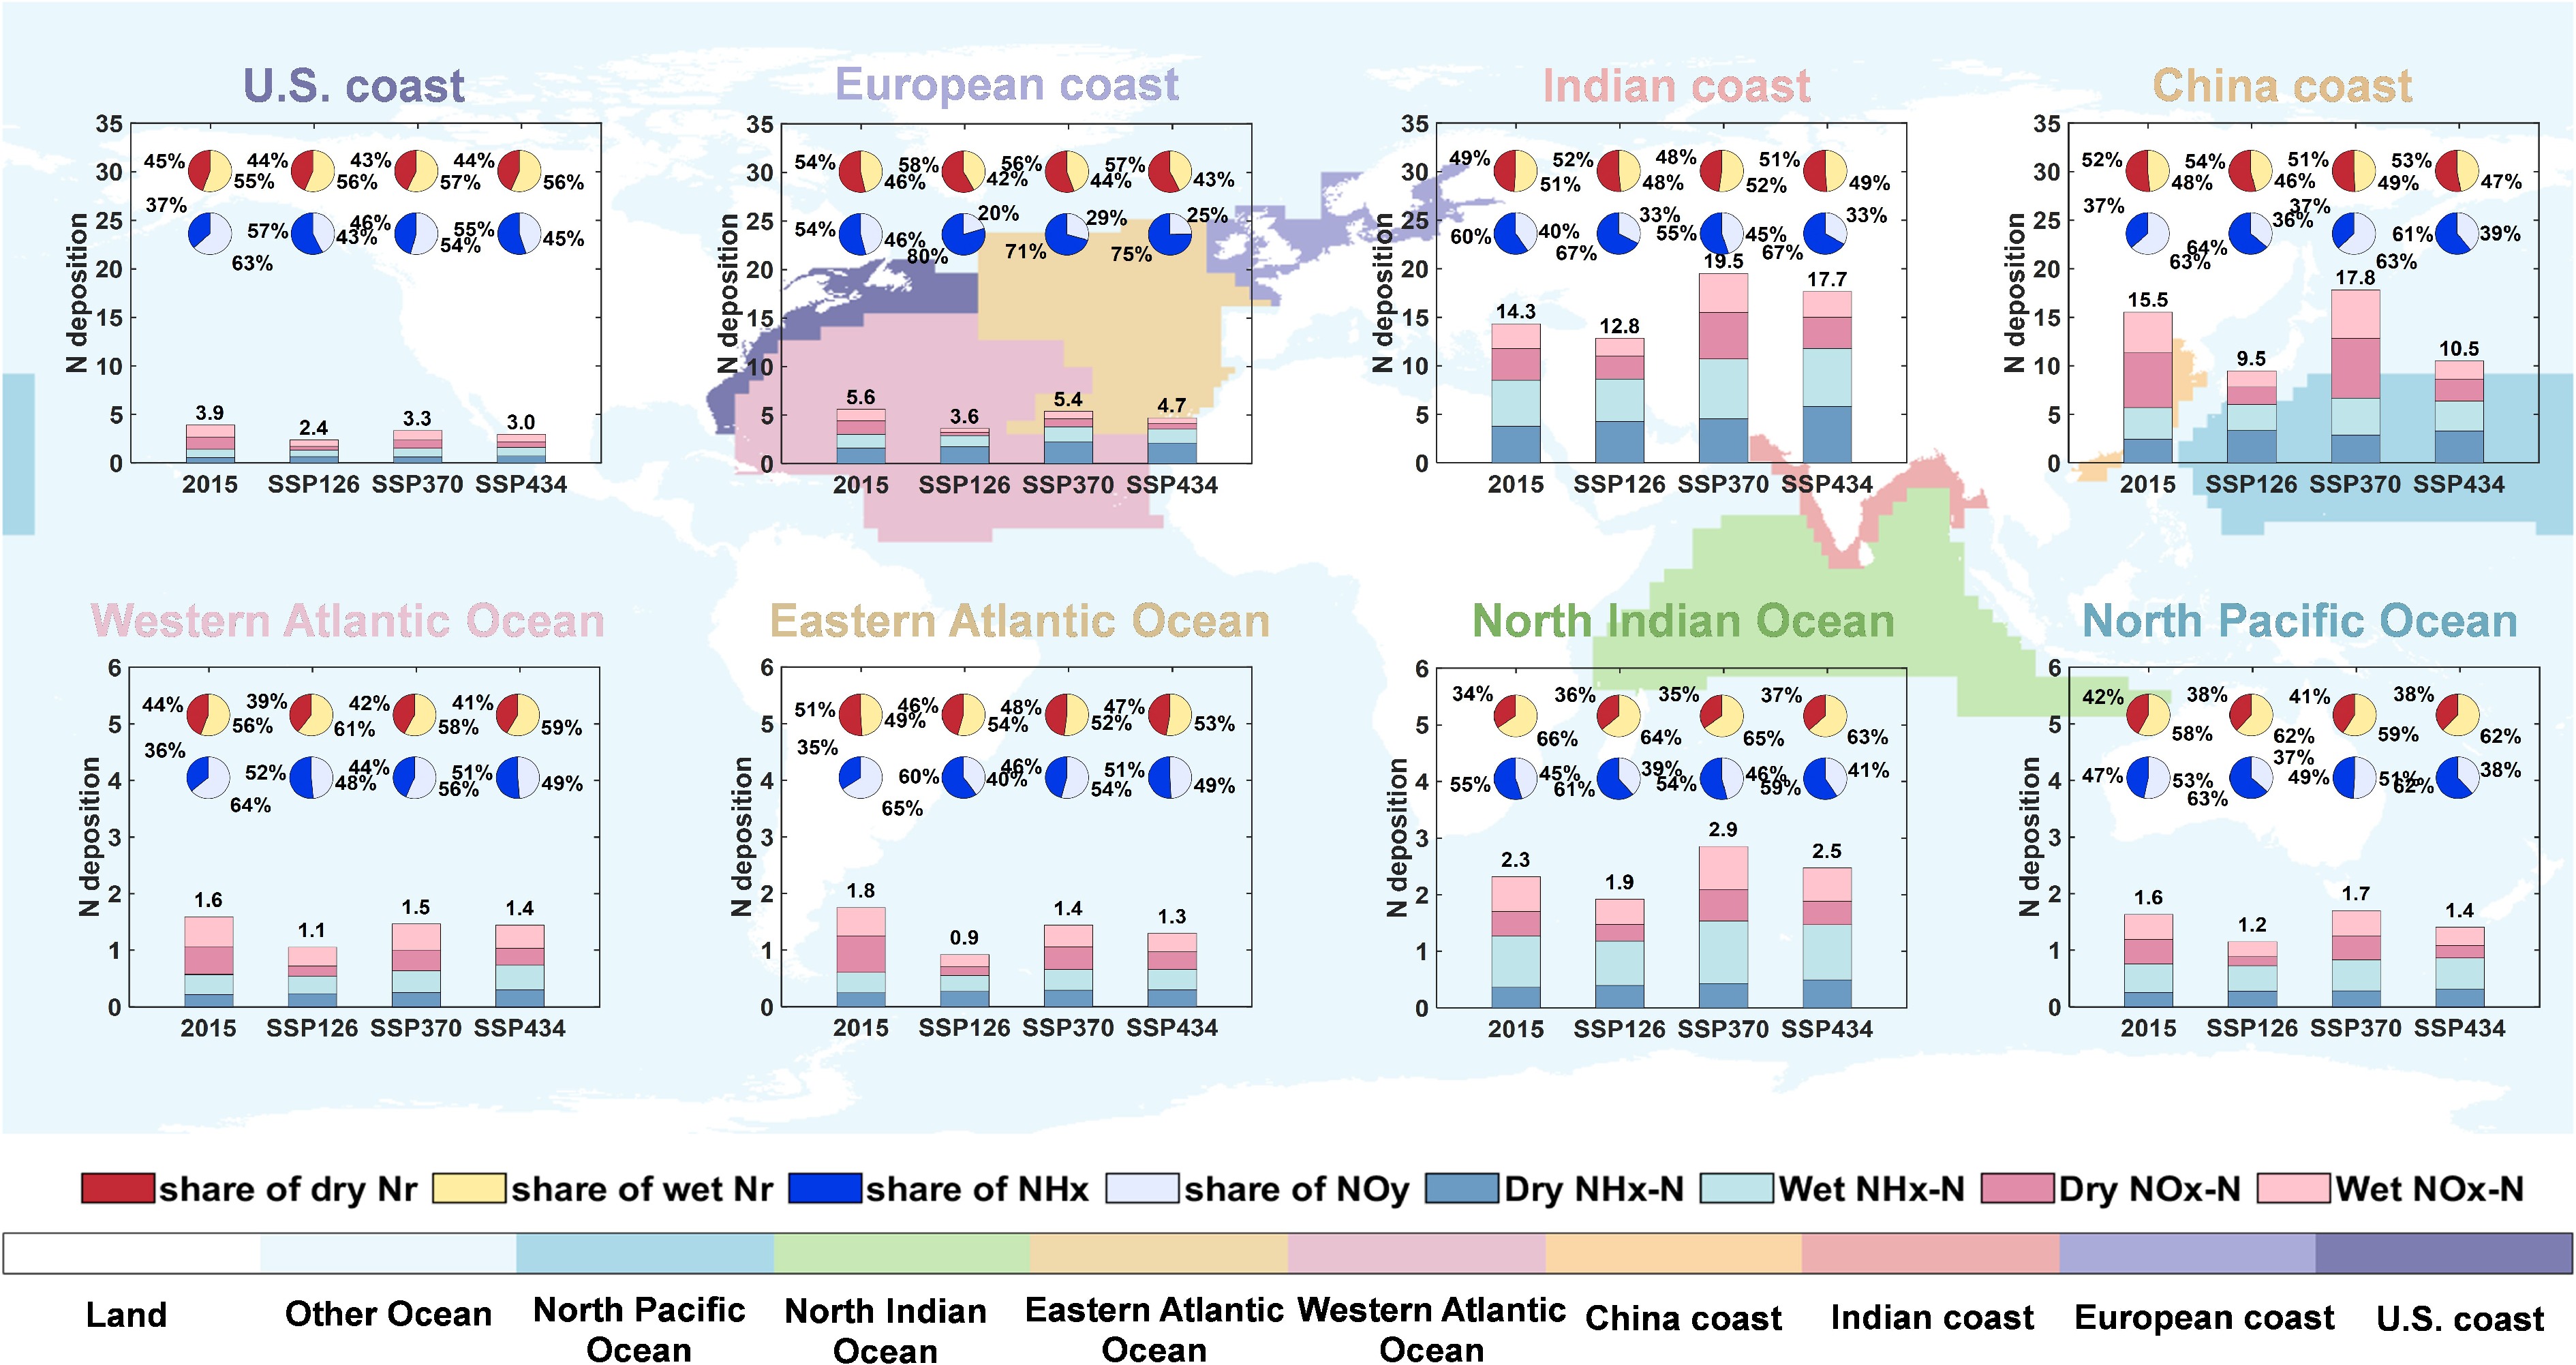
Figure 4.
Nitrogen deposition characteristics in representative ocean regions for 2015 and three 2050 scenarios. The underlying map shows geographic locations of ocean regions (also shown in Supplementary Fig. S1) investigated, including coastal areas (1st row from left to right: US coast, European coast, Indian coast, and China coast) and open oceans (2nd row from left to right: Western Atlantic Ocean, East Atlantic Ocean, North Indian Ocean, and North Pacific Ocean). In each panel, bars represent nitrogen deposition components (dry NHx, wet NHx, dry NOy, and wet NOy deposition) for 2015 and three future emission scenarios (SSP126, SSP370, and SSP434 for 2050). Pie charts show shares of dry vs wet deposition (1st row) and NHx vs NOy deposition (2nd row). All deposition values are expressed in kg N ha−1 a−1.
Under all three future emission scenarios, the share of NHx deposition in total deposition increases across all ocean regions. The CMIP6 emission scenarios primarily represent socioeconomic development (e.g., increasing food demand and agricultural activities) and climate mitigation policies, while nitrogen interventions (e.g., substantially improving the nitrogen use efficiency of agricultural systems through technological advancements) are not explicitly addressed[46−48]. The CMIP6 emission projections thus reflect, under the low-emission scenario, co-benefits of clean energy transitions for NOx reductions; NH3 emissions, however, are projected to stabilize or increase, driven by increasing food demand and somewhat simplified, moderate advancements in agricultural management[49]. Therefore, the increase in NHx deposition share is most pronounced under SSP126 (from 37% to 64% along China's coast and from 54% to 80% along the European coast), where climate mitigation policies and NOx reductions are the most ambitious. In contrast, NHx deposition share increases only moderately under SSP370 (from 47% to 49% in the North Pacific), where NOx emissions remain high in developing regions.
Furthermore, the deposition-to-emission (DTE) ratios are calculated as the regional-integrated annual total nitrogen deposition divided by regional emissions for both NH3 and NOx across different ocean regions (Supplementary Fig. S4). DTE ratios for NH3 and NOx are generally greater than 1 in ocean regions, as expected. The DTE ratio for NH3 is consistently higher than that for NOx in coastal areas, where NH3 deposition is more efficient due to shorter transport distances. The DTE ratios for NH3 show minor variations across open and coastal areas and future scenarios (values of 3.02 ± 0.69). In contrast, the DTE ratios for NOx can exhibit distinct changes, e.g., increases from the China coast (1.65) to the North Pacific Ocean (3.90) and from the Indian coast (2.49) to the Indian Ocean (4.84), reflecting long-range transport of NOy. The most notable future change occurs under SSP126, with significant increases in the North Pacific Ocean (from 3.90–9.92) and the North Indian Ocean (from 4.84–9.45), largely due to substantial NOx emission reductions from shipping sources.
Responses of nitrogen deposition to nitrogen emission reductions
-
Figure 5 illustrates the impacts of individual NH3 or NOx emission reductions and joint reactive nitrogen (Nr; NH3 + NOx) emission reductions on oceanic nitrogen deposition in the European coast and the East Atlantic Ocean based on a series of sensitivity simulations with 25%, 50%, and 100% anthropogenic emission reductions under the SSP126 scenario. Results for other oceanic regions are shown in Supplementary Figs S5–S7. The responses of nitrogen deposition to different emission reduction levels are close to linear for most deposition components, but the magnitudes and directions of response differ significantly across components. In coastal regions, reducing NOx emissions tends to increase dry NHx deposition, while reducing NH3 emissions increases dry NOy deposition.
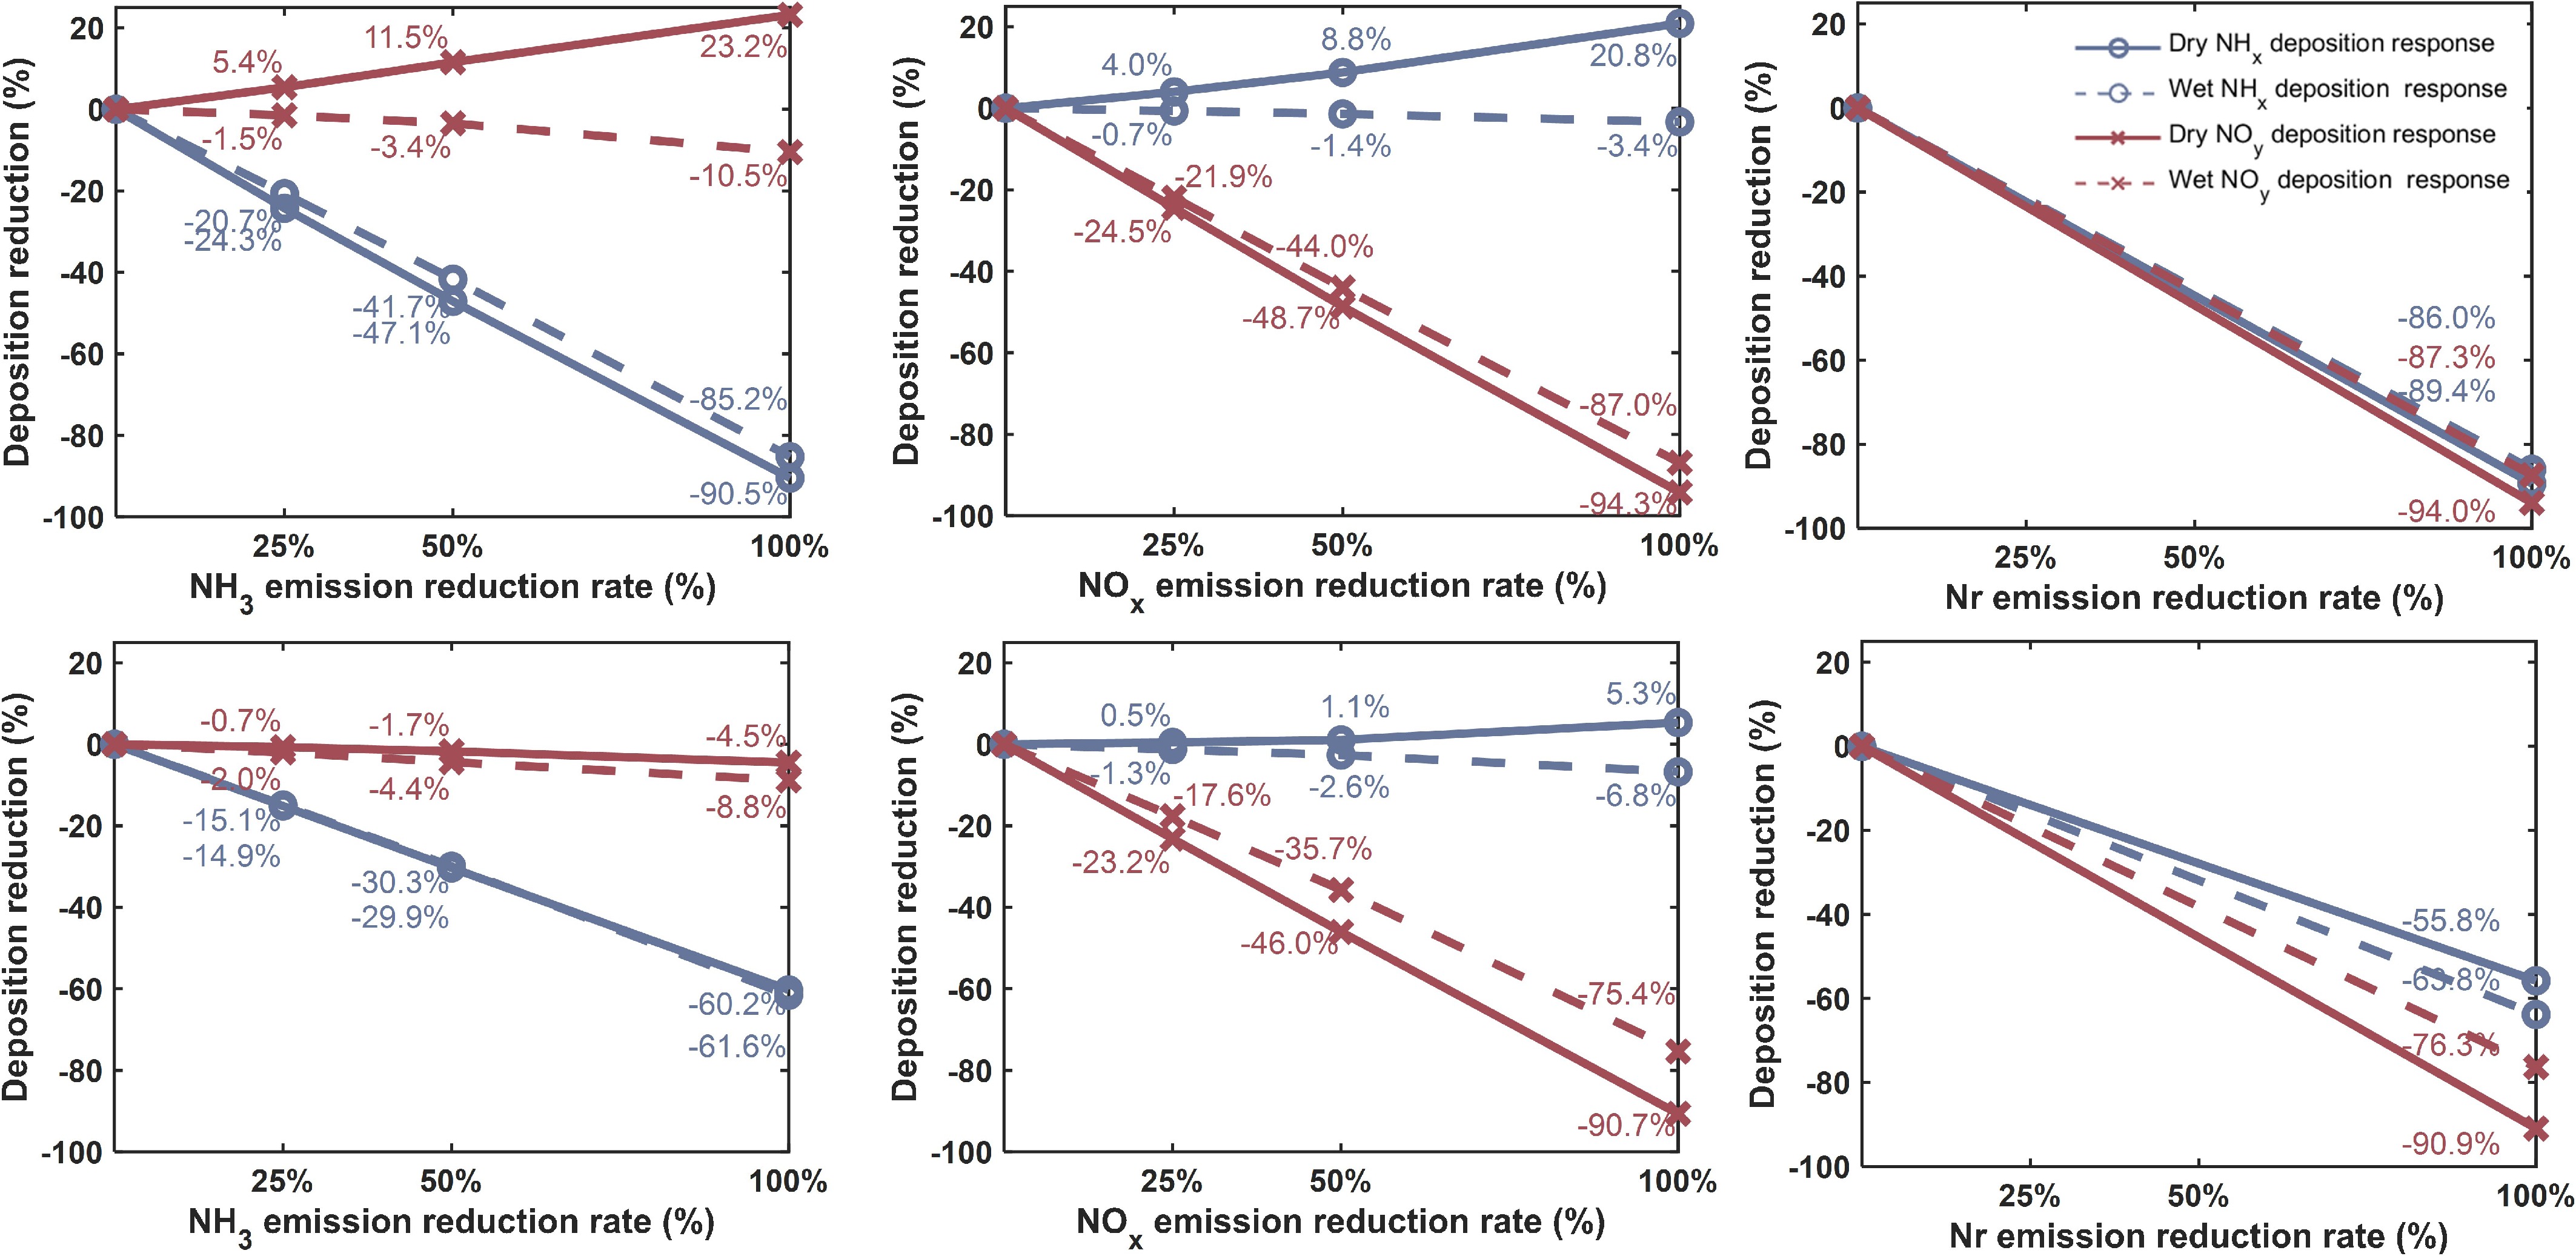
Figure 5.
Responses of oceanic nitrogen deposition to varying levels of anthropogenic NH3, NOx, and Nr emission reductions over the European coast (1st row) and Eastern Atlantic Ocean (2nd row) under the SSP126 2050 scenario. Relative changes in each nitrogen deposition component, including dry NHx (blue solid), wet NHx (blue dashed), dry NOy (red solid), and wet NOy (red dashed) driven by individual NH3 emission reductions (left column), NOx emission reductions (middle column), and joint Nr (NOx and NH3) emission reductions (right column). The inset numbers show the corresponding percentage changes for the specific reduction levels.
Coastal regions are more sensitive to reductions in anthropogenic NH3 and NOx emissions than open oceans. For the European coast, a hypothetical 100% reduction in anthropogenic NOx emissions results in a 94.3% decrease in total NOy deposition, and a hypothetical 100% reduction in anthropogenic NH3 emissions leads to a 90.5% reduction in total NHx deposition. In contrast, the East Atlantic Ocean exhibits weaker responses (than seen along the European coast), e.g., a 60% decrease in NHx deposition from 100% anthropogenic NH3 reductions, reflecting contributions from natural oceanic NH3 emissions.
Changes in emissions of an individual nitrogen species (NH3 or NOx) can affect the spatial patterns of the other nitrogen species' deposition. This is most distinct through the dry deposition process. Reducing terrestrial NH3 emissions tends to shift total nitrate from the aerosol phase to the gas phase as nitric acid, spreading it from source regions to coastal areas (Supplementary Fig. S8). As the dry deposition velocity of nitric acid gas is much larger than its aerosol component, this shift would enhance NOy dry deposition over the coasts (Fig. 5). It would also decrease NOy wet deposition over the coasts and depositions over the open oceans, as less NOy can be transported in the free troposphere and to further distances. Such NOy dry deposition increases associated with terrestrial NH3 emission reductions are observed over the European and Chinese coasts, but not over the Indian and eastern US coasts, likely because all the enhanced nitric acid is deposited over terrestrial lands.
Similarly, reducing terrestrial NOx emissions would notably increase NHx dry deposition along coasts, as reduced nitrate concentrations inhibit the conversion of gaseous ammonia to aerosol ammonium (Supplementary Fig. S8), and the former phase can be more readily dry deposited than the latter. This effect is increasingly evident with greater reductions in NOx emissions. For example, Fig. 5 shows that NHx dry deposition to the Western European coast may increase by 4.0% when anthropogenic NOx emissions are reduced by 25%, but increase by 20.8% with 100% anthropogenic NOx emission reductions. A high level of NOx emission reduction may significantly reduce tropospheric ozone and atmospheric oxidation capacity, thereby decreasing sulfate aerosol formation and further shifting NHx partitioning toward its gaseous form. It was found that Joint NH3 and NOx emission controls appear to suppress the interaction of NH3 and NOx chemistry, and lead to substantial decreases in both wet and dry deposition of NHx and NOy.
Impacts on oceanic productivity and N2O emissions
-
The baseline of 51.0 Tg N a−1 atmospheric nitrogen deposition to the oceans would account for a global productivity of 290 Tg C a−1 based on the Redfield ratio. It is estimated that the global marine net primary productivity (NPP) was 45.6 Pg C a−1 and the global new production was 22.2 Pg C a−1 in 2015 based on the method described in the Methods section (Supplementary Fig. S9a). Atmospheric nitrogen deposition thus potentially supports approximately 1.3% of global new production, but with significant regional variations (Supplementary Fig. S9b). In nitrogen-limited oceans, such as the Northwest Atlantic Ocean, nitrogen deposition contributes around 8%.
Projected changes in oceanic nitrogen deposition under future emission scenarios may influence both ocean productivity and N2O emissions (Table 1). In the SSP126 scenario, a decline in nitrogen deposition would decrease the global ocean productivity from 290 Tg C to 222 Tg C, a 23% (68 Tg C a−1) decrease. According to estimates by the US Environmental Protection Agency (EPA) and the International Energy Agency (IEA), this reduction is roughly equivalent to annual CO2 emissions of 54.25 million cars or 57.98 million people, or carbon stored in approximately 9.94 billion trees (~0.3% of the current global tree population)[50]. Atmospheric nitrogen deposition contributing to oceanic productivity is projected to decrease by 19 Tg C a−1 under the SSP434 scenario and increase by 16 Tg C a−1 under the SSP370 scenario, relative to the 2015 baseline. Following the approach of Duce et al.[5], it is estimated that anthropogenic nitrogen deposition contributes approximately 1.5 (1.16–1.89) Tg N a−1 of N2O-N under 2015 conditions, accounting for roughly one-third of the total oceanic N2O emissions. The projected N2O-N emissions from nitrogen deposition would decrease to ~1.2 (0.89–1.45) Tg N a−1 under SSP126, increase to ~1.6 (1.23–2.00) Tg N a−1 under SSP370, and reach ~1.4 (1.1–1.77) Tg N a−1 under SSP434 by 2050 (Table 1). Considering the global warming potential of N2O (GWP = 298 over 100 years), changes in the oceanic N2O emissions would offset ~60% of the climatic effects of changing oceanic productivity, as suggested in Duce et al.[5].
Table 1. Potential impacts of atmospheric nitrogen deposition on global ocean productivity and N2O emissions
Scenarios Nitrogen deposition
(Tg N a−1)Potential oceanic productivity
(Tg C a−1)N2O-N
emissions
(Tg N a−1)Base (2015) 51.0 290 1.53 (1.16-1.89)1 SSP1-RCP2.6 (2050) 39.0 222 1.17 (0.89-1.45) SSP3-RCP7.0 (2050) 53.9 306 1.61 (1.23-2.00) SSP4-RCP3.4 (2050) 47.7 271 1.43 (1.1-1.77) 1The N2O emission range reflects the uncertainty in present-day N2O emission estimates given in Duce et al.[5]. It should be noted that these estimates are subject to significant uncertainties. The Redfield Ratio provides a convenient method to estimate the contribution of nitrogen deposition to ocean productivity. Still, the assumption of a fixed ratio may introduce significant uncertainty by neglecting regional and ecosystem-specific variations[51]. For example, in regions where phytoplankton productivity is limited by iron or phosphorus, the actual contribution of nitrogen inputs may be lower than theoretical estimates[52]. Furthermore, studies have reported a wide range of estimates of nitrogen deposition's impacts on ocean productivity, ranging from 180 Tg C a−1 to 400 Tg C a−1 globally[7,53]. These discrepancies stem primarily from differences in nutrient limitation conditions and regional ecosystem responses, and from the fact that NH4+ and NO3− can influence marine productivity through different mechanisms, which are not considered in this study. Similarly, the calculations of N2O emission changes assume linear scaling and steady-state conditions, and thus do not capture regional variations or potential nonlinear microbial responses to changes in nitrogen supply.
-
The results provide a quantitative and process-based assessment of how future anthropogenic emissions will reshape oceanic nitrogen deposition and its impacts on marine biogeochemistry. Between 2015 and 2050, global oceanic nitrogen deposition is projected to change by −24% to +6% across three CMIP6 emission scenarios, with a substantially increasing share contributed by reduced nitrogen (NHx). A key finding is the strong chemical interactions between reduced and oxidized nitrogen. Reducing emissions of one species (NH3 or NOx) enhances the dry deposition of the other species to the oceans through a combination of gas-particle partitioning and changes in oxidant levels. Jointly controlling NH3 and NOx emissions would be more effective than managing individual nitrogen species in reducing oceanic nitrogen deposition.
Projected changes in nitrogen deposition also affect marine productivity and climate-relevant gases. The current (2015) atmospheric nitrogen deposition is expected to support ~290 Tg C a−1 of potential ocean productivity (about 1.3% of global new production), consistent with earlier estimates of the contribution of atmospheric nitrogen to marine production[2,5,7]. Under the low-emission SSP126 scenario, the decline in nitrogen deposition reduces the potential productivity by ~68 Tg C a−1, whereas under the high-emission SSP370 scenario, it increases by ~16 Tg C a−1. However, the associated changes in oceanic N2O emissions offset a substantial fraction of the climatic effects of the productivity response, highlighting a trade-off between carbon uptake and N2O forcing that is intrinsic to nitrogen-driven biogeochemical feedbacks.
The findings have several policy-relevant implications for nitrogen management. First, the diagnosed chemical interaction implies that traditional single-pollutant strategies targeting either NH3 or NOx alone may lead to unintended increases in oceanic dry deposition of the uncontrolled species, especially in coastal regions downwind of major terrestrial sources. This suggests that coordinated, multi-pollutant control strategies that jointly reduce NH3 and NOx are needed to robustly decrease total nitrogen deposition to the oceans, in line with recent calls for integrated nitrogen management frameworks[22,28−32]. Second, decarbonization and air-quality policies embedded in SSP1-type pathways primarily reduce NOx emissions, thereby shifting oceanic nitrogen deposition toward a greater NHx contribution. Without explicit NH3 controls, such pathways may unintentionally increase the relative importance of reduced nitrogen deposition to sensitive coastal ecosystems, thereby partly offsetting the benefits of NOx abatement for marine eutrophication and N2O mitigation.
In addition to the impact estimates discussed above, several uncertainties must be considered. Fixing all model simulations to 2015 meteorological conditions does not account for potential changes in meteorological factors and natural emissions under the projected 2050 climate. This assumption may omit potentially important climate-driven feedbacks, such as changes in atmospheric circulation, precipitation, oxidant fields, and biogenic emissions, which could influence nitrogen deposition patterns[54]. Previous studies suggested that changes in anthropogenic emissions primarily drove long-term trends in nitrogen deposition, whereas climate change mostly influenced the interannual variability of nitrogen deposition[55]. Nonetheless, regional-scale or process-specific sensitivities to future climate conditions may still introduce additional uncertainties to the estimates and should be assessed in future work using coupled chemistry–climate simulations.
Furthermore, the CMIP6 emission scenarios used here do not explicitly include ambitious NH3 controls or deep nitrogen management policies, even though such measures are increasingly discussed in global mitigation efforts[56]. Current environmental policies still lack stringent controls on NH3 emissions[57]; however, various nitrogen intervention strategies, such as improving nitrogen-use efficiency and promoting low-emission livestock management practices, have the potential to reduce NH3 emissions and agricultural N2O and nitrate leaching[23]. The inclusion of such policies in future emission pathways, as demonstrated by the INMS scenarios[31], could yield more realistic projections of nitrogen emissions and their effects on ecosystems and should be incorporated into future studies.
Despite these limitations, the study provides a comprehensive, process-oriented picture of how future changes in anthropogenic NH3 and NOx emissions may reshape oceanic nitrogen deposition and its biogeochemical and climatic consequences. This study's results complement existing research on nitrogen deposition responses to changes in emissions and provide new insights into the broader impacts of nitrogen management, particularly on ocean ecosystems. These findings highlight the need for holistic, Earth-system-scale assessments of nitrogen management and for coordinated control strategies to mitigate future nitrogen impacts on marine ecosystems effectively.
The work is also supported by the High-performance Computing Platform of Peking University.
-
It accompanies this paper at: https://doi.org/10.48130/nc-0025-0025.
-
Not applicable.
-
The authors confirm their contributions to the paper as follows: Jialin Deng: data collection, analysis and draft manuscript writing; Yixin Guo: data collection and draft manuscript revision; Ni Lu: valuable advice input; Xingpei Ye: valuable advice input; Yuanhong Zhao: valuable advice input; Jiayu Xu: valuable advice input; Lei Liu: data collection and valuable advice input; Lin Zhang: study framework design and draft manuscript revision. All authors reviewed the results and approved the final version of the manuscript.
-
The datasets generated during and/or analyzed during the current study are available from the corresponding author upon reasonable request.
-
This work is supported by the National Key Research and Development Program of China (Grant No. 2023YFC3707404), and the National Natural Science Foundation of China (Grant Nos 42275106, 42371324).
-
The authors declare that they have no conflict of interest.
-
Full list of author information is available at the end of the article.
- The supplementary files can be downloaded from here.
- Copyright: © 2026 by the author(s). Published by Maximum Academic Press, Fayetteville, GA. This article is an open access article distributed under Creative Commons Attribution License (CC BY 4.0), visit https://creativecommons.org/licenses/by/4.0/.
-
About this article
Cite this article
Deng J, Guo Y, Lu N, Ye X, Zhao Y, et al. 2026. Evolving global oceanic nitrogen deposition under future emission pathways and responses to nitrogen emission reductions. Nitrogen Cycling 2: e013 doi: 10.48130/nc-0025-0025 

Evolving global oceanic nitrogen deposition under future emission pathways and responses to nitrogen emission reductions
- Received: 03 November 2025
- Revised: 20 December 2025
- Accepted: 30 December 2025
- Published online: 29 January 2026
Abstract: Atmospheric nitrogen deposition is an important external nutrient source to the global ocean, with significant impacts on marine ecosystems and biogeochemical cycles. However, its future evolution under changing anthropogenic emissions and the consequences for ocean productivity and climate-relevant gases such as N2O remain unclear. Here, the global atmospheric chemistry model GEOS-Chem is used to evaluate changes in global oceanic nitrogen deposition between 2015 and 2050 under three representative future emission scenarios and to assess their responses to multiple levels of NH3 and NOx emission reductions. Global oceanic nitrogen deposition is projected to change by −24% to +6% between 2015 and 2050, with a substantially increasing share contributed by reduced nitrogen across all scenarios. There is strong chemical compensation between reduced and oxidized nitrogen deposition: reducing emissions of one species (e.g., NH3 or NOₓ) can enhance dry deposition of the other to the oceans, particularly in coastal regions, suggesting that joint control of NH3 and NOₓ is required to reduce total nitrogen deposition effectively. The potential ocean productivity induced by nitrogen deposition may decrease from 290 Tg C in 2015 to 222 Tg C under SSP1-RCP2.6, or increase to 306 Tg C under SSP3-RCP7.0 by 2050, while concurrent changes in oceanic N2O emissions largely offset the associated climatic effects. These results highlight overlooked impacts of future climate mitigation and nitrogen abatement on marine ecosystems via altered atmospheric nitrogen deposition, and call for more holistic assessments of nitrogen impacts across the air, terrestrial, and ocean systems.
-
Key words:
- Nitrogen emissions /
- Nitrogen deposition /
- CMIP6 emissions /
- Oceanic deposition /
- Ammonia