


-
Chrysanthemum × morifolium, perennial herbs of the Asteraceae family and Chrysanthemum genus, originated in China, where cultivation records date back to the 15th century BC. They spread to Japan around the 8th century AD during the Tang Dynasty through cultural exchanges and reached Europe in the 17th century via the Silk Road and maritime trade[1,2]. As one of China's top ten traditional flowers, and the world's four major cut flowers, their excellent floral traits enhance ornamental value, market competitiveness, and economic benefits in the floriculture industry[3]. One of the critical endeavors undertaken by breeders involves delving into genetic variation, enhancing variety quality, and driving the advancement of their respective industries through the strategic exploitation of abundant plant germplasm resources[4,5]. An important task of breeders is to study genetic variation, improve varieties, and ultimately promote their industries by utilising the rich plant germplasm. As posited by Alcazar, the effective conservation and utilization of biodiversity are contingent upon an in-depth analysis and comprehensive assessment of extant biodiversity[6]. Currently, researchers often employ a range of molecular marker techniques to explore the genetic diversity of chrysanthemums. These techniques encompass RAPD (Random Amplified Polymorphic DNA), CDDP (Copia-type Retrotransposon-Derived Polymorphism), SSR (Simple Sequence Repeat), SRAP (Sequence-Related Amplification Polymorphism), among others[7−13]. Although molecular marker technology can more accurately reveal the genetic diversity of plants, it must ultimately be combined with phenotypic trait analysis. This is because morphological methods are the most straightforward and fundamental approaches for studying plant genetic diversity[14]. For instance, a study investigated eight qualitative traits and 14 quantitative traits related to growth and flower attributes across 54 chrysanthemum varieties. Principal component analysis indicated that the phenotypic coefficient of variation ranged from 10.49% (leaf length-to-width ratio) to 106.38% (the length of the corolla tube of ray florets), showing significant variation. Chen et al. collected 29 medicinal and tea chrysanthemum germplasm resources from Macheng, Hubei Province, China, and related provinces, and used variance analysis, correlation, principal component analysis, and cluster analysis. Their results demonstrated that the number of tertiary branches and the number of ligulate florets exhibited abundant genetic variation[15]. In another study, 70 tea chrysanthemum samples were comprehensively evaluated based on 19 agronomic traits to identify superior germplasms. The results revealed that the agronomic traits with a diversity index greater than 2.00 were first-branch height, number of branches per plant, number of ligulate flower whorls, number of ligulate florets, tubular flower diameter, and number of tubular petals. These traits can serve as evaluation indicators for chrysanthemum variety and selection genetic improvement[16].
Studying phenotypic trait genetic diversity is crucial for germplasm resource identification, evaluation, and protection[17,18]. It helps determine local variety adaptability, mine important agronomic trait genes, and develop new genetic germplasms. However, phenotypic traits are not independent. Uncovering relationships between them allows fewer traits to describe germplasm, enhancing breeding efficiency[19]. Chrysanthemum have a diverse germplasm. Flower type and color are key focuses of appreciation, and flower type is influenced by ligulate florets[2,20]. Previous research only analyzed single types and limited Chrysanthemum germplasm phenotypic traits. The genetic diversity of floral traits in germplasm resources of the genus Chrysanthemum has not been systematically studied. Thus, this study will systematically analyze floral traits (flower head diameter, flower center diameter, ligulate floret width and length, etc.) of 103 representative germplasm resources in the genus of Chrysanthemum, including wild species, disbud chrysanthemum, spray chrysanthemum, traditional chrysanthemum, and potted and ground-cover chrysanthemum cultivars. The goal is to reveal their diversity, clarify floral characteristics of different chrysanthemum germplasm resources, and provide a reference for efficient chrysanthemum germplasm resource utilization, genetic basis expansion, and new variety development.
-
This study utilized 103 germplasm resources collected from various global origins of the genus of Chrysanthemum, as well as the main production areas in China, Japan, and Europe (Fig. 1a, Supplementary Table S1). The collection encompasses all application types of both wild and cultivated species within the genus Chrysanthemum. It includes 23 wild species, featuring significant species such as C. indicum, C. lavandulifolium, C. vestitum, and C. naktongense. Additionally, the collection consists of 18 disbud (Disb) C. morifolium, 13 spray (Spra) C. morifolium, 22 traditional C. morifolium (Trad), 25 potted and ground-cover (PoGc) C. morifolium, and two medicinal varieties of C. morifolium. These materials effectively represent the genetic diversity of the genus Chrysanthemum germplasm resources. All materials are preserved in the Chrysanthemum Germplasm Resource Nursery at the National Engineering Research Center for Floriculture. For specific samples, see Supplementary Table S1.
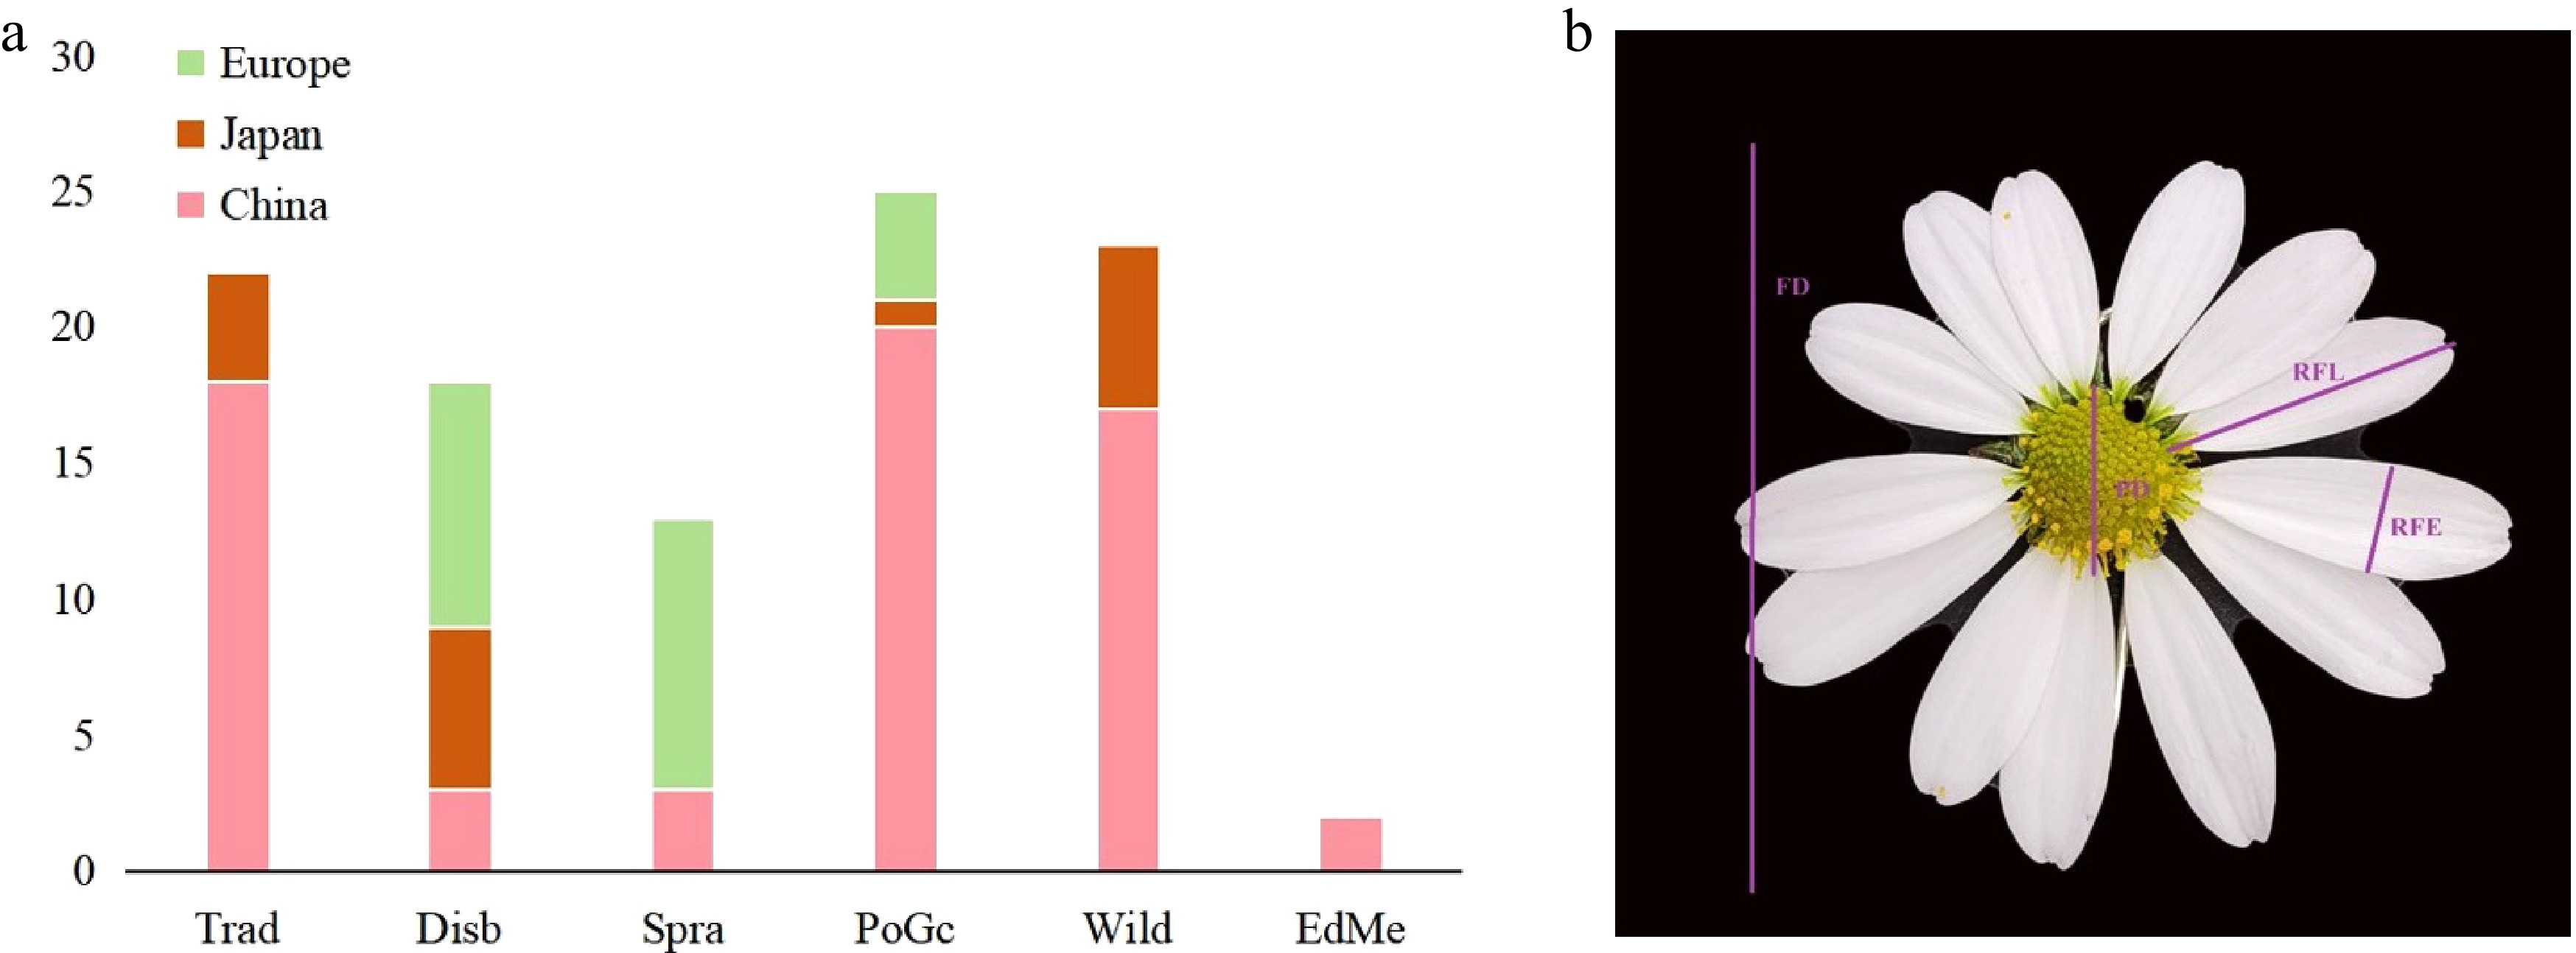
Figure 1.
(a) Distribution map of Chrysanthemum varieties across different regions. (b) Schematic diagram of measurement indicators.
Data collection
-
For each germplasm accession, three biological replicates were performed. Each replicate comprised 10 sample plants, all of which were cultivated through cutting propagation techniques. After 15 d of root development, the cuttings were transferred to 21 cm diameter pots. The plants were arranged in random blocks and then cultivated in the greenhouse of the National Engineering Research Center for Floriculture, Beijing, China.
For the collection of color data, three flowering plants for each cultivar were randomly selected, and from each plant, three fully blooming flowers were randomly chosen. The L*, a*, and b* values of the inner and outer of ligulate petals were then measured separately using a colorimeter (NF555, Nippon Denshoku Industries Co. Ltd., Japan) under light source D50/2° conditions[21,22].
For the acquisition of floral traits, fully open flowers at the blooming stage were randomly selected. Photos were taken with the camera in a fixed-focus state, along with a scale. Subsequently, Image J software was used to precisely measure the floral-related traits, including flower head diameter (FD), pistil diameter (PD), ray florets width (RFW), and ray florets length (RFL) (Fig. 1b). For each trait, the average value was calculated based on the 54 measured data points.
Data analysis
-
Statistical analyses were performed using Excel 2021 and SPSS 27.0 software.
Diversity analysis: The Shannon-Wiener genetic diversity index and coefficient of variation for each trait were calculated. SPSS 27.0 (IBM, Inc., Armonk, NY, USA) was used for variance analysis, and the squared Euclidean distance method for cluster analysis to obtain an approximate matrix. Dendrograms of clustering results were plotted using Origin Pro 2024.
Shannon-Wiener genetic diversity index (H): Indicates trait diversity in a group using the formula: H = −
$ \sum_{i=1}^s{\mathrm{P}}_i $ The coefficient of variation (CV) was used to represent the degree of dispersion of a trait, according to the formula: CV = δ/μ, where δ is the standard deviation, and μ is the mean value.
Screening of phenotypic trait integrated evaluation index: Correlation and principal component analyses of phenotypic data were conducted using the method described by Khadivi et al.[23]. Raw phenotypic data were standardized, and the fuzzy membership function method confined the function values of 14 phenotypic traits for 103 pear germplasm materials within the interval [0, 1]. The calculation formula is Xij = (Yij−Yjmin)/(Yjmax−Yimin), where Xij is the membership function value of the jth trait for the ith material, Yij is the measured value, and Yjmin and Yjmax are the minimum and maximum values of the jth trait across materials[24].
The weight coefficient is the ratio of the eigenvalue of each principal component to the sum of the eigenvalues of the extracted principal components. The calculation formula is: λk = Bk/
$ {\sum }_{k=1}^{n}B $ The coefficients of the principal components are calculated as eigenvector coefficients based on the eigenvalues and the loading matrix of the principal components. The calculation formula is:
Zkj = Akj/Bk, where Zkj is the principal component coefficient of the jth trait in the kth principal component, and Akj is the loading of the jth trait in the kth principal component[25].
The principal component score for each trait is calculated as: PiK = Zkj Xaj , where PiK is the principal component score of the kth principal component for the ith accession[26,27]. The comprehensive score (F value) for each accession is then calculated as: Fi = Pikλik. Finally, comprehensive evaluation indices are selected through stepwise regression analysis.
-
In diversity analysis and evaluation, the Shannon-Wiener index also reflects the diversity among varieties, which is influenced by the number of trait groups and the evenness of distribution of individuals within the groups. The higher the value, the richer the diversity of the trait[28,29]. To investigate the genetic diversity of phenotypic traits, the Shannon-Wiener diversity index (H′) was used to compare the diversity of eight phenotypes of the chrysanthemum germplasm (Fig. 2a, b). The results showed that although the indices of the five chrysanthemum groups varied, the overall trend was similar. Notably, the RFL exhibited the lowest diversity index, whereas the a* and b* values related to both petal inner and outer color demonstrated higher indices, indicating greater diversity in these traits. Overall, the genetic diversity indices showed significant differences, ranging from 0.17 (RFL) to 1.72 (OC b*). The average was 1.01. The traits with a diversity index exceeding 1.5 were as follows: the OC b* of potted and ground-cover chrysanthemums, the IC b* of wild chrysanthemums, the OC a* of potted and ground-cover chrysanthemums, the IC a* of spray chrysanthemums, and the b* value of flower center color (PC b*) of spray chrysanthemums. Their values were 1.72, 1.57, 1.53, 1.52, 1.52, and 1.52, respectively. This indicates that these traits have greater variation and richer phenotypic diversity compared to other traits. In addition, a comparative analysis of wild and cultivated species indicates that cultivated species exhibit a higher overall diversity index (Fig. 2c). Notably, the variation coefficients for petal number, RFL, and OC b* in cultivated species were significantly higher than those in wild species.
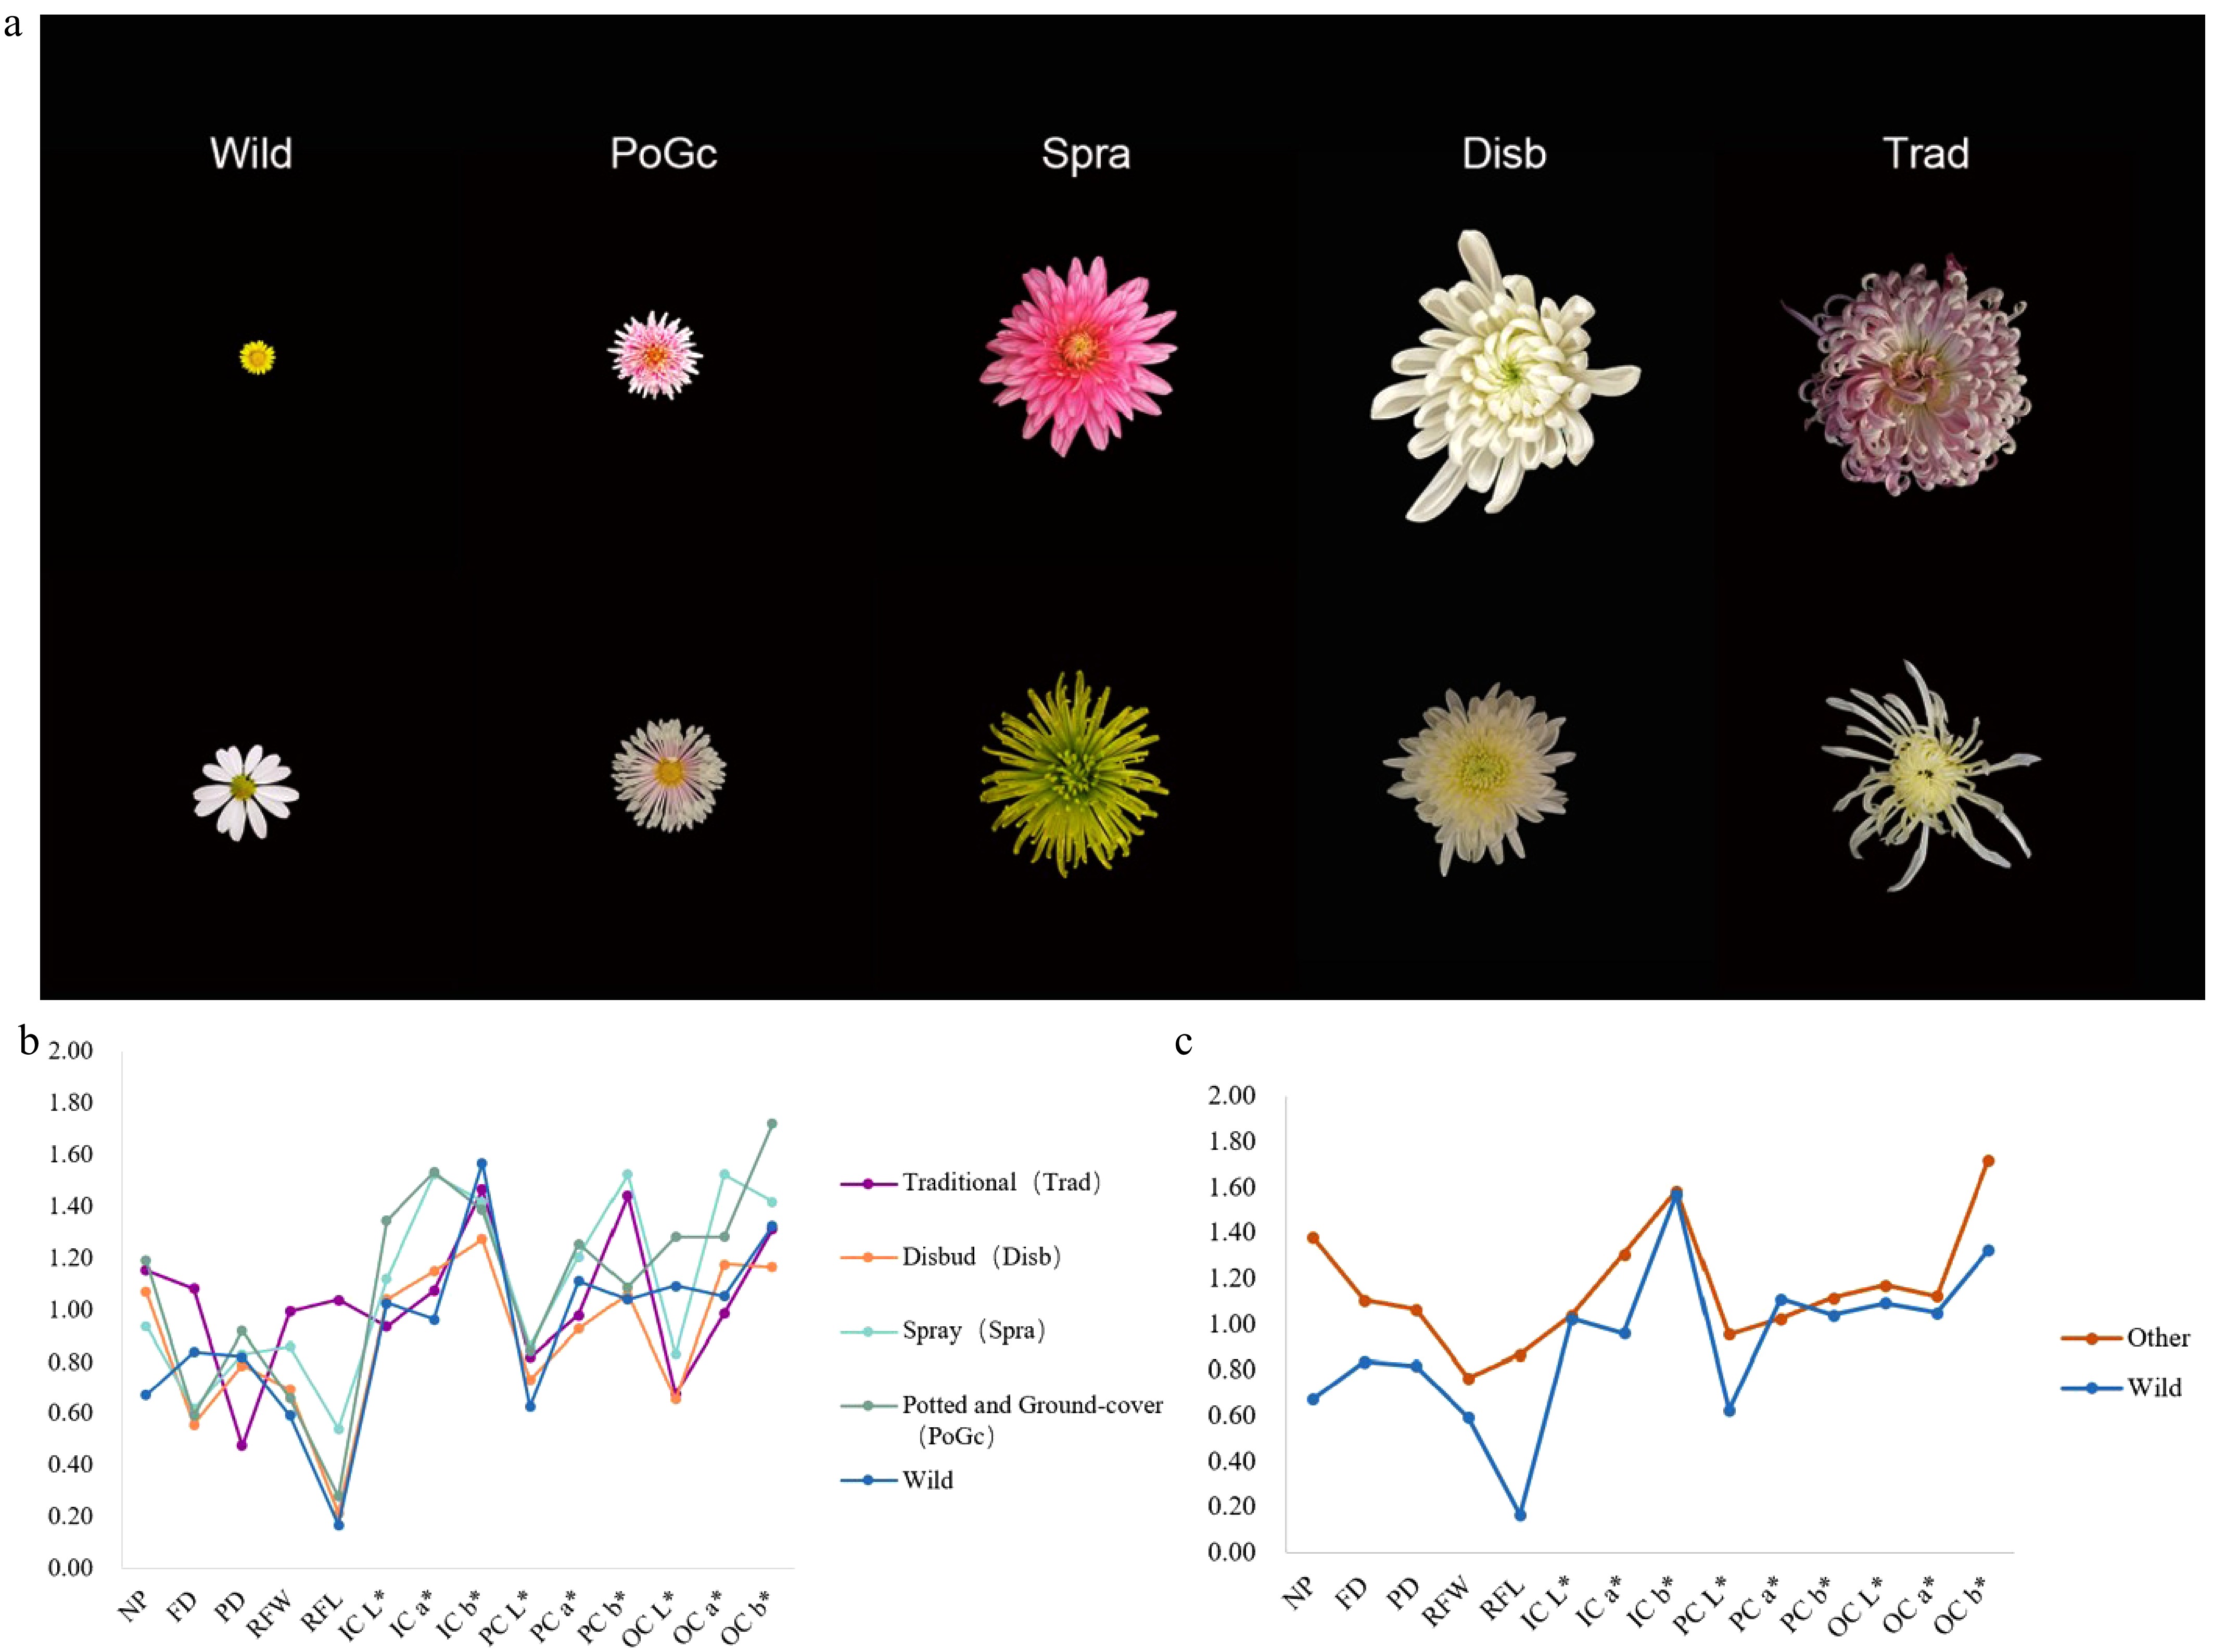
Figure 2.
(a) Different flower types of the chrysanthemum germplasm. (b) Shannon-Wiener of phenotypic traits of different types of chrysanthemum germplasm. (c) Shannon-Wiener of phenotypic traits of wild type and other types of chrysanthemum germplasm.
Genetic variation of each trait
-
The coefficient of variation reflects inherent characteristics and individual differences, and is an indicator of genetic diversity. A higher coefficient of variation in a trait suggests a richer genetic background, which is more conducive to variety identification[30]. Tests and analyses were conducted on five floral traits of 103 chrysanthemum accessions. Table 1 shows the mean, standard deviation, and coefficient of variation for these five traits. Among the traits studied, chrysanthemum pistil diameter exhibited the greatest variation at 104.79%, indicating it better reflects differences among varieties.
Table 1. Analysis of genetic diversity for floral traits of Chrysanthemum.
Trait Min. Max. Median Mean Standard difference Coefficient of variation (CV; %) Number of petals (NP) 11.00 528.43 108.22 137.77 111.83 81.17 Flower head diameter (FD; cm) 1.47 53.03 5.44 6.90 6.38 92.48 Pistil diameter (PD; cm) 0.00 2.24 0.53 0.55 0.57 104.79 Ray florets width (RFW; cm) 0.11 1.06 0.36 0.42 0.22 51.78 Ray florets length (RFL; cm) 0.43 8.42 2.05 2.60 1.77 68.06 To analyze differences between and within chrysanthemum populations, 103 varieties across six groups were analysed, including traditional, disbud, spray, potted and ground-cover, wild, edible and medicinal chrysanthemums. Nested analysis of variance (ANOVA) was used to assess variation in chrysanthemum floral quantitative traits at between—and within—group levels. Fourteen phenotypic traits showed highly significant variation between and within groups (Table 2), indicating widespread phenotypic variation. Mean and multiple comparisons revealed significant differences in 14 traits across the six groups (Table 2). For example, the number of petals (NP) was high in traditional and disbud chrysanthemums, whereas it was low in wild chrysanthemums; FD was larger in traditional chrysanthemums, whereas it was smaller in wild chrysanthemums; and the IC a* value was larger in potted and groundcover chrysanthemums, whereas it was smaller in disbud chrysanthemums. The coefficient of variation for a trait can also vary across different populations (Table 3). Three cut-chrysanthemum groups had higher coefficients of variation for disk floret diameter at 236.65%, 180.53%, and 181.28%, indicating greater genetic diversity in traditional large and cut chrysanthemums. In contrast, wild chrysanthemums had the lowest coefficient of variation for petal number at just 25.47%, suggesting less diversity in this trait.
Table 2. Comparative analysis of Chrysanthemum populations.
Trait Trad Disb Spra PoGc EdMe Wild F NP 202.82 ± 135.63 229.73 ± 71.94 181.66 ± 79.58 96.13 ± 62.42 174.78 ± 1.26 20.51 ± 5.22 20.27** FD 13.67 ± 10.82 7.57 ± 1.86 6.42 ± 2.08 4.66 ± 1.18 3.58 ± 0.51 2.92 ± 0.98 11.78** PD 0.29 ± 0.70 0.20 ± 0.36 0.32 ± 0.58 0.78 ± 0.45 0.00 ± 0.00 0.94 ± 0.33 8.43** RFW 0.44 ± 0.21 0.50 ± 0.20 0.60 ± 0.24 0.35 ± 0.21 0.27 ± 0.05 0.31 ± 0.14 5.35** RFL 4.98 ± 1.58 3.02 ± 1.17 2.27 ± 1.23 1.75 ± 0.62 1.50 ± 0.27 0.94 ± 0.40 40.18** IC L* 76.40 ± 12.23 77.48 ± 18.70 61.86 ± 15.18 56.18 ± 22.05 74.95 ± 2.19 69.14 ± 11.41 5.41** IC a* 2.97 ± 8.20 0.59 ± 7.16 9.91 ± 13.28 23.15 ± 26.34 6.25 ± 0.49 1.81 ± 2.75 7.73** IC b* 10.78 ± 24.83 4.78 ± 31.46 −0.02 ± 32.37 7.12 ± 30.95 61.30 ± 1.84 23.17 ± 31.99 2.51* PC L* 59.76 ± 10.61 63.48 ± 11.54 51.85 ± 11.64 60.38 ± 11.30 69.64 ± 3.38 57.09 ± 4.16 2.85* PC a* 1.43 ± 7.85 −2.96 ± 2.81 −2.91 ± 8.94 8.67 ± 9.03 1.73 ± 2.04 5.89 ± 3.54 9.21** PC b* 32.61 ± 22.43 12.61 ± 14.93 25.21 ± 19.19 48.76 ± 21.74 58.12 ± 11.76 51.34 ± 14.09 12.68** OC L* 81.01 ± 9.14 83.22 ± 15.08 65.71 ± 15.34 60.78 ± 18.30 72.10 ± 2.12 67.07 ± 11.73 8.26** OC a* 2.48 ± 6.48 0.52 ± 7.60 9.21 ± 13.25 14.70 ± 11.93 4.93 ± 0.01 1.42 ± 2.63 8.80** OC b* 11.21 ± 24.78 0.45 ± 24.70 −2.02 ± 28.10 1.80 ± 24.74 38.30 ± 0.99 18.97 ± 25.62 2.62* * p < 0.05; ** p < 0.01. Table 3. Coefficients of variation of floral traits of the five populations of Chrysanthemum (CV; %).
Traits Trad Disb Spra PoGc Wild NP 66.87 31.32 43.81 64.93 25.47 FD 79.14 24.53 32.36 25.45 33.54 PD 236.65 180.53 181.28 57.62 34.76 RFW 47.09 39.33 39.52 58.62 46.48 RFL 31.67 38.86 45.47 35.39 42.95 Cluster analysis based on six floral traits
-
Based on six floral traits (NP, FD, PD, RFW, RFL, and flower colour), 103 chrysanthemum germplasm accessions were classified into five groups using cluster analysis (Fig. 3). Group I comprised 24 accessions, predominantly wild and traditional chrysanthemums. These typically exhibited higher b* than a* values, with yellow observed in inner petals, pistils, and outer petals. Group II included potted and ground-cover, traditional, wild, and spray chrysanthemums, characterized by small flower head diameter and pistil colors with b* > a*. Group III primarily consisted of disbud and wild chrysanthemums, displaying yellow or white petals, and green or yellow pistils. Group IV contained traditional and disbud chrysanthemums, featuring high petal counts and large flower head diameter. Group V was dominated by potted and ground-cover, and wild chrysanthemums, most exhibiting small flower head diameter.
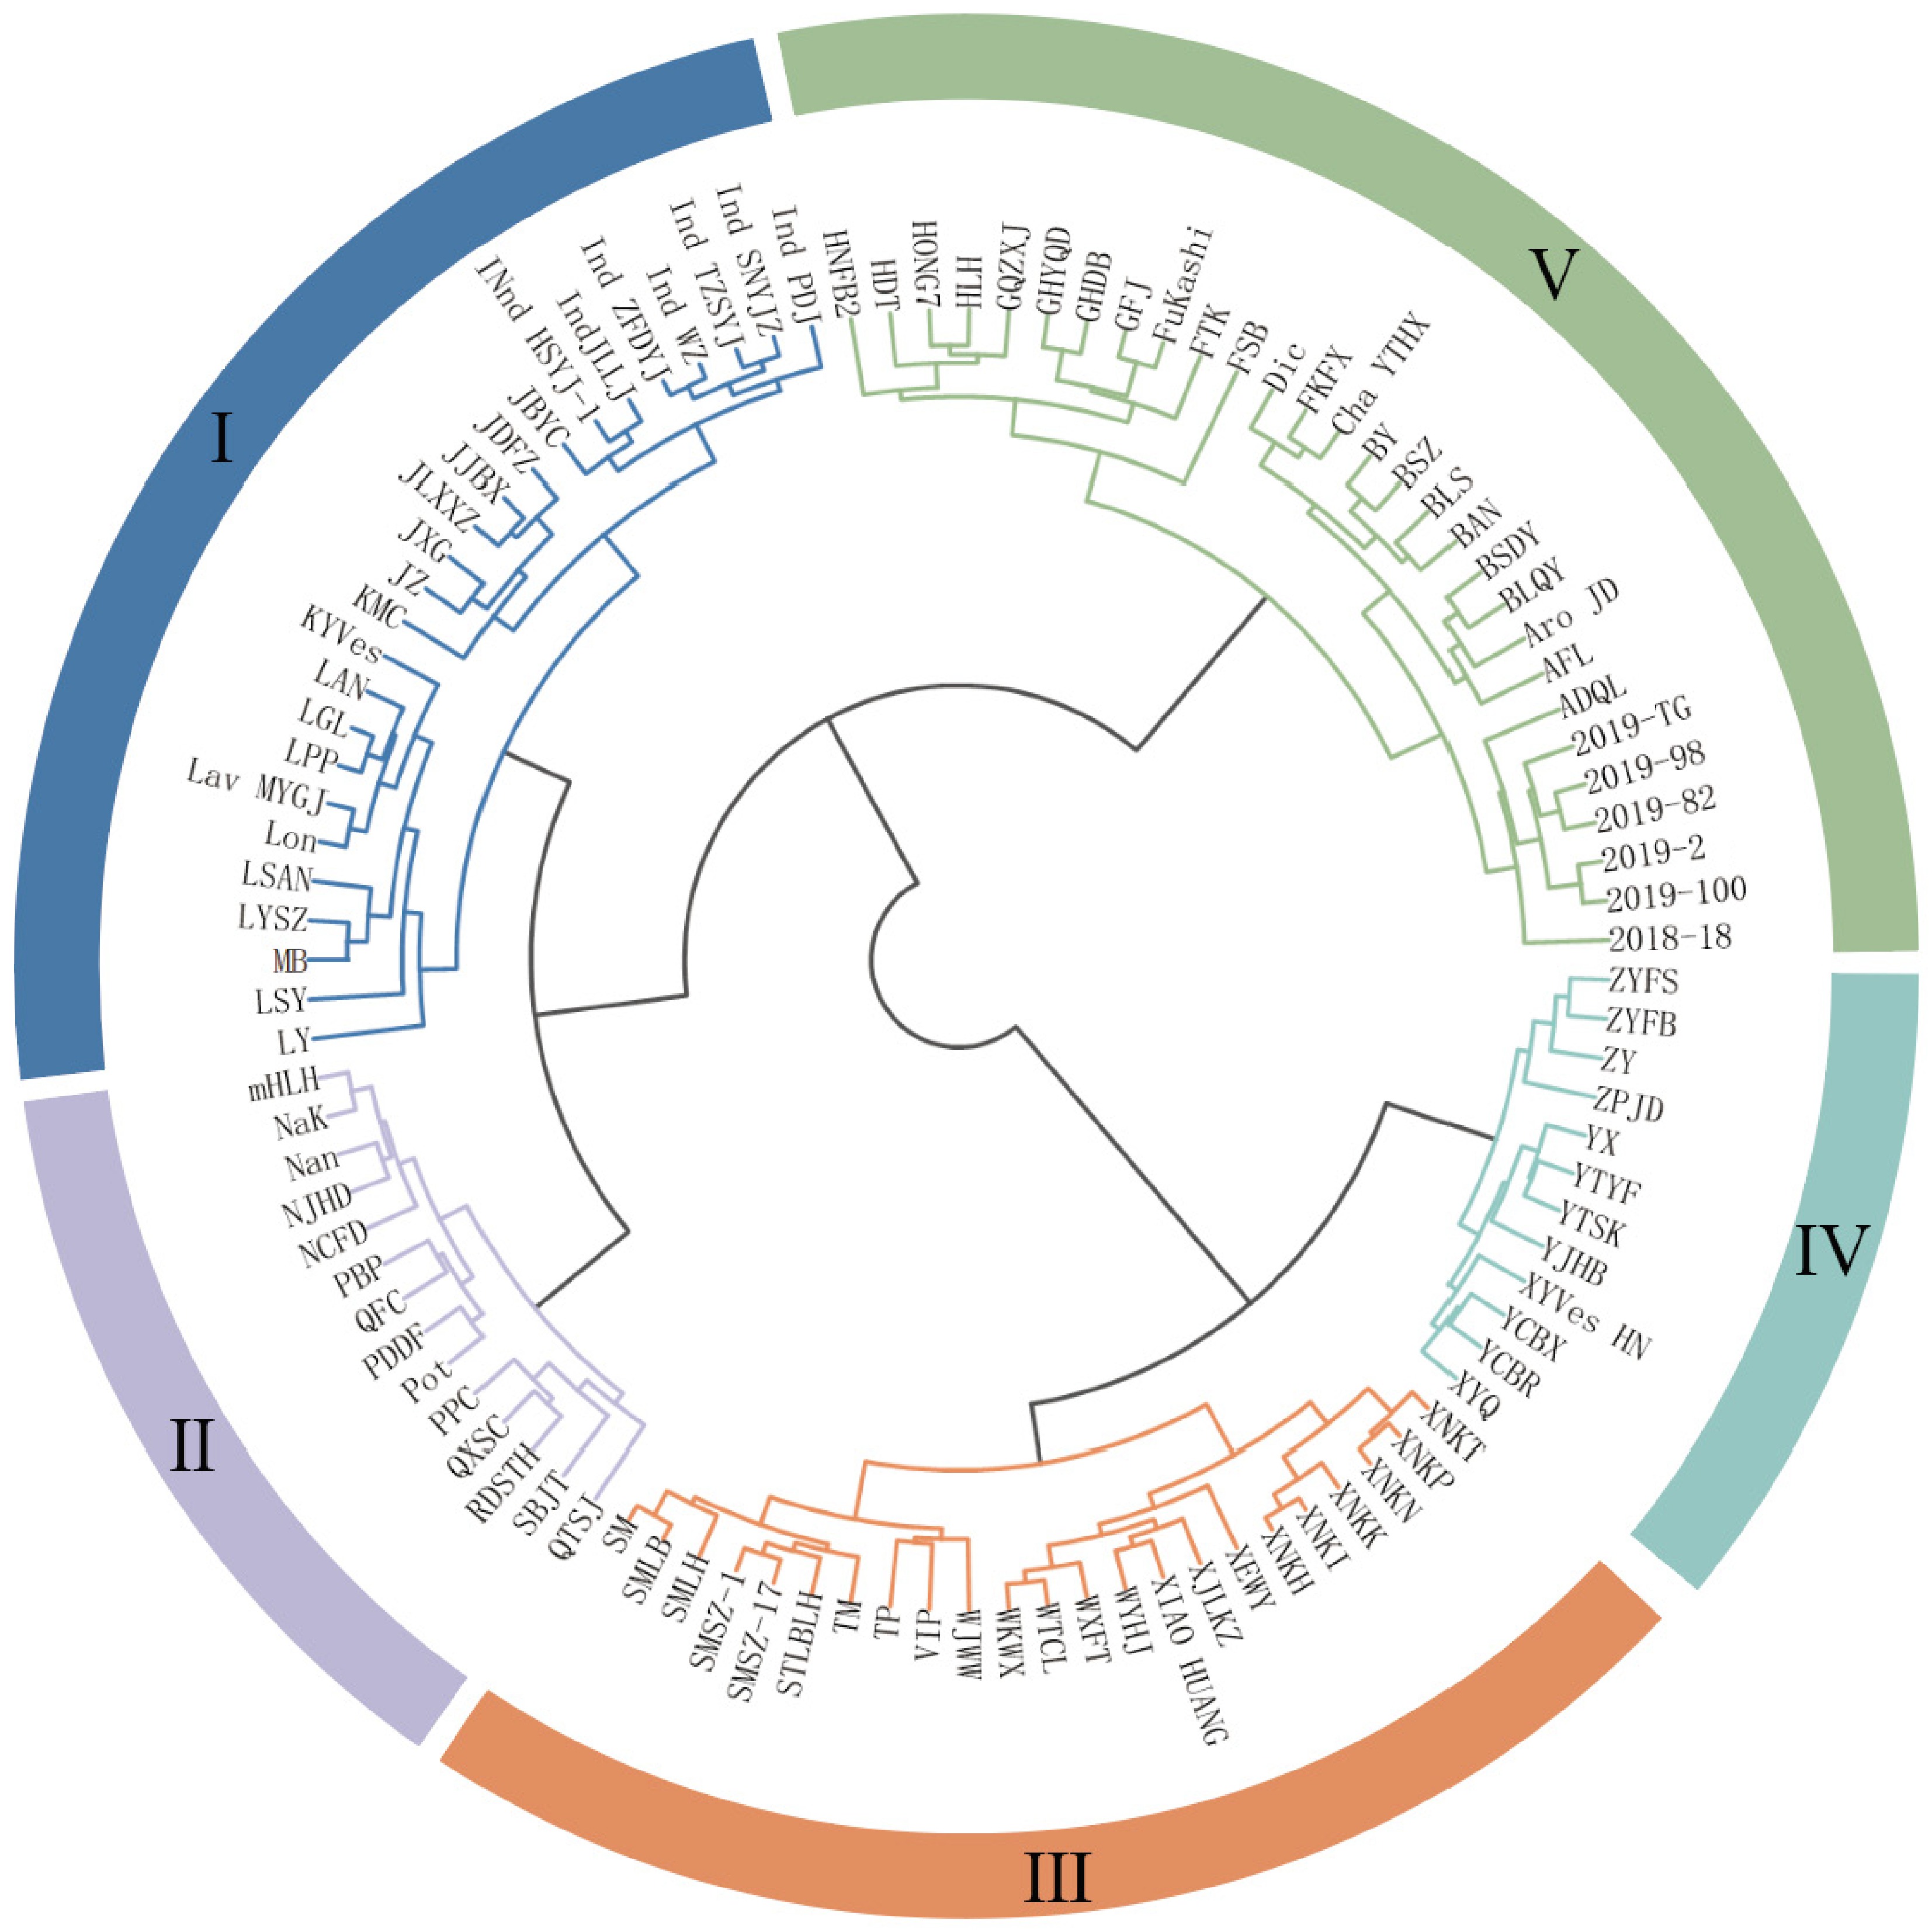
Figure 3.
Cluster analysis of 103 Chrysanthemum germplasm accessions.
Correlation analysis of six floral traits
-
Analysis of six floral traits across 103 chrysanthemum accessions revealed significant correlations (Fig. 4a), including: (1) NP exhibited negative correlations with PD and PC b*, but positive correlations with OC L*, RFL, and FD; (2) FD showed positive correlations with both RFL and RFW; (3) PD correlated negatively with RFL, IC L*, and OC L*, while positively with PC a* and b*; (4) RFW and RFL were mutually positively correlated yet both negatively correlated with IC b* and OC b*; (5) RFL demonstrated positive correlations with IC L* and OC L* but negative correlations with PC a* and b*; (6) Significant negative correlations emerged between L* values of IC,OC and PC; (7) Within color parameters, a*/b* values among IC, OC, and PC displayed strong positive inter-correlations.
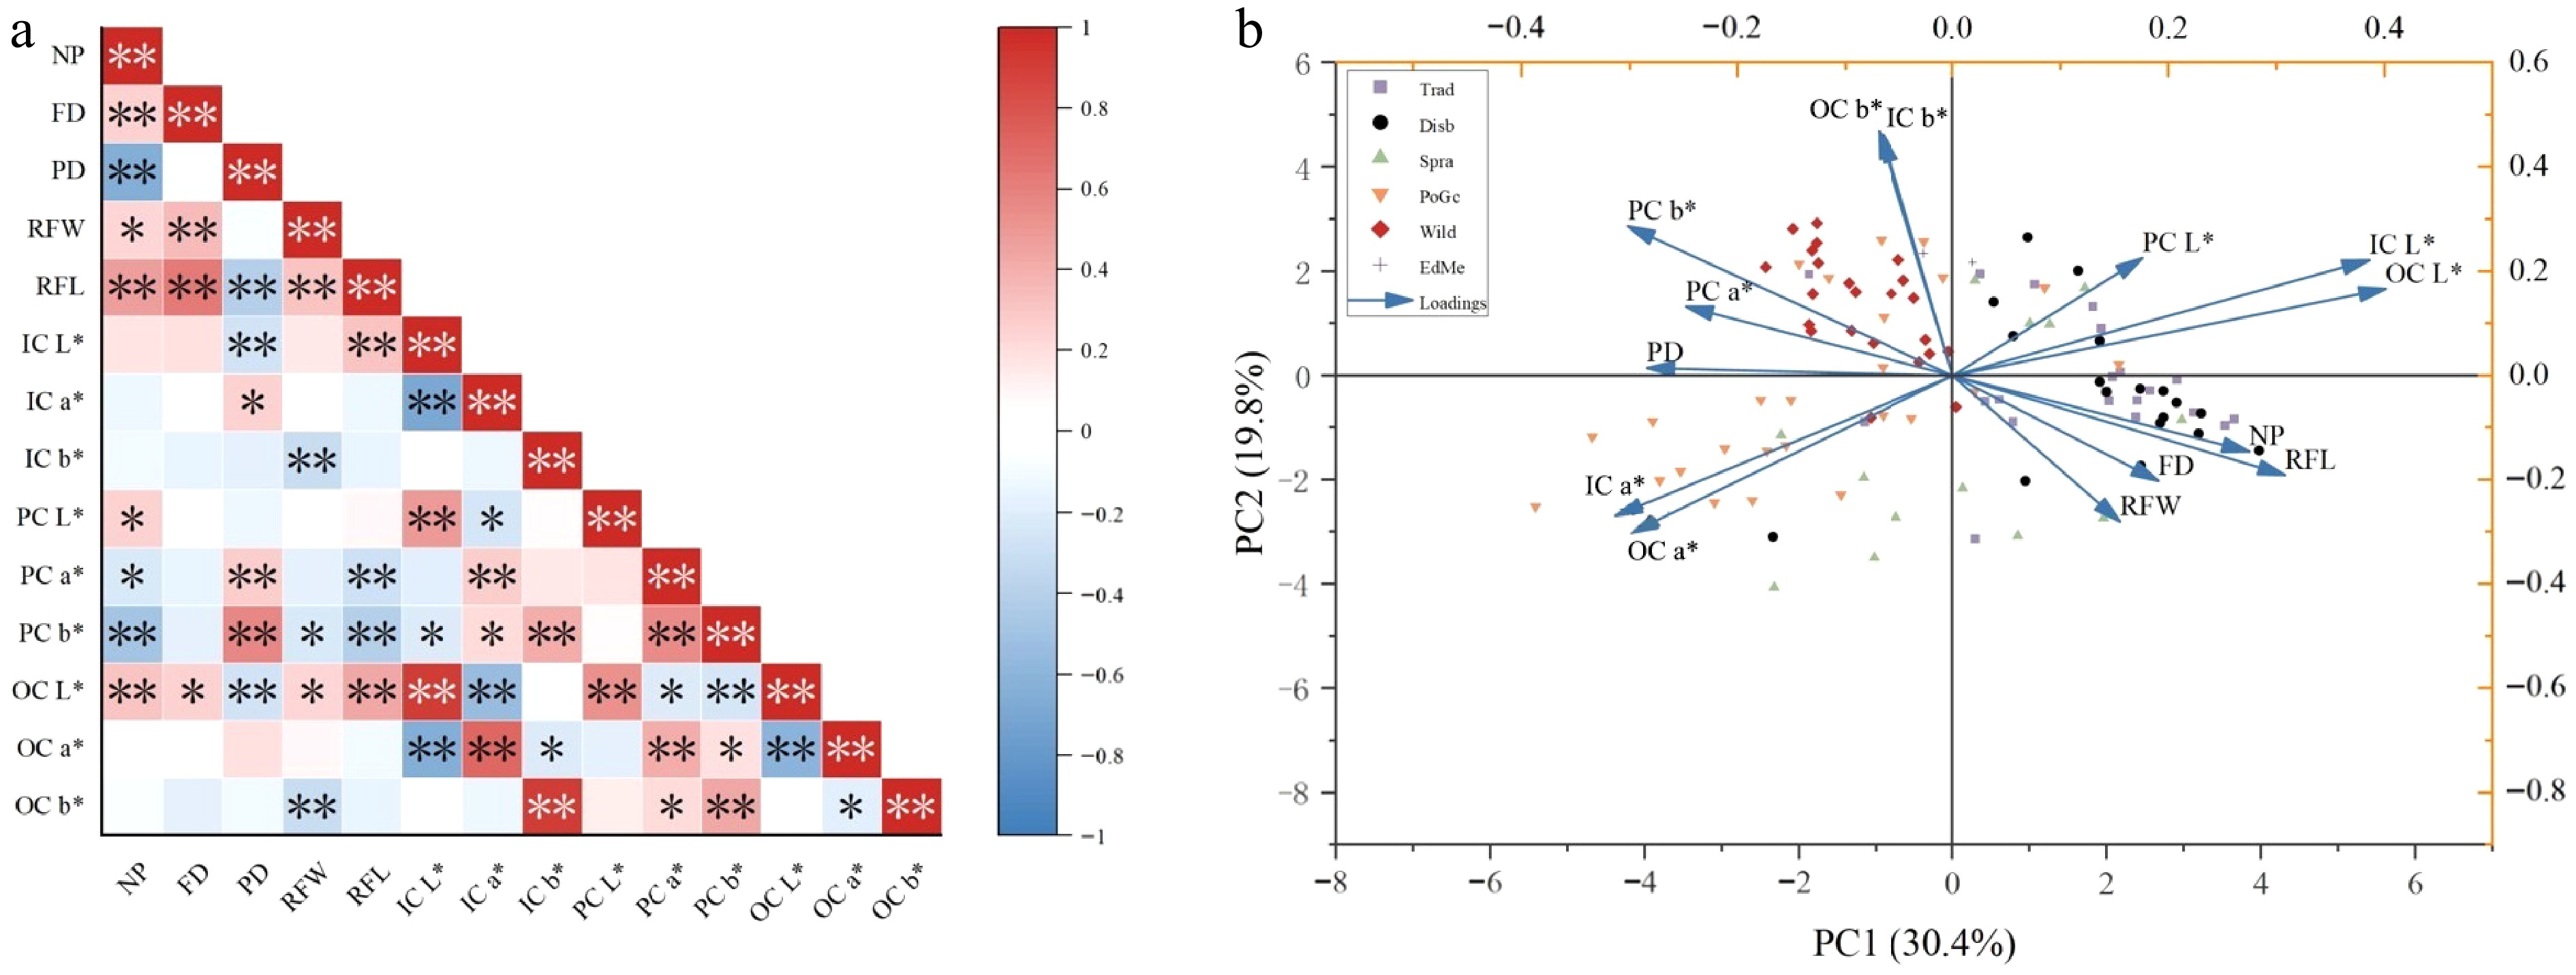
Figure 4.
(a) Heatmap of correlation analysis for 14 traits. (b) Biplot based on the principal component analysis of 103 Chrysanthemum accessions. Note: * means significant difference (p < 0.05); ** means extremely significant difference (p < 0.01).
Principal component analysis (PCA) was conducted on six major phenotypes and 14 minor traits across 103 chrysanthemum accessions (Table 4). The first five principal components cumulatively accounted for 80.923% of the total variation, representing the majority of phenotypic trait variation in the core germplasm. The first principal component accounted for the largest proportion of variation, representing 30.353% of the total genetic information. This component was primarily defined by high and positive loadings of both IC L* and OC L*, indicating its strong association with petal lightness. The second principal component explained 20.075% of the contribution rate and was mainly characterized by high absolute loadings of OC b* and IC b*. The third principal component contributed 11.698% and was dominated by higher absolute loadings for the NP and PD, indicating that the third principal component is mainly determined by the structural traits. The fourth principal component, with a contribution of 10.532%, showed higher loadings for PC a* and PC L*, indicating that it was mainly composed of the pistil colour. Finally, the fifth principal component accounted for 8.265%, with a high loading for FD, indicating this component is predominantly defined by FD.
Table 4. Eigenvector plot of PCA for 14 traits in Chrysanthemum.
Trait PV1 PV2 PV3 PV4 PV5 NP 0.277 −0.146 0.411 0.154 −0.292 FD 0.196 −0.202 0.027 0.373 0.535 PD −0.278 −0.004 −0.520 0.091 0.248 RFW 0.161 −0.276 −0.091 0.236 0.209 RFL 0.311 −0.189 0.193 0.265 0.272 IC L* 0.383 0.229 −0.276 0.091 −0.037 IC a* −0.307 −0.279 0.155 0.200 −0.055 IC b* −0.076 0.457 0.388 0.054 0.241 PC L* 0.174 0.228 −0.123 0.413 −0.461 PC a* −0.251 0.129 −0.070 0.483 −0.248 PC b* −0.306 0.279 −0.154 0.325 0.182 OC L* 0.401 0.168 −0.230 0.173 −0.052 OC a* −0.291 −0.311 0.166 0.320 −0.183 OC b* −0.079 0.464 0.374 0.104 0.208 E 4.249 2.811 1.638 1.474 1.157 CR % 30.353 20.075 11.698 10.532 8.265 CCR % 30.353 50.428 62.126 72.658 80.923 E: eigenvalues; CR: contribution rate; CCR: cumulative contribution rate. The biplot was drawn by taking the first principal component as the X-axis and the second principal component as the Y-axis. The 103 chrysanthemum accessions were divided into four groups (Fig. 4b). The first group is mainly wild chrysanthemum, including Ind SNYJZ, Ind ZFDYJ, XNKN, etc; the second group is distributed in all but the wild type; the third group is mainly spray, and potted and ground-cover chrysanthemums, including HONG7, HDT, HLH, etc; and the fourth group consists of the traditional and disbud chrysanthemums, including ZYFB, QXSC, and GHYQD.
Screening of the comprehensive indices of phenotypic traits
-
Based on the eigenvalues and the load matrix of five principal components, the eigenvectors were calculated and used as the coefficients of each principal component. Based on the coefficients of each principal component and standardized phenotypic data, the calculation formula for the principal component score was obtained. The linear equation of the first principal component score was as follows:
P1 = 0.277U1 + 0.196U2 − 0.278U3 + 0.161U4 + 0.311U5 + 0.383U6 − 0.307U7 − 0.076U8 + 0.174U9 − 0.251U10 − 0.306U11 + 0.401U12 − 0.291U13 − 0.079U14
Since the five principal components can represent most of the information of the traits, five variables were used to replace the original 14 phenotypic traits to form a linear combination. The proportion of the eigenvalues corresponding to each principal component to the sum of the total eigenvalues of the extracted principal components was used as the weighting coefficients to obtain the mathematical model of the composite score: F = 0.375P1 + 0.248P2 + 0.145P3 + 0.130P4 + 0.102P5. The comprehensive score (F value) was calculated to evaluate the phenotypic combination of various qualitative materials, with a higher F value indicating a more favorable combination of traits. Among the 103 accessions analyzed, the top five varieties ranked by F value were JZ, WJWW, RDSTH, QXSC, and ADQL. Correlation analysis based on the 14 traits and F values (Table 5) revealed that NP, FD, RFL, IC L*, IC b*, PC L*, OC L*, and OC b* were all significantly positively correlated with the composite F value. In addition, PD, IC a*, PC a*, PC b*, and OC a* also showed significant positive correlations with the F value. Conversely, PD, IC a*, PC b*, and OC a* were significantly negatively correlated with the F value. No significant correlation was found between RFW and the F value. Based on the calculated comprehensive F values and phenotypic traits, an optimal regression equation was constructed to screen evaluation indicators for comprehensive trait assessment of germplasm resources.
Table 5. Correlation coefficients (CC) between 14 phenotypic traits and the comprehensive value (F).
Trait F Trait F NP 0.472** IC b* 0.359** FD 0.340** PC L* 0.470** PD −0.569** PC a* −0.287** RFW 0.122 PC b* −0.267** RFL 0.538** OC L* 0.794** IC L* 0.782** OC a* −0.656** IC a* −0.670** OC b* 0.361** * p < 0.05; ** p < 0.01. Taking the F value as the dependent variable and the 14 phenotypic traits as independent variables, the optimal regression equation was established by stepwise regression analysis as follows: Y = −2.297 + 0.208x1 + 0.100x2 − 0.168x5 + 0.524x6 + 0.420x8 + 0.099x9 − 0.090x10 − 0.073x11, where the eight traits with their direct path coefficients given in parentheses: x1 = NP (0.208), x2 = FD (0.100), x5 = RFL (0.168), x6 = IC L* (0.524), x8 = IC b* (0.420), x9 = PC L* (0.099), x10 = PC a* (−0.090), x11 = PC b* (−0.073). The correlation coefficient r and determination coefficient R2 of the equation were 0.976** and 0.953, respectively, indicating that the eight phenotypic traits could determine 95.3% of the total variation. The F value was 243.533, and the regression equation reached a very significant level, indicating that these eight phenotypic traits could be used as comprehensive evaluation indices of chrysanthemum germplasm resources. These results indicated that the eight floral traits (NP, FD, RFL, IC L*, IC b*, PC L*, PC a*, and PC b*) significantly influence the overall value of floral traits in Chrysanthemum plants. These indicators can be utilized as comprehensive evaluative measures for the floral morphology of Chrysanthemum species.
-
Genetic diversity represents the fundamental basis for resource evaluation and utilization, providing essential insights for gene discovery in genetic resources. Phenotypic traits, while serving as a critical foundation for breeders conducting chrysanthemum improvement programs, also constitute a core reference for researchers investigating the molecular mechanisms underlying complex traits[31,32]. To facilitate effective utilization and innovation of chrysanthemum germplasm, genetic diversity within its phenotypic traits was quantified using the Shannon-Wiener diversity index. This study revealed that while genetic diversity levels vary across phenotypic traits in chrysanthemums, a similar trend emerged across different types. Both inner and outer chrysanthemum petals exhibited high diversity indices and substantial color variation, spanning white, yellow, pink, purple, green, red, muddy gold, and inky hues. Notably, many varieties displayed bicolored petals, producing complex variegation. Among the diversity indices greater than 1.5 were OC b* (1.72) for spray chrysanthemums, IC b* (1.57) for wild chrysanthemums, OC a* (1.53) for potted and ground-cover chrysanthemums, IC a* (1.52) for spray chrysanthemums, PC b* (1.52) for spray chrysanthemums, and OC a* (1.52) for spray chrysanthemums. It indicated that the phenotypic variation of chrysanthemum germplasm resources had rich genetic diversity. Comparing the diversity indices of cultivated species and wild type, it was found that each trait of cultivated species was basically higher than that of wild type, indicating that cultivated species were more genetically diverse, especially in the number of petals and the length of the ray floret.
Cluster analysis results indicated that group I comprised varieties with monochromatic petals, predominantly yellow, where the L* values of the petals were significantly higher than the a* and b* values. Group II included varieties characterized by small flower diameters and a yellow pistil. Group III consisted of varieties with similarly small flower diameters, mostly white or yellow petals, and featured either single or semi-double petals. Group IV was distinguished by large flower diameters and a high petal count, with most types being double-petaled. Varieties in Group V also had small flower diameters and were primarily single-petaled or semi-double-petaled. Overall, the 103 chrysanthemum varieties exhibited a high diversity index in petal color, although the actual variation was relatively low, implying that long-term selection has led to a general preference for and acceptance of brightly colored flowers. The high diversity indices for a* and b* values indicate rich flower color variation among chrysanthemums, likely driven by diverse aesthetic preferences. Furthermore, comparisons between cultivated and wild chrysanthemums revealed that cultivated varieties generally possessed higher diversity indices and coefficients of variation, suggesting that cultivated chrysanthemums have abundant genetic variation and broader phenotypic differences than wild types. The greater diversity of floral traits observed in cultivated chrysanthemums is likely significantly influenced by artificial selection and breeding practices. Additionally, factors such as the plant's self-incompatibility, high hybrid vigor, gene flow, and the common occurrence of polyploidy in cultivated varieties also play a role in this diversity[33,34].
Screening of comprehensive indicators for phenotypic traits in Chrysanthemum germplasm resources
-
There are fewer studies on the screening of comprehensive indicators of phenotypic traits in chrysanthemum among the published studies on chrysanthemum core resources and genetic diversity[35,36]. The Membership Function Method and Principal Component Analysis (PCA) was employed to identify integrated indices for evaluating phenotypic traits in chrysanthemum germplasm. This methodology has been previously applied in genetic diversity assessments of other plant species[36,37]. The initial eigenvalues and cumulative contribution rate of principal components served as the basis for component selection, where eigenvalues > 1 were adopted as the standard extraction criterion[38]. This study analyzed 14 phenotypic traits of chrysanthemum. The results showed that the initial eigenvalues of the first five principal components exceeded 1, with a cumulative contribution rate of 80.923%. The first principal component had the highest contribution rate at 30.353%, representing traits related to petal color brightness, highlighting the importance of these characteristics in floral trait evaluation and genetic studies of chrysanthemum. The F value of the comprehensive phenotypic trait score was subsequently used to evaluate the overall performance of various qualitative resources, providing breeders and researchers with an intuitive, convenient, and quantitative reference[39]. The results indicated that the variety 'Jin Zun', classified as both a potted and groundcover chrysanthemum, had the highest composite value, while 'Lian Yu', also categorized as potted and groundcover, had the lowest value. Therefore, combining these varieties could contribute to constructing a research population rich in genetic diversity. Correlation analysis revealed a significant positive correlation between the composite F value and traits such as NP, FD, RFL, IC L*, IC b*, PC L*, OC L*, and OC b*. Higher composite values corresponded to elevated levels of these traits, thereby offering valuable guidance for selecting parental lines in breeding programs. Given the diverse phenotypic traits in chrysanthemum floral characteristics and their varying degrees of correlation, it is crucial to identify a minimal set of representative traits that capture the full spectrum of diversity. Through principal component analysis and stepwise regression analysis, this study integrated and distilled 14 phenotypic traits into eight core traits (NP, FD, RFL, IC L*, IC b*, PC L*, PC a*, PC b*). This streamlined set serves as a comprehensive evaluation index system for chrysanthemum germplasm resources, retaining maximal phenotypic information, while reducing dimensionality.
Phenotyping has become one of the important directions of modern biological research. Without phenotypic data to complement genomic, transcriptomic, and other omics datasets, it remains challenging to systematically decipher the formation mechanisms and intrinsic principles governing breeding traits. In-depth analysis of phenomic data, combined with comprehensive exploitation of its biological value will significantly accelerate breeding progress.
-
The diversity of the genus of Chrysanthemum germplasm was assessed using 14 floral-related phenotypic traits across 103 accessions. The results revealed a high level of phenotypic diversity, with substantial variation among individual traits, although the overall patterns of variation were similar among different chrysanthemum types. Among all quantitative traits, PD exhibited the highest coefficient of variation, providing the most evidence for differences among chrysanthemum varieties. Cluster analysis grouped the 103 chrysanthemum accessions into five distinct clusters. Through principal component analysis and stepwise regression, eight representative traits (NP, FD, RFL, IC L*, IC b*, PC L*, PC a*, and PC b*) were selected from the original 14 traits. Together, these eight traits accounted for 95.3% of the total phenotypic variation and may serve as comprehensive evaluation indices for chrysanthemum germplasm resources. This study enabled a better understanding of the genetic diversity of chrysanthemums, thus providing data to support the selection of new varieties and the development of breeding strategies.
This work was supported by the National Key Research and Development Project of China (2023YFD1200105), the Fundamental Research Funds for the Central Universities (QNTD202503), the Science and Technology Innovation Project of the Xiongan New Area (2022XAGG0100).
-
The authors confirm their contributions to the paper as follows: conceived and designed the experiments: Yuan C, Cheng T, Zhang Q; contributed to the experiments: Yuan Q, Liu R, Song X, Wang Y, Wu H, Jiang Y, Sun T, Liu H, Cong T; analyzed the data and prepared the original draft: Yuan Q; reviewed and edited the paper: Yuan C. All authors reviewed the results and approved the final version of the manuscript.
-
The datasets generated during and/or analyzed during the current study are available from the corresponding author on reasonable request.
-
The authors declare that they have no conflict of interest.
- Supplementary Table S1 Table of 103 Chrysanthemum germplasm resources.
- Copyright: © 2025 by the author(s). Published by Maximum Academic Press, Fayetteville, GA. This article is an open access article distributed under Creative Commons Attribution License (CC BY 4.0), visit https://creativecommons.org/licenses/by/4.0/.
-
About this article
Cite this article
Yuan Q, Liu R, Song X, Wang Y, Wu H, et al. 2025. Evaluation of genetic diversity of Chrysanthemum germplasm resources based on floral phenotypic traits. Ornamental Plant Research 5: e044 doi: 10.48130/opr-0025-0044 

Evaluation of genetic diversity of Chrysanthemum germplasm resources based on floral phenotypic traits
- Received: 15 August 2025
- Revised: 03 October 2025
- Accepted: 17 October 2025
- Published online: 27 November 2025
Abstract: Chrysanthemum germplasms are valued for their beauty as an ornamental plant and are increasingly recognized as a source of medicinal products. The floral traits of Chrysanthemum × morifolium are of considerable importance and exhibit substantial genetic diversity. However, systematic studies on floral trait phenotypic diversity in the genus Chrysanthemum, based on representative germplasm resources, are scarce. In this study, the diversity and variations of 14 floral-related phenotypic traits in 103 Chrysanthemum genus germplasm resources, collected from key Chrysanthemum origin and the main production areas of China, Japan, and Europe covering wild species and all application types of C. morifolium cultivars, were analyzed by using the coefficient of variation, Shannon-Wiener index, analysis of variance, and cluster analysis, and screened by correlation analysis, principal component analysis, and regression analysis. The results showed that Chrysanthemum accessions exhibited notable phenotypic variation and higher genetic diversity in floral traits. Comparison of cultivated and wild chrysanthemums revealed that the diversity indices of cultivated species were generally greater than those of wild-type, especially for petal number and ray floret length. Cluster analysis classified the 103 chrysanthemum accessions into five groups. Through principal component and stepwise regression analyses, eight traits were identified from 14, accounting for 95.3% of the total variation and can serve as a comprehensive evaluation index for chrysanthemum floral morphology. This study provides a systematic assessment of the diversity of floral traits in chrysanthemum germplasm resources, and lays a solid foundation for future chrysanthemum breeding, variety improvement, and conservation of genetic diversity.
-
Key words:
- Chrysanthemum /
- Genetic diversity /
- Floral traits