


-
Greenhouse gas emissions, primarily CO2, pose significant risks to ecological security and sustainable development[1−4]. As of 2024, global anthropogenic CO2 emissions have reached 41.6 billion metric tons, with atmospheric concentration at 422.5 ppm, representing a 52% increase compared to pre-industrial levels. Addressing ensuing crises, including global warming, necessitates the implementation of carbon capture, utilization, and storage. Among these technologies, post-combustion capture technology is increasingly regarded as one of the most promising directions, given its potential for direct integration with existing industrial flue gas treatment systems and its relatively low technical risk. Industrial flue gases typically comprise 12%–15% CO2, along with N2, NOx, and SOx. While traditional amine scrubbing has been successfully commercialized, it faces several bottlenecks, including high energy consumption, solvent degradation toxicity, and severe equipment corrosion[5]. In contrast, solid adsorption technology has gained considerable attention due to its operational flexibility, potential for lower energy consumption, and favorable economic characteristics[6]. Particularly, carbonaceous adsorbents (e.g., activated carbon, carbon nanotubes, biochar) have emerged as important alternatives due to their excellent stability, hydrophobicity, and cost-effectiveness[7]. Biochar, a porous carbon, is produced from thermochemically converted biomass waste, delivering both environmental and economic benefits[8]. Its production process is carbon-negative, sequestering ~50% biomass carbon while mitigating emissions associated with open burning[9]. Moreover, biochar makes use of low-cost, abundant feedstocks and has tunable porosity/surface chemistry for enhancing its adsorption capabilities[10]. Importantly, saturated biochar can serve as a long-term carbon sink, whether through soil amendment (enhancing ecological sequestration) or as construction materials[11−13]. This integrated approach to carbon capture, sequestration, and utilization positions biochar as a sustainable and cost-effective solution for the bottlenecks of industrial carbon capture.
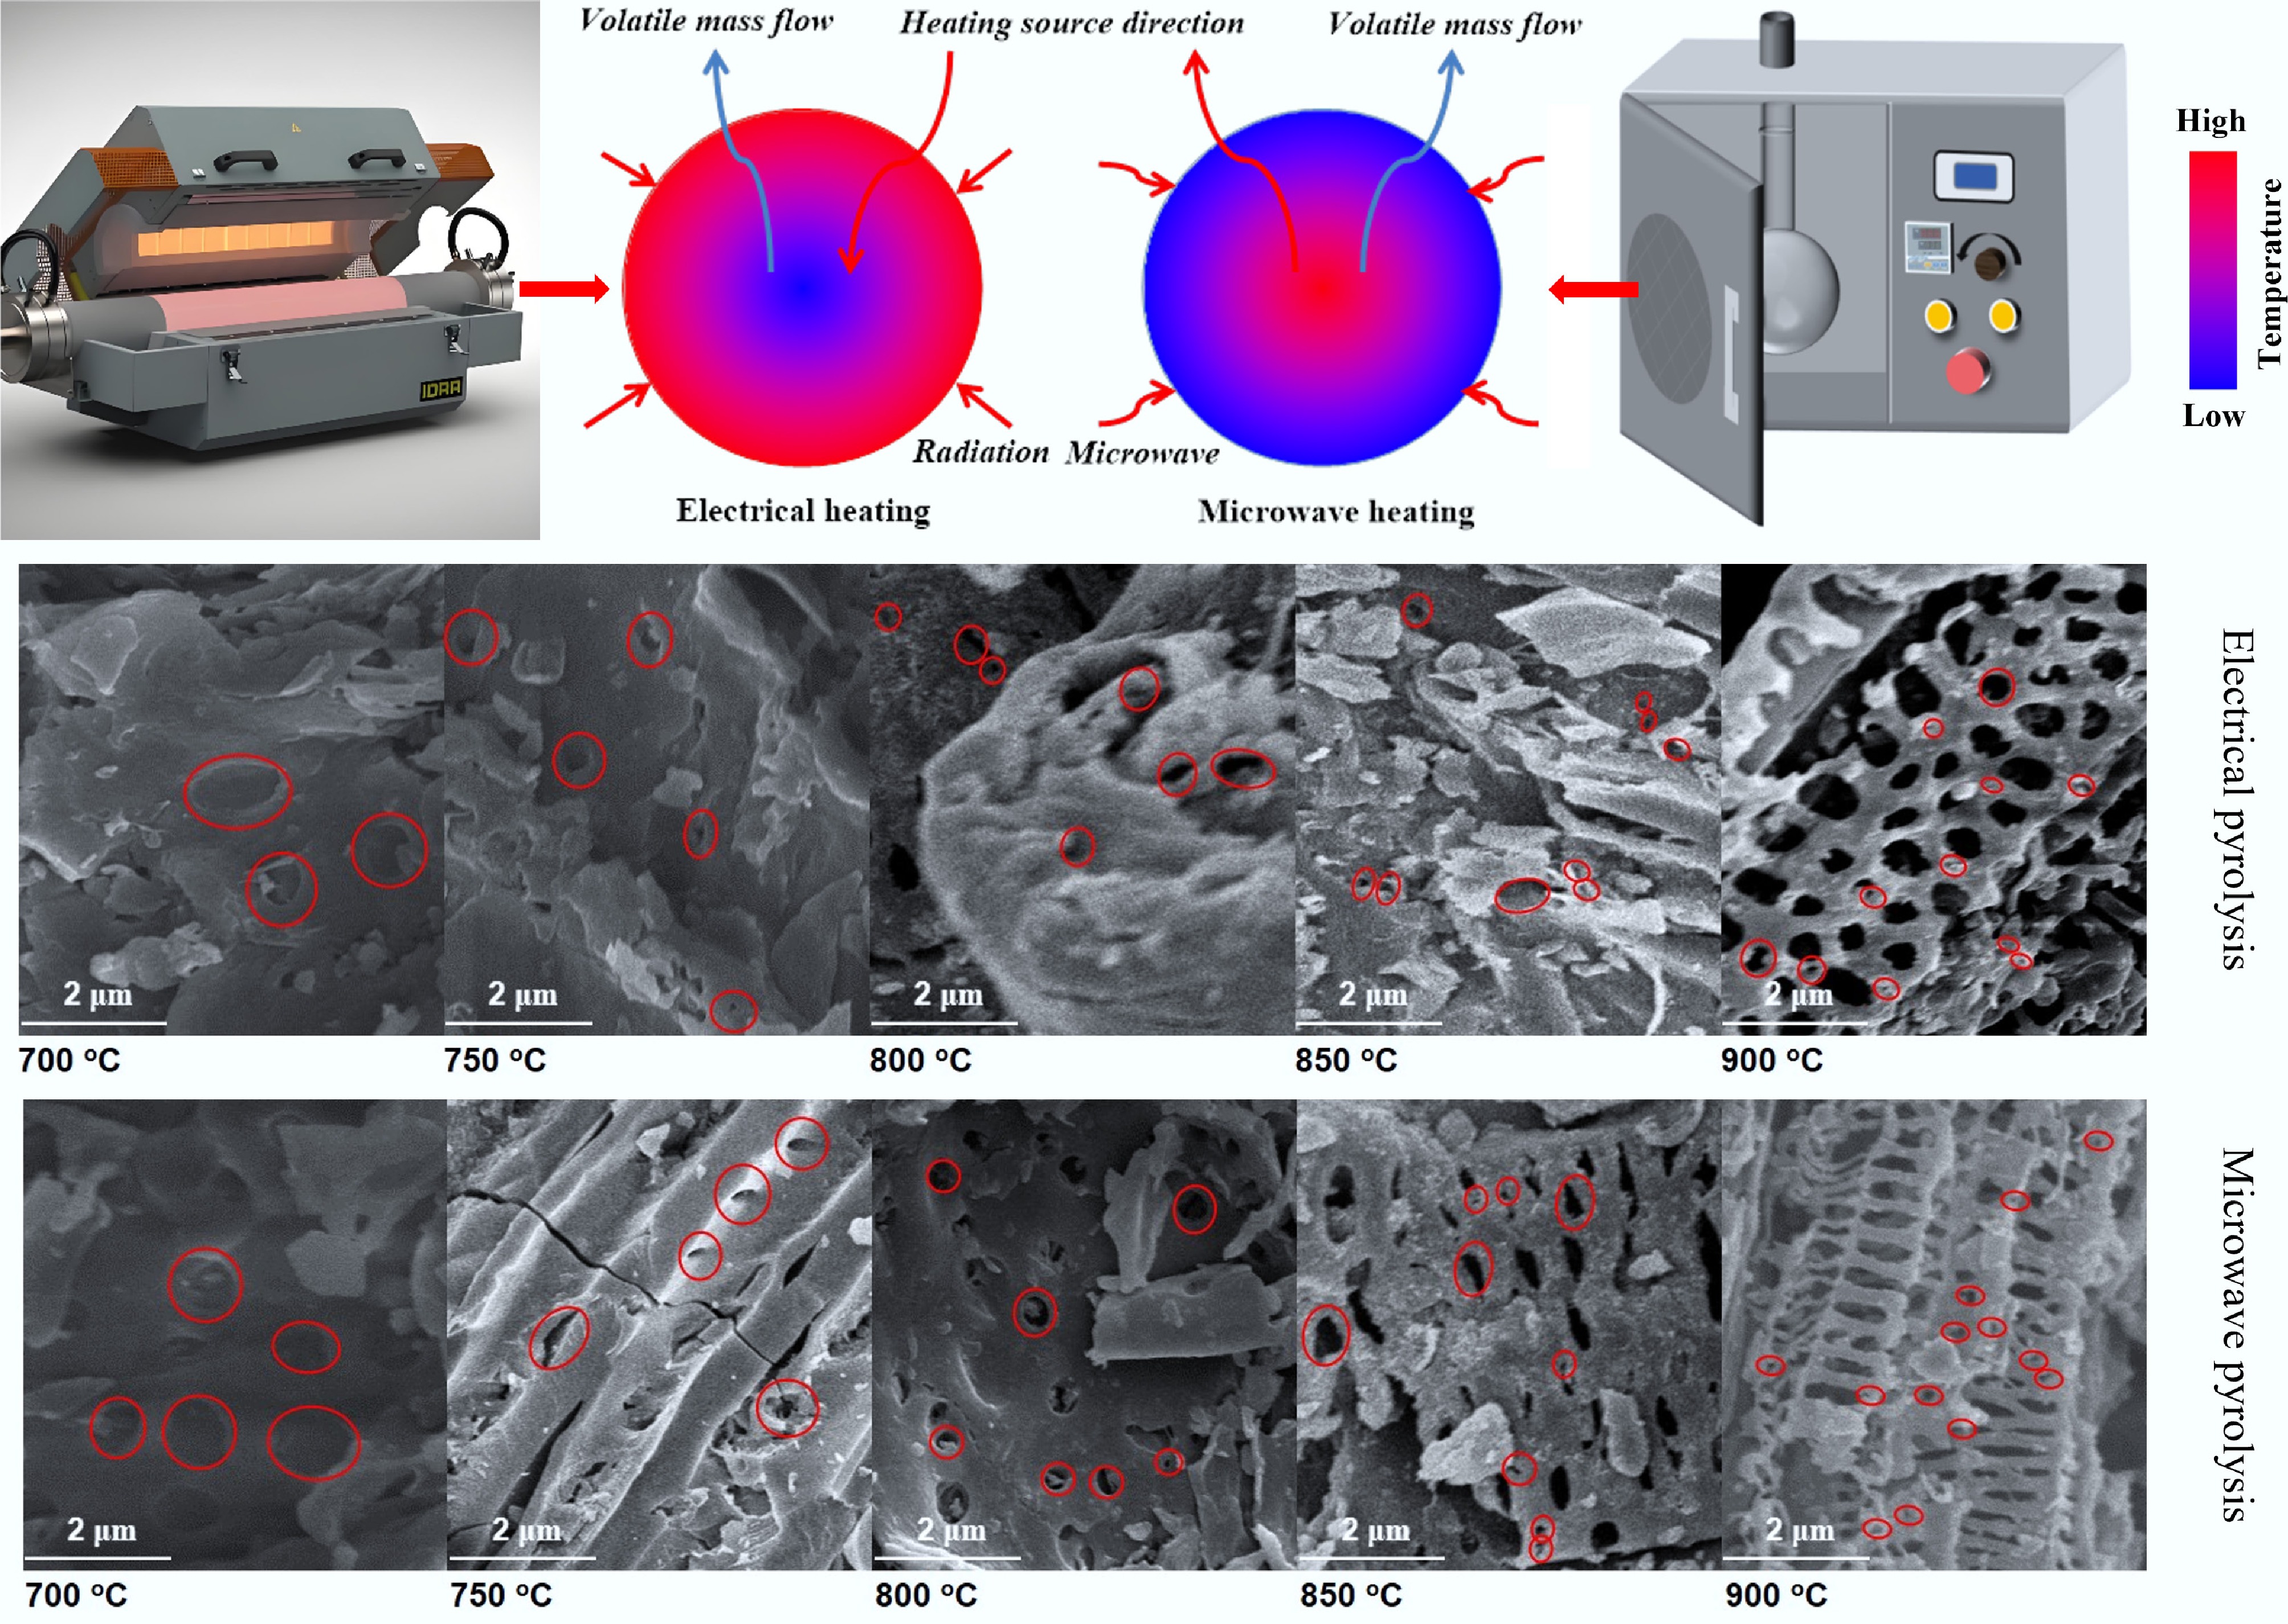
Currently, pyrolysis technology for biochar preparation serves as a vital component in carbon sequestration and pollution control mitigation, significantly influencing the material's pore structure, surface chemistry, and ultimate application performance. Conventional pyrolysis methods, including slow pyrolysis and fast pyrolysis, facilitate the thermochemical conversion of biomass by regulating heating rates (5–30 °C/min), residence times (> 30 min), and inert atmospheres (such as N2 and CO2), resulting in the formation of carbon materials enriched with functional groups, including carboxyl and carbonyl, through a series of multi-stage reactions of dehydration, depolymerization, and carbonization[14,15]. However, these methods present drawbacks, including uneven heating, high energy consumption, and limited pore development[16]. In contrast, microwave-assisted pyrolysis generates volumetric heating effects through interactions between electromagnetic fields and biomass dipole molecules (e.g., water, polar groups in lignin), thereby improving energy transfer efficiency by 3 to 5 times compared to conventional conductive heating and completing carbonization within 15 min[17]. This unique heating mechanism originates from microwave-selective excitation of dielectric loss in materials. When the frequency of the electromagnetic waves aligns with the molecular dipole relaxation frequency, polar molecules undergo rapid rotational friction, generating heat that instantly creates localized high-temperature hotspots within the biomass. This triggers rapid pyrolysis reactions, leading to the formation of interconnected mesopore and macropore networks[18]. Figure 1 shows the mechanisms of microwave-assisted pyrolysis and conventional pyrolysis[19,20]. Experiments demonstrate that rice straw-derived biochar via microwave pyrolysis attains a specific surface area of 455.90 m2/g, representing a 58% increase over conventional methods (288.60 m2/g), with a more uniform pore size distribution and an enhanced CO2 adsorption capacity (80 mg/g)[21]. Additionally, microwave-induced interfacial polarization enhances interactions between metal activators and biomass components. In a related study, Lin et al.[17] prepared hydrophobic biochar via microwave-ferric chloride co-activation, yielding a benzene-series adsorption capacity of 136.60 mg/g with a 40% increase in surface oxygen-functional group density when compared to conventional pyrolysis products.
Despite the significant pore development achieved through microwave pyrolysis, the pore structure and adsorption performance of biochar remain notable discrepancies when compared to conventional activated carbon. To address this limitation, activation techniques aimed at directional modulation of biochar pore networks through physical or chemical means have become crucial strategies. Physical methods, such as CO2 or steam activation, selectively etch carbon, leading to a significant increase in surface area and pore volume[22]. Additionally, steam activation promotes the formation of uniform micropores and retains functional groups[23]. In contrast, chemical activation allows for finer control of pore structures through the intercalation-expansion-etching mechanism between activating agents and biomass. KOH activation is dominant for creating ultra-microporous biochar (< 1 nm, > 80% micropores) with a remarkably high specific surface area (> 3,000 m2/g). This process occurs in several stages: molten KOH infiltration (< 400 °C), intercalation-expansion (400–700 °C), and vapor-phase etching (> 700 °C)[24,25]. For example, Xie et al.[26] prepared soybean residue-based biochar using this method, achieving a micropore ratio of 91% and a CO2 adsorption capacity of 6.3 mmol/g (1 atm). However, excessive reliance on micropores can limit adsorption kinetics. Mestre et al.[27] noted that materials with high surface area but deficient mesopores often exhibit slow kinetic characteristics during practical adsorption, leading to significantly reduced adsorption rates. In addressing this issue, phosphoric acid activation presents distinct advantages. Its acidic environment preferentially dissolves ash, metal oxides, and organic impurities, thereby eliminating pore blockages while generating 2–50 nm mesoporous channels. And this process results in the construction of a more developed three-dimensional pore network, which is critical for efficient mass transfer[28]. Concurrently, the dehydrating action of the acid activator promotes carbon skeleton cross-linking and aromatization, forming a stable mesoporous framework. Zhang et al.[29] employed CH3COOK to activate sludge-derived biochar after metal impurities were removed by HCI pretreatment, achieving a specific surface area of 991.55 m2/g. And this process led to a 70% increase in Pb2+ adsorption capacity, confirming the critical role of open pores in heavy metal diffusion. Microwave technology further optimizes activation by allowing for deep KOH penetration into biomass and accelerating intercalation reactions, which significantly reduces activation time (e.g., 10 min vs 2 h)[30,31]. Selective heating also helps maintain the integrity of the pore structure. Corn straw presents an ideal biomass for this approach due to its abundant agricultural waste rich in lignocellulose, making it highly suitable for thermochemical conversion. Additionally, its inherent silica and mineral content necessitate effective activation strategies, such as H3PO4 treatment, to remove impurities while concurrently developing mesopores.
Based on the above, this study employs a modified two-step activation method. First, biomass is impregnated and washed with phosphoric acid (10%–30%), followed by low-to-mid-temperature activation to achieve directional mesopore construction via acid concentration modulation. Next, the pretreated biochar undergoes microwave-KOH activation, which takes advantage of alkali metal gasification-expansion to refine the micropore network. The characterization of the material's pore size distribution and morphology was conducted through N2 adsorption/desorption and scanning electron microscope (SEM). Particular emphasis was placed on analyzing the impact of phosphoric acid impregnation ratios on the mesopore proportion. Subsequently, the CO2 adsorption characteristics of the prepared biochar were investigated. The integration of adsorption models with kinetic models allowed for an evaluation of the enhancement in mass transfer efficiency provided by hierarchical pore channels. This study provides both theoretical foundations and practical strategies for developing CO2 adsorbents with high adsorption capacity and rapid kinetics.
-
Corn straw was sourced from Jiangsu Province, China. First, the straw was washed with deionized water and then dried at 60 °C for 24 h. Subsequently, the dried straw was ground and sieved through a 60-mesh sieve (particle size < 250 μm) and then stored in an airtight container at room temperature prior to experiments. The proximate and ultimate analyses of the straw are detailed in Table 1. The data for proximate analysis were determined according to the Chinese National Standard GB/T (Tuijianxing Guojia Biaozhun, Recommended National Standard) 212-2008, while the ultimate analysis data followed the Chinese National Standard GB/T 31391-2015.
Table 1. Proximate analysis and ultimate analysis of corn straw
Item Value Proximate analysis (wt.%) Moisture 5.11 Ash 8.66 Volatile 71.23 Fixed carbon 15.00 Ultimate analysis (wt.%) C 42.24 H 5.78 O 37.78 N 0.39 S 0.04 During microwave-assisted pyrolysis, microwave energy exhibits selectivity toward raw materials. Given the inadequate microwave absorption of corn straw, the incorporation of microwave absorbers is required. These absorbers function by absorbing microwave radiation, converting it into other forms of kinetic energy that are further dissipated as thermal energy. This process enhances heating efficiency and facilitates the microwave-assisted pyrolysis reaction. For this study, silicon carbide (SiC) was selected as the microwave absorber. SiC possesses a density of 3,230 kg/m3 and a particle size of ~2 mm. Electronic-grade KOH crystals and an 85 wt.% H3PO4 solution was purchased from Shanghai Macklin Biochemical Technology Co., Ltd. (Shanghai, China). Furthermore, high-purity (99%) N2 and CO2 gases were obtained from Beijing Hai Pu Gas Co., Ltd. (Beijing, China).
Experimental procedures
-
The experimental setup for microwave-assisted pyrolysis and activation of biomass is illustrated in Fig. 2. This system comprises four components: (a) vacuum pump system (5, 6), (b) temperature measurement system (3, 4), (c) heating system (1, 2), and (d) power measurement system (7). The microwave pyrolysis apparatus has been manufactured by Shanghai Longyu Microwave Equipment Co., Ltd. (Shanghai, China) with a rated power of 1,000 W and a frequency of 2,450 MHz.
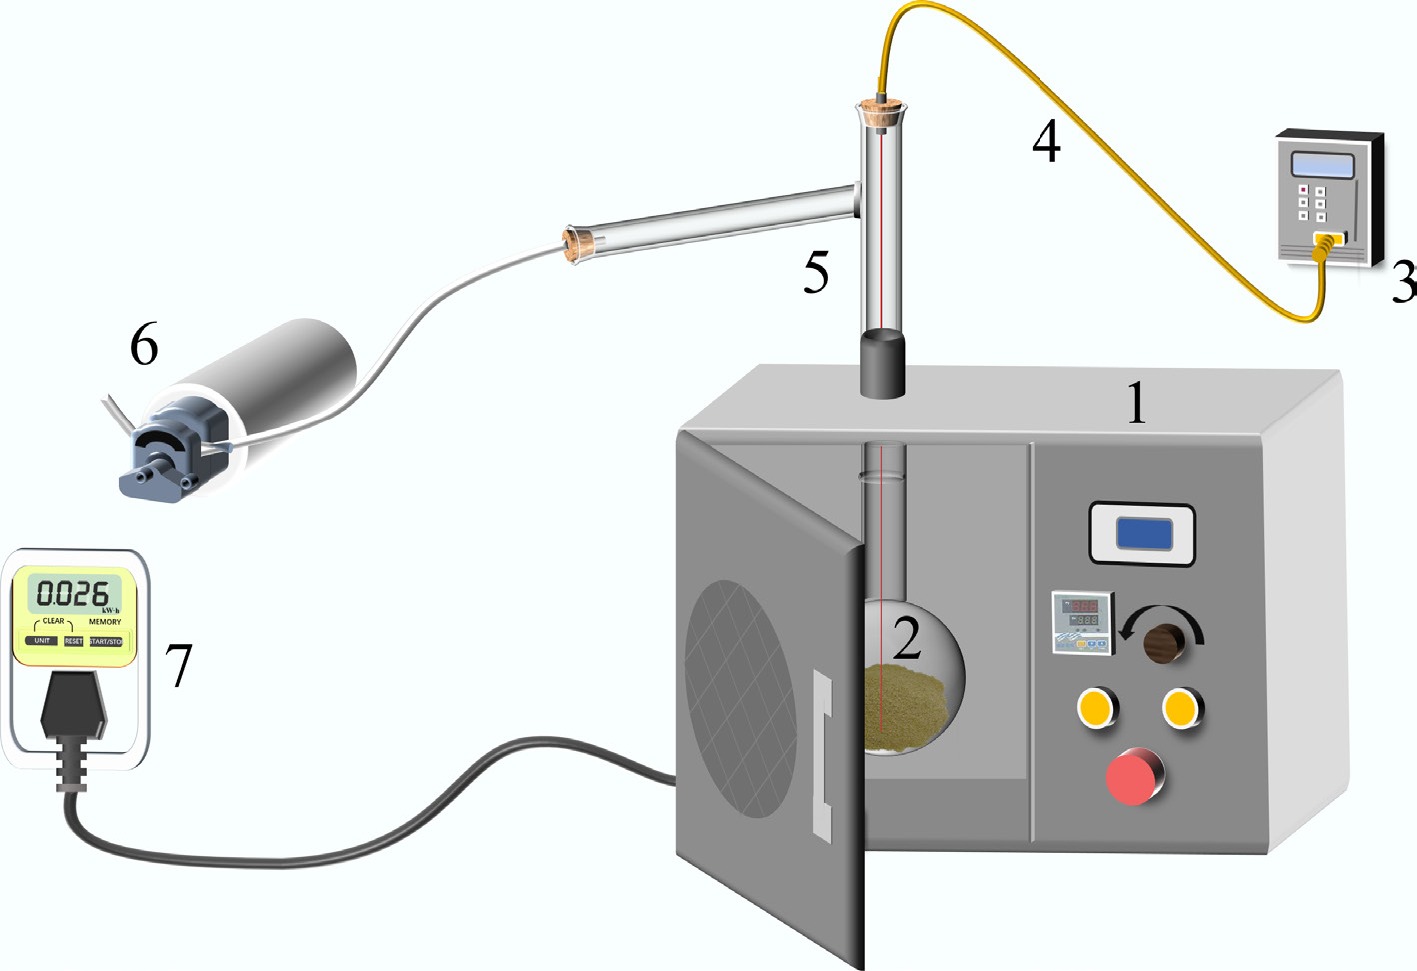
Figure 2.
Diagram of microwave-assisted pyrolysis experimental equipment: (1) microwave oven, (2) quartz reactor, (3) temperature sensor, (4) K-type thermocouple, (5) adapter connecting pipe, (6) vacuum pump, and (7) electric meter.
During the pyrolysis, the reaction temperature was monitored in real time using K-type thermocouples, with readings displayed on a temperature reader. The specific procedure for microwave pyrolysis experiments is detailed below. First, the microwave absorber and pyrolysis feedstock were mixed in the quartz reactor. Subsequently, the pyrolysis experimental system was connected as shown in Fig. 2. After connecting all test pipelines, quartz wool was used to insulate the quartz reactor inside the microwave furnace. The valve was opened to introduce N2 gas at a flow rate of 0.2 L/min. After 20 min, the microwave furnace was activated to initiate the microwave pyrolysis reaction. The experimental procedure for the two-step activation of biomass is depicted in Fig. 3. This procedure comprises two steps: H3PO4 impregnation with preliminary microwave activation, and KOH impregnation combined with high-temperature microwave activation. All activation parameters (temperatures, times, KOH/biochar ratio) were optimized through pre-experiments and fixed at their optimal values. The H3PO4/biomass ratio was designated as the primary variable. Specific experimental details are provided as follows.
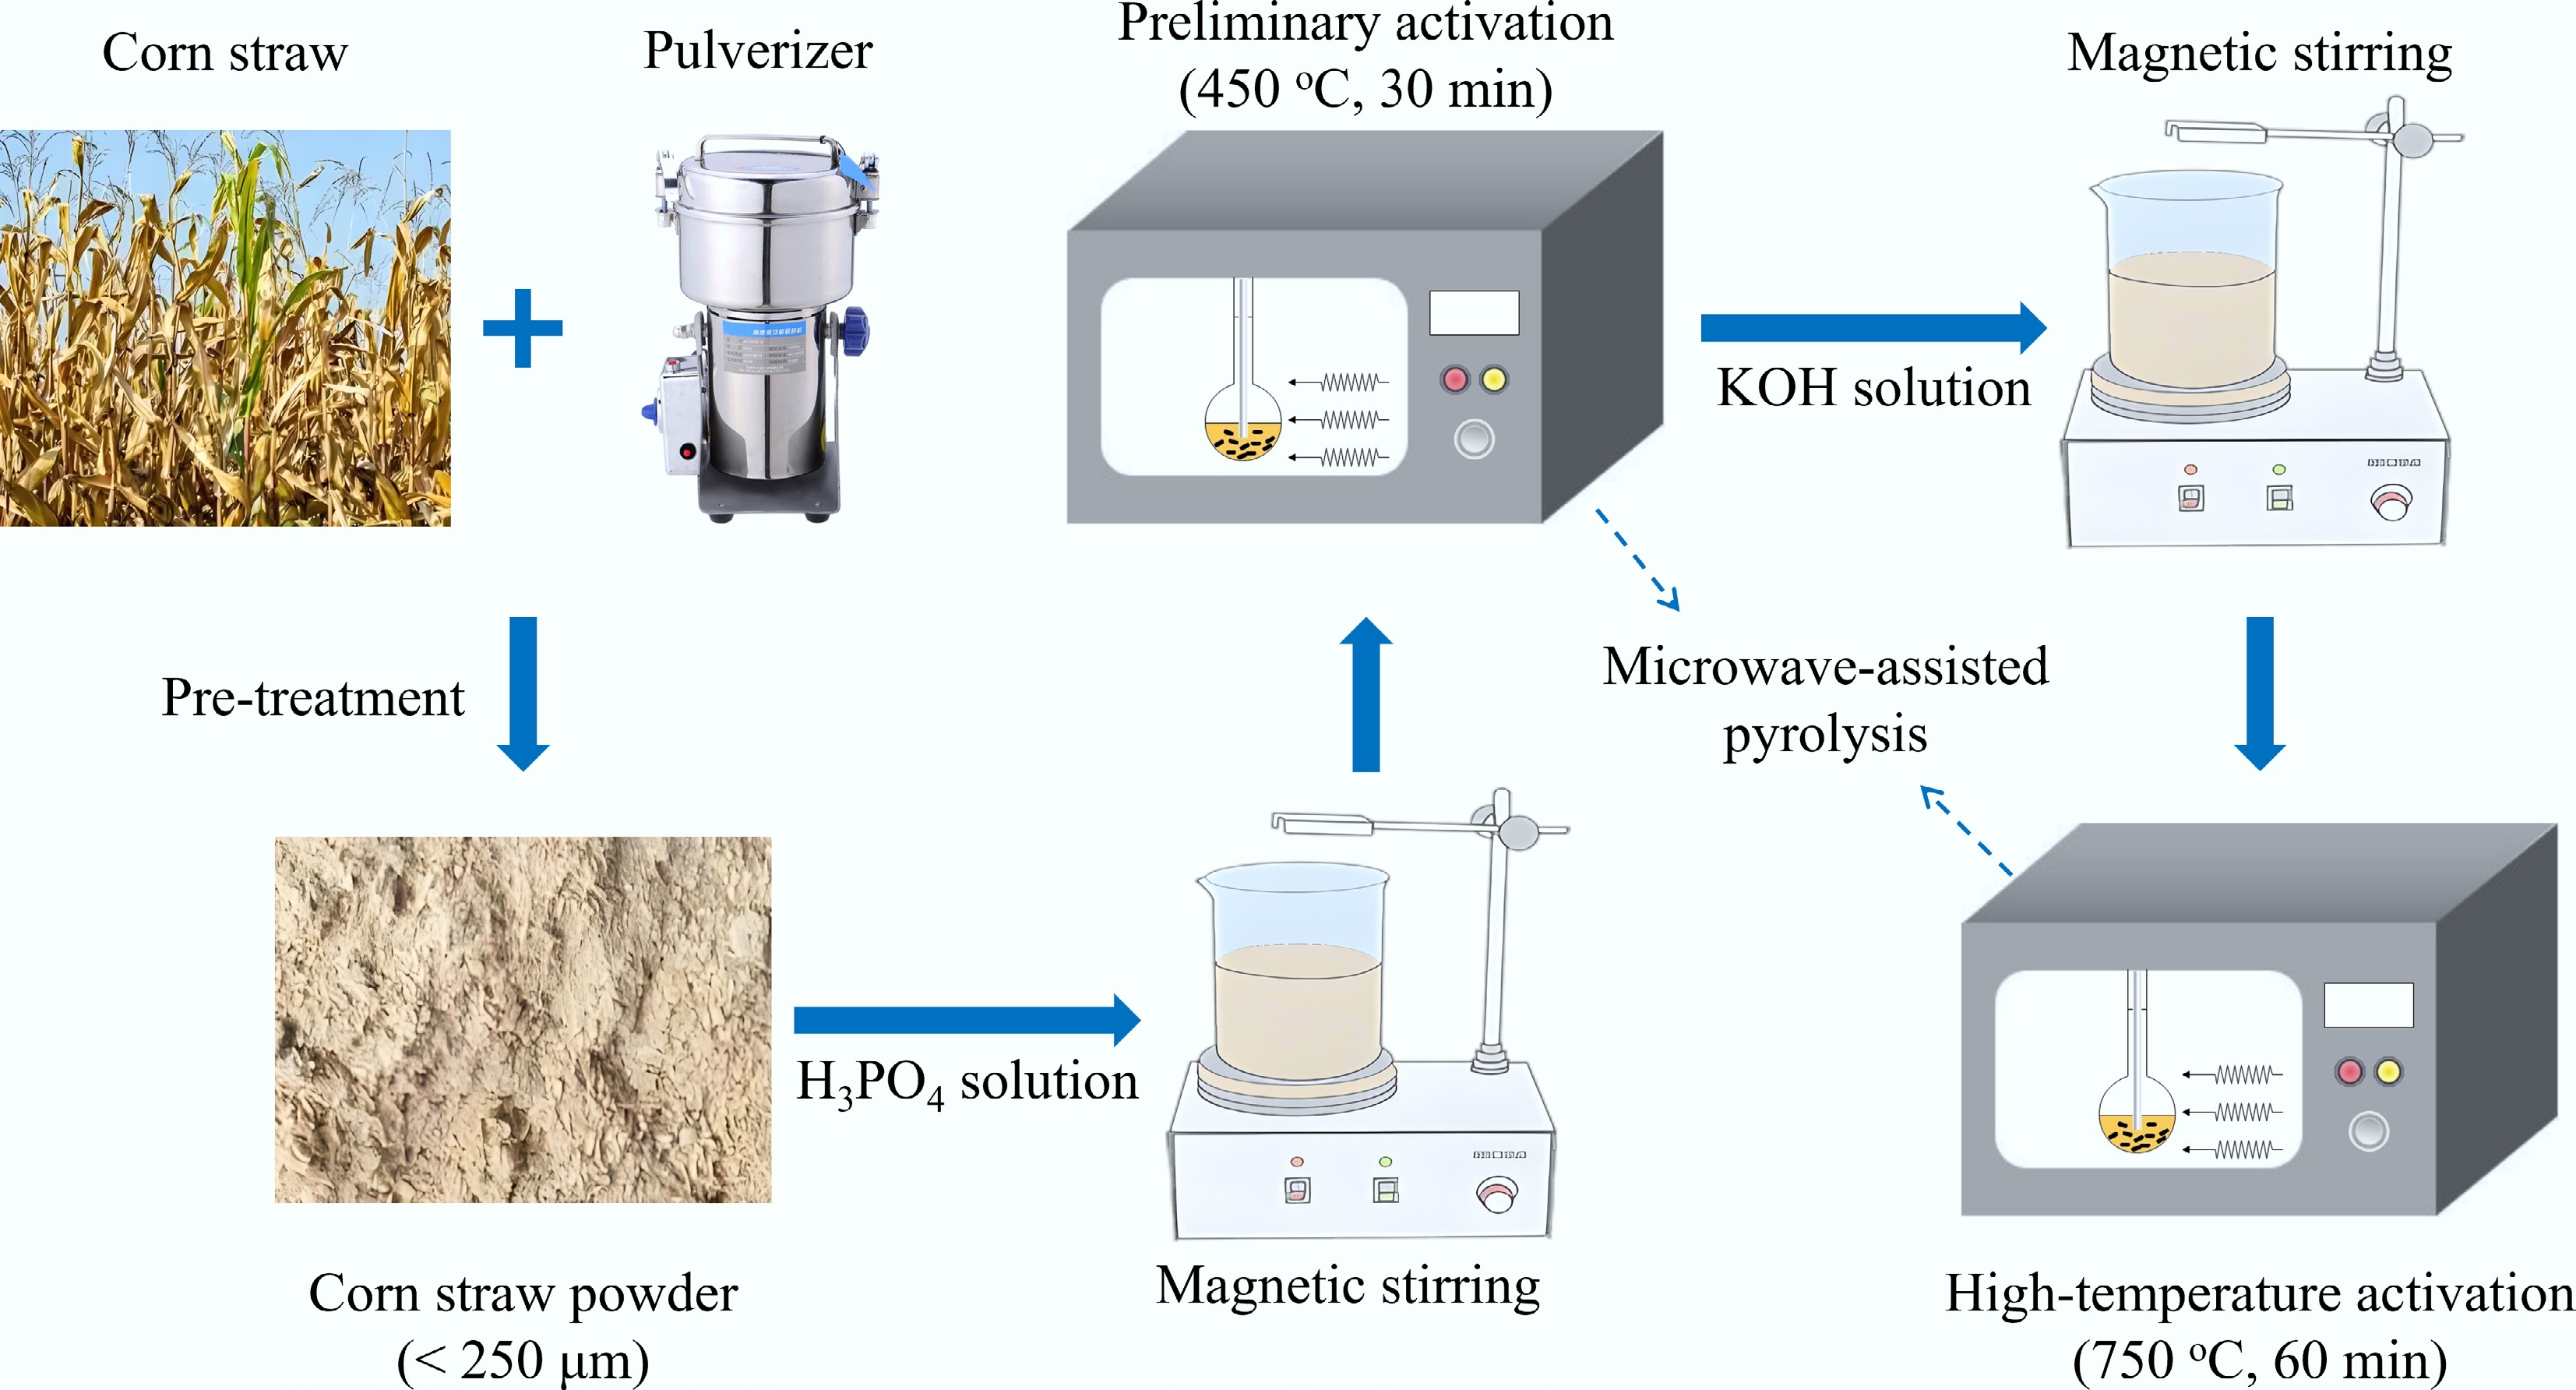
Figure 3.
Two-step activation experimental process.
H3PO4 impregnation and preliminary microwave activation: 15 g of pretreated biomass was mixed with a 40 wt.% H3PO4 solution at specified impregnation ratios (1:1, 1:2, 1:3, 1:4) to ensure complete saturation. The mixture was stirred and impregnated for 24 h at room temperature with a magnetic stirrer. Subsequently, the impregnated mixture was transferred to a quartz reactor for microwave-assisted pyrolysis. Since H3PO4 activation effectively generates mesopores at lower temperatures, insufficient activation (< 400 °C) yields fewer mesopores, while excessive temperatures (> 550 °C) can cause mesopore collapse, resulting in the formation of macropores and a reduced yield. Therefore, the activation temperature was set to 450 °C for a pyrolysis duration of 30 min. The resulting phosphoric acid-activated biochar (PBC) was washed with deionized water multiple times until the eluate reached neutrality, ensuring the complete removal of residual H3PO4 and soluble phosphates. The washed PBC was dried at 105 °C for 24 h.
KOH impregnation and high-temperature microwave activation: KOH solution and PBC were mixed uniformly at a KOH mass ratio of 3:1. The mixture was stirred for 24 h at room temperature using a magnetic stirrer. Subsequently, the impregnated mixture was transferred to the quartz reactor for microwave-assisted pyrolysis. As KOH activation requires higher temperatures for effective micropore etching, the pyrolysis temperature was set to 750 °C for 60 min. The resulting two-step activated biochar (PKBC) was thoroughly washed with deionized water until the eluate approached neutrality, ensuring the complete removal of any residual strong bases (e.g., KOH, K2CO3). The washed PKBC was dried at 105 °C for 24 h. To further explore the effects of the first-step H3PO4 activation, control experiments were conducted in which corn straw biomass was directly pyrolyzed at 450 °C without phosphoric acid activation. The activated biochar obtained via this method is denoted as KBC. The specific experimental conditions studied are summarized in Table 2.
Table 2. Experimental conditions of biochar activation
Sample KBC PKBC-1 PKBC-2 PKBC-3 PKBC-4 H3PO4/biomass 0 1:1 2:1 3:1 4:1 Characterizations
-
The adsorption-desorption isotherms of biochar were measured at 77 K under a nitrogen atmosphere using a gas adsorption analyzer (Autosorb-iQ, Quantachrome Instruments, USA). Prior to testing, the samples were degassed at 200 °C for 12 h. The specific surface area of the biochar was determined using the BET (Brunauer-Emmett-Teller) method, which is based on the adsorption isotherms showing gas uptake versus relative pressure. Data regarding pore size distribution and pore volume of the biochar were analyzed using the BJH (Barrett-Joyner-Halenda) and HK (Horvath-Kawazoe) methods to calculate the average pore diameter. After being coated with gold, the surface morphology of the biochar was scanned using an SEM (JSM-7800 F Prime, JEOL). The acceleration voltage was set within a range of 0.5 to 30 kV, with a secondary electron resolution of 0.8 nm (at 15 kV acceleration voltage).
CO2 capture experiments
-
The static adsorption isotherms for CO2 within the pressure range of 0–1 bar were measured using a Micromeritics ASAP 2460 analyzer. Prior to testing, all samples were degassed under vacuum at 200 °C for 12 h to completely remove physically adsorbed water and gases. This was followed by isothermal adsorption measurements conducted at 25 °C. Subsequently, quasi-equilibrium adsorption kinetic data of biochar for CO2 were obtained by monitoring the time-dependent variation in adsorption capacity at a pressure of 0.15 bar and different temperatures (0–45 °C), until adsorption equilibrium was reached. For dynamic adsorption characterization, a fixed-bed breakthrough experimental setup was established. The system operated at 25 °C with a gas mixture of 15% CO2 and 85% N2, simulating typical flue gas composition. This mixture flowed through an adsorption column packed with 1 g of activated biochar at a flow rate of 100 mL/min. The temporal variation of outlet gas concentration was continuously monitored using online gas chromatography to determine the dynamic adsorption breakthrough curves.
-
The results from nitrogen adsorption experiments conducted at 77 K for different samples demonstrate the significant impact of the phosphoric acid impregnation ratio on the pore structure of corn straw-based biochar. Across the gradient variation from impregnation ratios of 0:1 to 4:1, the pore parameters of the materials exhibit a non-monotonic evolution characterized by initial optimization followed by attenuation, as shown in Table 3. Specifically, as the impregnation ratio increases from 0:1 for the control group KBC to 3:1 for PKBC-3, the specific surface area (SSA) experiences a stepwise increase from 1,340 to 3,040 m2/g (representing a 127% increase). The total pore volume (Vtotal) also expands significantly, rising from 0.6 to 1.9 cm3/g (an increase of 217%). The contribution of micropores is particularly prominent, with the micropore volume (Vmicro) increasing from 0.5 to 1.1 cm3/g (an increase of 120%). Besides, Vmeso represents the mesopore volume. The nitrogen adsorption isotherms presented in Fig. 4 illustrate that all samples exhibit mixed Type I (steep rise in the P/P0 < 0.1 region) and Type IV (gentle slope increase in the P/P0 > 0.4 region) characteristics, indicating the presence of both micropores and mesopores in the materials and confirming their dual capability of micropore adsorption and mesopore capillary condensation[32]. PKBC-3 displays a distinct H4-type hysteresis loop in the P/P0 > 0.4 region, which signifies the formation of a lamellar mesoporous structure. In contrast, the hysteresis loop area of PKBC-4 drastically shrinks, suggesting pore collapse due to over-activation.
Table 3. Pore structure parameters of biochar
Sample SSA (m2/g) Vtotal (cm3/g) Vmicro (cm3/g) Vmeso (cm3/g) Vmeso/Vtotal (%) Average pore size (nm) KBC 1,338.74 0.614 0.512 0.102 16.61 1.64 PKBC-1 2,088.10 0.898 0.653 0.345 27.28 1.82 PKBC-2 2,993.07 1.638 1.021 0.617 37.67 1.98 PKBC-3 3,038.92 1.891 1.089 0.802 42.41 1.93 PKBC-4 1,709.26 0.699 0.319 0.380 54.42 2.11 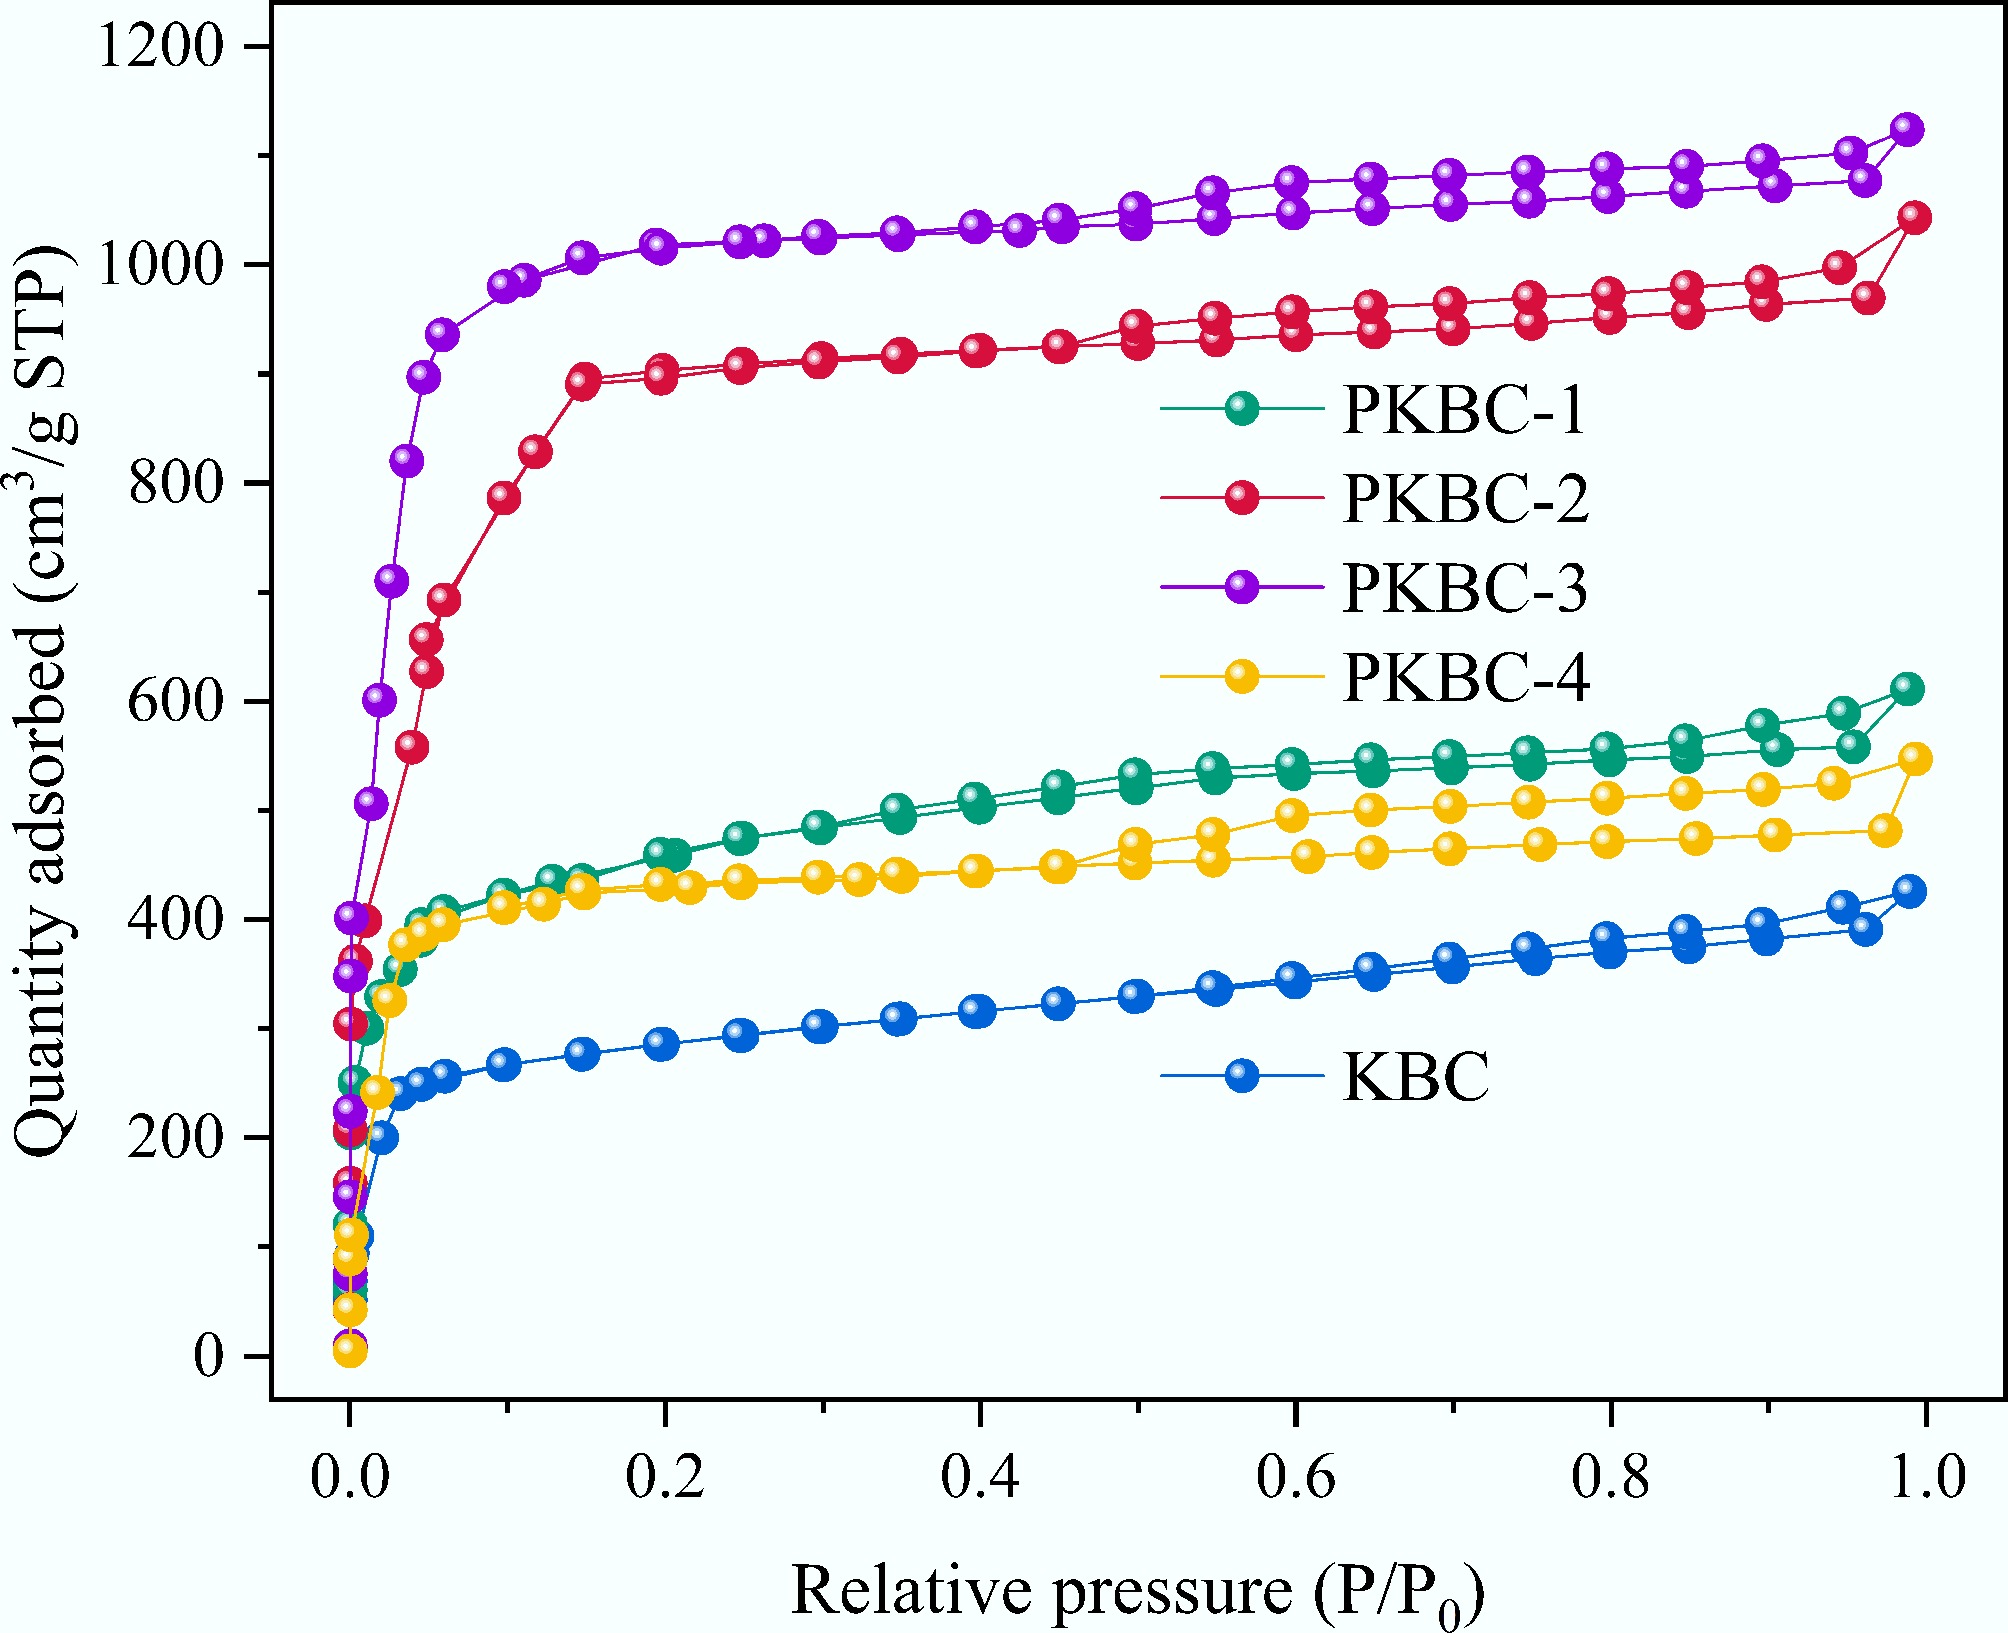
Figure 4.
Nitrogen adsorption and desorption isotherms for different samples.
The pore size distribution curves in Fig. 5 provide further insight into the evolution mechanism of the pore structure. The KBC samples that do not undergo H3PO4 treatment show a wide micropore distribution centered at 0.5–1.5 nm, reflecting the inherent micropores present in natural cellulose-derived carbon activated solely by KOH. As the ratio of the H3PO4 increases, the peak intensity in the region below 2 nm continuously intensifies, confirming the selective etching effect of phosphoric acid on cellulose microcrystals. When the ratio of H3PO4/biomass is 1:1, a distinct micropore peak appears at 0.52 nm due to the partial dissolution of hemicellulose and lignin, which improves the uniformity of the pores. Increasing the ratio to 2:1 resulted in the formation of double peaks at 0.35 nm (ultrafine pores) and 3.2 nm (mesoporous pores). This change is linked to the enhanced etching of cellulose microcrystals and the initial removal of lignin, which leads to small mesoporous voids. For the 3:1 sample, the mesoporous peak shifted further to 3.5 nm while maintaining the microporous peak at 0.35 nm. This shift occurred because the higher concentration of phosphoric acid dissolved more lignin, thereby expanding the mesoporous framework. However, at a ratio of 4:1, excessive acid corrosion caused structural degradation. As a result of the thinning of the pore walls, the micropore peaks widened to 0.50 nm. Additionally, due to the partial collapse and merging of adjacent pores during the KOH activation process, the mesopore peaks contract to 2.5 nm, which is consistent with the observed decrease in micropore volume to 0.32 cm3/g.
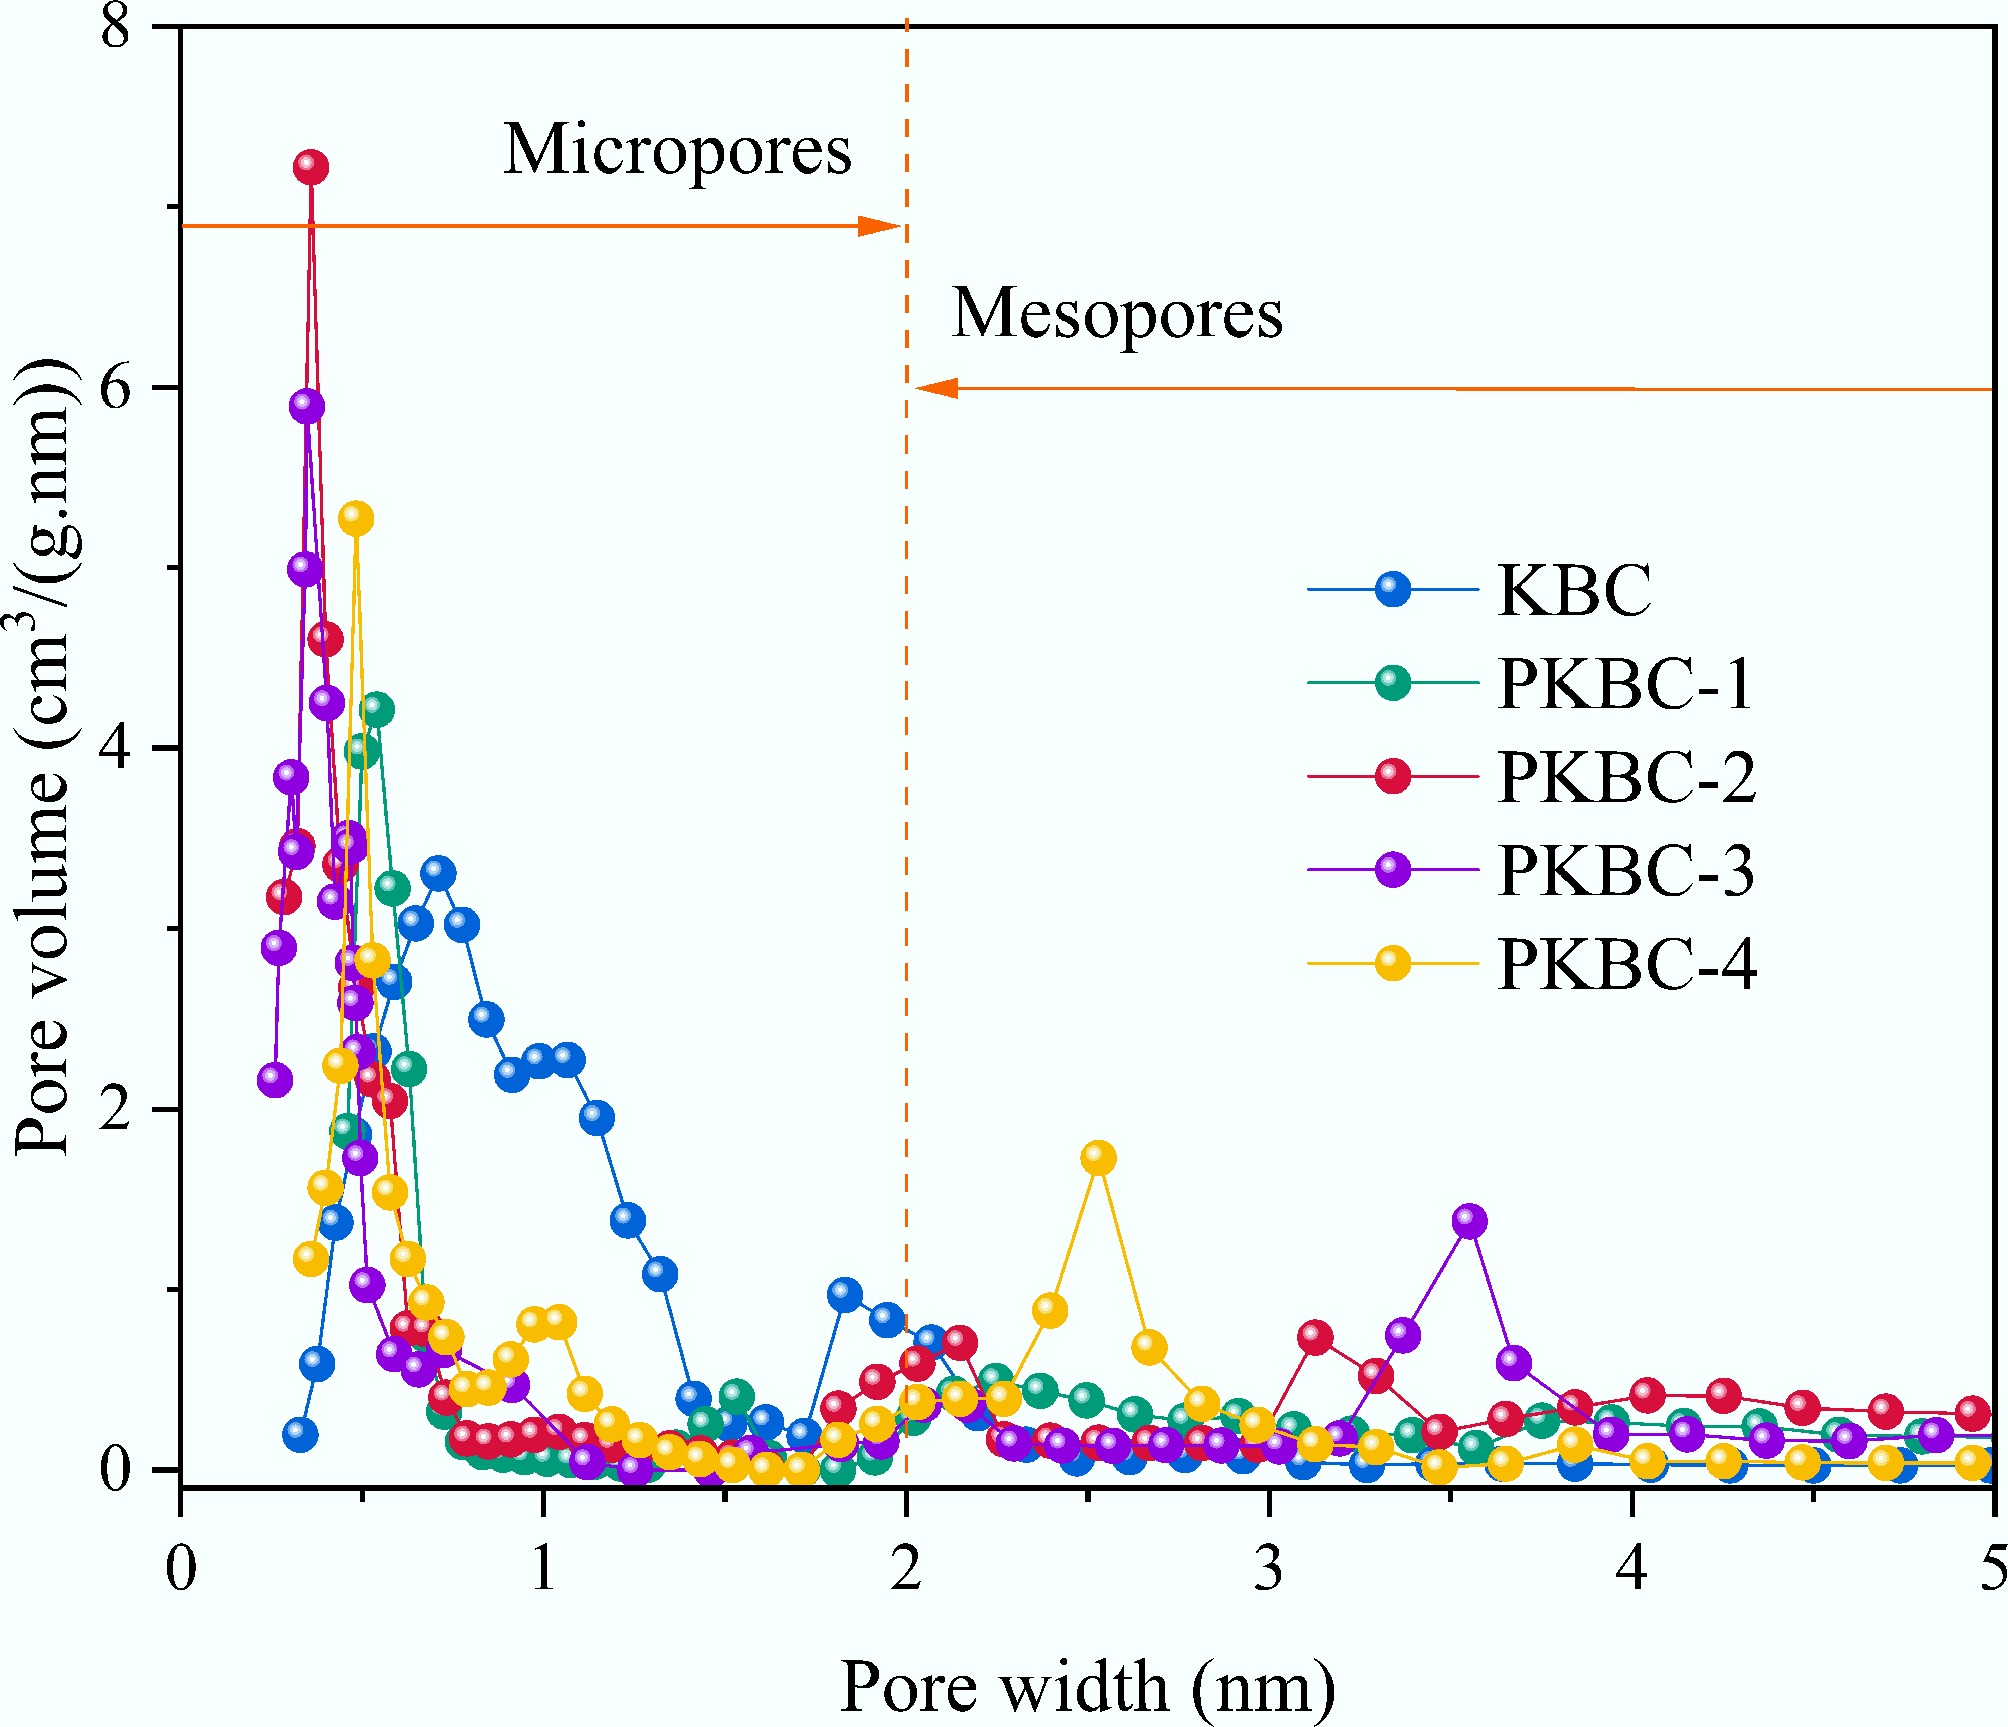
Figure 5.
Pore size distribution of different samples.
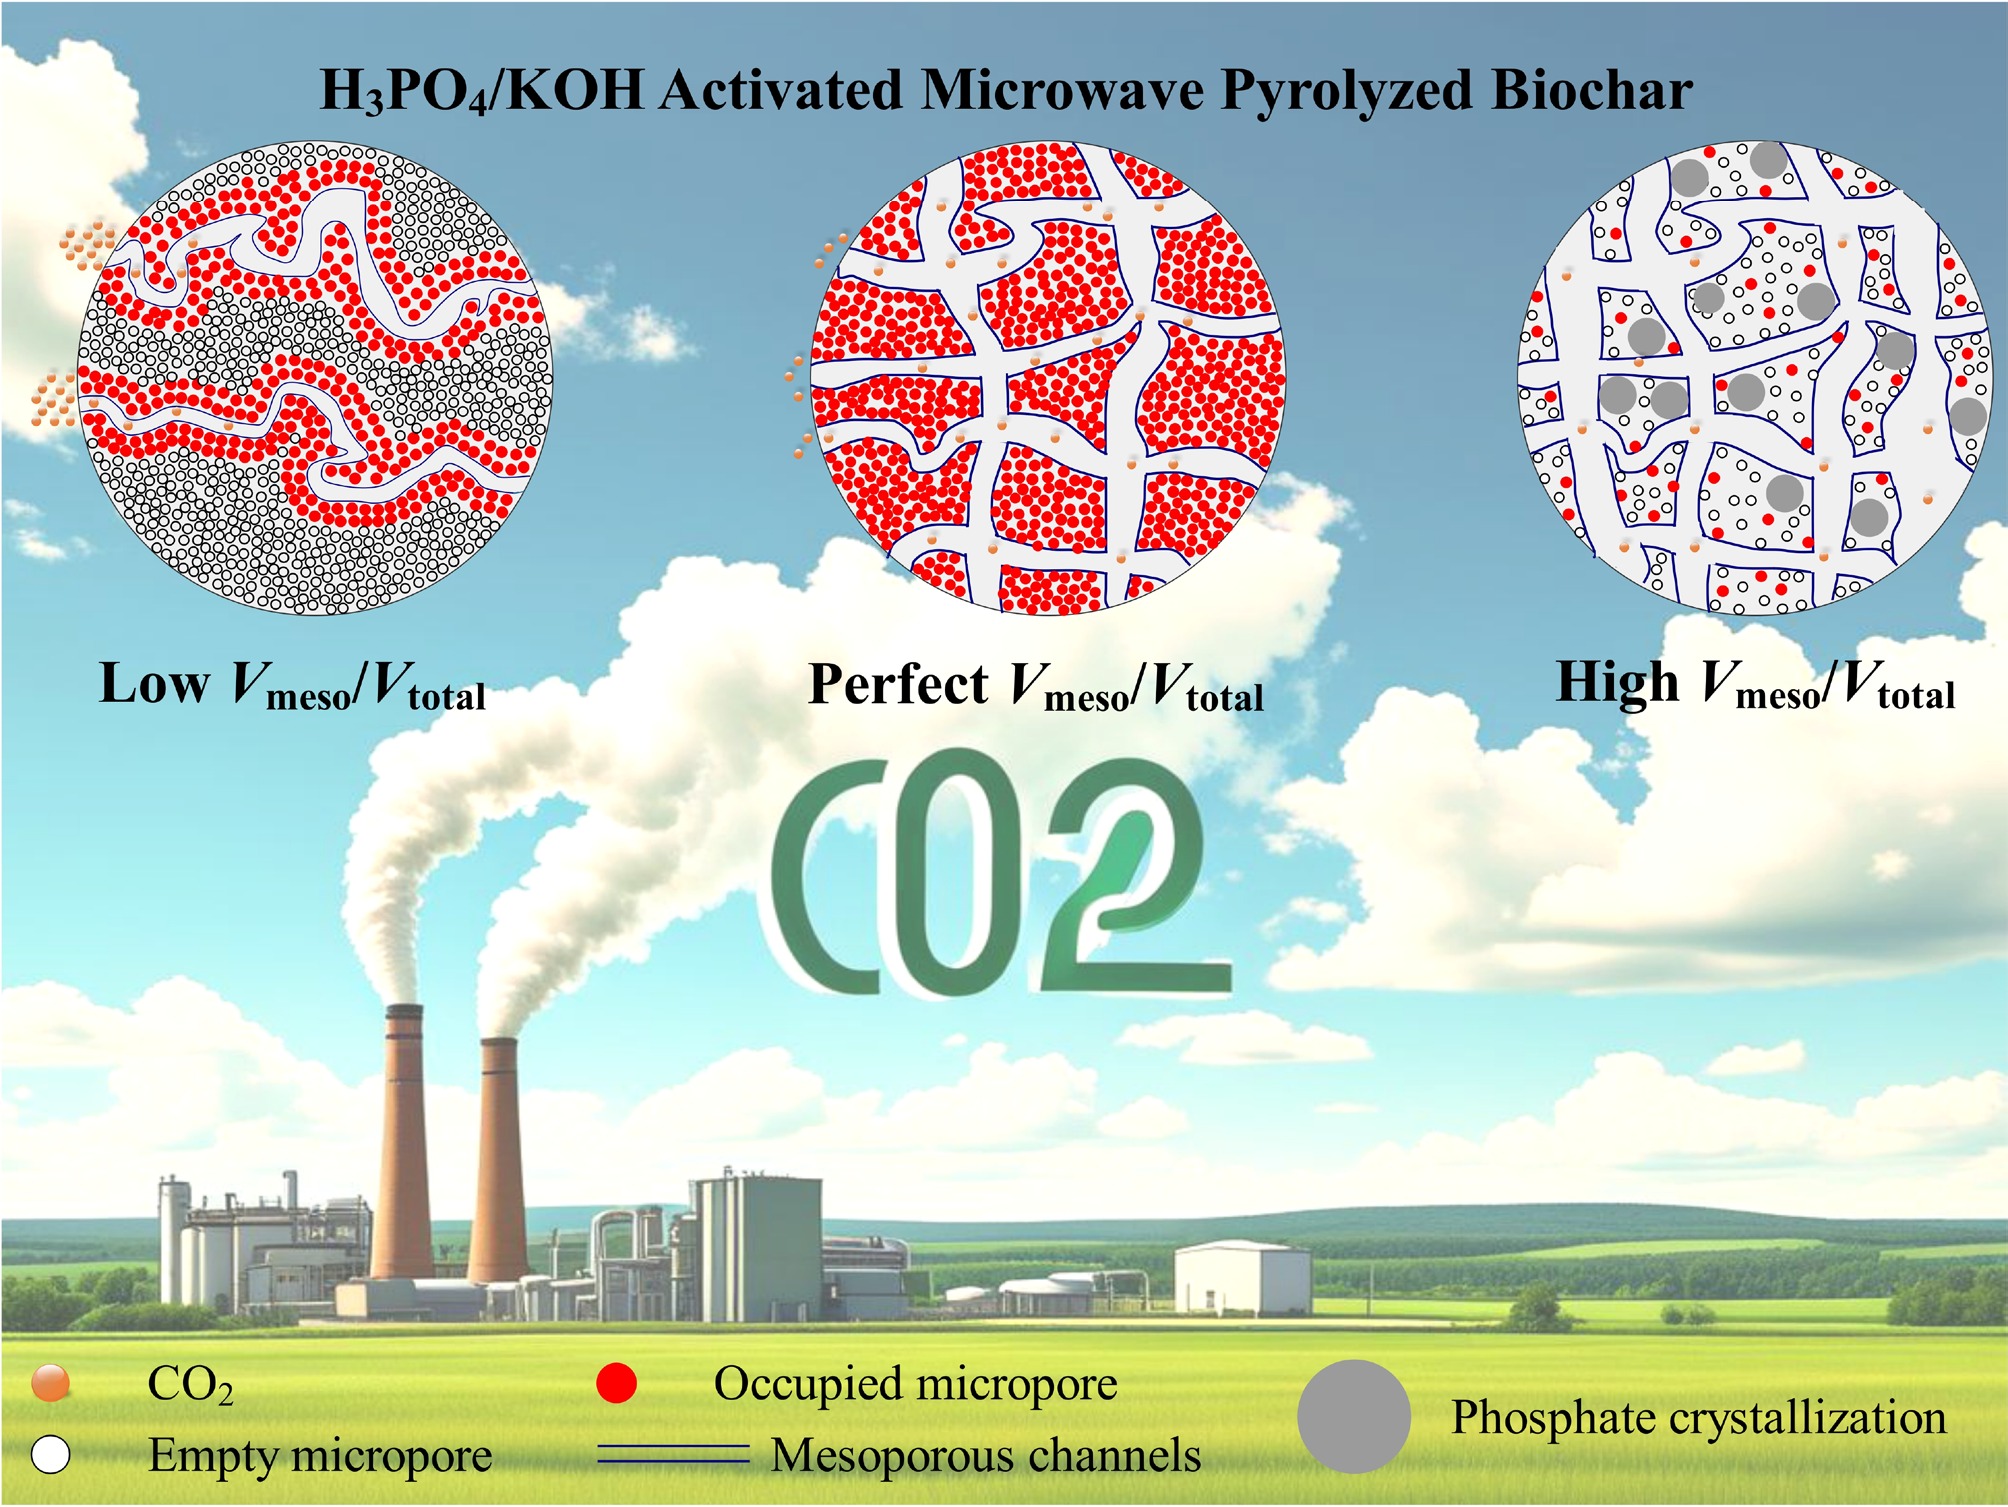
Figure 6 illustrates the mesopore proportions of different samples, revealing a dual-threshold pattern during the activation process. The results indicate that the mesopore proportion exceeds 30% at a phosphoric acid impregnation ratio of 1:1, indicating the initiation of hierarchical pore construction. In the range of 2:1 to 3:1 for the impregnation ratio, the mesopore proportion stabilizes near 40%, while the micropore volume remains at least 1 cm3/g. This suggests that phosphoric acid impregnation within this range effectively promotes mesopore formation without significantly sacrificing the micropore volume[33]. However, when the impregnation ratio reaches 4:1, the mesopore proportion sharply declines to 33.3% (with an absolute value of only 0.23 cm3/g), and there is a 52% reduction in micropore volume (down to 0.32 cm3/g). This decline is primarily due to excessive phosphoric acid leading to over-hydrolysis of the precursor, which results in the formation of unstable oligosaccharide phosphate esters that can fracture the carbon framework during microwave pyrolysis. The loosened framework undergoes structural reorganization during KOH activation, where some micropores merge into ineffective macropores. Additionally, residual phosphates block pores, reducing the effective specific surface area.
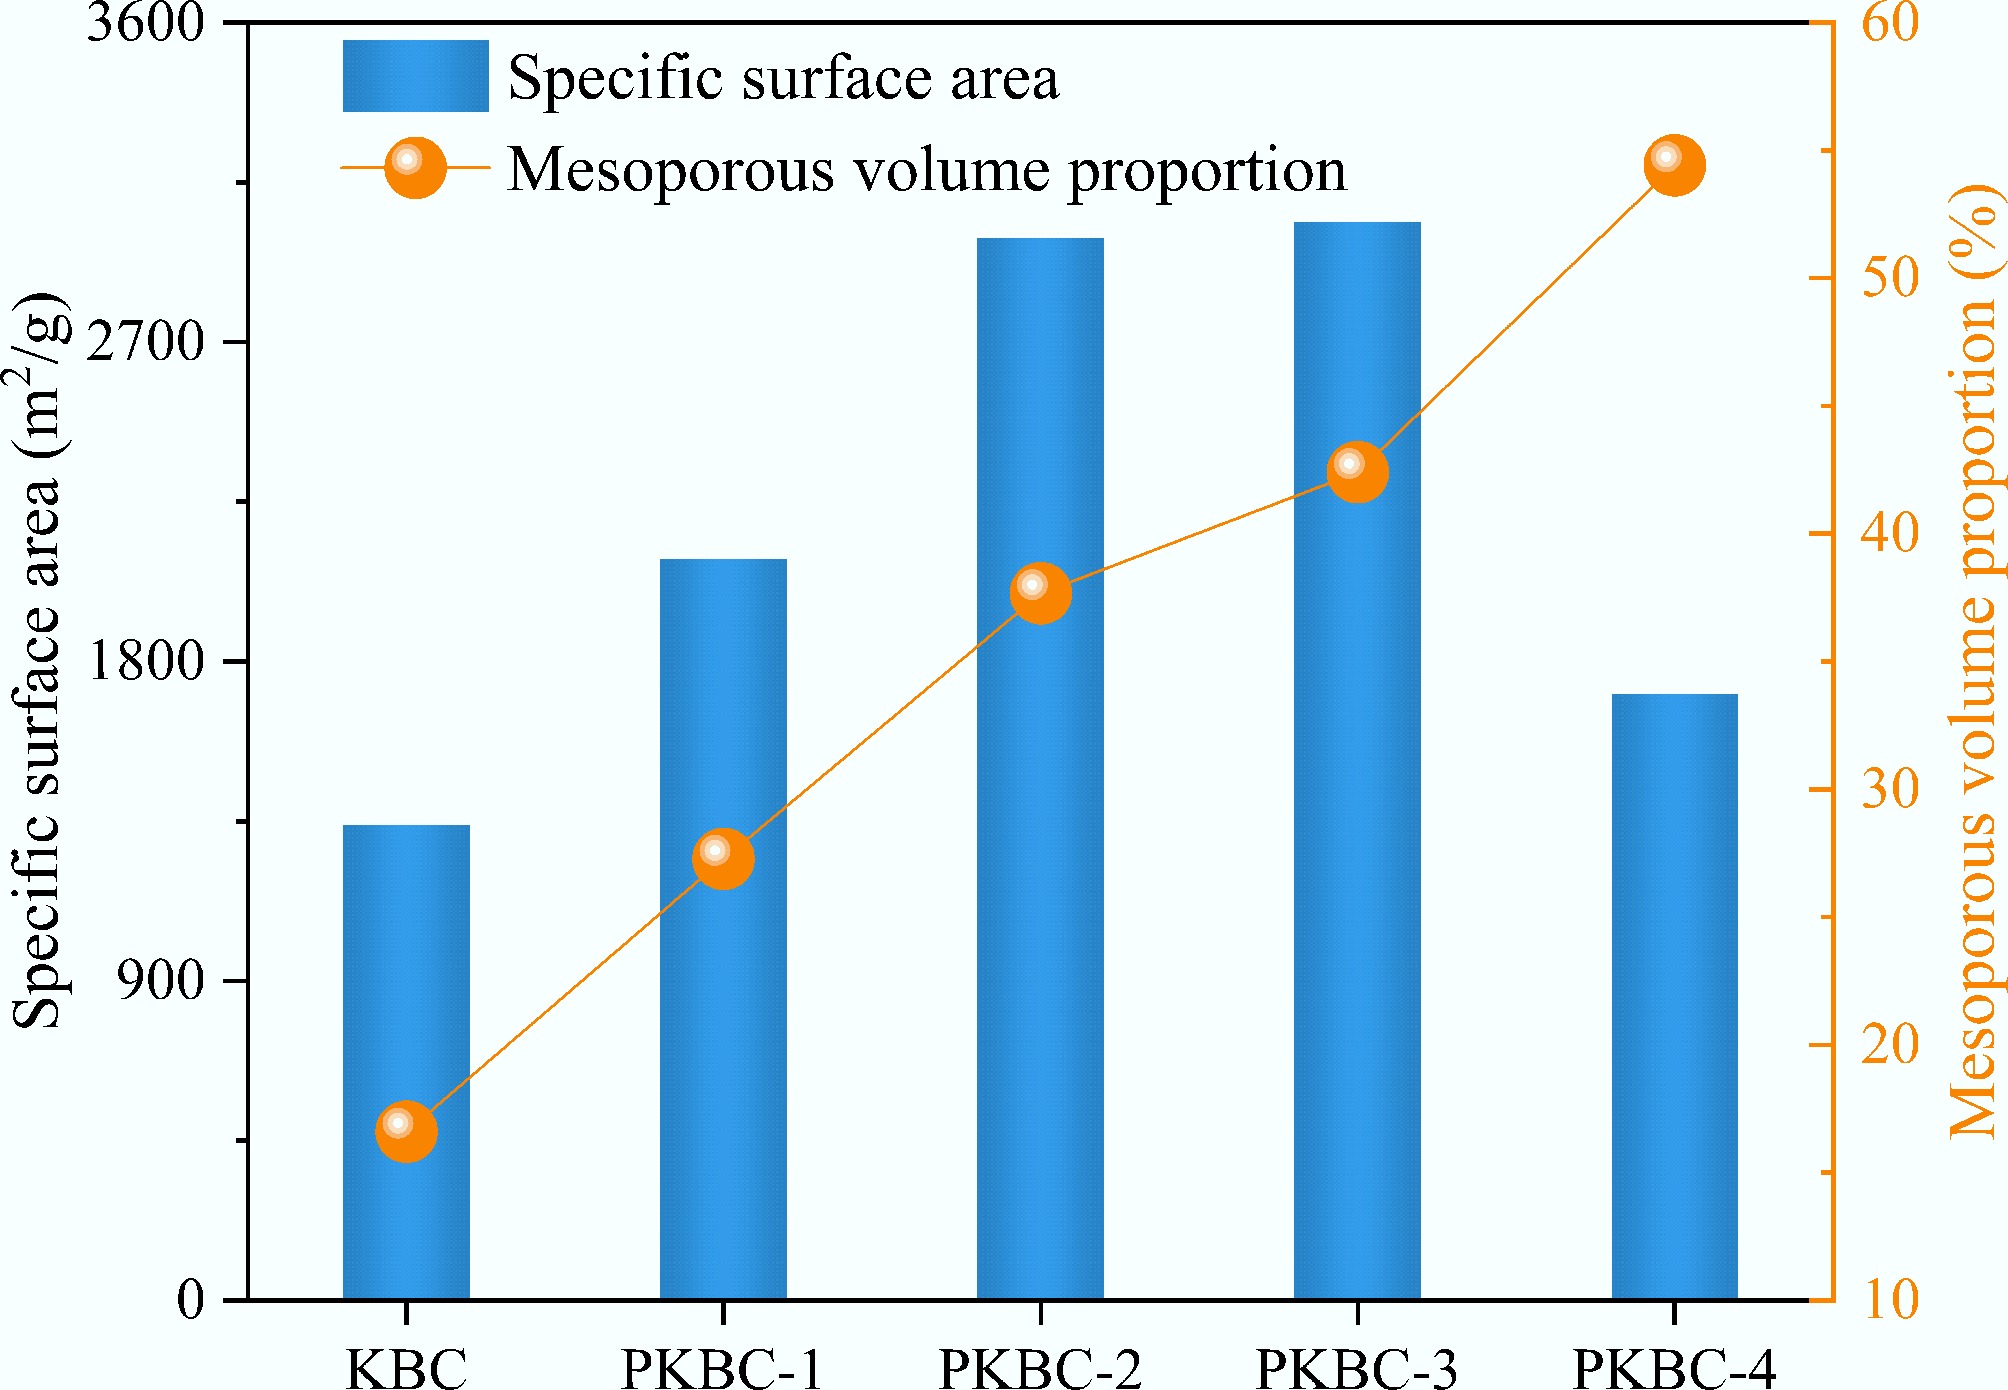
Figure 6.
Mesoporous volume proportion of different samples.
Comprehensive characterization data indicate that the regulation of the final pore structure through the phosphoric acid impregnation ratio follows a three-step synergistic pathway. During the H3PO4 pre-activation stage, H3PO4 selectively deconstructs the lignin-hemicellulose network through esterification reactions. Within the 2:1–3:1 range, H3PO4 forms molecular templates between cellulose microfibrils by creating polyphosphoric acid aggregates, preliminarily constructing a 2–4 nm mesoporous framework while protecting the carbon hexagonal ring basic structure from excessive oxidation. During the KOH deep activation stage, a 3:1 KOH solution reacts at 750 °C via 6KOH + C → 2K + 3H2 + 2K2CO3. This reaction precisely etches micropores (primarily within the 0.5–1.2 nm range) onto the mesoporous framework pre-constructed by phosphoric acid, avoiding disordered pore expansion characteristic of homogeneous activation. The optimized impregnation ratio of 2:1–3:1 forms a self-consistent hierarchical system where the 2–4 nm mesopores function as rapid diffusion channels, allowing adsorbates quick access to adsorption sites. Meanwhile, the 0.5–1 nm micropores facilitate efficient adsorbate capture by leveraging their strong adsorption potential wells.
CO2 adsorption performance
Adsorption isotherms
-
This study reveals the structure-performance relationship between CO2 adsorption capacity and the evolution of micropore structure induced by H3PO4 activation in corn straw-based porous biochars, based on systematic pore structure characterization and gas adsorption model analysis. Figure 7 shows the static adsorption isotherms for CO2 adsorption at 25 °C and 1 bar for different biochars. Langmuir model[34] as shown in Eq. (1), fitting results in Table 4 indicate that the maximum CO2 adsorption capacity qm initially increases, then decreases as the H3PO4 impregnation ratio increases. The capacity qm reaches 3.43 mmol/g at a 3:1 ratio, while PKBC-4, which has a 54.4% mesopore proportion, plunges to 1.13 mmol/g. This nonlinear variation highly correlates with micropore volume data in Table 3. Among all samples, PKBC-3 exhibits the highest micropore volume (1.10 cm3/g), whereas PKBC-4 suffers a 71% loss in micropore volume (0.32 cm3/g) compared to PKBC-3. This loss directly leads to a 67% reduction in adsorption capacity. Notably, while PKBC-3 possesses optimal total pore volume (1.90 cm3/g) and specific surface area (3,040 m2/g), the increase in its adsorption capacity versus PKBC-2 (micropore volume 1.00 cm3/g, adsorption capacity 3.34 mmol/g) is only 3%. This increase is significantly lower than the 10% rise in micropore volume. This implies that when the mesopore proportion exceeds a critical threshold of 42.1%, the synergistic effect of the pore structure begins to weaken.
$ q = \dfrac{{{q_{\text{m}}}{K_{\text{L}}}P}}{{1 + {K_{\text{L}}}P}} $ (1) where, q is the equilibrium adsorption capacity, mmol/g, qm is the maximum monolayer adsorption capacity, mmol/g, KL is the Langmuir adsorption equilibrium constant, /bar, and P is the pressure, bar.
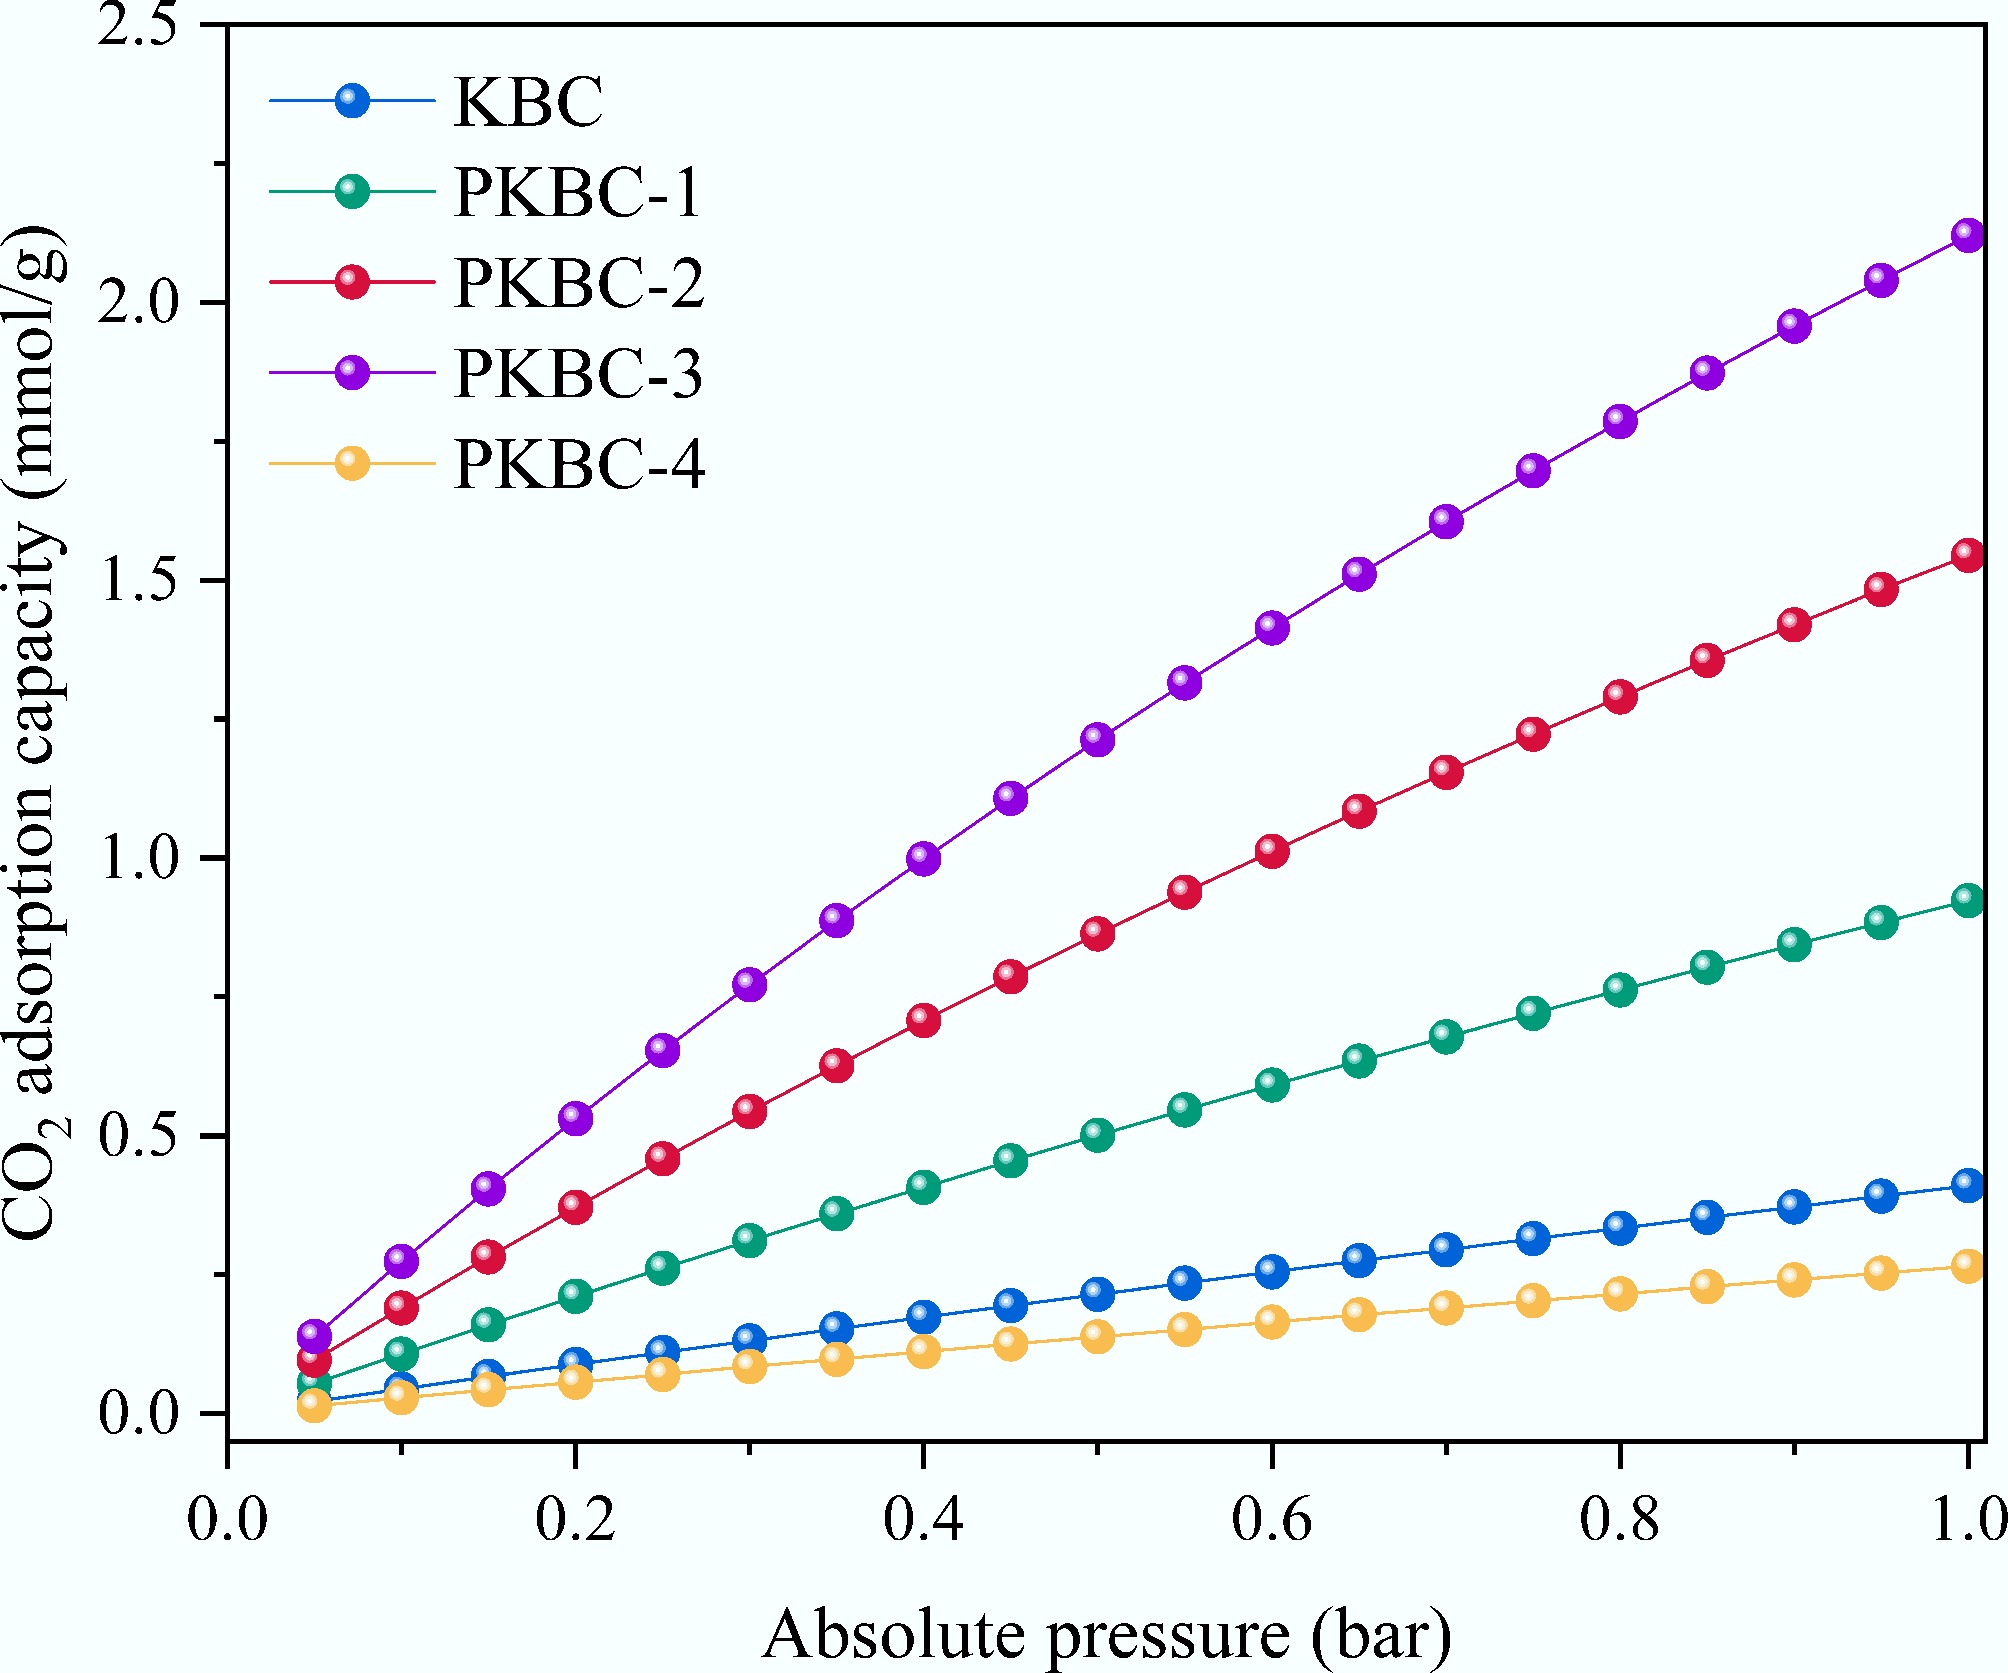
Figure 7.
CO2 adsorption isotherms of different samples at 1 bar and 25 °C.
Table 4. Isotherms parameters of different samples
Sample Langmuir parameters Freundich parameters qm
(mmol/g)KL
(/bar)R2 n KF
(mmol/(g·bar1/n))R2 KBC 1.4715 0.1018 0.9993 1.0568 0.4121 0.9976 PKBC-1 2.8623 0.1872 0.9998 1.1031 0.9314 0.9967 PKBC-2 3.3387 0.2677 0.9999 1.1448 1.5635 0.9936 PKBC-3 3.4341 0.3363 0.9929 1.1797 2.1513 0.9908 PKBC-4 1.1255 0.0929 0.9981 1.0523 0.2665 0.9927 Freundlich model[35] parameters, as shown in Eq. (2), support the proposed mechanism: all samples exhibit 1/n values close to 1 (1.05–1.18), indicating a relatively homogeneous surface energy distribution consistent with micropore-filling-dominated adsorption. However, PKBC-4 shows a contradictory combination of a usually high 1/n value (1.052) and a significantly lower KF value [0.266 mmol/(g·bar1/n)]. This discrepancy originates from heterogeneity in pore structure caused by excessive phosphoric acid, whereby residual phosphate ash selectively blocks 0.5–0.7 nm ultra-micropores, forcing CO2 molecules into weaker adsorption within wider mesopores (2–5 nm) or distorted micropores, manifesting as a cliff-like drop in the Freundlich constant KF. This structural deterioration is more evident in Langmuir constant KL variations: PKBC-3 achieves a KL of 0.336 /bar, indicating a strong affinity for CO2 molecules, while PKBC-4's KL (0.093 /bar) falls below even the non-phosphoric acid-treated KBC sample (0.102 /bar). This confirms that excessive mesopore development weakens binding energy at adsorption sites. Moreover, the micropore volume exhibits near-perfect linear correlation with Langmuir adsorption capacity (R2 = 0.998), whereas total pore volume correlation significantly deviates (R2 = 0.703), establishing that micropores are the decisive factor for CO2 adsorption capacity. The excellent fits of both Langmuir (homogeneous) and the Freundlich (heterogeneous) models reflect the dualistic pore structure of the biochar obtained in this study. Specifically, micropores provide uniform adsorption sites, while mesopores induce energetic heterogeneity.
$ q = {K_{\text{F}}}{P^{1/n}} $ (2) where, n is the heterogeneity index, KF is the Freundlich adsorption capacity constant, mmol/(g·bar1/n).
An analysis of adsorption efficiency per unit micropore volume reveals a paradoxical phenomenon: PKBC-2 achieves an absorption capacity of 3.27 mmol/cm3, while PKBC-3 shows a slight decrease to 3.15 mmol/cm3. In contrast, PKBC-4 exhibits an abnormal increase to 3.53 mmol/cm3. This anomaly reveals the inherent contradiction in pore structure optimization. In PKBC-4, the blockage of large micropores (> 0.8 nm) forces CO2 molecules into narrower pores (< 0.5 nm). As a result, although the adsorption density per unit pore volume increases, the absolute adsorption capacity collapses due to a drastically reduced effective adsorption volume. Conversely, PKBC-1 (mesopore proportion 27.2%) achieves an adsorption capacity of 4.4 mmol/g with a micropore volume of 0.65 cm3/g, yielding a much higher unit micropore adsorption capacity (9.02 mmol/cm3) compared to PKBC-2. This is attributed to a more concentrated micropore distribution in the 0.5–0.7 nm range. This size range creates superimposed potential wells that match the kinetic diameter of CO2 molecules (0.33 nm), thereby enhancing the adsorption affinity[36]. This also explains why the PKBC-1's KL (0.187 /bar) is 1.8 times greater than that of KBC (0.102 /bar).
This study integrated kinetic and thermodynamic parameters to establish a three-level regulation mechanism. The mechanism identifies that the micropore volume determines capacity, the micropore size tunes strength, and the mesopore proportion controls mass transfer. When the mesopore proportion is within the range of 30%–40%, a well-developed mesopore network accelerates CO2 transport to micropore active sites. However, exceeding the critical threshold of 42% for mesopore proportion disrupts the dynamic equilibrium between diffusion channels and adsorption sites. Although PKBC-4 has the largest mesopore volume (0.38 cm3/g), its kinetic adsorption capacity is only 1.13 mmol/g due to insufficient density of micropore active site and deteriorated pore connectivity, confirming the adsorption dead zone effect. Therefore, an H3PO4 impregnation ratio between 2:1 and 3:1 achieves synergy between maximizing micropore volume and optimizing mesopore network, providing theoretical foundations and quantitative criteria for the targeted design of biomass-derived adsorbents.
Breakthrough curves
-
Fixed-bed breakthrough experiments reveals a significant nonlinear dependence between the dynamic CO2 adsorption performance of corn straw-based porous biochar and the evolution of its mesoporous structure, as depicted in Fig. 8. At a H3PO4 impregnation ratio of 3:1, the breakthrough time tb (when outlet concentration reached 10% of inlet concentration) peaked at 10.34 min, representing a 253% extension compared to KBC, which had the lowest mesopore proportion. Conversely, PKBC-4, with a 54.4% mesopore proportion, recorded a tb of only 2.03 min. This phenomenon reveals the critical role of the mesoporous network, which demonstrates that as mesopore volume increased from 0.10 cm3/g in KBC to 0.80 cm3/g in PKBC-3, the length of the mass transfer zone on the breakthrough curve significantly shortened. This is reflected in the reduced difference between t90 (time when outlet concentration reached 90% of inlet concentration) and tb, which decreased from 4.30 min for KBC to 4.10 min for PKBC-3. This confirms that mesoporous channels effectively accelerate the diffusion of CO2 molecules towards the microporous active sites.
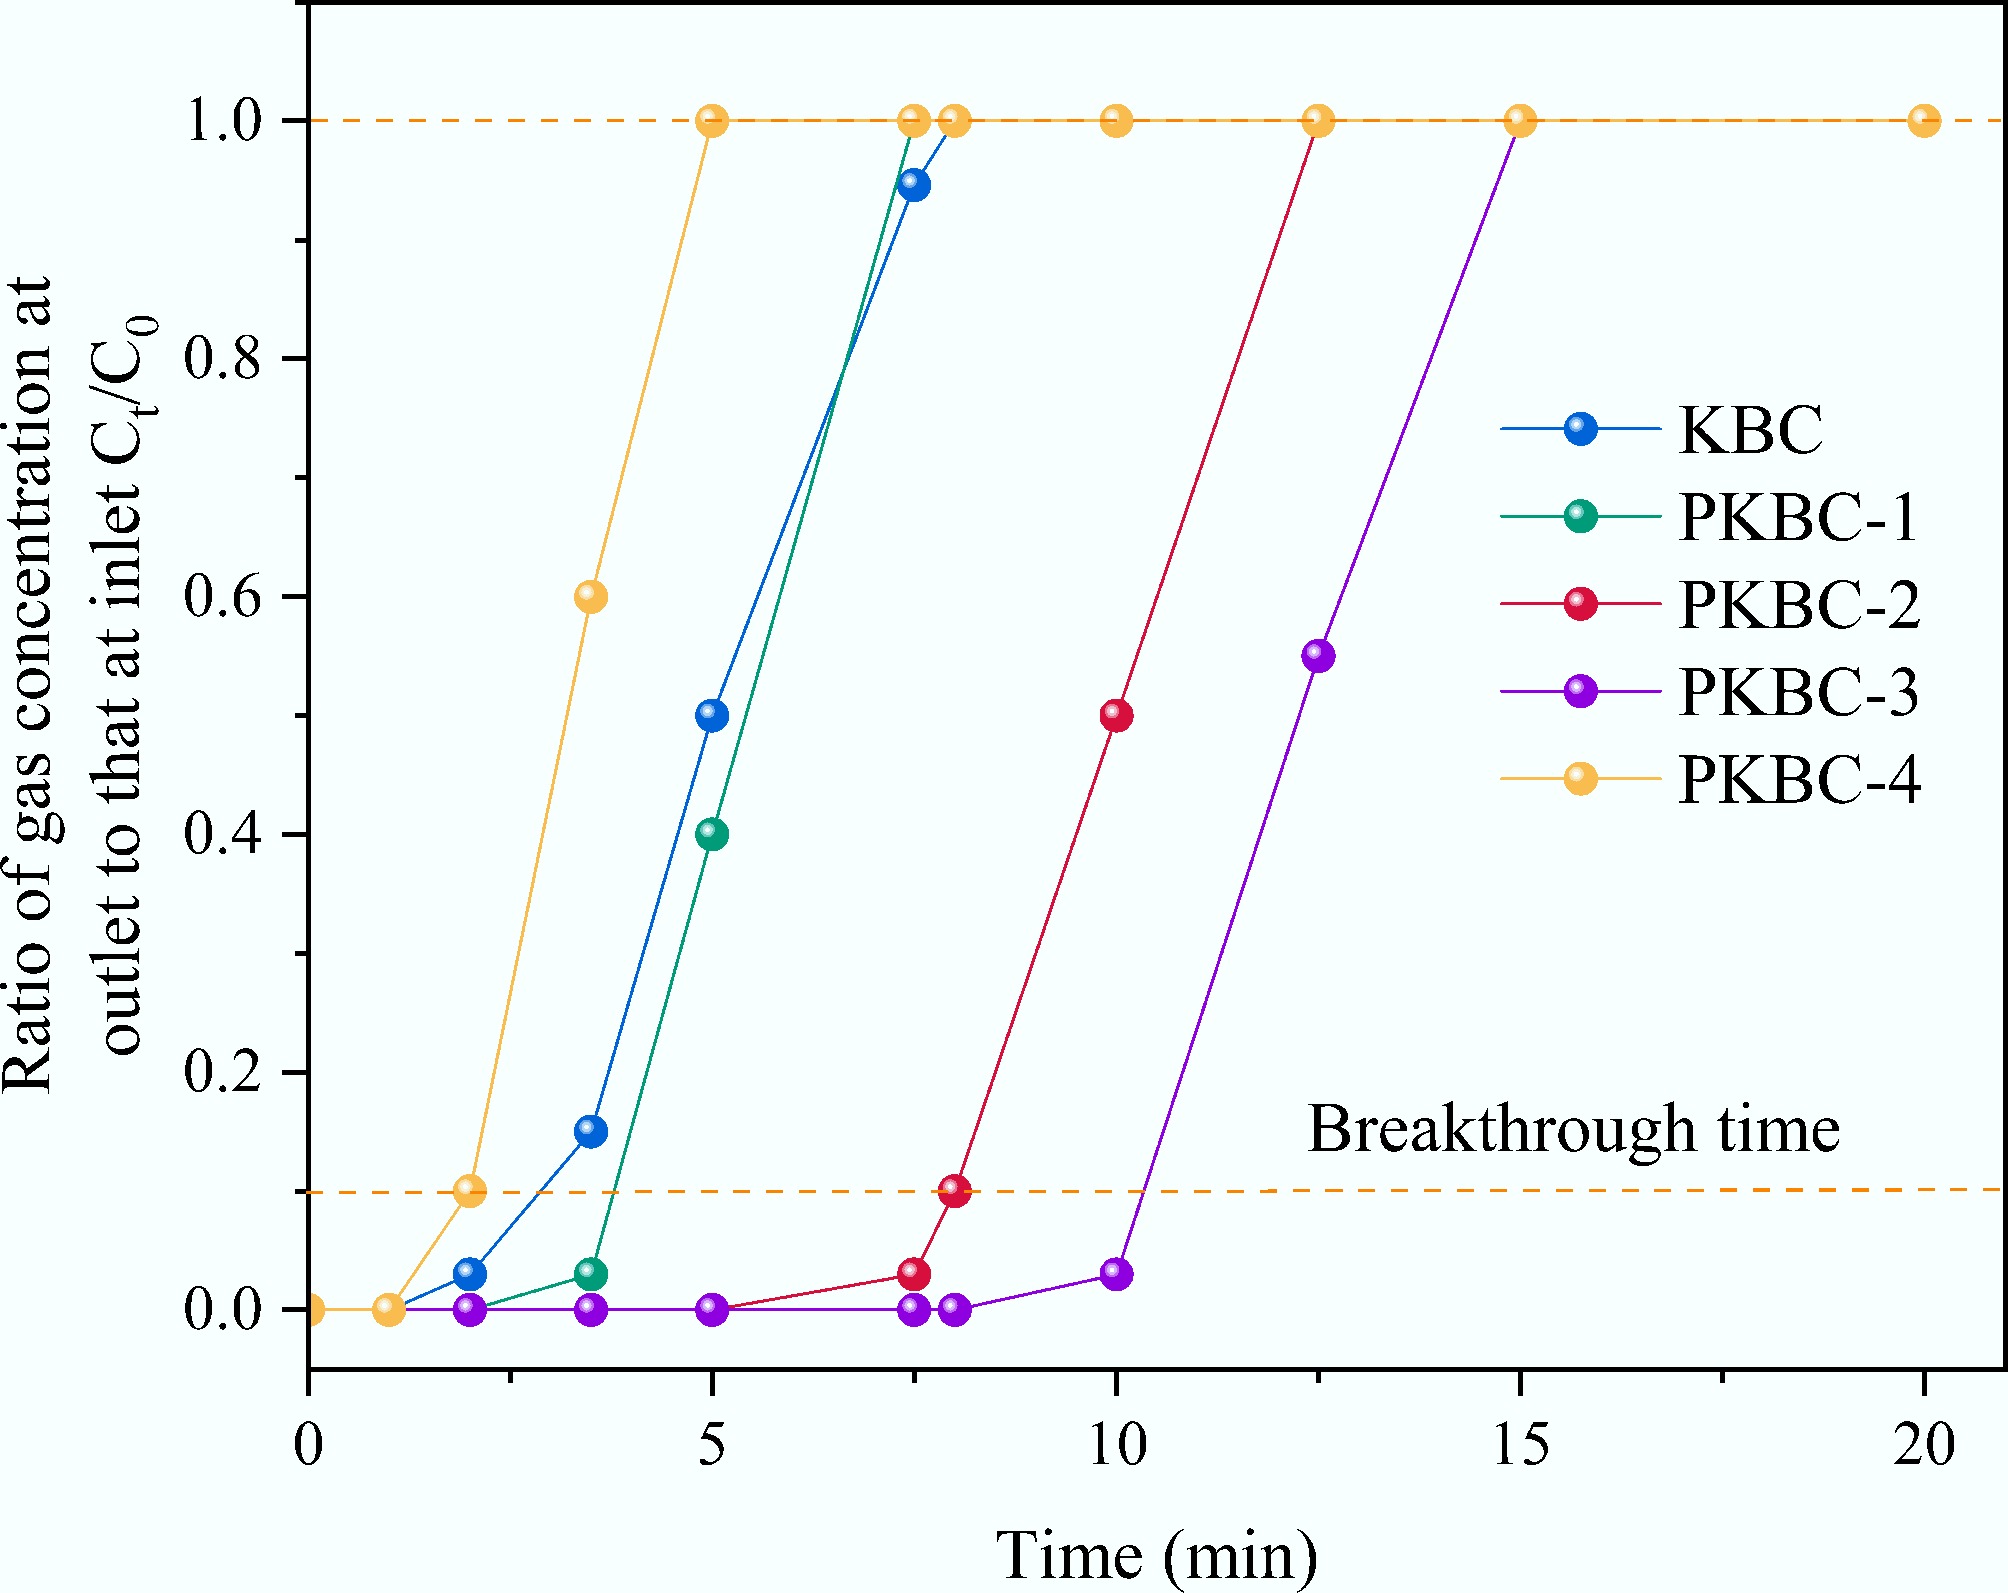
Figure 8.
The breakthrough curves of different samples at 25 °C.
Notably, although PKBC-1 (27.2% mesopore proportion) possesses a moderate microporous volume (0.65 cm3/g), its breakthrough curve displays an abnormally flat S-shape due to insufficient mesoporous volume (0.25 cm3/g), resulting in a dynamic adsorption rate merely 58% of that for PKBC-3. The kinetic adsorption capacity qdyn was calculated by real-time monitoring of outlet concentration changes using the material balance method[37] as shown in Eq. (3).
$ {q_{{\text{dyn}}}} = \dfrac{Q}{m}\int_0^{{t_{\text{e}}}} {({C_{{\text{t0}}}} - {C_{{\text{tf}}}}){\text{dt}}} $ (3) where, Q is the volumetric flow rate of CO2, mL/min, m is the mass of adsorbent, g, Ct0 is the concentration of CO2 in the outlet gas at time t0, %, Ctf is the concentration of CO2 in the outlet gas at time tf, %, te is the saturation time, min.
The calculation results revealed that the qdyn of PKBC-3 reached 3.02 mmol/g, approaching 88% of its Langmuir equilibrium adsorption capacity (3.43 mmol/g). In contrast, the mesopore-deficient KBC exhibited a much lower qdyn of only 1.18 mmol/g (80% of equilibrium capacity). This disparity can be attributed to the regulation of mass transfer efficiency by mesopores. When the mesopore proportion declined to below 30%, the diffusion of CO2 molecules through tortuous micropores was hindered, resulting in the dynamic adsorption capacity that was considerably lower than the theoretical equilibrium value. When the mesopore proportion increased to approximately 40%, the well-developed mesoporous network facilitated rapid access for gas molecules to deep micropores, elevating the qdyn/qm ratio to 85%. A detailed analysis of breakthrough curve morphology demonstrated that the mesopore proportion influenced dynamic adsorption through dual mechanisms. First, a positive correlation was observed between mesopore volume and the average adsorption rate (qdyn/te) (R2 = 0.967). PKBC-3 reached an average adsorption rate of 0.5345 mmol/(g·min), which exceeded that of KBC [0.4975 mmol/(g·min)]. Second, an optimal range existed for the relationship between mesopore proportion and breakthrough curve steepness [defined as (t90 − tb)/tb]. PKBC-2 and PKBC-3 exhibited values of 0.50 and 0.45, respectively, while KBC showed a high value of 1.47. This steepness effect reversed in PKBC-4. Despite possessing the highest mesopore proportion (54.4%), the collapse of microporous volume (0.32 cm3/g) resulted in a small tb-t90 difference (2.59 min). This indicates inefficient mass transfer and rapid breakthrough due to a severe insufficiency of adsorption sites. Its qdyn was only 1.03 mmol/g (91.3% of equilibrium capacity), confirming that rapid mass transfer without sufficient adsorption sites is not practically valuable. By integrating static and dynamic adsorption data, the mesoporous structure exhibited a bidirectional regulation mechanism. When the mesopore proportion was below 35%, limited diffusion channels caused adsorption kinetics to become the performance bottleneck, resulting in flat breakthrough curves and low tb values. Conversely, when the mesopore proportion exceeded 50%, the loss of microporous active sites shifted adsorption capacity to the dominant limiting factor, as faster mass transfer could not compensate for the reduced adsorption capacity. Within the narrow window around 40% mesopore proportion, the material concurrently achieved both maximum adsorption capacity (3.43 mmol/g) and optimal mass transfer efficiency (tb = 10.34 min), resulting in breakthrough curves characterized by a steep front and a long plateau. This finding offers a key design criterion for biomass-based CO2 adsorbents in engineering applications. Precisely constructing hierarchical pore structures with approximately 40% mesopore proportion by regulating the H3PO4 impregnation ratio can synergistically overcome the traditional trade-off constraints between adsorption capacity and kinetic rate.
Adsorption kinetics
-
Figure 9 presents the CO2 adsorption kinetic curves for various samples at 25 °C. The analysis utilized the Pseudo-first order, Pseudo-second order, and Avrami models as shown in Eq. (4)−Eq. (6)[38−40], with the fitting results summarized in Tables 5−7. Quasi-equilibrium kinetic studies revealed the regulatory mechanism of mesoporous structure on CO2 diffusion energy barriers and its structure-activity relationship with the adsorption rate. Avrami model fitting indicated that PKBC-3 had an adsorption rate constant kA of 0.491 /min, representing a 180% increase compared to mesopore-deficient KBC (0.175 /min). The enhancement observed is directly related to PKBC-3, which has the highest mesopore volume (0.80 cm3/g) and a mesopore proportion (42.1%) among all samples. Notably, apparent activation energies derived from the Arrhenius equation reveal a significant trend. PKBC-3 displayed a low activation energy of 8.29 kJ/mol, while KBC, with only 27.2% mesopore proportion, reached 18.73 kJ/mol. This energy difference originated from the mass transfer bridge function of the mesoporous network. As the mesopore volume increased from 0.10 cm3/g in KBC to 0.80 cm3/g in PKBC-3, the diffusion path energy barrier for CO2 molecules traveling toward microporous active sites was substantially reduced. Consequently, the adsorption half-life of PKBC-3 at 298 K shortened to 1.41 min, which is merely 36% of that for KBC (3.95 min). The evolution of kinetic model applicability further corroborated this mechanism. When the mesopore proportion was below 30% (KBC and PKBC-1), the superiority of the pseudo-first-order model (R2 > 0.99) indicated that adsorption was controlled by single-phase diffusion. The high activation energies (18.73 kJ/mol for KBC, 15.54 kJ/mol for PKBC-1) reflected strong diffusion resistance caused by tortuous micropore pathways. In contrast, when mesopore proportion rose to approximately 40% (PKBC-2 and PKBC-3), the Avrami model showed an optimal fit (R2 > 0.99) with parameter value n increasing to 1.66–1.84, confirming the adsorption process into a cooperative mechanism involving rapid mesopore diffusion and micropore filling. Correspondingly, the activation energy decreased below 10 kJ/mol (9.77 kJ/mol for PKBC-2, 8.29 kJ/mol for PKBC-3). Notably, although PKBC-4 possessed the highest mesopore proportion (54.4%), its activation energy rebounded to 14.67 kJ/mol due to the collapsed microporous structure (Vmicro = 0.32 cm3/g). Residual phosphate-induced pore blockage forced CO2 molecules to navigate disordered mesopore labyrinths, paradoxically increasing the diffusion energy barrier[41].
$ q = {q_{\text{e}}}(1 - {e^{ - {k_1}t}}) $ (4) $ q = \dfrac{{{k_2}q_{\text{e}}^{\text{2}}t}}{{1 + {k_{\text{2}}}{q_{\text{e}}}t}} $ (5) $ q = {q_{\text{e}}}(1 - {e^{ - {{({k_{\text{A}}}t)}^n}}}) $ (6) where, qe is the theoretical equilibrium adsorption capacity, mmol/g, k1 is the Pseudo-first-order rate constant, 1/min, k2 is the Pseudo-second-order rate constant, g/(mmol·min), kA is the Avrami rate constant, 1/min, n is the Avrami index.
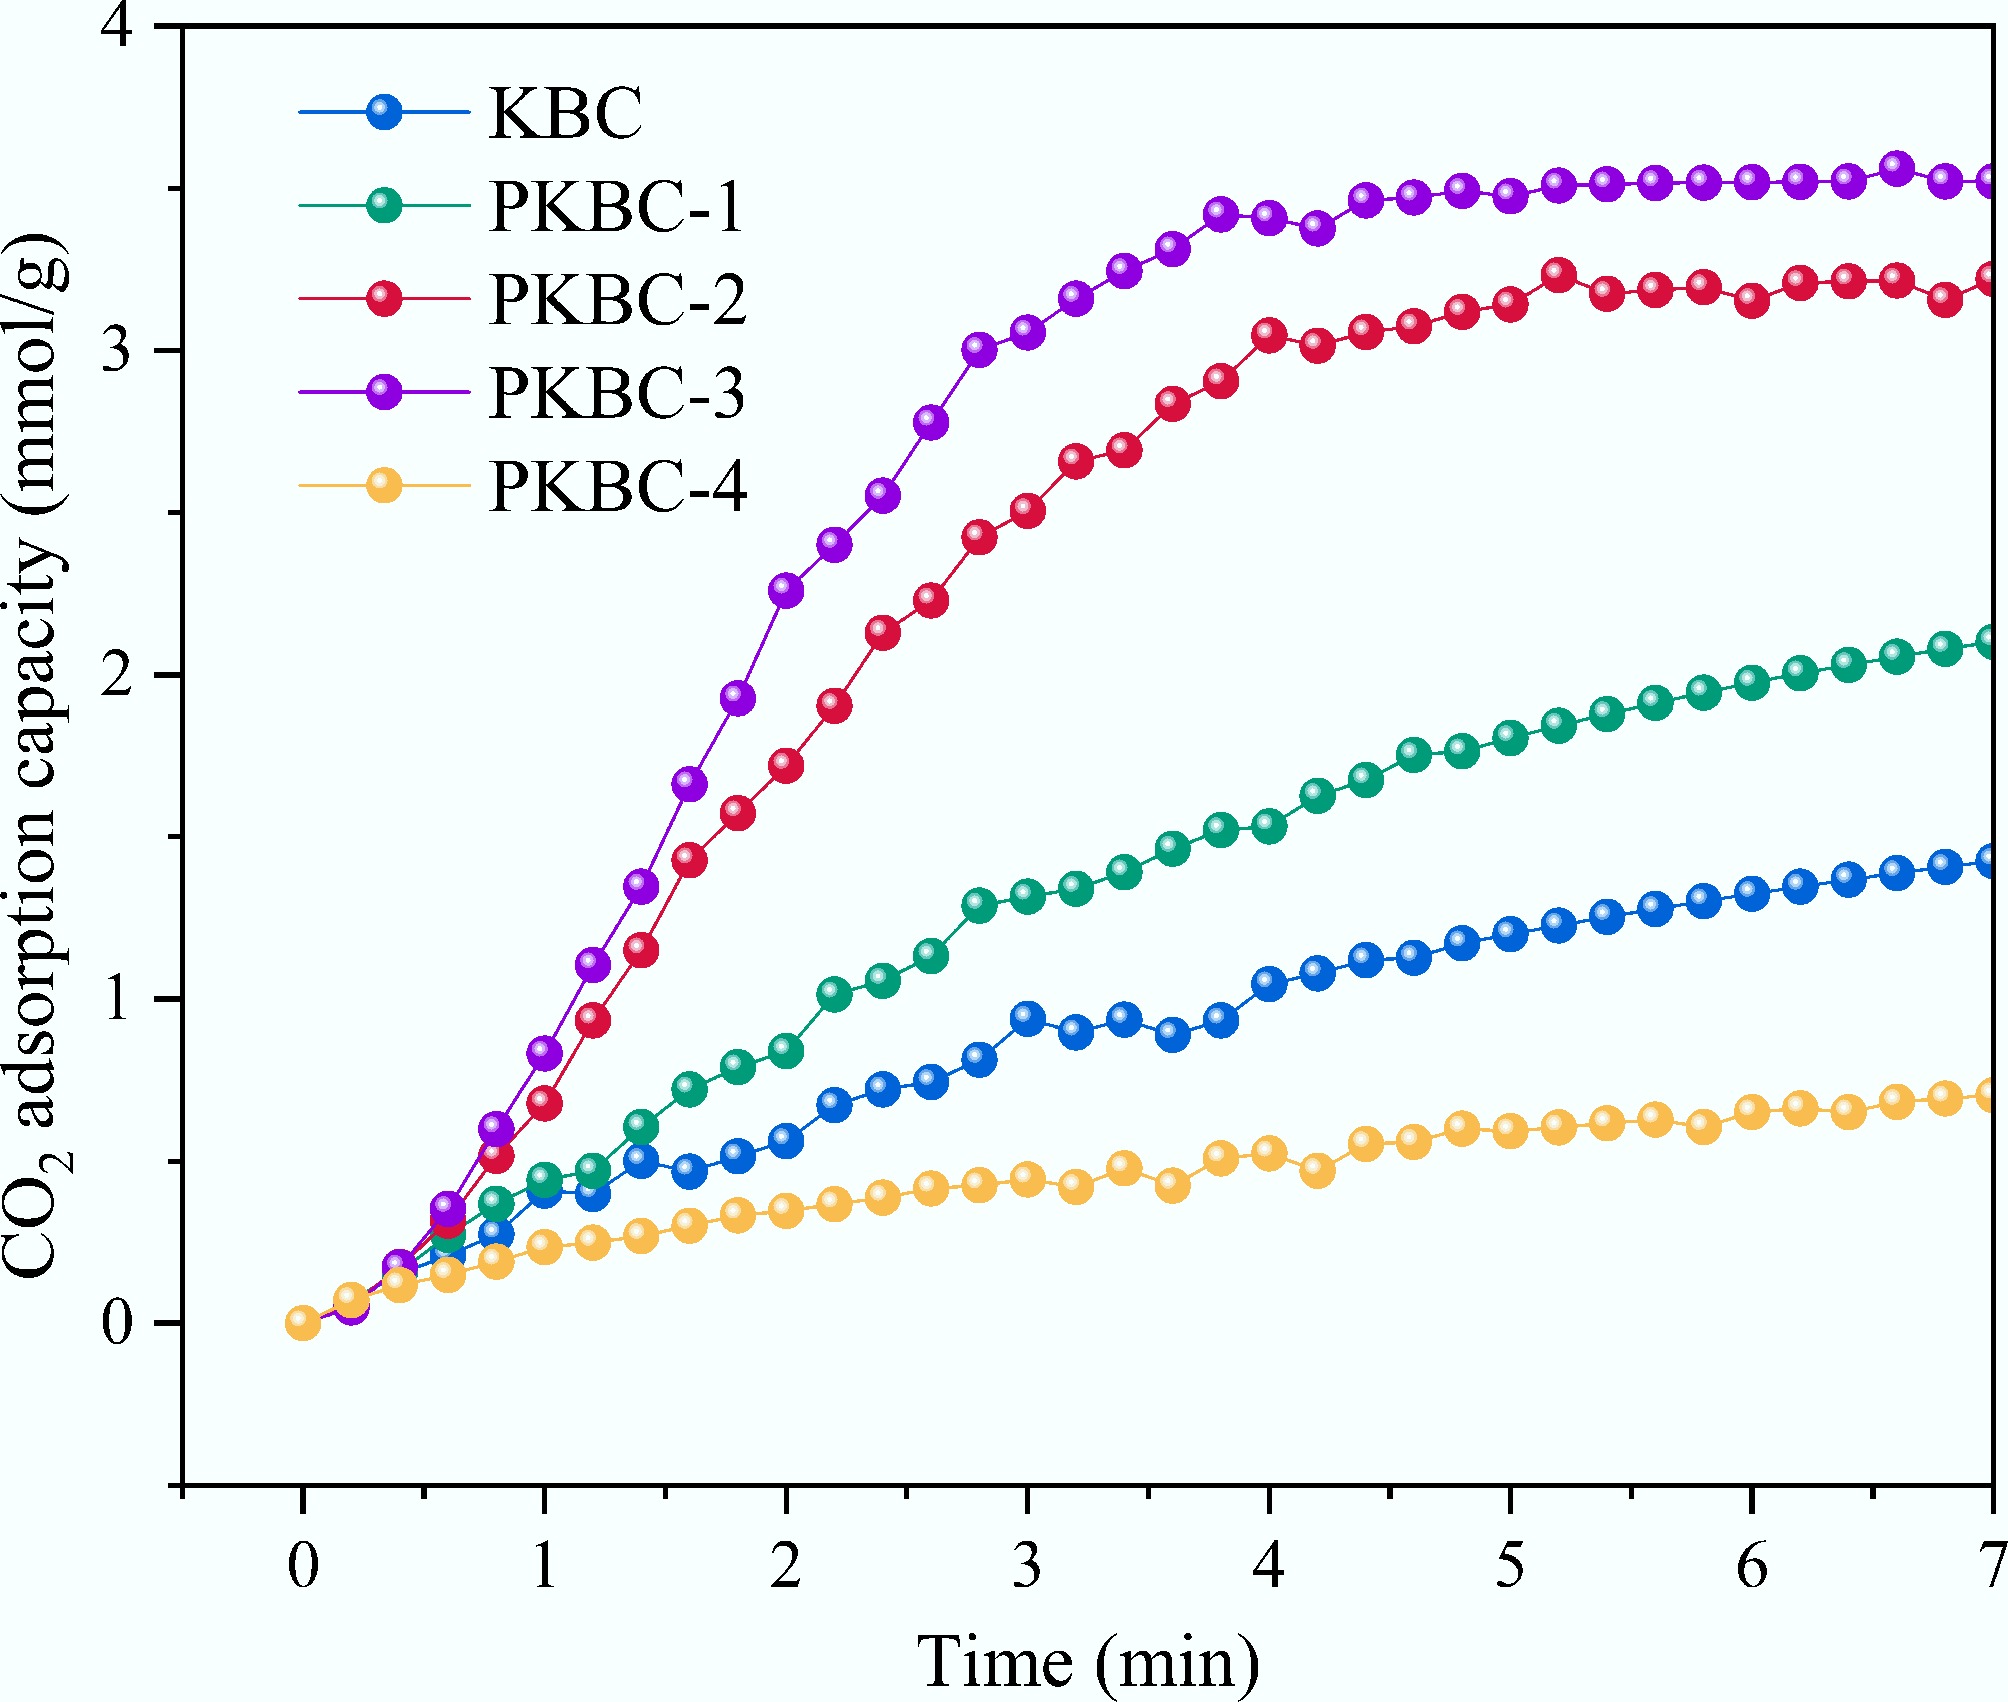
Figure 9.
Adsorption kinetics curves for CO2 adsorption of different samples at 25 °C.
Table 5. Kinetic parameters of CO2 adsorption of different samples fitted by Pseudo-first order model
Sample qe (mmol/g) k1 (1/min) R2 KBC 1.6615 0.1904 0.9946 PKBC-1 2.1262 0.1837 0.9957 PKBC-2 4.2337 0.3188 0.9709 PKBC-3 4.6811 0.3901 0.9581 PKBC-4 1.1883 0.2812 0.9809 Table 6. Kinetic parameters of CO2 adsorption of different samples fitted by Pseudo-second order model
Sample qe (mmol/g) k2 [g/(mmol·min)] R2 KBC 5.3659 0.0172 0.9945 PKBC-1 8.5141 0.0102 0.9946 PKBC-2 11.6545 0.0169 0.9620 PKBC-3 11.7385 0.0219 0.9440 PKBC-4 1.7005 0.0811 0.9856 Table 7. Kinetic parameters of CO2 adsorption of different samples fitted by Avrami model
Sample qe (mmol/g) kA (1/min) n R2 KBC 2.1881 0.1755 0.9725 0.9946 PKBC-1 2.6693 0.2713 1.2194 0.9986 PKBC-2 3.7394 0.4331 1.6640 0.9991 PKBC-3 4.4478 0.4912 1.8423 0.9995 PKBC-4 1.6798 0.0426 0.6701 0.9909 The correlation analysis of static and dynamic adsorption data confirmed the central role of mesopores. The average adsorption rate of PKBC-3 in breakthrough experiments [0.776 mmol/(g·min)] was 5.7 times higher than that of KBC [0.136 mmol/(g·min)]. This finding aligns closely with their activation energy difference (ΔEa = 10.44 kJ/mol). According to transition state theory, a 10 kJ/mol reduction in activation energy can increase reaction rates by approximately 50-fold at 298 K. Particularly, under quasi-equilibrium kinetics at 25 °C, PKBC-3 reached 90% of its equilibrium adsorption capacity in just 4.7 min, while Group A required 12.3 min, proving that materials with lower activation energy can better utilize thermal energy to overcome diffusion resistance. By integrating Vmeso, activation energy (Ea), and Avrami rate constant (kA), a mesopore proportion threshold of approximately 40% minimized the diffusion energy barrier. When the mesopore proportion was below 30%, Ea decreased linearly with increasing mesopores. When the mesopore proportion exceeded 50%, adsorption site scarcity due to the loss of micropore paradoxically elevated the effective diffusion barrier (Ea for PKBC-4 was 77% higher than PKBC-3). Only within the optimal mesopore proportion range around 40% could the material achieve both maximum microporous volume (1.10 cm3/g) and minimum activation energy (8.29 kJ/mol). This synergy enabled CO2 adsorption with both high capacity and rapid kinetics, providing quantitative theoretical support for energy barrier engineering design in biomass-based adsorbents.
CO2 adsorption mechanism
-
To contextualize the properties of PKBC-3, it was benchmarked against recent high-performance biochars from representative studies, as shown in Table 8. The specific surface area of PKBC-3 significantly surpasses that of other biochars, and its CO2 adsorption capacity is also highly competitive. This performance is a result of the unique microwave-assisted H3PO4/KOH dual activation, which synergistically maximizes micropore volume while maintaining optimal mesopore connectivity.
Table 8. SSAs and CO2 adsorption capacities of biochars
Feedstocks Conditions SSA (m2/g) Adsorption capacity (mmol/g) Ref. Corn straw KOH : biochar = 2:1, tube furnace, 700 °C, 60 min 1,631.77 3.06 at 25 °C [42] Corn straw KOH : biochar = 0.1:1, biomass gasifier, 450 °C, 120 min 365.11 2.88 [43] Corn straw TEPA, muffle furnace, 700 °C, 120 min 423 2.38 at 60 °C [44] Pine KOH : biochar = 2:1, tube furnace, 800 °C, 60 min 1,709.04 3.79 at 25 °C [42] Sugarcane bagasse TEPA, muffle furnace, 700 °C, 120 min 352 2.22 at 60 °C [44] Miscanthus TEPA, muffle furnace, 700 °C, 120 min 532 2.89 at 60 °C [44] Switchgrass TEPA, muffle furnace, 700 °C, 120 min 520 2.51 at 60 °C [44] Rambutan peel Tube furnace, 900 °C, 90 min 569.64 1.56 at 30 °C [45] Rice husk KOH : biochar = 1:1, 750 °C 1439 3.51 at 25 °C [46] Blue algal KOH : biochar = 0.5:1, tube furnace, 800 °C, 120 min 1,018.55 2.76 at 25 °C [47] Poplar wood chip K2C2O4, 800 °C, 120 min 1,418 3.82 at 25 °C [48] Corn straw H3PO4 + KOH, 750 °C, 60 min 3,038.92 3.43 at 25 °C This study The pore structures and adsorption performance data from five corn straw-based biochars uncovered a bidirectional regulatory mechanism of the mesopore proportion ratio (Vmeso/Vtotal) and its impact on CO2 adsorption capacity and kinetics. Figure 10 illustrates the maximum adsorption capacity, average adsorption rate, and activation energy for CO2 adsorption across different biochars. When the mesopore proportion ratio falls below 30%, the materials retain a high micropore volume (0.50–0.65 cm3/g) and adsorption capacity. However, their restricted mesopore network (Vmeso = 0.10–0.25 cm3/g) results in convoluted diffusion pathways for CO2 molecules trying to access micropore sites. This manifests as high activation energy (15.54–18.73 kJ/mol) and low average adsorption rate [0.50–0.51 mmol/(g·min)]. At this stage, mass transfer resistance becomes the primary obstacle to adsorption kinetics, which has been evidenced by a significantly prolonged t90 − tb value of 4.30 min for KBC in breakthrough curves, confirming that CO2 migration within the micropores must overcome multiple energy barriers.
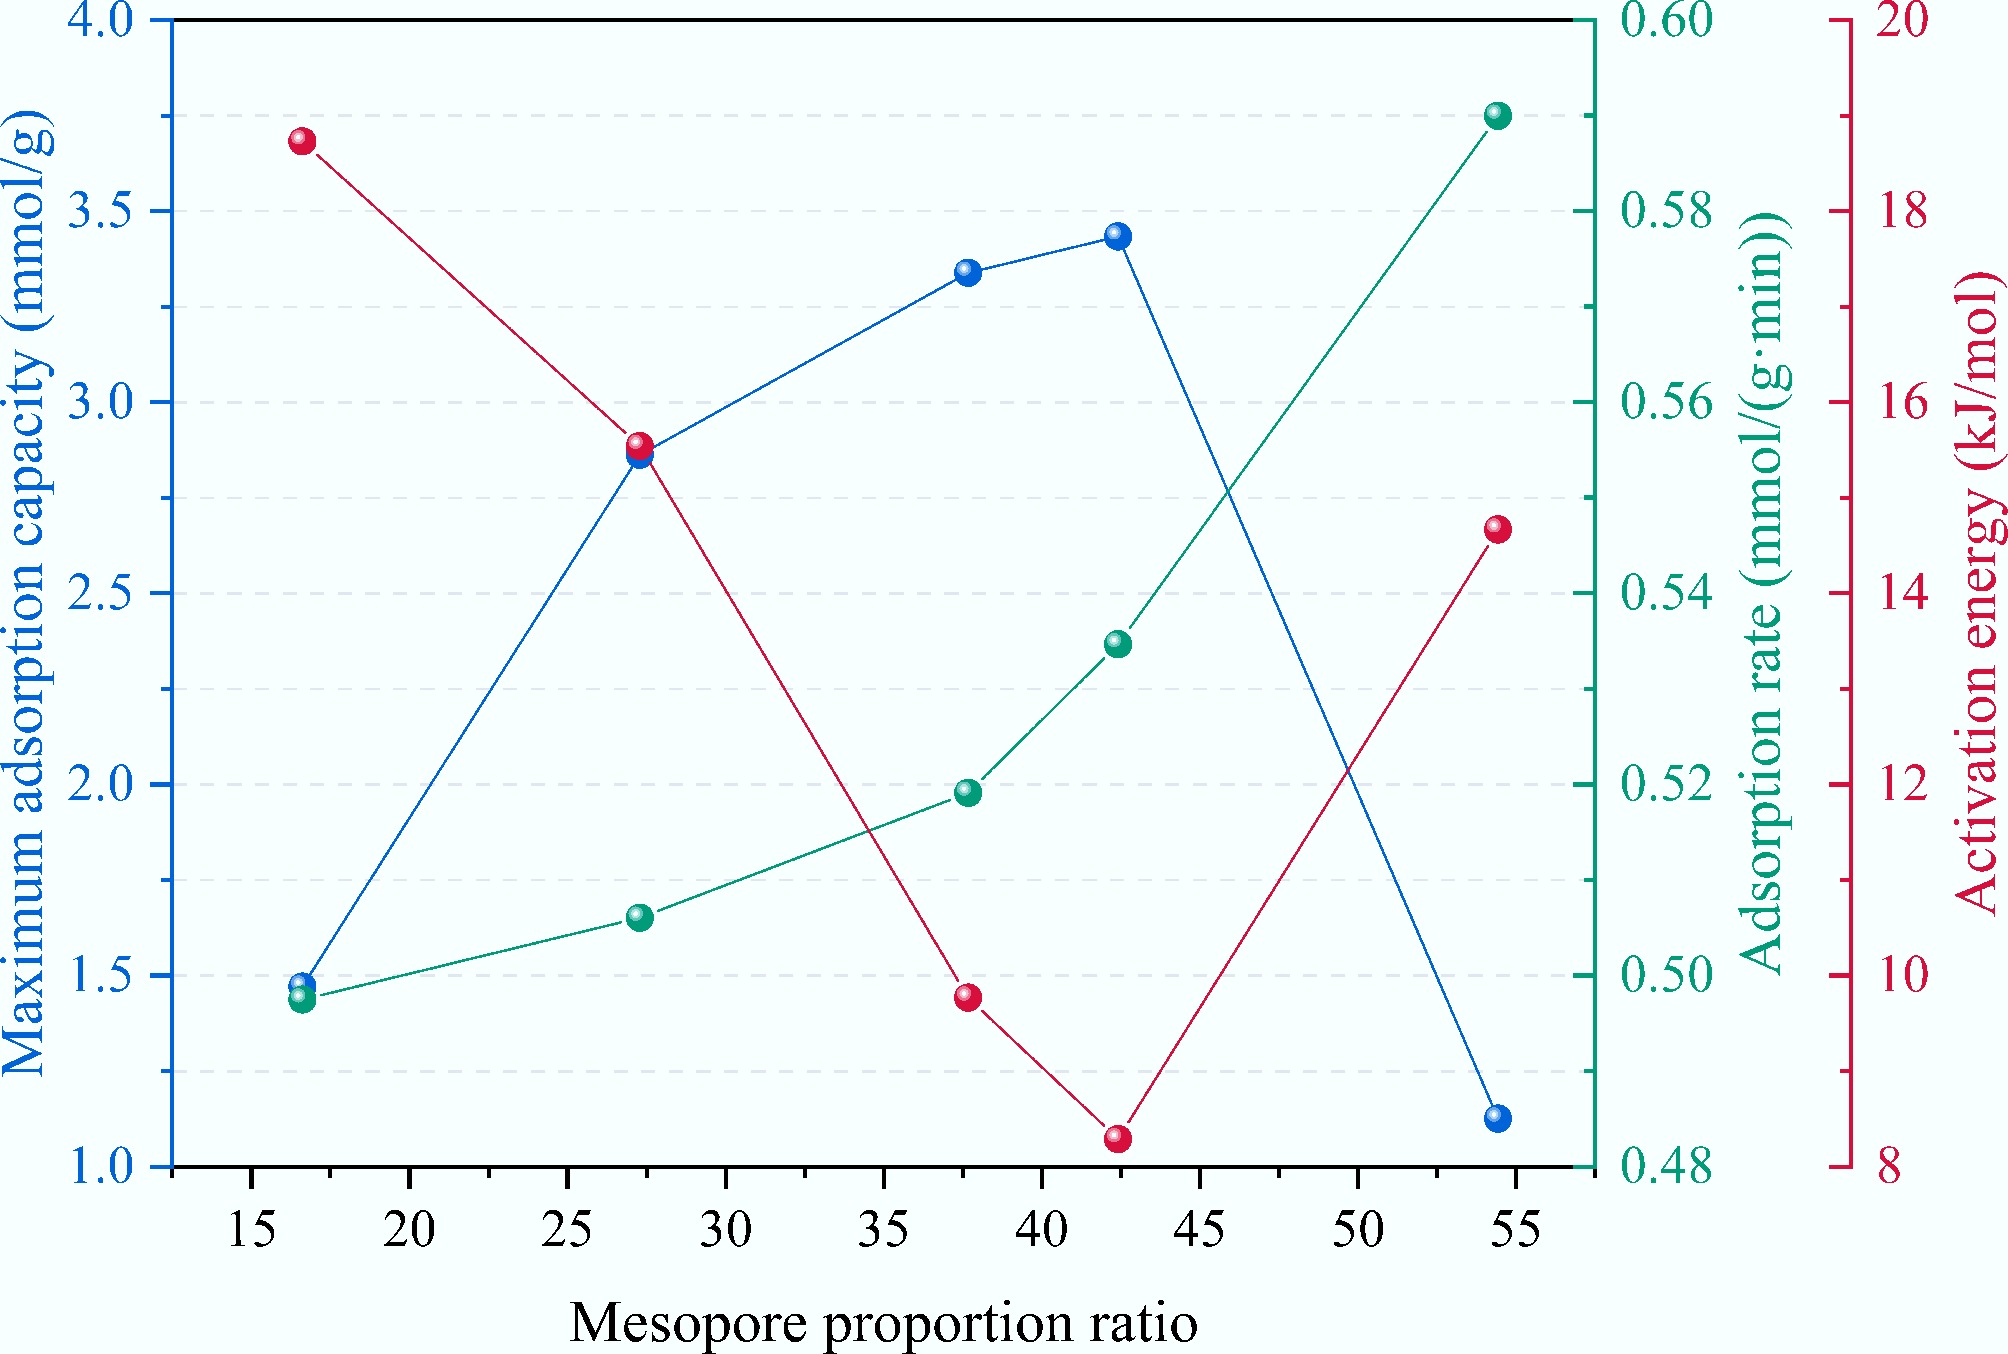
Figure 10.
The maximum adsorption capacity, average adsorption rate, and activation energy for CO2 adsorption of different samples.
As the mesopore proportion ratio increases to about 40%, well-developed mesopore channels (Vmeso = 0.64–0.80 cm3/g) substantially optimize mass transfer pathways. First, mesopores function as high-speed diffusion channels, reducing the average distance for CO2 molecules to reach micropore active sites, which decreases the diffusion activation energy to below 10 kJ/mol. Second, the continuous network structure enhances connectivity between micropores, preventing the formation of adsorption dead zones. This synergy elevates the average adsorption rate of PKBC-3 to 0.53 mmol/(g·min), while the micropore volume peaks at 1.10 cm3/g, resulting in a maximum equilibrium adsorption capacity (3.43 mmol/g).
When the proportion of mesopores exceeds 50%, an excessive amount of H3PO4 causes pore structure imbalance. The micropore volume plummets to 0.32 cm3/g, and residual phosphates partially block pore channels, creating disordered mesopore labyrinths. Although the mesopore volume (0.38 cm3/g) still provides low diffusion resistance [activation energy 14.67 kJ/mol, adsorption rate 0.59 mmol/(g·min)], the severe reduction in micropore active sites causes a sharp decline in adsorption capacity to 1.13 mmol/g. Under these conditions, the breakthrough curve exhibits a sudden increase but a rapid saturation profile (tb merely 2.03 min), indicating that CO2 molecules rapidly traverse mesopores but remain uncaptured due to insufficient adsorption sites. This phenomenon highlights that rapid mass transfer without effective adsorption sites holds no practical value[49].
-
This study proposes a microwave-assisted two-step activation (preliminary H3PO4 activation and KOH etching) strategy for synthesizing hierarchically porous biochar from corn straw, aimed at efficiently capturing CO2. The influence of the H3PO4-to-biomass impregnation ratio on biochar performance was investigated. The main contributions are as follows. (1) Methodological innovation. An H3PO4/KOH two-step activation protocol synergizing with microwave pyrolysis was developed, enabling precise control over mesopore proportion via H3PO4 impregnation ratio modulation. As the H3PO4 impregnation ratio increased from 1:1 to 3:1, the specific surface area, micropore volume, and mesopore volume proportion of the resulting biochar increased from 2,088.10 m2/g, 0.653 cm3/g, and 27.28% to 3,038.92 m2/g, 1.089 cm3/g, and 42.41%, respectively. Excessive phosphoric acid substantially increased the mesopore proportion while reducing both the specific surface area and micropore volume. (2) Scientific discovery. A mesopore proportion threshold of ≈ 40% (PKBC-3 with 42.4%) was identified, which optimally balances CO2 adsorption capacity and kinetic dynamic capacity. This resolves the long-standing trade-off between micropore-dominated capacity and mesopore-dominated mass transfer. The CO2 adsorption results indicate that biochar PKBC-3 prepared with an H3PO4 impregnation ratio of 3:1 exhibited optimal adsorption performance, achieving a maximum CO2 adsorption capacity of 3.434 mmol/g at 25 °C and 1 bar. Its dynamic adsorption capacity reached 3.02 mmol/g under 15% CO2 at 100 mL/min. Mechanistically, mesopores play a crucial role as diffusion channels, reducing barriers for CO2 migration to micropore sites. With a mesopore proportion below 30%, micropore pathways become predominantly tortuous, increasing activation energy and restricting adsorption kinetics. Conversely, if the mesopore proportion exceeds 50%, the excess H3PO4 can lead to micropore collapse and phosphate blockage. Although residual mesopores enhance diffusion, this irreversibly sacrifices capacity. This work establishes mesopore proportion as a central design parameter for CO2 adsorbents. Future work should focus on scaling up the two-step activation process for industrial flue gas treatment and implementing surface functionalization to further improve CO2 selectivity.
-
The authors confirm contributions to the paper as follows: study conception: Qiu T, Mostafa E, Zhang Y; data collection: Qiu T, Cao W, Xie K, Ahmad F; analysis and interpretation of results: Qiu T, Zhao W; draft manuscript preparation: Qiu T, Zhang Y. All authors reviewed the results and approved the final version of the manuscript.
-
The datasets used or analyzed during the current study are available from the corresponding author upon reasonable requests.
-
This work was supported by the National Natural Science Foundation of China (Grant No. 52476005), and Heilongjiang Provincial Key R&D Program 'Unveiling the Leader' Project (Grant No. 2023ZXJ02C04).
-
The authors declare that they have no conflict of interest.
-
Corn straw-based biochar was produced by microwave pyrolysis and two-step activation.
Isotherms, breakthrough curves, and kinetic curves were presented for CO2 adsorption.
The maximum specific surface area was 3,030 m2/g at H3PO4/biomass mass ratio of 3:1.
The maximum CO2 adsorption capacity was 3.434 mmol/g at 25 °C and 15 mL/min.
-
Full list of author information is available at the end of the article.
- Copyright: © 2025 by the author(s). Published by Maximum Academic Press, Fayetteville, GA. This article is an open access article distributed under Creative Commons Attribution License (CC BY 4.0), visit https://creativecommons.org/licenses/by/4.0/.
-
About this article
Cite this article
Qiu T, Cao W, Xie K, Ahmad F, Zhao W, et al. 2025. CO2 capture performances of H3PO4/KOH activated microwave pyrolyzed porous biochar. Sustainable Carbon Materials 1: e004 doi: 10.48130/scm-0025-0004 

CO2 capture performances of H3PO4/KOH activated microwave pyrolyzed porous biochar
- Received: 30 June 2025
- Revised: 01 August 2025
- Accepted: 22 September 2025
- Published online: 27 October 2025
Abstract: As global climate change intensifies, carbon dioxide emissions have become a significant threat to ecological security and sustainable development. This study introduces a novel microwave-assisted two-step activation strategy (preliminary H3PO4 activation and KOH etching), to prepare hierarchically porous biochar from corn straw with optimized CO2 adsorption capacity. The investigation focused on the influence of the H3PO4-to-biomass impregnation ratio on the performance of the biochar. The results indicate that sample PKBC-3, synthesized at an impregnation ratio of 3:1, exhibits a specific surface area as high as 3,038.92 m2/g and a micropore volume of 1.089 cm3/g. Under conditions of 25 °C and 1 bar, PKBC-3 achieves a maximum CO2 adsorption capacity of 3.434 mmol/g. Crucially, dynamic adsorption experiments (15% CO2, 100 mL/min) confirm that the 42.4% proportion of mesopore volume significantly enhances adsorption kinetics, resulting in a dynamic adsorption capacity of 3.02 mmol/g. Furthermore, the findings reveal that a low mesopore proportion (< 30%) can moderately retain adsorption capacity while restricting kinetics. Conversely, an excessive mesopore proportion (> 50%) may lead to micropore collapse, thereby reducing adsorption capacity. This research provides valuable insights for the design of biomass-derived adsorbents, aiming to achieve an optimal balance between high capacity and rapid kinetics through precise control of mesopore proportions.
-
Key words:
- CO2 adsorption /
- Porous biochar /
- Microwave pyrolysis /
- H3PO4/KOH activation /
- Corn straw