












-
Golf putting greens and sports fields utilize sand-dominated rootzones to facilitate optimal drainage, enabling rapid water removal and preventing waterlogging that could compromise turf performance and playability. Additionally, the routine application of topdressing sand and cultivation on putting green turf can modify the surface physical properties[1]. Total porosity serves as a critical physical property of sand-dominated rootzones and turf surfaces, affecting both water infiltration rates and moisture retention capacity. Porosity is calculated from bulk density (Db) and particle density (Dp), with lower Dp values yielding higher porosity at constant bulk density. Accurate Dp determination is therefore fundamental for effective rootzone design, construction quality control, and long-term performance evaluation of sand-dominated turf surfaces. While a standard Dp value of 2.65 Mg·m−3 is conventionally used for mineral soil calculations, actual Dp values are highly variable. Mineral particles exhibit Dp ranging from 2.4−2.9 Mg·m−3, depending on their chemical composition and crystal structure[2,3]. Traditional particle density measurements utilize precision apparatus such as gas pycnometers[4] or water pycnometers[5]. However, these direct measurement methods exhibit significant limitations and variability that compromise accuracy. Gas pycnometry results vary substantially depending on the displacement medium, with helium yielding densities of 2.65 Mg·m−3 while nitrogen and air produce inflated values ranging from 2.93−2.97 Mg·m−3 due to gas adsorption on clay surfaces[6]. Water pycnometry consistently overestimates particle density compared to gas methods because water molecules at soil particle surfaces are more densely packed than free water. Electrostatic and capillary forces compress water at mineral surfaces, particularly in clays with high specific surface area, leading to systematic measurement errors[7]. Helium gas pycnometry[4] was employed in this study, which avoids such errors, ensuring measurement consistency across all samples. These measurement inconsistencies, combined with specialized equipment requirements and time-intensive procedures, underscore the need for reliable prediction models that can estimate soil particle density from readily available soil properties.
Various prediction models have been proposed to estimate Dp from soil inorganic components such as sand, clay, and silt, as well as SOM. Early research by Adams on podzolic soils demonstrated that Dp could be accurately predicted from SOM content alone, with developed equations showing minimal deviations between predicted and measured densities, establishing the effectiveness of SOM-based Dp prediction models for the first time in quantitative soil science[3]. Recent research has significantly advanced Dp prediction by developing models that account for both mineral and SOM fraction effects[2,8−10]. However, existing Dp prediction models are typically developed and validated across diverse soil compositions with varying sand, silt, and clay proportions, and these generalized models may inadequately represent the unique physical properties of sand-dominated systems. This is particularly relevant for United States Golf Association (USGA) rootzones[11], where mineral fractions consist predominantly of sand with < 5% silt and < 3% clay according to United States Golf Association (USGA) specifications. The distinct composition and management practices of these sand-based rootzones therefore require tailored approaches to Dp estimation.
Given the critical importance of SOM management in turfgrass systems, SOM levels are routinely assessed through loss-on-ignition analysis[12]. Developing a robust regression model based on readily available SOM content would offer a valuable predictive tool for accurate Dp estimation. Such a model would reduce time and costs associated with traditional laboratory analyses while enabling precise calculations of total soil porosity. Research indicated that the source and composition of SOM play a critical role since fresh plant residues have considerably lower densities than decomposed humic substances, meaning the type and degree of decomposition of organic materials can substantially affect particle density calculations[2,13]. In turfgrass systems, SOM originates from two distinct but interconnected sources. The first source comprises intentionally applied organic soil amendments, including materials such as sphagnum peat, rice hulls, finely ground bark, sawdust, and other organic waste products[11]. Extensive research has examined the use of organic amendments to improve soil physical properties, thereby enhancing water and nutrient retention while maintaining proper infiltration and drainage[14−16]. The second source is naturally occurring thatch accumulation, which consists of a tightly intermingled layer of living and dead plant tissue that develops between the green vegetation and soil surface[17]. The thatch layer is composed primarily of cellulose, hemicellulose, and lignin, making thatch a structurally complex organic matter source that differs considerably from typical soil organic amendments[17].
This study explores the potential of SOM content as a predictor for Dp specifically within sand-dominated soils. The primary objective was to develop a prediction model for Dp based on laboratory sand-amendment mixtures and samples from the mat layer of field plots. The samples were specifically selected to encompass both field-collected samples and laboratory-prepared mixtures containing commonly used organic amendments (Canadian sphagnum peat, reed sedge peat, Irish sphagnum peat) and mat layers containing thatch, sand, peats, compost, loam, and zeolite with a range of SOM typically encountered in turfgrass rootzones and mat layers at the surface of rootzones. This comprehensive approach accounts for potential effects of different SOM types on particle density predictions while providing a robust foundation for model development across representative rootzone compositions.
-
The calibration dataset consisted of 124 samples: 36 laboratory-prepared mixtures and 88 field-collected mat layer samples. These laboratory-prepared samples included five non-amended sand samples, comprising five non-amended silica sand grades (< 0.1% organic matter) and 31 sand mixtures prepared by mixing sand with organic materials from different sources. The organic materials included three peats (Canadian sphagnum peat, reed sedge peat, and Irish sphagnum peat) and mat layer material composed of thatch collected from field plots at Rutgers University, Hort Farm No. 2 in North Brunswick, NJ. Thirteen samples were prepared by mixing the three peats with sand, yielding organic matter contents of 1.24% to 7.36%. Eighteen samples were prepared by mixing the thatch material with sand, yielding organic matter contents of 0.92% to 7.59%. The 88 field-collected mat layer samples were obtained from field plots managed as a putting green at Rutgers University, Hort Farm No. 2 in North Brunswick, NJ, USA. Fifty-six of these mat layer samples were from creeping bentgrass (Agrostis stolonifera) field plots topdressed with non-amended sand or sand amended with one of six materials, including three peat sources, biosolid compost, loam, and zeolite (ranging from 3.19% to 6.92% organic matter). Thirty-two of the mat layer samples were from velvet bentgrass (A. canina) field plots topdressed with non-amended sand and contained organic matter ranging from 1.78% to 3.6%. Mat layer samples were collected using 76 mm diameter undisturbed soil corers. Grass verdure was trimmed at the surface, and the mat layer was separated from the underlying rootzone at the visible interface between the two layers. Mat layer samples were processed by cutting into small pieces (< 12 mm), then freezing with liquid nitrogen in a mortar and grinding with a pestle to produce a fine homogeneous material suitable for mixing with sand and measurement in a gas pycnometer.
Two 10-g duplicates of all samples were sent to Turf & Soil Diagnostics – NY (Trumansburg, NY, USA) for the determination of particle density (Dp) using a gas pycnometer[4]. Soil organic matter content (SOM) was determined using the loss-on-ignition method as outlined in ASTM F1647-02a[12], with samples in the furnace at 440 °C for 12 h.
To evaluate whether organic matter source influenced the Dp-SOM relationship, analysis of variance (ANOVA) with an interaction term (SOM source × SOM content) was performed. The interaction was not significant (data not shown), indicating that regression slopes did not differ among SOM sources. All samples were therefore consolidated into a single linear regression model to maximize statistical power while maintaining prediction accuracy across OM source types. The SOM and Dp of the calibration dataset ranged from 0.0004 to 0.0759 kg·kg−1 and 2.499 to 2.675 Mg·m−3, respectively (Table 1).
Table 1. Soil organic matter content (SOM) and particle density (Dp) of calibration and validation data sets.
SOMa (kg·kg−1) Dpb (Mg·m−3) Calibration
data set
(n = 124)Validation data
set (n = 55)Calibration data
set (n = 124)Validation data
set (n = 55)Mean 0.0386 0.0533 2.581 2.557 Median 0.0367 0.0481 2.575 2.565 Minimum 0.0004 0.0316 2.499 2.370 Maximum 0.0759 0.1345 2.675 2.645 a SOM was determined using the loss-on-ignition method as outlined in ASTM F1647-11. b Dp was determined following the ASTM D5550-14 standard test method for specific gravity of soil solids by gas pycnometer. Validation dataset
-
The validation dataset consisted of 55 mat layer samples collected from a topdressing trial on a 4.75-year-old 'Shark' creeping bentgrass (A. stolonifera L.) turf using an undisturbed core (76-mm i.d.) sampler[1]. The turf was grown on a sand-based rootzone constructed in accordance with USGA putting green specifications at Rutgers University Hort Farm No. 2, North Brunswick, NJ, USA. The experimental design was a 3 × 2 × 2 factorial randomized complete block with four replicates. The factors evaluated included sand particle size (medium-coarse, medium-fine, fine-medium), midseason topdressing rate (0.24 or 0.49 kg·m−2 every 10–14 d), and core cultivation treatment (non-cored or cored with backfill). The SOM and Dp were determined following the analytical procedures described for the calibration dataset. The ranges in SOM and Dp were 0.0316 to 0.1345 kg·kg−1 and 2.370 to 2.645 Mg·m−3, respectively (Table 1).
Statistical analysis
-
The relationship between SOM and Dp was modeled within the calibration set by fitting a simple least-squares linear regression, with SOM as the predictor and Dp as the response variable, using the PROC REG procedure. (SAS Institute Inc., Cary, NC, USA). The regression equation derived from the calibration set was subsequently applied to the validation set to assess its predictive performance.
For comparative evaluation, two previously published models for estimating Dp from SOM were applied to the validation data. The first model, developed by McBride et al.[8], was based on an extensive dataset comprising 282 soil horizons from 91 profiles representing a wide range of soil textures in southwestern Ontario, Canada:
$ Dp=2.646-2.8\times SOM $ (1) The second model, proposed by Schjønning et al.[9], initially incorporated both clay and SOM content to enhance predictive accuracy. However, only the SOM-based equation was utilized to maintain equivalent model complexity and ensure direct comparability with our methodology. This model was developed using 79 soil samples collected from 16 sites across Denmark, encompassing both topsoil and subsoil horizons:
$ Dp=2.686-2.649\times SOM $ (2) Model performance was evaluated using two statistical metrics. The root mean square error (RMSE) was calculated to provide a quantitative measure of prediction accuracy, reflecting the average magnitude of the differences between observed and predicted Dp values. A lower RMSE indicates a better fit of the model to the observed data. The mean error (ME) was computed to assess systematic bias, representing the average deviation of the predicted values from the observed values. A ME value close to zero suggests that the model does not consistently overestimate or underestimate Dp:
$ RMSE=\sqrt{\dfrac{1}{m}\sum\limits_{i=1}^{m}d_{i}^{2}} $ (3) $ ME=\dfrac{1}{m}\sum\limits_{i=1}^{m}{d}_{i} $ (4) -
There is a clear decrease in Dp with increasing SOM content in the calibration dataset and the validation dataset. In the calibration dataset (Fig. 1a), a strong negative correlation is observed between Dp and SOM (r = −0.955, n = 124), with increases in SOM consistently associated with decreases in particle density. The distribution of Dp values is relatively narrow, with most observations ranging from approximately 2.50 to 2.65 Mg·m−3, while SOM values predominantly fall between 0.03 and 0.07 kg·kg−1.
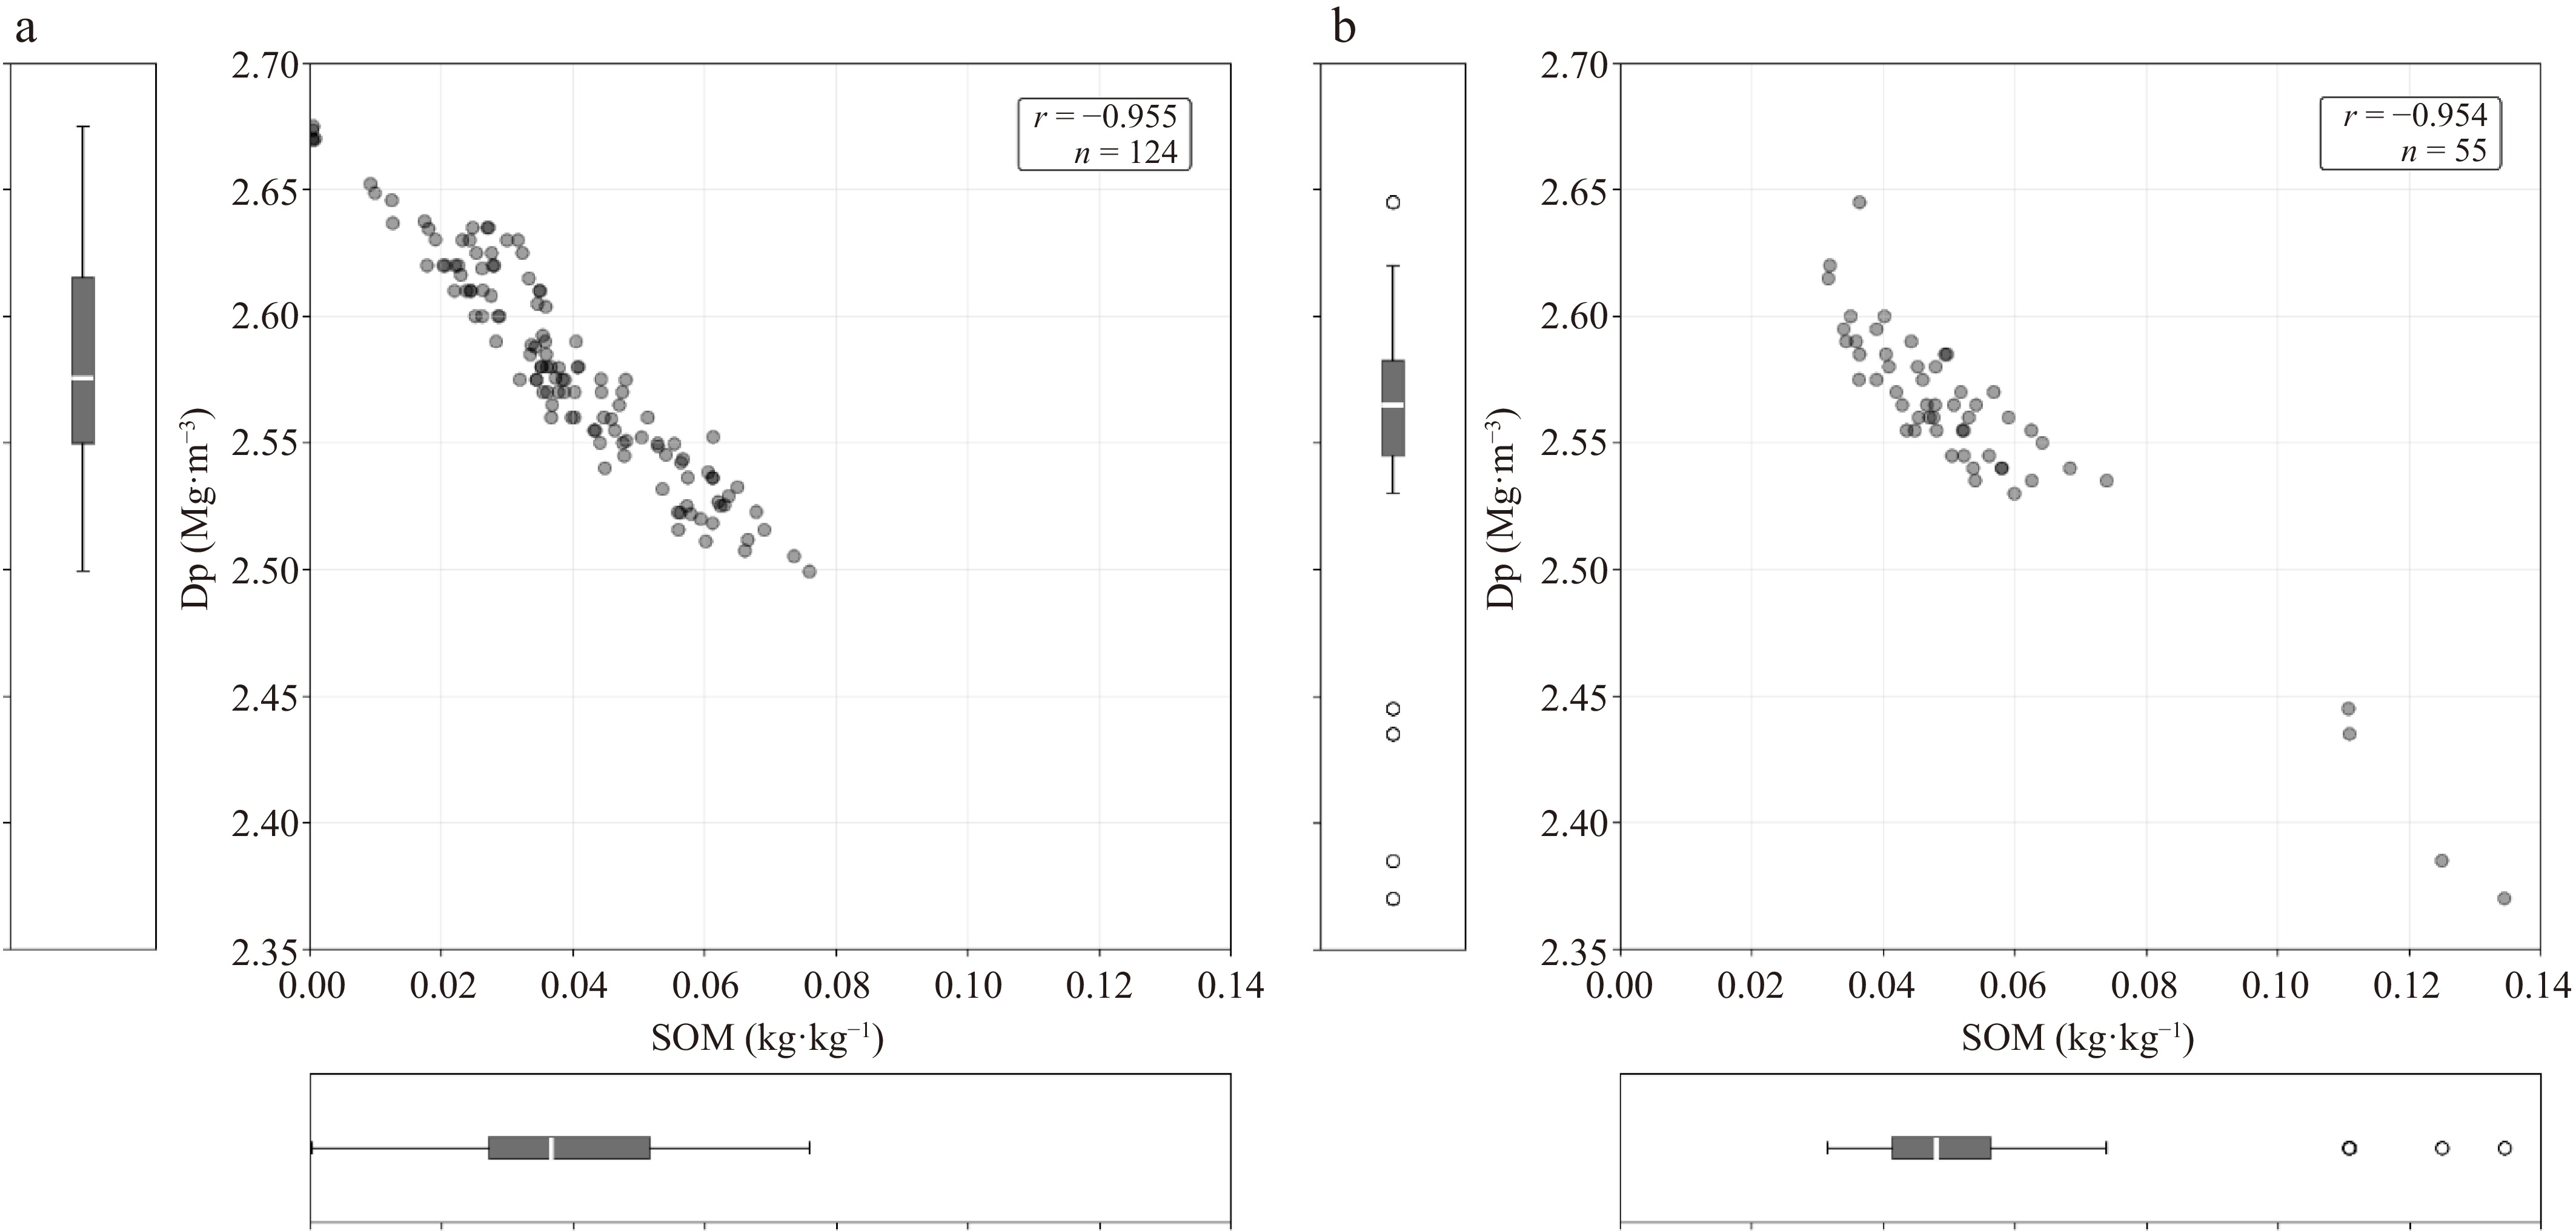
Figure 1.
Relationship between soil particle density (Dp, Mg·m−3) and soil organic matter content (SOM, kg·kg−1) for (a) calibration and (b) validation datasets. Horizontal and vertical bars indicate ± one standard deviation. Scatter plot of Dp vs SOM content for the (a) calibration dataset and (b) validation dataset.
A linear regression model was fitted to the calibration dataset to characterize the relationship between Dp and SOM (Fig. 2). The analysis revealed a strong negative association, with higher SOM values corresponding to lower Dp values. The fitted regression equation is:
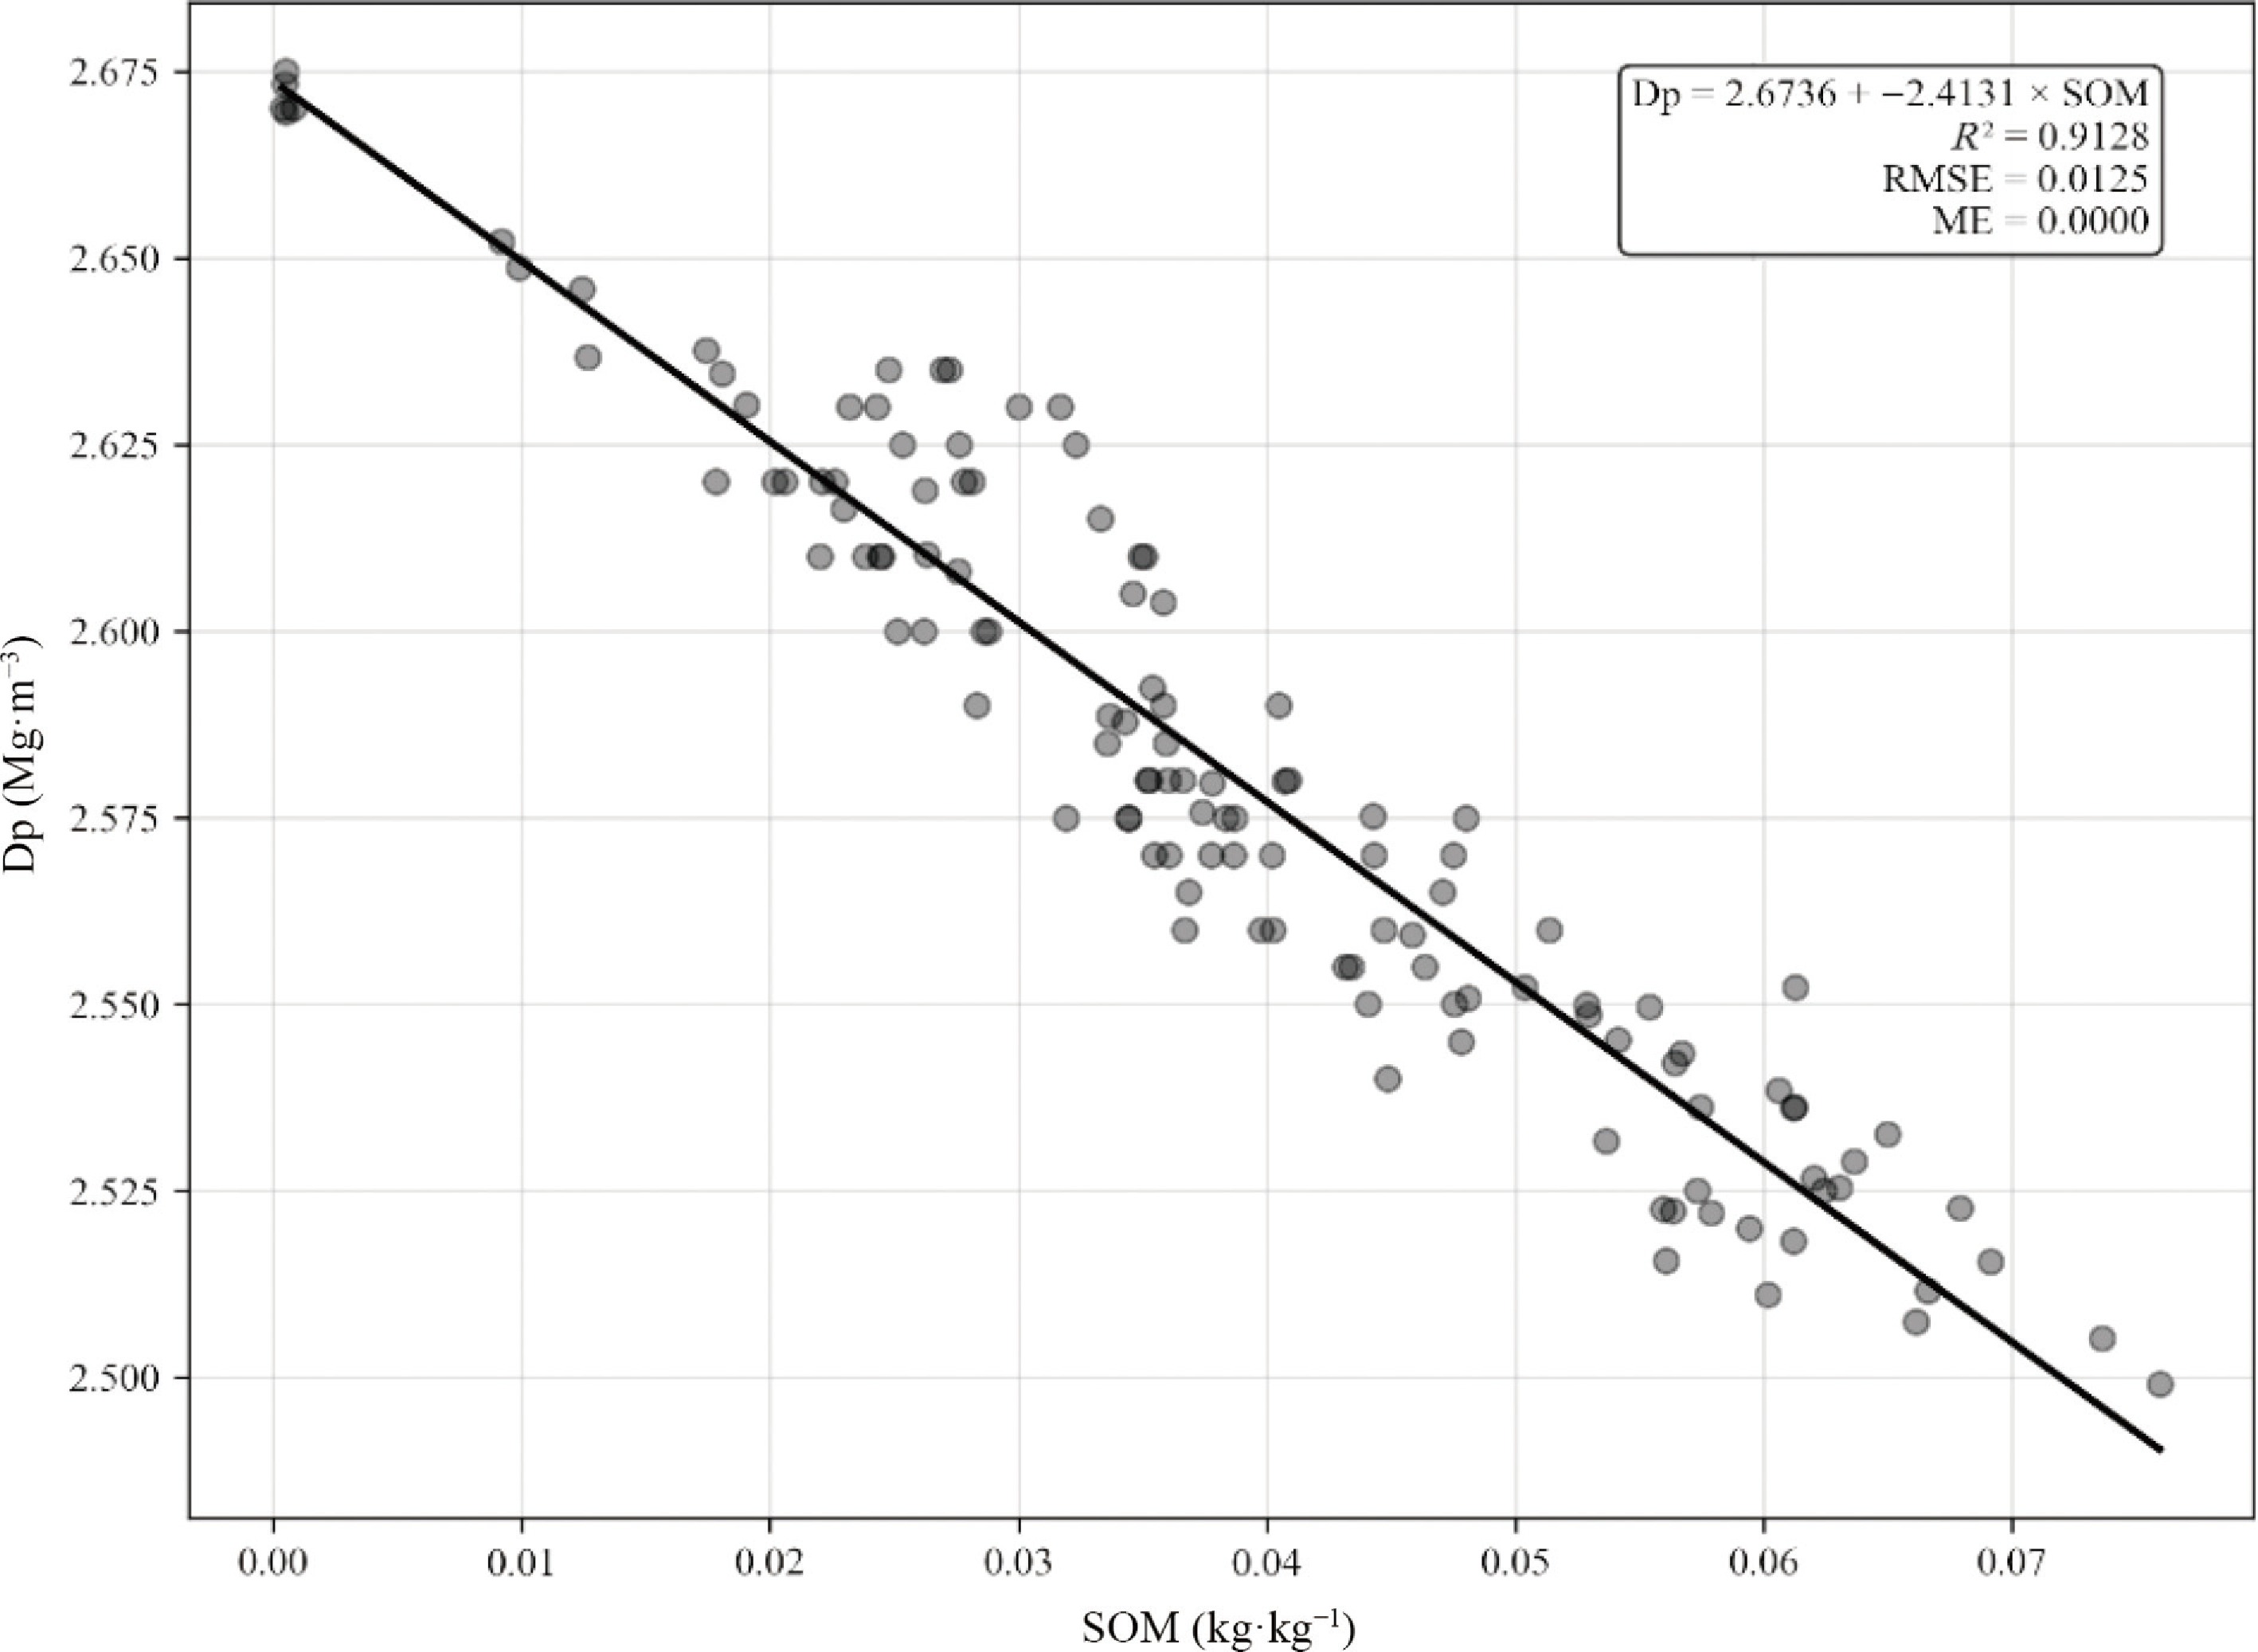
Figure 2.
Relationship between soil particle density (Dp, Mg·m−3) and soil organic matter content (SOM, kg·kg−1) for the calibration dataset (n = 124). The regression line represents the best fit derived using simple linear regression with Eq. (5).
$ Dp=2.6736-2.4131\times SOM $ (5) This model accounts for a substantial proportion of the variance in Dp (R2 = 0.9128), indicating that SOM is a highly significant predictor within this dataset. The low root mean square error (RMSE = 0.0125) demonstrates close agreement between observed and predicted values, while the mean error (ME = 0.0000) indicates an absence of systematic bias. Collectively, these results confirm the robustness and predictive accuracy of the linear model for estimating soil particle density from SOM content in the calibration data.
Model validation
-
The validation dataset (Fig. 1b) exhibits a similarly strong negative correlation (r = −0.954, n = 55), further supporting the inverse relationship between Dp and SOM. Most data points cluster within the same ranges as the calibration set (Fig. 1a); however, several samples have substantially higher SOM contents and correspondingly lower Dp values, as shown by the box plot.
To assess the predictive capabilities of the three models, each equation—the McBride, Schjønning, and the current model—was applied to the validation dataset, with results summarized in Table 2. The current model yielded the lowest root mean square error (RMSE = 0.0194) and mean error (ME = −0.0119), demonstrating adequate precision and minimal bias in estimating soil particle density from soil organic matter content. The Schjønning model also performed well, with comparably low RMSE (0.0213) and ME (−0.0121) values, indicating a high degree of reliability. In contrast, the McBride model showed considerably higher error metrics (RMSE = 0.0632, ME = −0.0602), suggesting less accurate predictions for this dataset.
Table 2. Root mean square error (RMSE) and mean error (ME) for Dp (Mg·m−3) predictions for 55 samples from the validation data set using the McBride (Eq. [1]), Schjønning (Eq. [2]), and the current model (Eq. [5]).
Graphical comparisons of predicted vs measured particle density (Fig. 3a–c) further reinforce these findings. In Fig. 3a, the McBride model displays a wider dispersion of data points from the 1:1 reference line, reflecting greater bias and reduced agreement with observed values. Both the Schjønning model (Fig. 3b) and the current model (Fig. 3c), however, exhibit data points closely clustered around the 1:1 line, indicating strong concordance with measured values and minimal systematic error. These results demonstrate that the newly developed model delivers clear improvements in predictive accuracy and robustness compared to existing approaches.
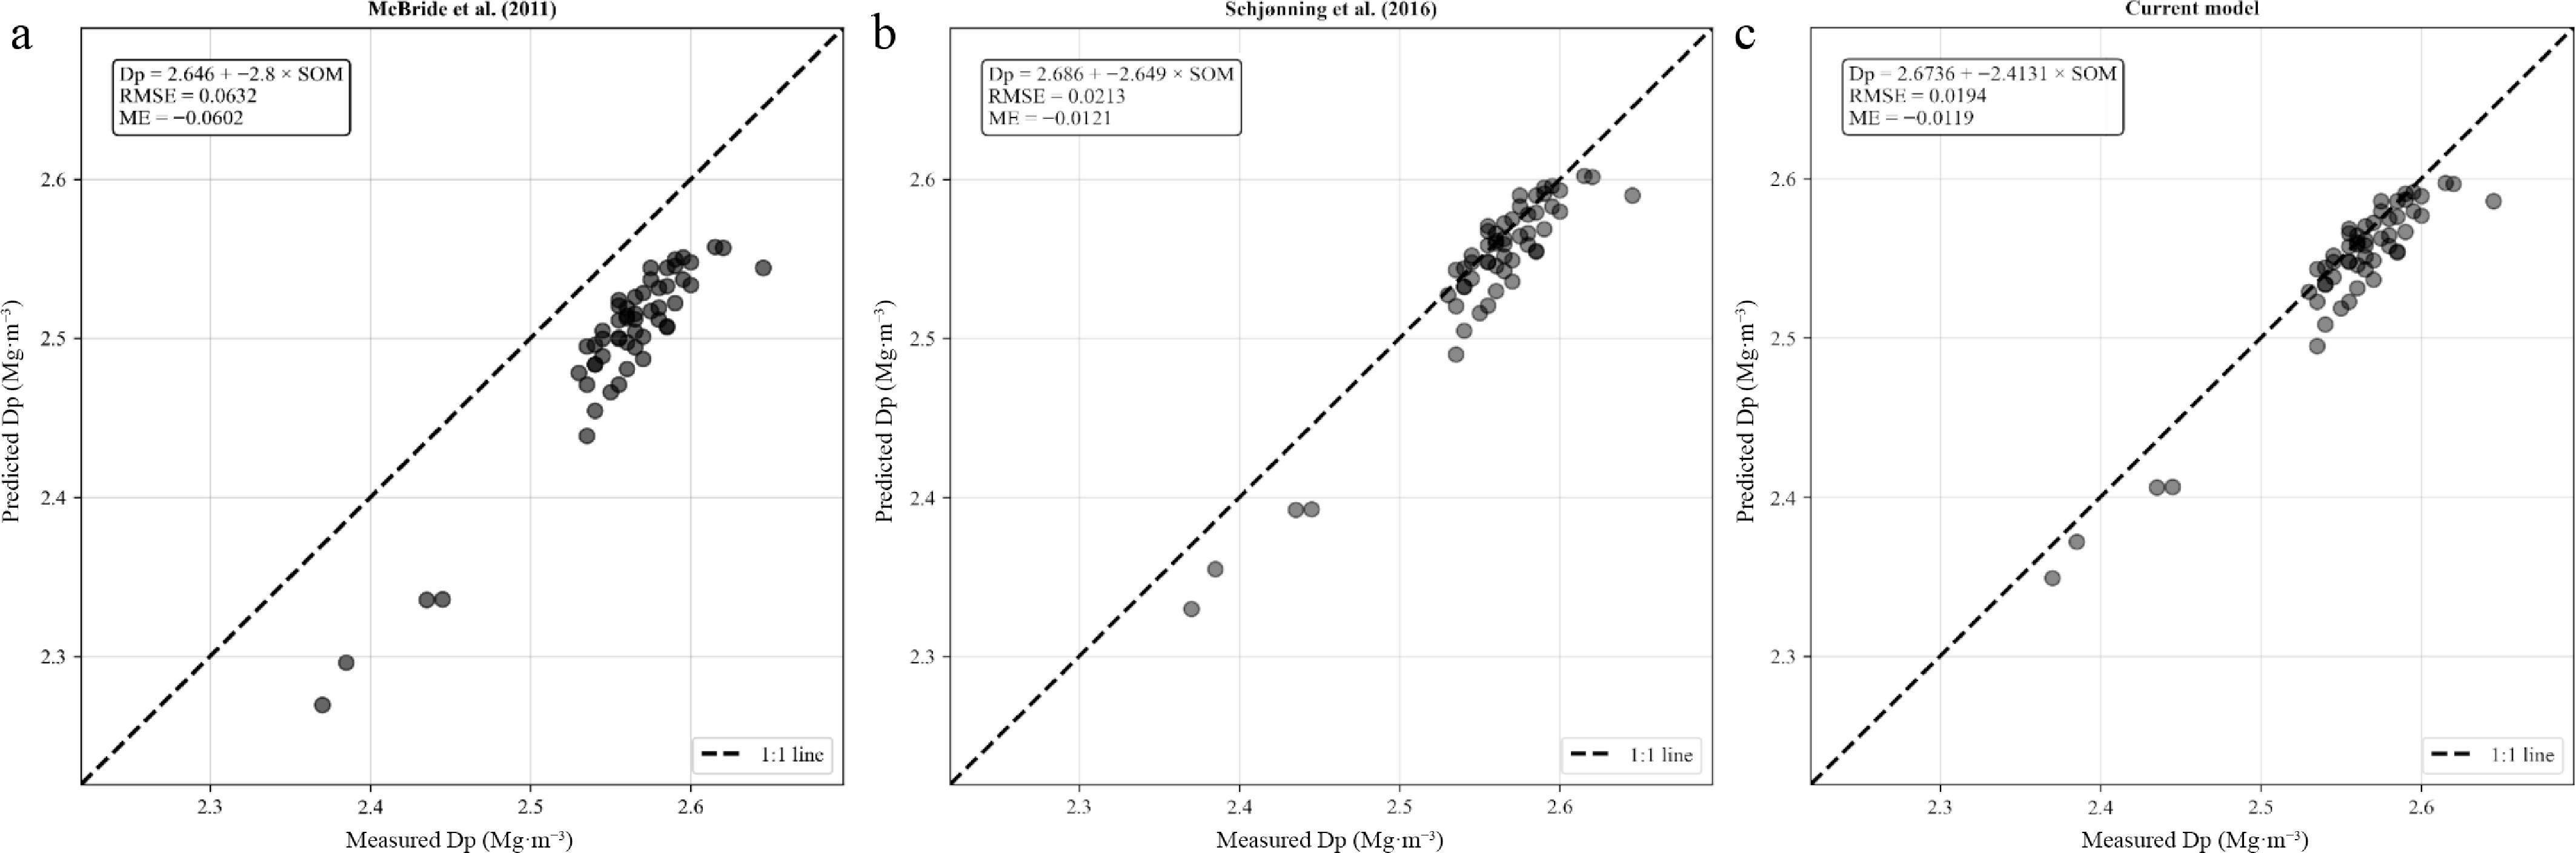
Figure 3.
Comparison of predicted and measured soil particle density (Dp, Mg·m−3) for the validation dataset using three prediction models: (a) McBride[8]; (b) Schjønning[9]; and (c) the current model. The 1:1 reference line indicates perfect agreement between predicted and measured values. Model performance was evaluated using the coefficient of determination (R2), root mean square error (RMSE), and mean error (ME).
-
The results from this study confirm the strong inverse relationship between soil particle density (Dp) and soil organic matter (SOM) content in sand-dominated soils, consistent with findings reported in the literature[2,8,9,18]. This inverse relationship is fundamentally based on the substantial density difference between SOM and mineral soil components, where SOM exhibits considerably lower particle density than mineral particles in sand-dominated soils. The calibration dataset demonstrated a robust negative correlation (r = −0.955, p < 0.001), which is considerably stronger than correlations reported in previous studies using more diverse soil types[8,19]. This enhanced correlation strength can be attributed to the focused approach on sand-dominated soils, which exhibit more homogeneous mineralogical composition compared to datasets encompassing multiple soil textural classes. The strong and negative correlation demonstrated in the scatter plot (Fig. 1a) indicates that a simple linear regression approach is both robust and appropriate for developing a prediction model for sand-dominated soils. This approach aligns with Schjønning et al., who noted that linear relationships are reasonable for limited SOM content ranging from 0.03−0.07 kg·kg−1[9].
The developed linear regression model achieved excellent predictive performance. The intercept value of 2.6736 Mg·m−3 represents the average Dp of mineral particles in sand-dominated soils free of SOM, which closely approximates the theoretical particle density of quartz at 2.65 Mg·m−3[20]. Research has demonstrated that clay proportion significantly impacts particle density predictions, as clay particles exhibit substantially higher density (~2.86 Mg·m−3) compared to sand and silt fractions (~2.65 Mg·m−3), indicating that soils with different textural compositions require distinct prediction approaches[8]. Studies using clay-rich materials reported regression slopes of 2.726 Mg·m−3 and 2.719 Mg·m−3 for silt loams and clay-dominated textures, respectively[8,13]. These findings contrast with our sand-rich samples, where the intercept reflects the lower density characteristic of quartz-dominated mineral assemblages prevalent in coarser size fractions.
The validation dataset from an ongoing field trial provides confidence in the applicability of the current model to real-world conditions. A key indicator of model robustness is the accurate prediction achieved for the validation dataset (Fig. 1b) with SOM content extending beyond the calibration dataset (Fig. 1a), suggesting potential applicability beyond the calibration range. However, we caution that extrapolation should be limited and validated with additional datasets.
The improvement in performance of the current model compared to the other two models, particularly the McBride model[8], can be attributed to its development using a focused approach on sand-dominated soils, whereas the existing models were developed using a broader range of soil types across a large geographic area with varying textures. This finding aligns with established principles that site-specific or soil-type-specific modeling approaches are essential for achieving optimal prediction accuracy, as the mineral composition of soils significantly influences particle density[19]. However, the magnitude of this improvement should be considered in context: the RMSE difference of 0.0019 Mg·m−3 between the current model and the Schjønning model[9] results in minimal differences in porosity estimates that are unlikely to be of practical significance in field applications. The practical value of the current model lies not in marginal improvements in prediction accuracy, but in its development using sand-dominated soil specifically, which may provide more reliable estimates for turf systems than models developed across broader soil types. In addition, it is important to note that for this comparison, we utilized only the simple linear SOM-based equations from both McBride et al.[8] and Schjønning et al.[9] studies to maintain equivalent model complexity and ensure direct comparability with our methodology. The complete models from both studies incorporate additional parameters as predictors and employ more sophisticated algorithms, significantly enhancing prediction accuracy across diverse agricultural soils and geographic regions. The simplified comparison presented here demonstrates the effectiveness of targeted modeling for specific soil types, while acknowledging that the complete models from these studies would be more appropriate for general agricultural applications requiring broader soil type coverage. Future studies should evaluate how improved Dp predictions translate to porosity estimates by comparing calculated porosity with direct measurements.
-
This study successfully developed a robust prediction model for soil particle density in silica sand-dominated systems using the relationship Dp = 2.6736 − 2.4131 × SOM. The linear regression demonstrated improved accuracy compared to existing models, achieving an RMSE of 0.0194 Mg·m−3 and minimal bias (ME = −0.0119 Mg·m−3) during independent validation. Close agreement between predicted and measured values confirms that the model can effectively predict Dp of samples collected from field conditions. For turfgrass systems with sand-dominated rootzones (> 90% sand, < 5% clay), the current model provides accurate Dp estimates. For soils with higher clay content, models incorporating clay parameters may be more appropriate.
The targeted approach of focusing on specific textural classes proved more effective than universal models attempting to encompass diverse soil types and mineralogical compositions. The model's practical utility stems from its simplicity, requiring only SOM content, making it accessible for routine management applications. This work demonstrates that focused, simple models can achieve high accuracy when applied to appropriate soil populations, providing a valuable tool for soil scientists and turf managers working with sandy systems while contributing to a broader understanding of soil physical property relationships.
This research was supported by the New Jersey Agricultural Experiment Station and the Rutgers Center for Turfgrass Science. The authors would like to thank TJ Lawson for their assistance with the research.
-
The authors confirm their contributions to the paper as follows: study conception and design: Chen H, Murphy JA; data collection: Chen H, Devaney J, Schmid CJ, Samaranayake H; analysis and interpretation of results: Chen H, Samaranayake H; draft manuscript preparation: Chen H; funding acquisition: Murphy JA. All authors reviewed the results and approved the final version of the manuscript.
-
The datasets generated during and/or analyzed during the current study are available from the corresponding author upon reasonable request.
-
The authors declare that they have no conflict of interest.
- Copyright: © 2026 by the author(s). Published by Maximum Academic Press, Fayetteville, GA. This article is an open access article distributed under Creative Commons Attribution License (CC BY 4.0), visit https://creativecommons.org/licenses/by/4.0/.
-
About this article
Cite this article
Chen H, Samaranayake H, Devaney J, Schmid C J, Murphy J A. 2026. Soil particle density prediction from organic matter content in sand-dominated soils. Technology in Agronomy 6: e012 doi: 10.48130/tia-0026-0008 

Soil particle density prediction from organic matter content in sand-dominated soils
- Received: 20 May 2026
- Revised: 23 July 2026
- Accepted: 05 August 2026
- Published online: 30 September 2026
Abstract: Total porosity is a critical physical property of sand-based rootzones in turfgrass systems, calculated using bulk density and particle density measurements. While many studies assume a constant soil particle density (Dp) of 2.65 Mg·m−3, this value varies considerably with soil organic matter content (SOM), particularly in surface layers. Although the general SOM-Dp relationship has been well-documented across diverse soil types, existing prediction models lack specific calibration for sand-dominated rootzones used in turfgrass systems. This study developed a predictive model for Dp estimation across varying SOM contents using laboratory mixtures and samples from the mat layer of field plots. Linear regression analysis demonstrated that SOM explained 91% of Dp variation. The model (Dp = 2.6736 − 2.4131 × SOM) was validated against independent field data, achieving improved performance compared to existing universal models. The model intercept (2.6736 Mg·m−3) approximates theoretical quartz density, confirming the homogeneous mineralogical composition of sand-dominated systems. The targeted approach for sand-dominated soil samples demonstrated modestly higher accuracy than universal models developed across diverse soil types. This simple SOM-based equation provides a practical tool for accurate porosity calculations in sand-dominated rootzones, supporting improved physical property assessment in turfgrass management while validating the effectiveness of a soil-specific modeling approach.
-
Key words:
- Particle density /
- Sand-dominated soils /
- Organic matter content /
- Turfgrass