


-
Diabetic retinopathy (DR) is one of the most common complications of diabetes[1]. With the rising prevalence of diabetes, DR has emerged as a predominant cause of vision impairment among the global working-age population[2]. The pathological mechanisms underlying DR are complex, encompassing high glucose-induced damage to the blood–retinal barrier (BRB), inflammatory responses, and aberrant vascular proliferation[3]. These pathological alterations subsequently contribute to the development of diabetic macular edema (DME) and proliferative diabetic retinopathy (PDR)[4]. While anti-vascular endothelial growth factor (anti-VEGF) drugs are currently the primary treatment for DME and PDR[5], they do not fully address the complex nature of DR. On the other hand, laser photocoagulation, although effective as a traditional treatment for DR, is limited by its permanent damage to the retina, which restricts its broader application[6]. Therefore, it remains necessary to explore additional potential therapeutic approaches.
In recent years, studies have shown that mitochondrial dysfunction plays a critical role in the onset and progression of DR. In a high-glucose environment, the homeostasis of mitochondrial dynamics is disrupted, resulting in heightened oxidative stress. Then the oxidative stress inflicts damage on mitochondrial DNA, proteins, and membrane lipids, thereby further exacerbating the apoptosis of retinal cells[7,8]. The mitochondrial unfolded protein response (UPRmt) is a critical cellular protective mechanism that responds to misfolding and aggregation of proteins within the mitochondria. By activating molecular chaperones such as HSP60 and HSP10, as well as proteases like CLPP, UPRmt regulates mitochondrial protein homeostasis and ensures the preservation of normal mitochondrial function[9]. The UPRmt is integral to mitigating oxidative stress and preventing cellular damage, as well as maintaining mitochondrial quality control and regulating apoptosis[10,11]. Studies have shown that UPRmt exerts a protective effect in various diseases, including cardiovascular diseases, neurodegenerative disorders, and metabolic dysfunctions, by regulating mitochondrial function and reducing stress-induced damage[12−14]. However, its role and mechanisms in DR have not been well-studied.
This study aimed to identify UPRmt-related genes (MRGs) as potential biomarkers for DR by integrating transcriptomic data from public databases and applying comprehensive bioinformatics analyses. Utilizing methodologies such as functional enrichment, immune infiltration assessment, and molecular network construction, we explored the biological functions and regulatory mechanisms of these biomarkers. Additionally, by validating their expression levels in blood samples from DR patients using reverse transcription-quantitative polymerase chain reaction (RT-qPCR), we confirmed their potential significance in DR progression. This work provided new insights into the molecular mechanisms of DR and established a theoretical foundation for the development of novel diagnostic and therapeutic strategies.
-
Two transcriptome datasets linked to DR were acquired from the Gene Expression Omnibus (GEO) database (
https://www.ncbi.nlm.nih.gov/geo/ ). These datasets were selected according to the following criteria: (1) derived from human blood samples, (2) containing both DR and control groups, and (3) a sample size sufficient for differential analysis. GSE221521 (GPL24676 platform) comprised 69 DR and 23 control blood samples. This set was treated as a training set. GSE189005 (GPL23126 platform) included 10 DR and 9 control blood samples, which was viewed as a validation set. As the two datasets were analyzed separately, batch effect correction was not applied. The expression data were normalized and differentially analyzed using the DESeq2 R package. Finally, 35 MRGs were available in the literature[15].Differential expression analysis and weighted gene co-expression network analysis (WGCNA)
-
In GSE221521, 'DESeq2' package (v 1.38.0)[16] was adopted to differential expression analysis. The conditions for screening were p < 0.05 and |log2foldchange(FC)| > 0.5[17]. In order to isolate MRGs exhibiting profound disparities in DR and control, in GSE221521, we screened for genes that were markedly distinct in DR and control (p < 0.05). Based on these genes, the gene score of each sample in GSE221521 was calculated by the single sample gene set enrichment analysis (ssGSEA) algorithm of the 'GSVA (v1.42.0)' package[18]. Subsequently, the distinction between the gene score in DR and the control was examined (p < 0.05). To identify key module genes intricately linked to UPRmt, WGCNA was performed with the 'WGCNA (v 1.71)' package[19]. Samples were first clustered to eliminate outlier samples. Later on, the optimal soft threshold was determined by the pickSoftThreshold function, ensuring that the inter-gene interactions adhered maximally to a scale-free network distribution. The minimum number of genes per genome (minModuleSize) and MergeCutHeight was set to 30 and 0.3, respectively. Following this, a co-expression network comprising several modules based on dynamic tree cuts was constructed. Pearson's correlation between modules and gene score was analyzed. Modules exhibiting a marked positive or negative correlation with gene scores were deemed to be key modules (|r| > 0.3, p < 0.05). Genes within these modules were recognized as key module genes.
Identification and functional analysis of candidate genes
-
To acquire candidate genes, differentially expressed genes (DEGs) and key module genes were overcrossed via the 'ggVennDiagram' package (v 1.2.2)[20]. Afterwards, the 'ClusterProfiler' package (v4.2.2)[21] was implemented to perform Gene Ontology (GO) and Kyoto Encyclopedia of Genes and Genome (KEGG) enrichment analysis (adjusted p < 0.05). The GO analysis encompassed a trifecta of aspects: biological process (BP), cellular components (CC), and molecular function (MF). Subsequently, candidate genes were submitted to the STRING database (
https://cn.string-db.org/ ) (interaction score ≥ 0.15). Eventually, a protein–protein interaction (PPI) network was assembled. The visualization of this network was achieved via Cytoscape software (v3.9.0). To further filter candidate genes, subnetworks were established via four algorithms (closeness, betweenness, bottleneck, and stress) of Cytohubba plugin in Cytoscape (v 3.9.0). Eventually, after top 30 genes of each algorithm were intersected through the 'UpSetR' package (v 1.4.0)[22], the hub genes were obtained.Recognition of biomarkers
-
For further filtering these hub genes, machine learning was conducted in GSE221521 by the 'randomForest' package (v 4.7.1)[23]. Afterwards, genes that exhibited significance values greater than the median (mean decrease Gini) were determined to be feature genes. Leveraging these feature genes, expression validation was undertaken in GSE221521 and GSE189005. Genes that were notably dissimilar and had concordant expression trends in GSE221521 and GSE189005 were recognized as key genes (p < 0.05). To appraise the diagnostic efficacy of key genes, receiver operating characteristic (ROC) curves were plotted with the 'pROC' package (v 1.18.0)[24] in GSE221521 and GSE189005. Genes with area under the curve (AUC) values ≥ 0.7 in GSE221521 and GSE189005 were deemed to be biomarkers.
Construction of nomogram and function analysis of biomarkers
-
To thoroughly assess the diagnostic ability of biomarkers for DR, a nomogram was crafted utilizing the 'rms' package (v6.5.0)[25]. Subsequently, the predictive prowess and clinical applicability of nomograms were rigorously evaluated through calibration curves, decision curve analysis (DCA), and ROC curves. The p-value for the Hosmer–Lemeshow (HL) goodness-of-fit test of calibration curve was greater than 0.05, the net benefit of model in DCA was situated above others, and the AUC value of the ROC curve was greater than 0.7, indicating that the prediction of the nomograms was excellent. To delve deeper into the pathways associated with the biomarkers in GSE221521, Spearman correlation analysis was conducted between each biomarker and all remaining genes with 'psych' package (v 2.4.3). This analysis yielded correlation coefficients, which were then sorted in descending order. Then 'c2.cp.kegg.v7.4.symbols.gmt' in MSigDB database (
https://www.gsea-msigdb.org/gsea/msigdb/index.jsp ) was taken as a reference gene set. Gene set enricment analysis (GSEA) was conducted by the 'clusterProfiler' package (v4.6.2)[21] (adjusted p < 0.05).Disease correlation analysis, drug prediction, and regulatory networks
-
To delve into the association between biomarkers and other diseases as well as to identify potential drugs for the treatment of DR, the comparative toxicogenomics database (CTD) (
http://ctdbase.org ) was utilized to conduct disease correlation analysis and drug prediction. Cytoscape (v 3.9.0) was implemented to visualise networks. Notably, in order to gain a deeper understanding of drug–biomarker interactions, molecular docking was performed. Specifically, the three-dimensional (3D) structures of molecular receptors (biomarkers) were obtained from the Universal Protein Resource (UniProt) (https://www.uniprot.org/ ) and Protein Data Bank (PDB) (https://www.rcsb.org/ ) databases. In parallel, the 3D structures of molecular ligands (drugs with high interaction scores) were retrieved from the PubChem database (https://pubchem.ncbi.nlm.nih.gov/ ). The docking processes were then facilitated through the use of CB-DOCK2 database (https://cadd.labshare.cn/cb-dock2/php/index.php ), and the binding energies were calculated. If the binding energy reached -5.0 kcal/mol, the drug was considered to have a strong binding affinity with the corresponding protein, and the resulting complexes were visualized, with specific binding sites being highlighted. The ChEA3 database (https://amp.pharm.mssm.edu/ChEA3 ), which amalgamates a vast repository of genomic libraries stemming from multifaceted sources, including the ENCODE, ReMap, GTEx, Enrichr, and ARCHS4 databases, was harnessed to identify the top 10 transcription factors (TFs) that potentially govern biomarkers. Heatmaps were exhibited to illustrate TFs predicted by various databases, while a network diagram was charted to capture the intricate interactions between biomarkers and TFs. Furthermore, the miRNet database (https://www.mirnet.ca/ ) was employed to predict miRNAs associated with the biomarkers.Immune microenvironment analysis
-
Immune infiltration analysis provided profound insights into intricate distribution and constitution of immune cells within the immune microenvironment, thereby guiding the refinement of immunotherapy strategies. Leveraging the ssGSEA algorithm within the 'GSVA' package (v 1.42.0)[26], we calculated the scores for 28 immune cell types in GSE221521. Later on, variations in immune cell enrichment scores between the DR and control samples were analyzed (p < 0.05). Furthermore, Spearman's correlation analysis was employed to delve into the potential associations between distinct immune cells and correlations between distinct immune cells and biomarkers (|r| > 0.3, p < 0.05). Moreover, expression differences in eight immunological activity-related genes[27] between the DR and control samples were assessed (p < 0.05).
RT-qPCR
-
For in-depth investigation of the role of biomarkers in DR, this study confirmed the expression of biomarkers by the RT-qPCR technique. Firstly, five pairs of frozen whole-blood samples were collected from the First Affiliated Hospital of Guangzhou Medical University, with five samples for the control and five samples for DR. The study adhered to the Declaration of Helsinki principles, and ethical approval was obtained from the Medical Ethical Committee of the First Affiliated Hospital of Guangzhou Medical University (ES-2024-155-01). All patients had signed an informed consent form. Subsequently, TRizol (Ambion, Austin, USA) was used to extract total RNA following the manufacturer's instructions, and 1 μL of RNA was used to detect the concentration of RNA using NanoPhotometer N50. Reverse transcription was employed to synthesize cDNA using the SweScript First Strand cDNA synthesis kit (Servicebio, Wuhan, China). Then, RT-qPCR amplification was carried out using the CFX96 real-time quantitative fluorescence PCR instrument, with the reaction program as follows: 1 min at 95 °C, 40 cycles at 95 °C for 20 s and 55 °C for 20 s, and 30 s at 72 °C. The primers designed for RT-qPCR are shown in Table 1. GAPDH was used as an internal reference gene. Gene expression levels were calculated using the 2−ΔΔCᴛ method. The results were visualized by Graphpad Prism 5 (GraphPad Software Inc., USA).
Table 1. Primers used for RT-qPCR.
Primers Sequences GPR52-F ATGACCGAAGAGCCCGATTC GPR52-R CGCTGTTGGAGAGGCTGTAT FKBP9-F AGATGCAGGGTGGGCTTTG FKBP9-R ATGCAAAGGAGTAGGCCCAG GAPDH-F CGAAGGTGGAGTCAACGGATTT GAPDH-R ATGGGTGGAATCATATTGGAAC Statistical analysis
-
R Studio program (v 4.2.2) was employed for statistical analysis. Differences between subgroups were analyzed via Wilcoxon's test; p < 0.05 was assumed to be statistically meaningful.
-
Altogether 2,752 DEGs between DR and control samples were recognized in GSE221521. Of these, 2,047 genes were upregulated while 705 genes were downregulated (Fig. 1a, b). Subsequently, we discovered that 13 of 35 MRGs were markedly distinct between the DR and control. ATF4, DDIT3, HDAC1, HSPA9, HSPD1, HSPE1, MRPS5, and SSBP1 showed dramatically lower expression in DR. On the contrary, CREBBP, EP300, ESR1, KDM6B and PHF8 were remarkably overexpressed in DR. These 13 genes were employed for subsequent analyses (Fig. 1c). It was evident that these 13 gene scores were substantially lower in DR (p < 0.05) (Fig. 1d). Thus, WGCNA was executed to obtain genes strongly associated with these 13 genes in GSE221521. Hierarchical clustering by the Euclidean distances of gene expression indicated that there were no significant outlier samples (Fig. 1e). The optimal soft threshold was 10 (R2 = 0.85) (Fig. 1f), and then 14 modules were confirmed based on dynamic tree cutting (Fig. 1g). Notably, the module with highest association with the MRGs score was MEyellow and MEgreen. MEyellow was strongly negatively correlated with the MRGs score (r = −0.53, p < 0.05) and MEgreen was highly positively correlated (r = 0.35, p < 0.05) (Fig. 1h). In total, 2,527 module genes were derived, and 226 candidate genes in total were identified by overlapping DEGs and key module genes (Fig. 2a). Candidate genes were enriched in 13 GO pathways (comprising 7 BP, 4 CC, and 2 MF) such as 'hemidesmosome assembly', 'hemidesmosome', and 'G protein-coupled receptor dimeric complex' along with six KEGG pathways such as 'phenylalanine metabolism' 'taste transduction', and 'endocrine resistance' (p < 0.05). The top 10 GO entries were highlighted (Fig. 2b, c). Notably, the PPI network revealed that MMP9 exhibited robust interactions with SCIN, SOX18, and PMEL (Fig. 2d). Afterwards, the top 30 genes of four algorithms (closeness, betweenness, bottleneck, and stress) were crossed, yielding 22 hub genes (Fig. 2e–i).
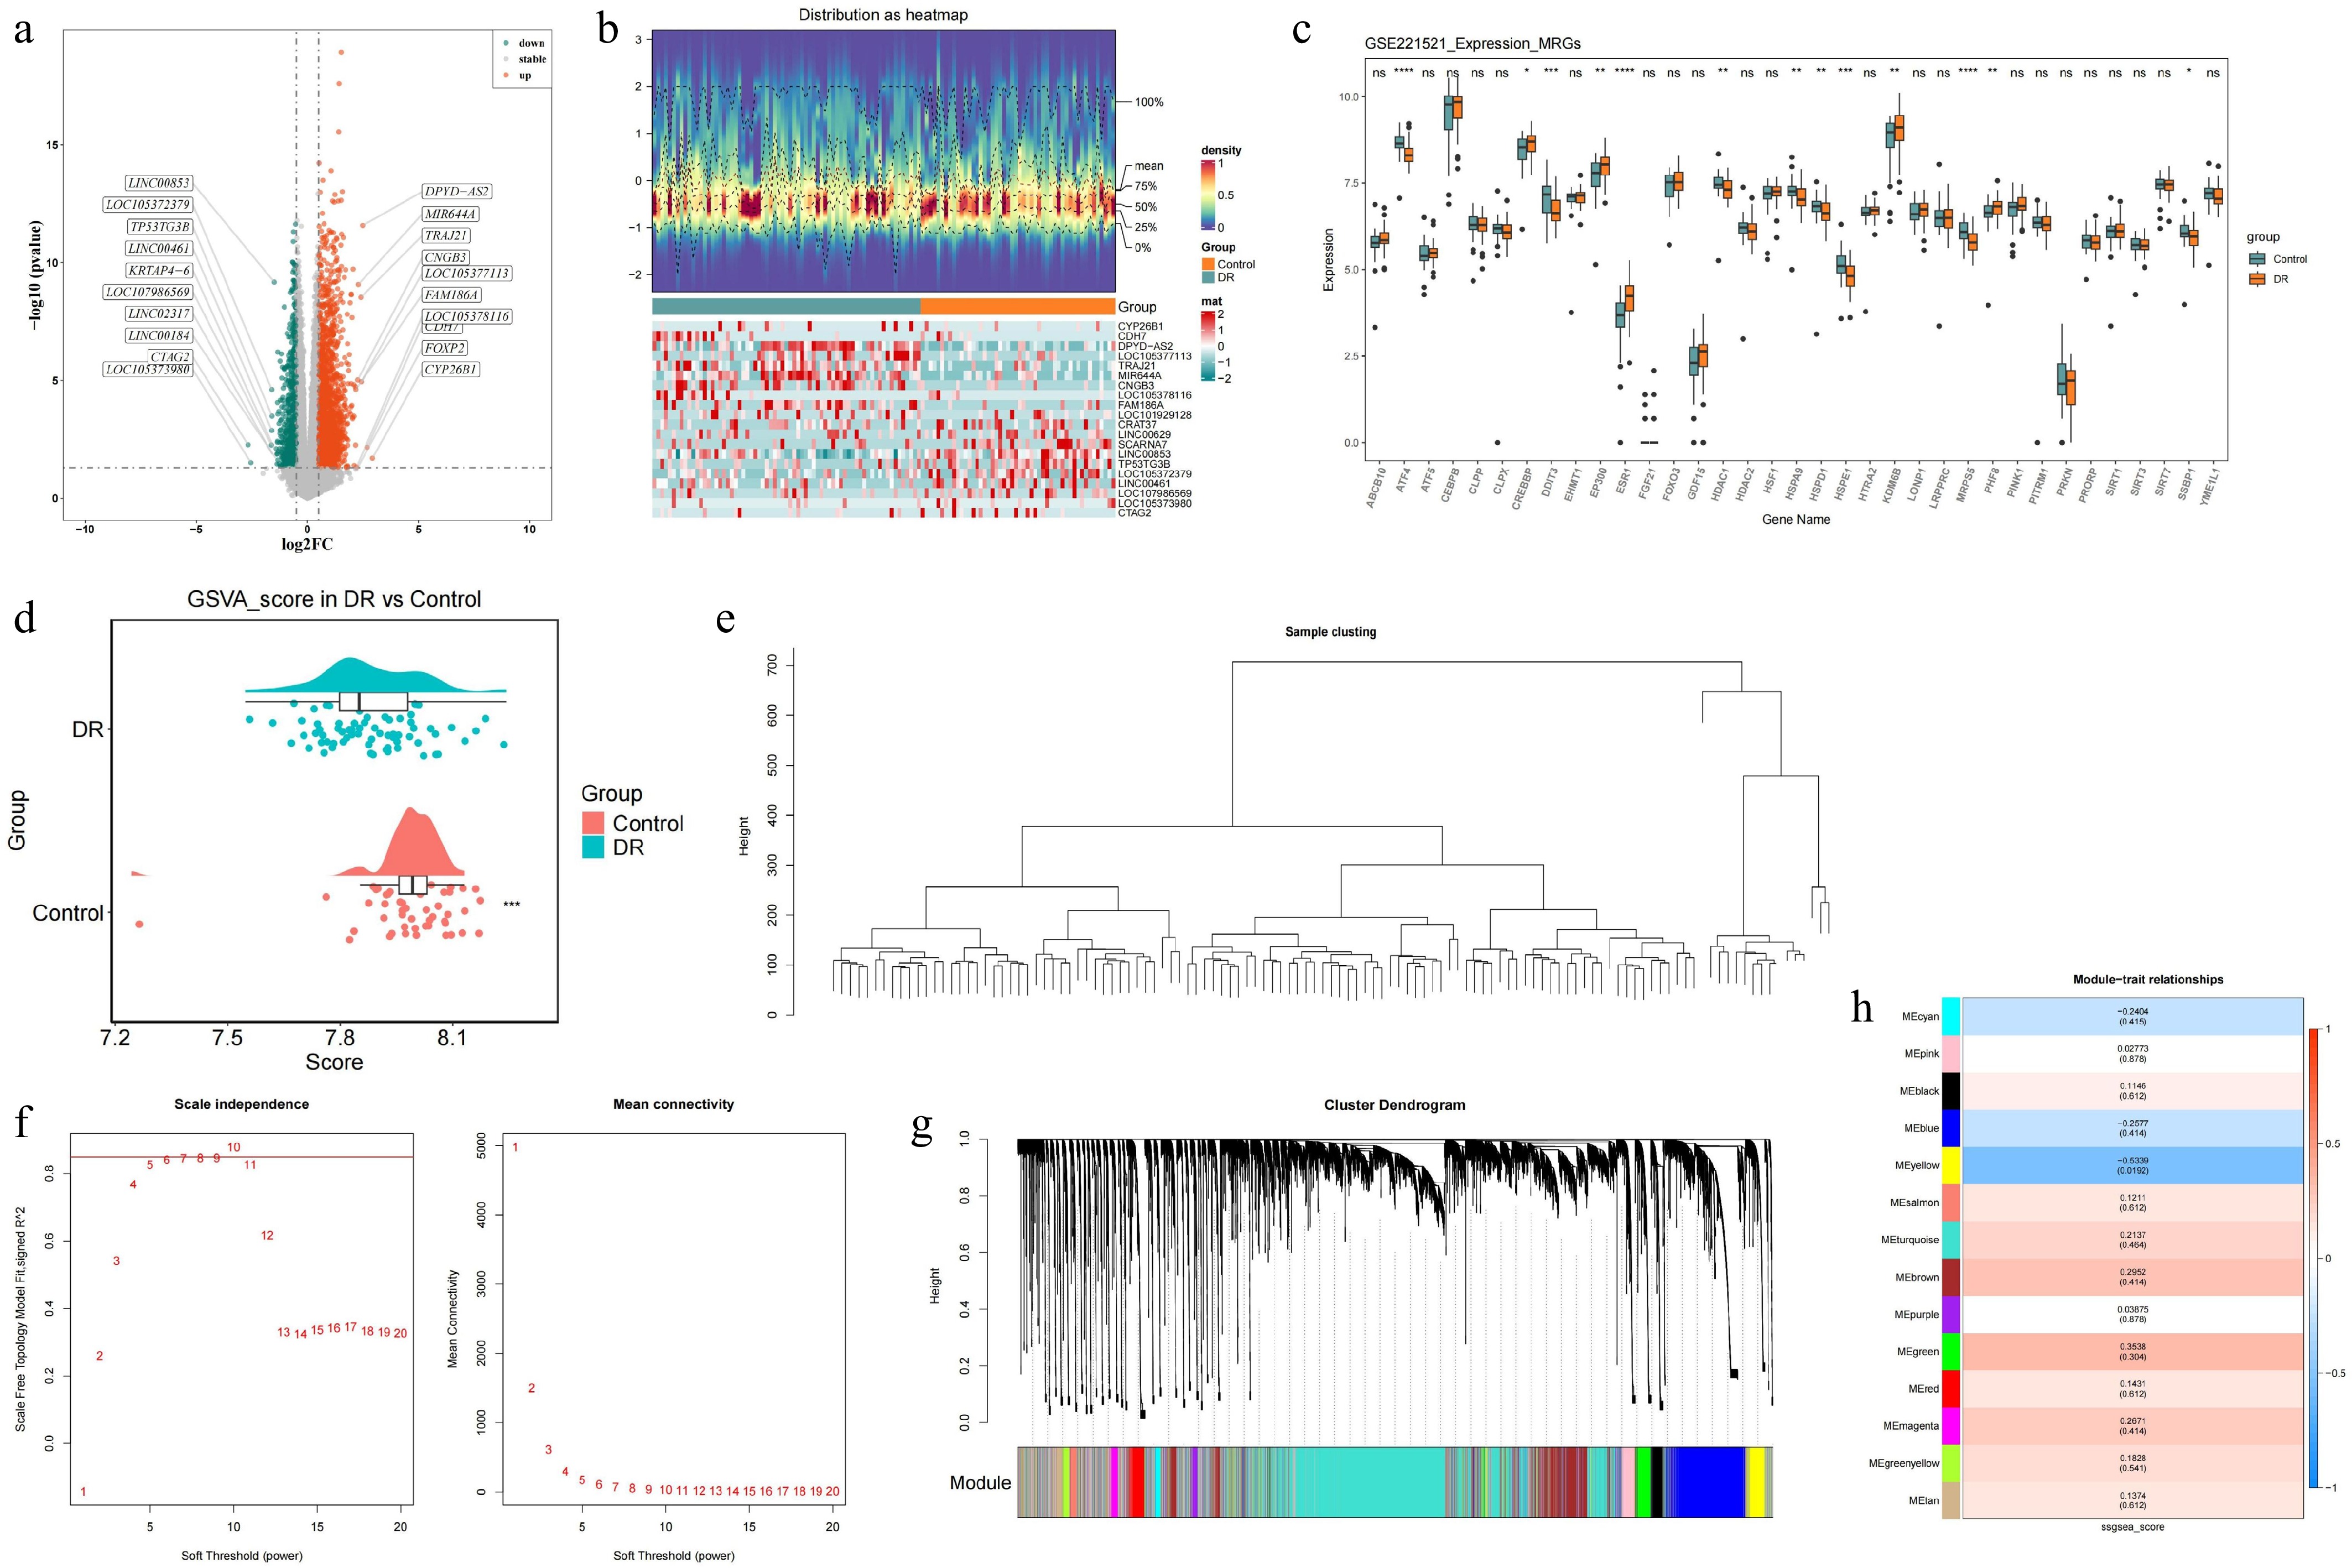
Figure 1.
Identification of DEGs in blood samples of DR patients and construction of the WGCNA co-expression network in GSE221521 (training set). (a) Volcano plot of the DEGs. (b) Heatmap of the DEGs. (c) The Wilcoxon test for MRGs. (d) Analysis of differences in ssGSEA scores for MRGs. (e) Hierarchical clustering by Euclidean distances of gene expression. (f) Analysis of the scale-free fit index and the mean connectivity for different soft thresholding powers. (g) Dendrogram of differentially expressed genes clustered according to a dissimilarity measure. (h) Heatmap of correlations between different modules and clinical traits.ns p-value > 0.05, * p-value < 0.05, ** p-value < 0.01, *** p-value < 0.001, **** p-value < 0.0001.
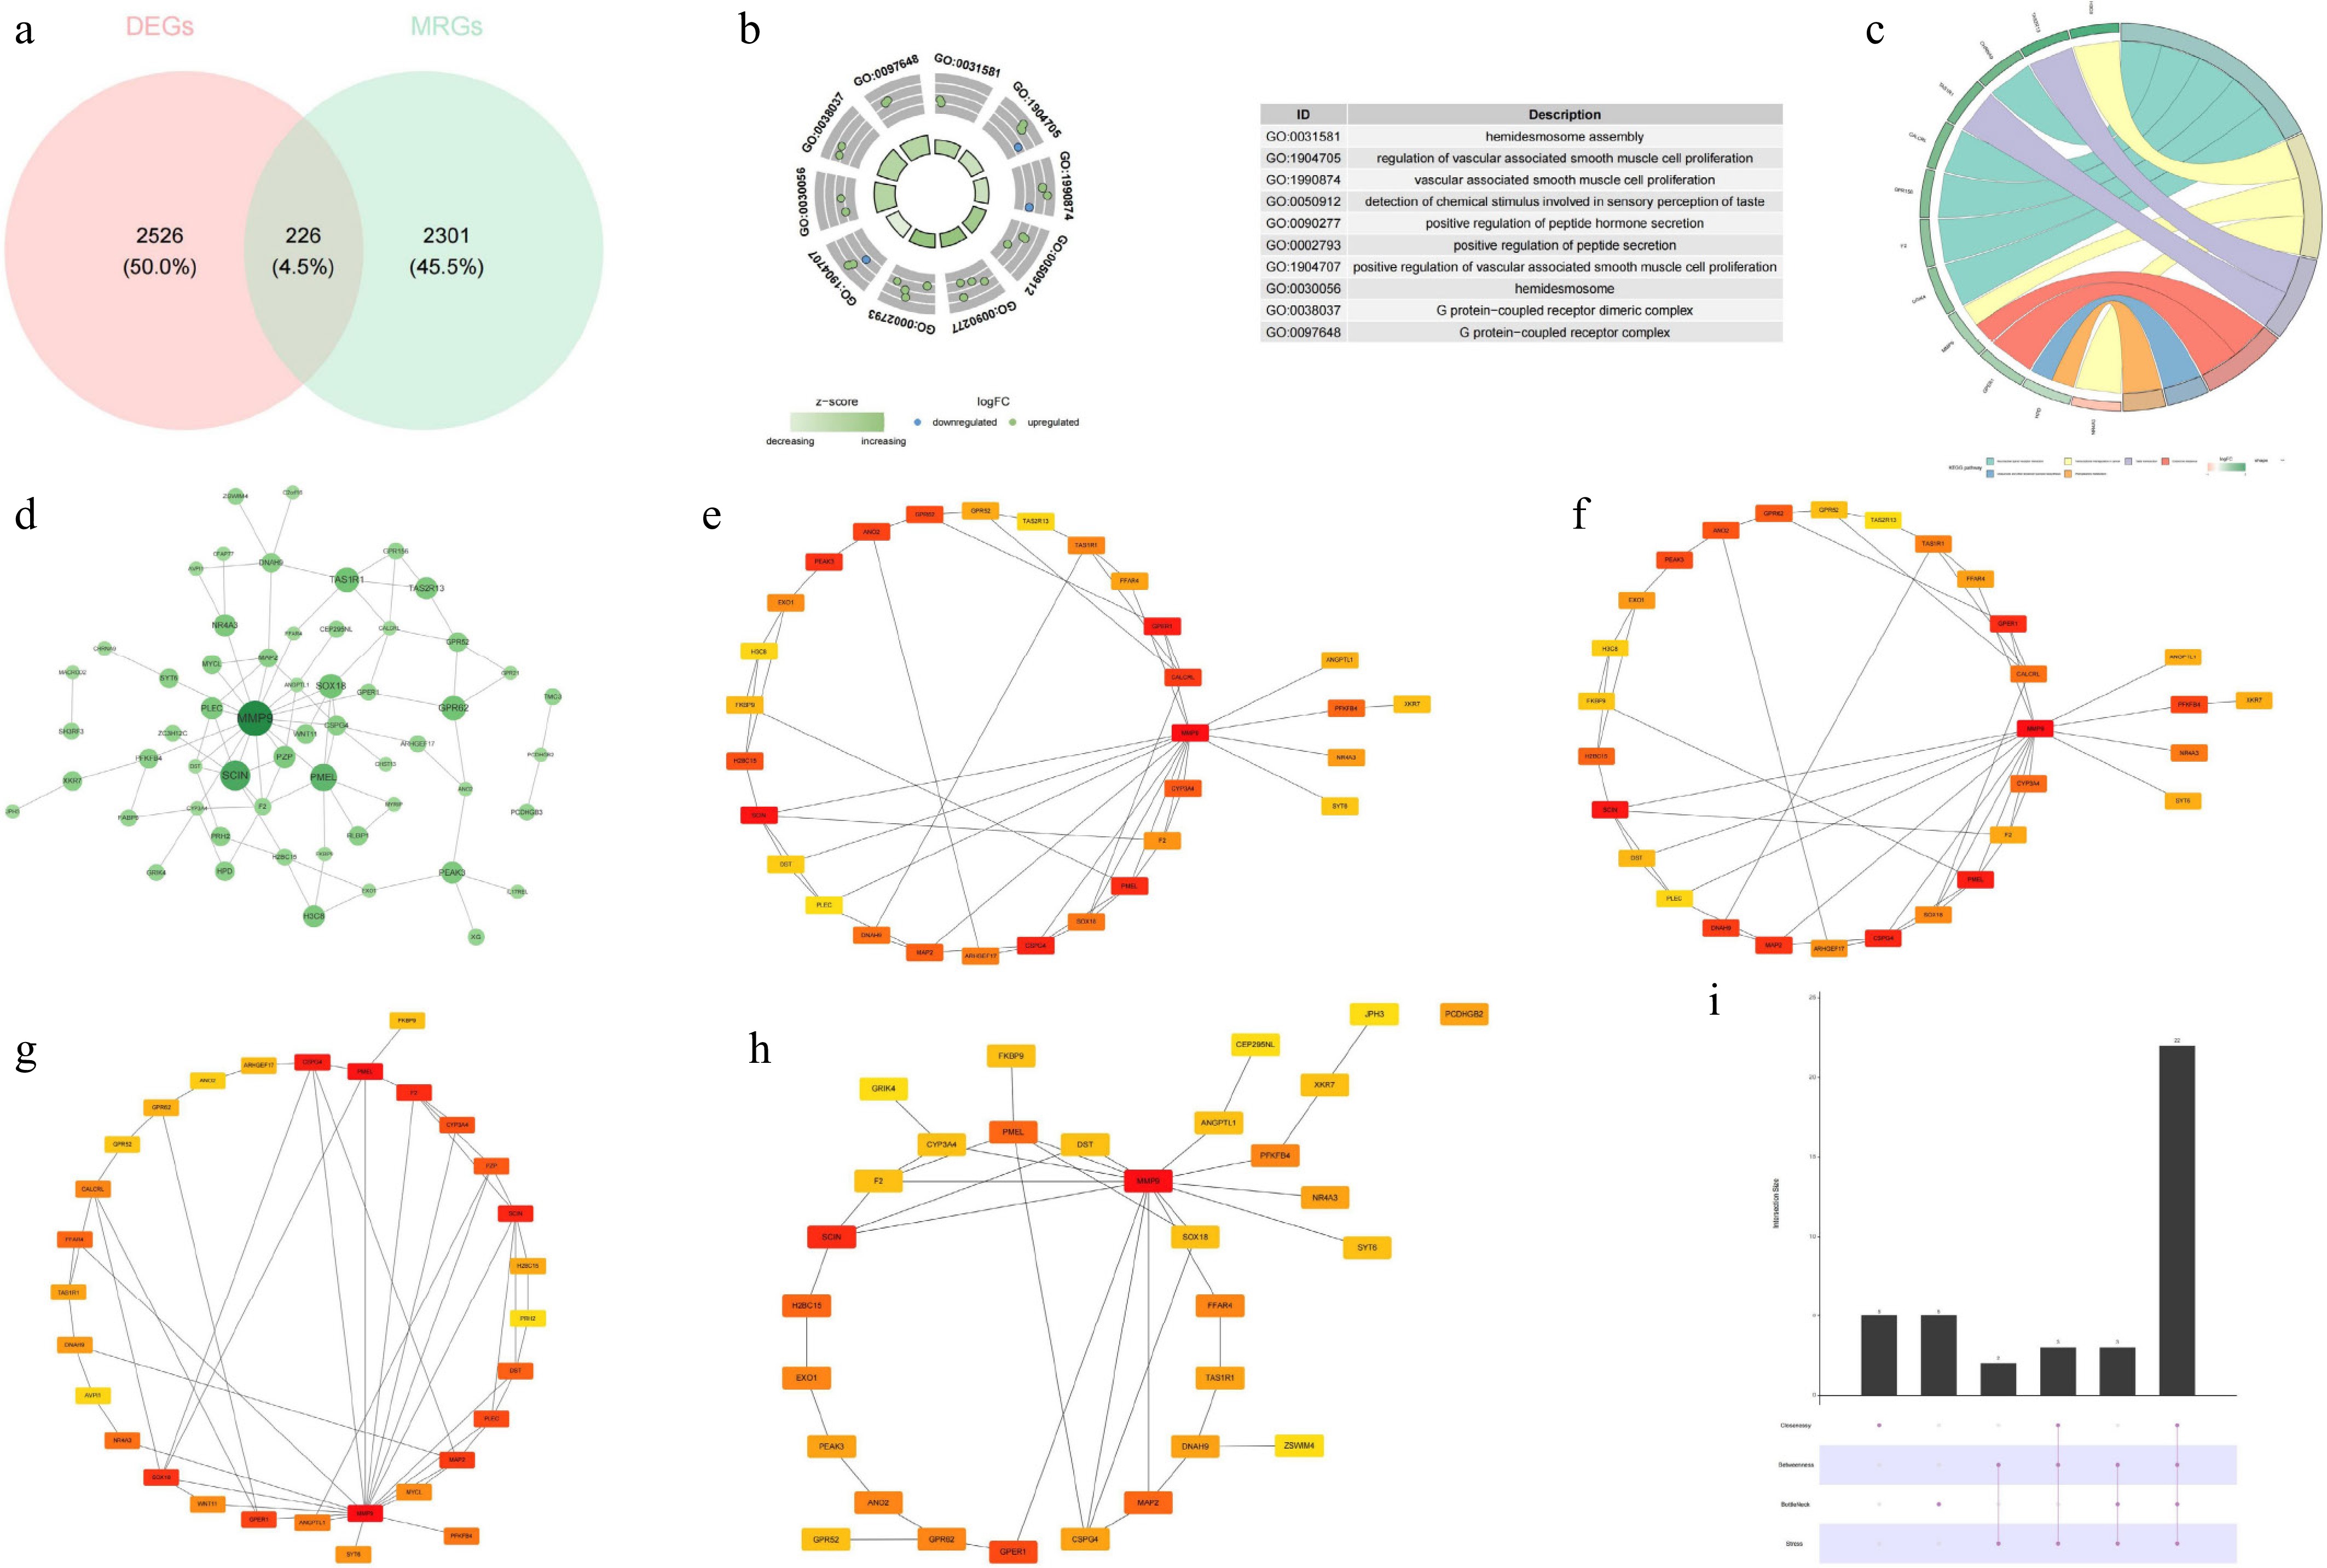
Figure 2.
Identification of candidate genes, GO–KEGG enrichment analysis, and constructin of the PPI network. (a) Venn diagram of the candidate genes. (b) GO enrichment analysis. (c) KEGG enrichment analysis. (d) PPI network of the candidate genes. (e) Top 30 hub genes identified by the closeness algorithm. (f) Top 30 hub genes identified by the betweenness algorithm. (g) Top 30 hub genes identified by the bottleneck algorithm. (h) Top 30 hub genes identified by the stress algorithm. (i) UpSet plot showing the intersection of the top 30 hub genes identified by the four algorithms.
GPR52 and FKBP9 are viewed as biomarkers
-
Based on 22 hub genes, 11 feature genes were retrieved after random forest analysis, namely MMP9, PMEL, CSPG4, SOX18, DST, NR4A3, PFKFB4, H2BC15, GPR62, FKBP9, and GPR52 (Fig. 3a). Subsequently, the expression profiles of these feature genes revealed that GPR52 and FKBP9 showed a consistent trend of remarkably higher expression in DR (p < 0.05) (Fig. 3b, c). ROC analysis conclusively revealed that in GSE221521, the AUC values for both GPR52 and FKBP9 were 0.7. In GSE189005, the AUC values for both GPR52 and FKBP9 were 0.8, indicating their diagnostic potential (Fig. 3d, e). Consequently, GPR52 and FKBP9 were identified as biomarkers.
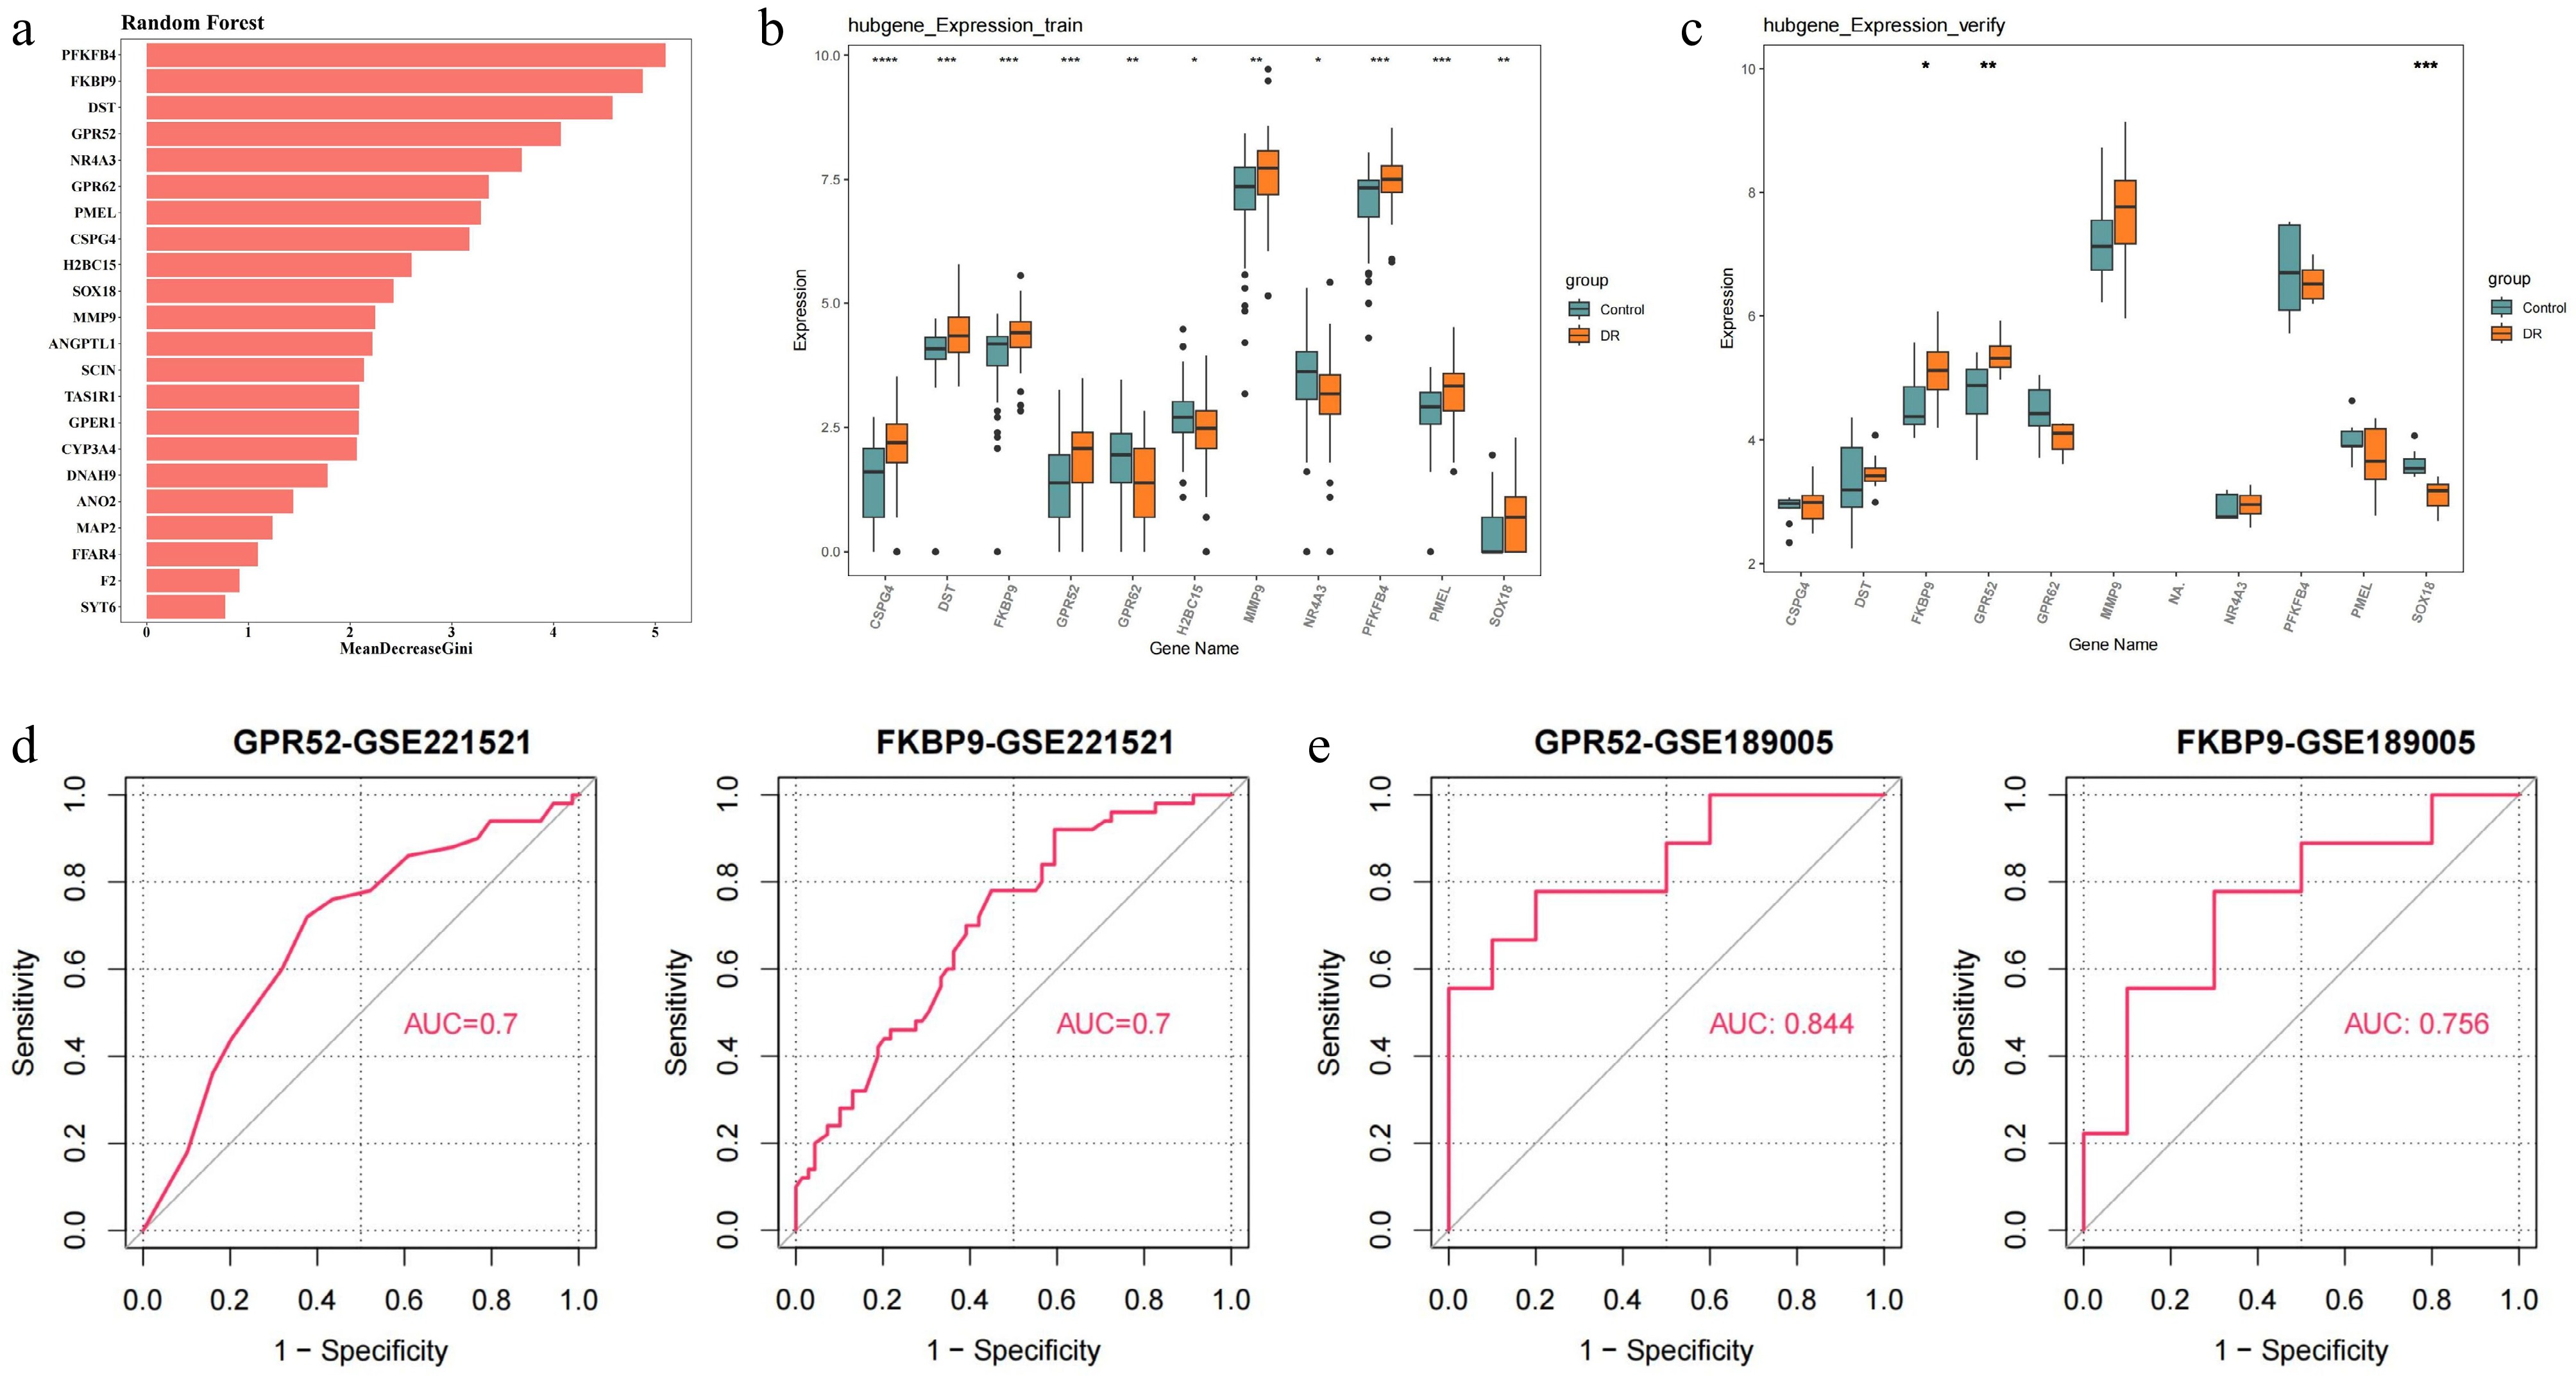
Figure 3.
Identification and validation of candidate feature genes. (a) Random forest analysis. (b) The expression of candidate feature genes in training dataset (GSE221521). (c) The expression of candidate feature genes in validation dataset (GSE189005). (d) ROC curves of feature genes in the training dataset. (e) ROC curves of feature genes in the validation dataset. * p-value < 0.05, ** p-value < 0.01, *** p-value < 0.001, **** p-value < 0.0001.
Nomogram and pathway analysis of GPR52 and FKBP9
-
Nomogram was constructed based on biomarkers. In this nomogram, an intricate scoring methodology was formulated, leveraging the expression intensities of biomarkers within the training cohort. Each constituent factor was allocated a point, and the aggregate summation of these points across diverse factors constituted the total point tally. Subsequently, this comprehensive point score served as the basis for predicting the probability of a DR diagnosis, where elevated scores were indicative of an increased probability of DR's occurrence (Fig. 4a). The calibration curve (p-value for the HL goodness-of-fit test = 0.098) exemplified the outstanding predictive capability of the nomograms in forecasting DR (Fig. 4b). Furthermore, DCA underscored the commendable clinical applicability of the nomograms, signifying its significant referential value (Fig. 4c). Afterwards, receiver operating characteristic (ROC) curves were established to evaluate predictive exactness of the nomograms. The outcomes unequivocally demonstrated that the nomograms offered excellent diagnostic accuracy (AUC = 0.763) (Fig. 4d). Additionally, GSEA displayed that GPR52 was dramatically enriched in the 'phosphatidylinositol signaling system', 'insulin signaling pathway', 'ubiquitin mediated proteolysis', 'inositol phosphate metabolism', and 'T cell receptor signaling' pathways (adjusted p < 0.05) (Fig. 4e). FKBP9 was markedly enriched in 'apoptosis', 'neurotrophin signaling pathway', 'Fc gamma R-mediated phagocytosis', 'B cell receptor signaling pathway', and 'Toll-like receptor signaling pathway' (adjusted p < 0.05) (Fig. 4f).
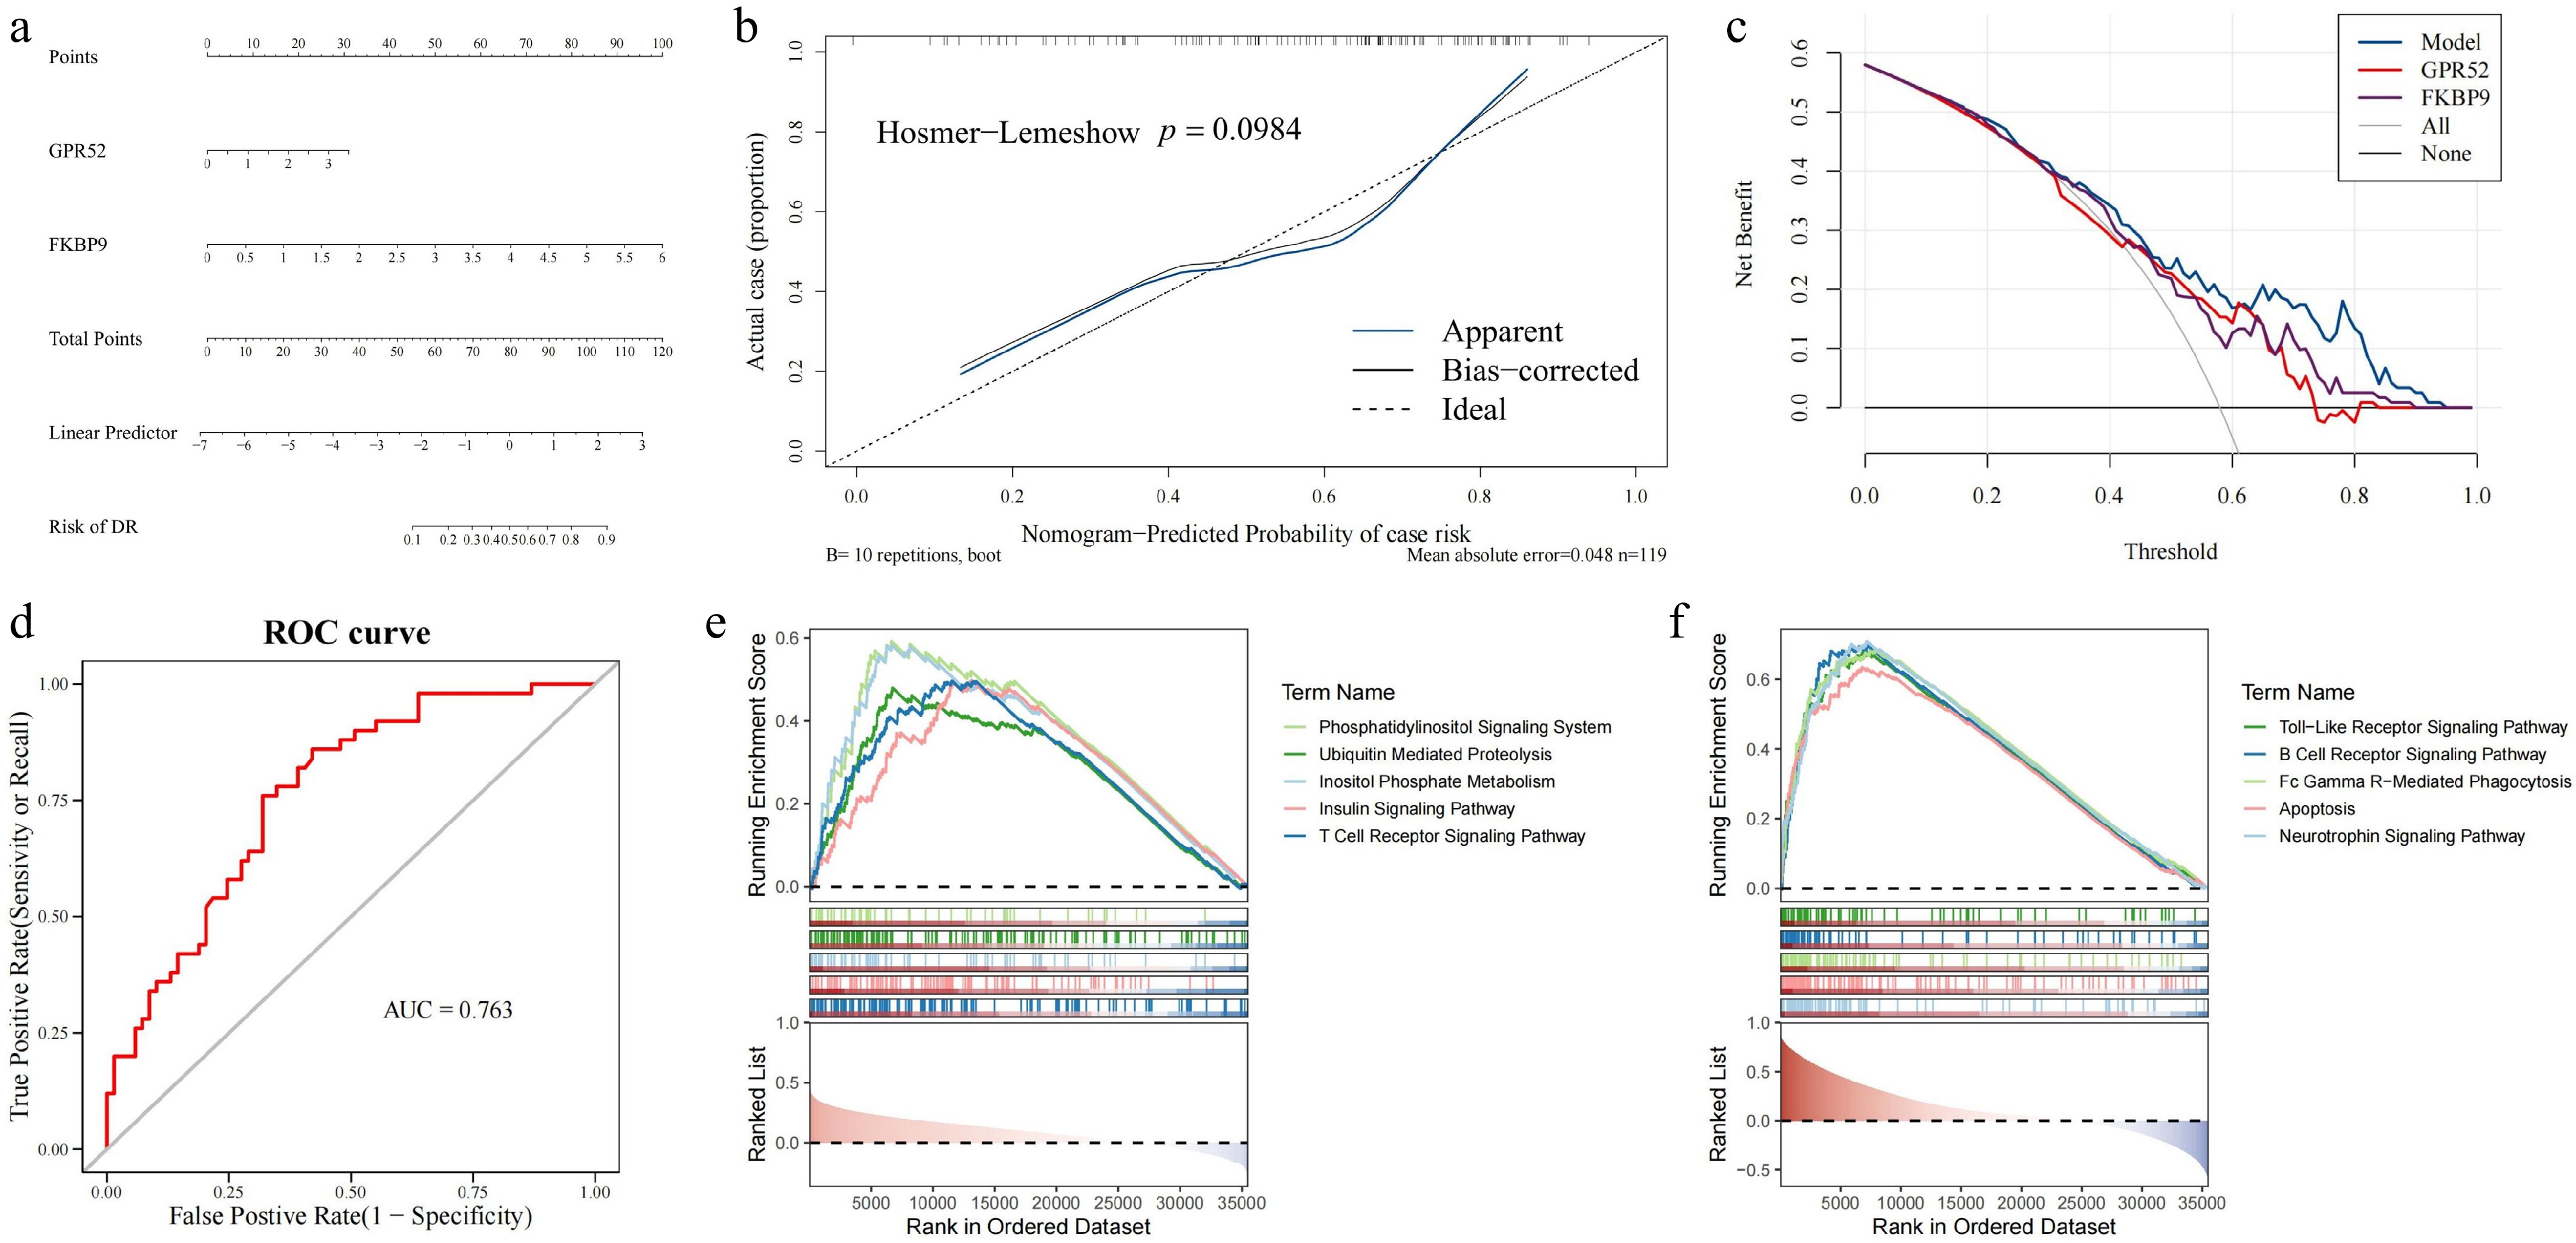
Figure 4.
Construction of the DR diagnosis nomogram and GSEA enrichment analysis for GPR52 and FKBP9. (a) The nomogram for predicting the risk of DR with GPR52 and FKBP9. (b) Calibration curves of the DR prediction nomogram. (c) The decision curve analysis of the nomogram. (d) The ROC curve of the nomogram. (e) GSEA enrichment analysis of GPR52. (f) GSEA enrichment analysis of FKBP9.
Establishing regulatory networks to investigate the underlying mechanisms of biomarkers
-
Twelve diseases are considered to be associated with GPR52 (inference scores ≥ 20), while eight diseases were strongly linked to FKBP9 (inference scores ≥ 100). Among these, hepatomegaly, prenatal exposure delayed effects, chemical- and drug-induced liver injury, and kidney diseases are four diseases collectively connected to both biomarkers (Fig. 5a). Furthermore, 15 drugs were identified as having a potential relationship with FKBP9 and 8 drugs were connected to GPR52 (interaction scores ≥ 2). Both biomarkers were targets of folic acid (Fig. 5b). For further elucidating the molecular mechanisms underlying the drug–biomarker interactions, molecular docking was conducted for FKBP9–bisphenol A, FKBP9–tetrachlorodibenzodioxin, and GPR52–ethinyl estradiol. Their binding energies were −6.1, −5.0, and −8.7 kcal/mol, respectively, indicating stable and robust binding interactions. Additionally, the key residues were HIS-87, GLN-53, and ASN-101/THR-1012, respectively. The resulting complexes are displayed in Fig. 5c–e, with certain binding sites highlighted. We then forecasted the top 10 TFs that might regulate biomarkers, including TWIST2, ZGPAT, ANHX, ATF6, EEA1, LYL1, IKZF2, SPI1, ZBTB32, and POU2F2 (Fig. 5f). The heatmap illustrated the TFs predicted by different databases, including the ENCODE, ReMap, GTEx, Enrichr, and ARCHS4 databases (Fig. 5g). FKBP9 was predicted to be regulated by 103 TFs, while GPR52 was associated with 16 TFs. Notably, POU2F1 emerged as a common regulator of both GPR52 and FKBP9 (Fig. 5h). More fundamentally, 61 miRNAs regulating FKBP9 and 3 miRNAs (hsa-mir-3928-3p, hsa-mir-27a-3p, and hsa-mir-3657) that might affect GPR52 were derived. The outcomes revealed that hsa-let-7e-5p regulated FKBP9, and hsa-mir-3657 mediated GPR52 (Fig. 5i).
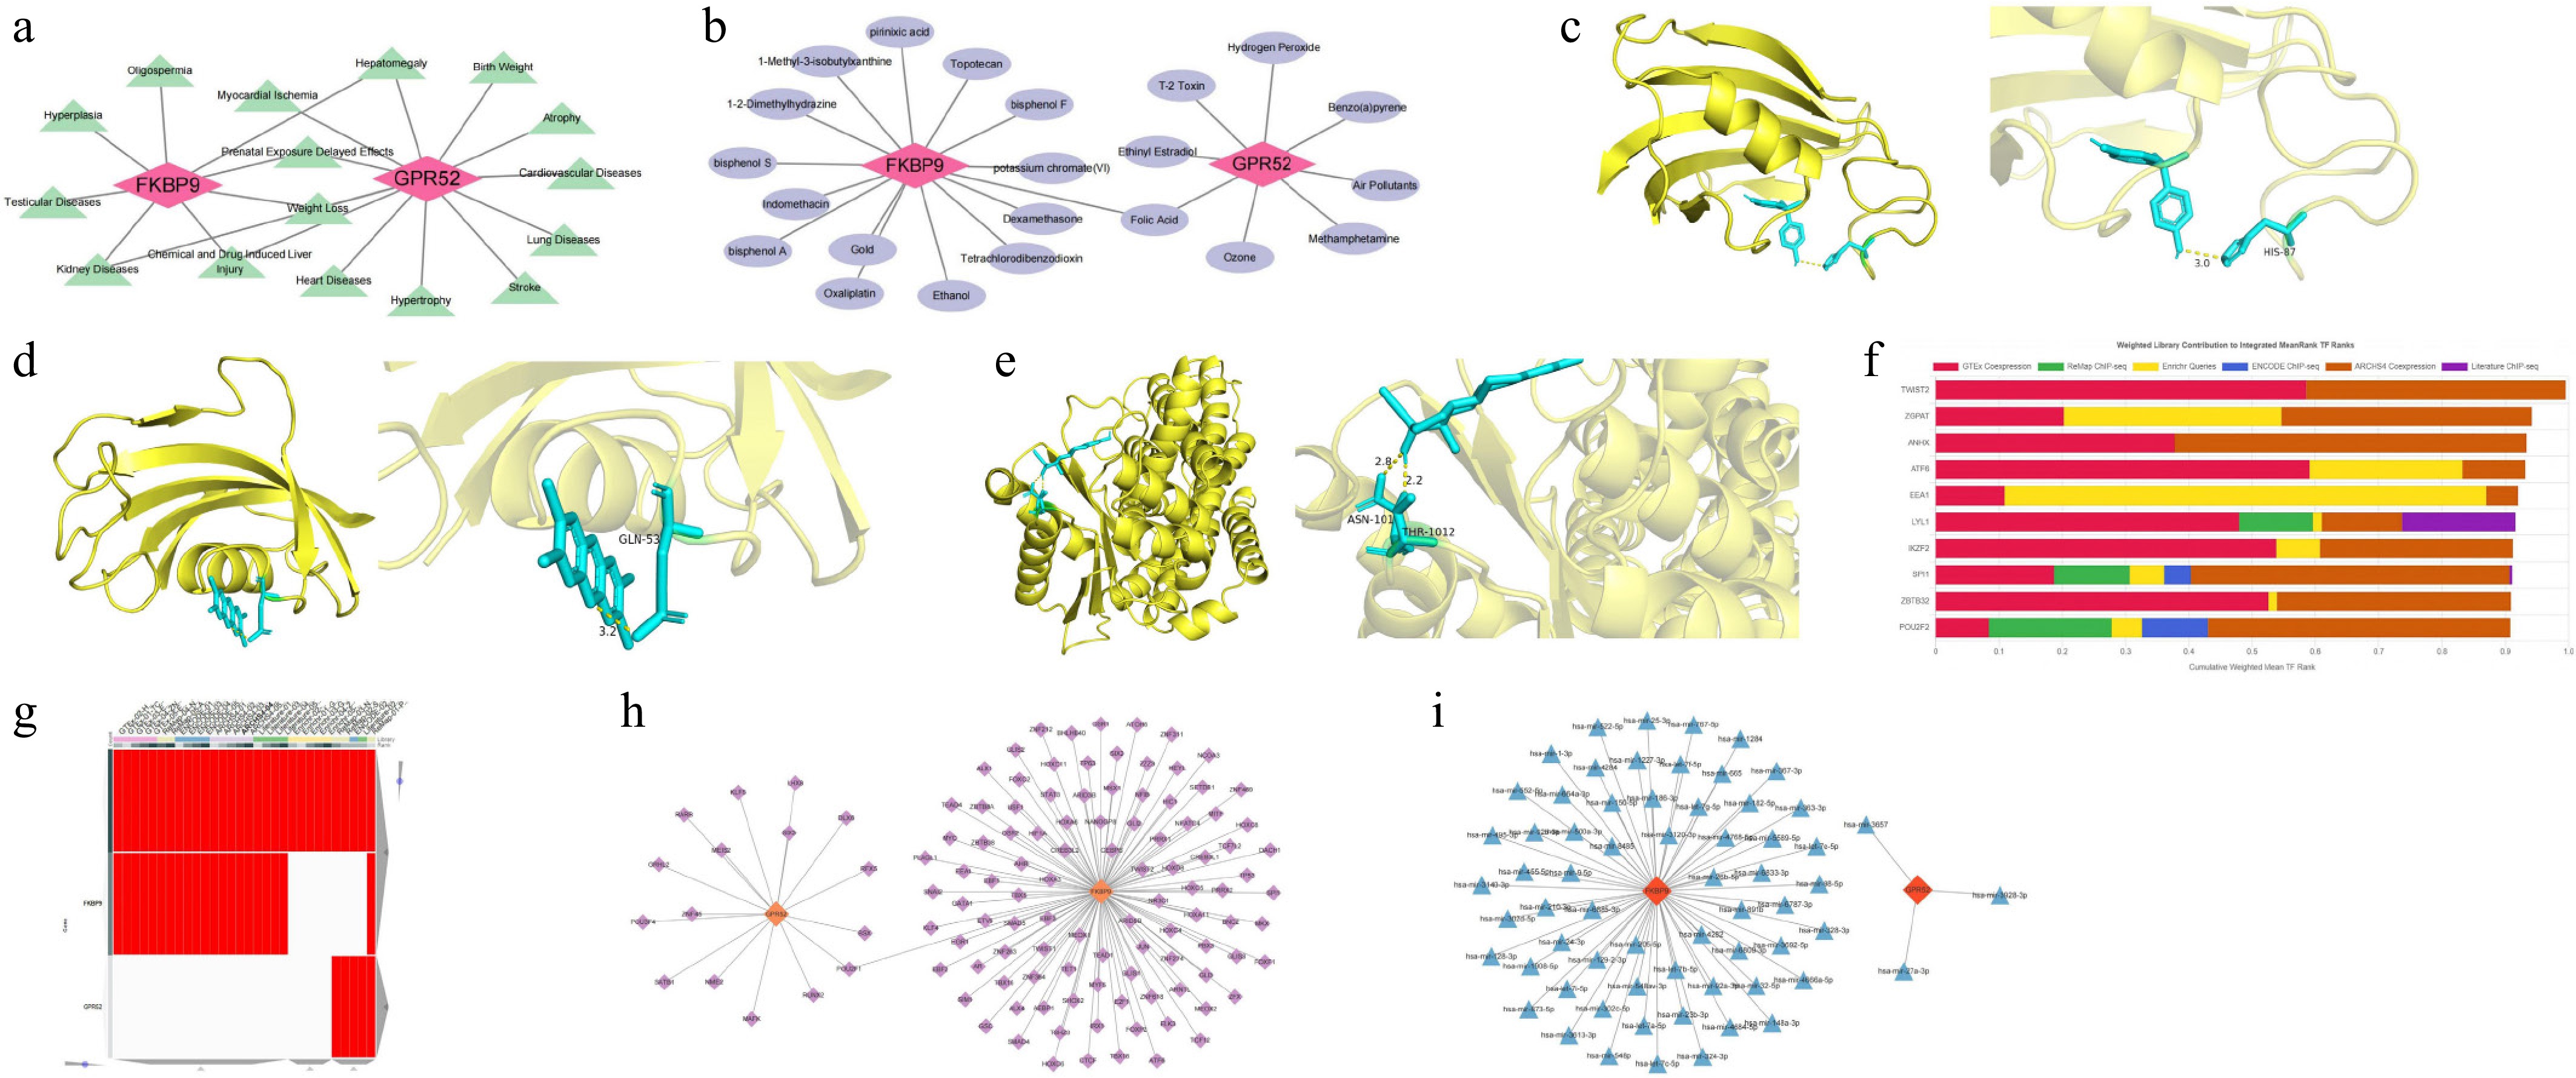
Figure 5.
Potential molecular mechanisms and regulatory networks of GPR52 and FKBP9. (a) Correlations between the biomarkers and clinical disease. (b) Drug–target network of the biomarkers. (c) Molecular docking model of FKBP9 and bisphenol A. (d) Molecular docking model of FKBP9 and tetrachlorodibenzodioxin. (e) Molecular docking model of GPR52 and ethinyl estradiol. (f) Top 10 TFs identified by the ChEA3 database. (g) The heatmap of TFs predicted by different databases (ENCODE, ReMap, GTEx, Enrichr, and ARCHS4). (h) TF–biomarker regulatory network. (i) miRNA–biomarker regulatory network.
Biomarkers played a key role in regulating immune cell function
-
Immune infiltration analysis was performed to identify immune cells that played a crucial role in DR. The profile of of immune cells in DR and the control is depicted in Fig. 6a. After that, the scores of activated CD4 T cells, activated CD8 T cells, central memory CD4 T cells, effector memeory CD8 T cells, natural killer cells (NK cells), Type 1 T helper cells, and Type 17 T helper cells were considerably lower in DR (p < 0.05) (Fig. 6b). Among these, activated CD8 T cells exhibited most prominent positive correlation with effector memeory CD8 T cells (r = 0.69, p < 0.05) (Fig. 6c). Intriguingly, FKBP9 displayed a negative correlation with activated CD8 T cells (r = –0.64, p < 0.001). FKBP9 and NK cells were strongly correlated (r = 0.27, p < 0.05) (Fig. 6d). Furthermore, the expression of specific immunological activity-related genes exhibited significantly different expression between DR and the control. CXCL9 was upregulated in DR, while GZMA was downregulated (p < 0.05) (Fig. 6e).
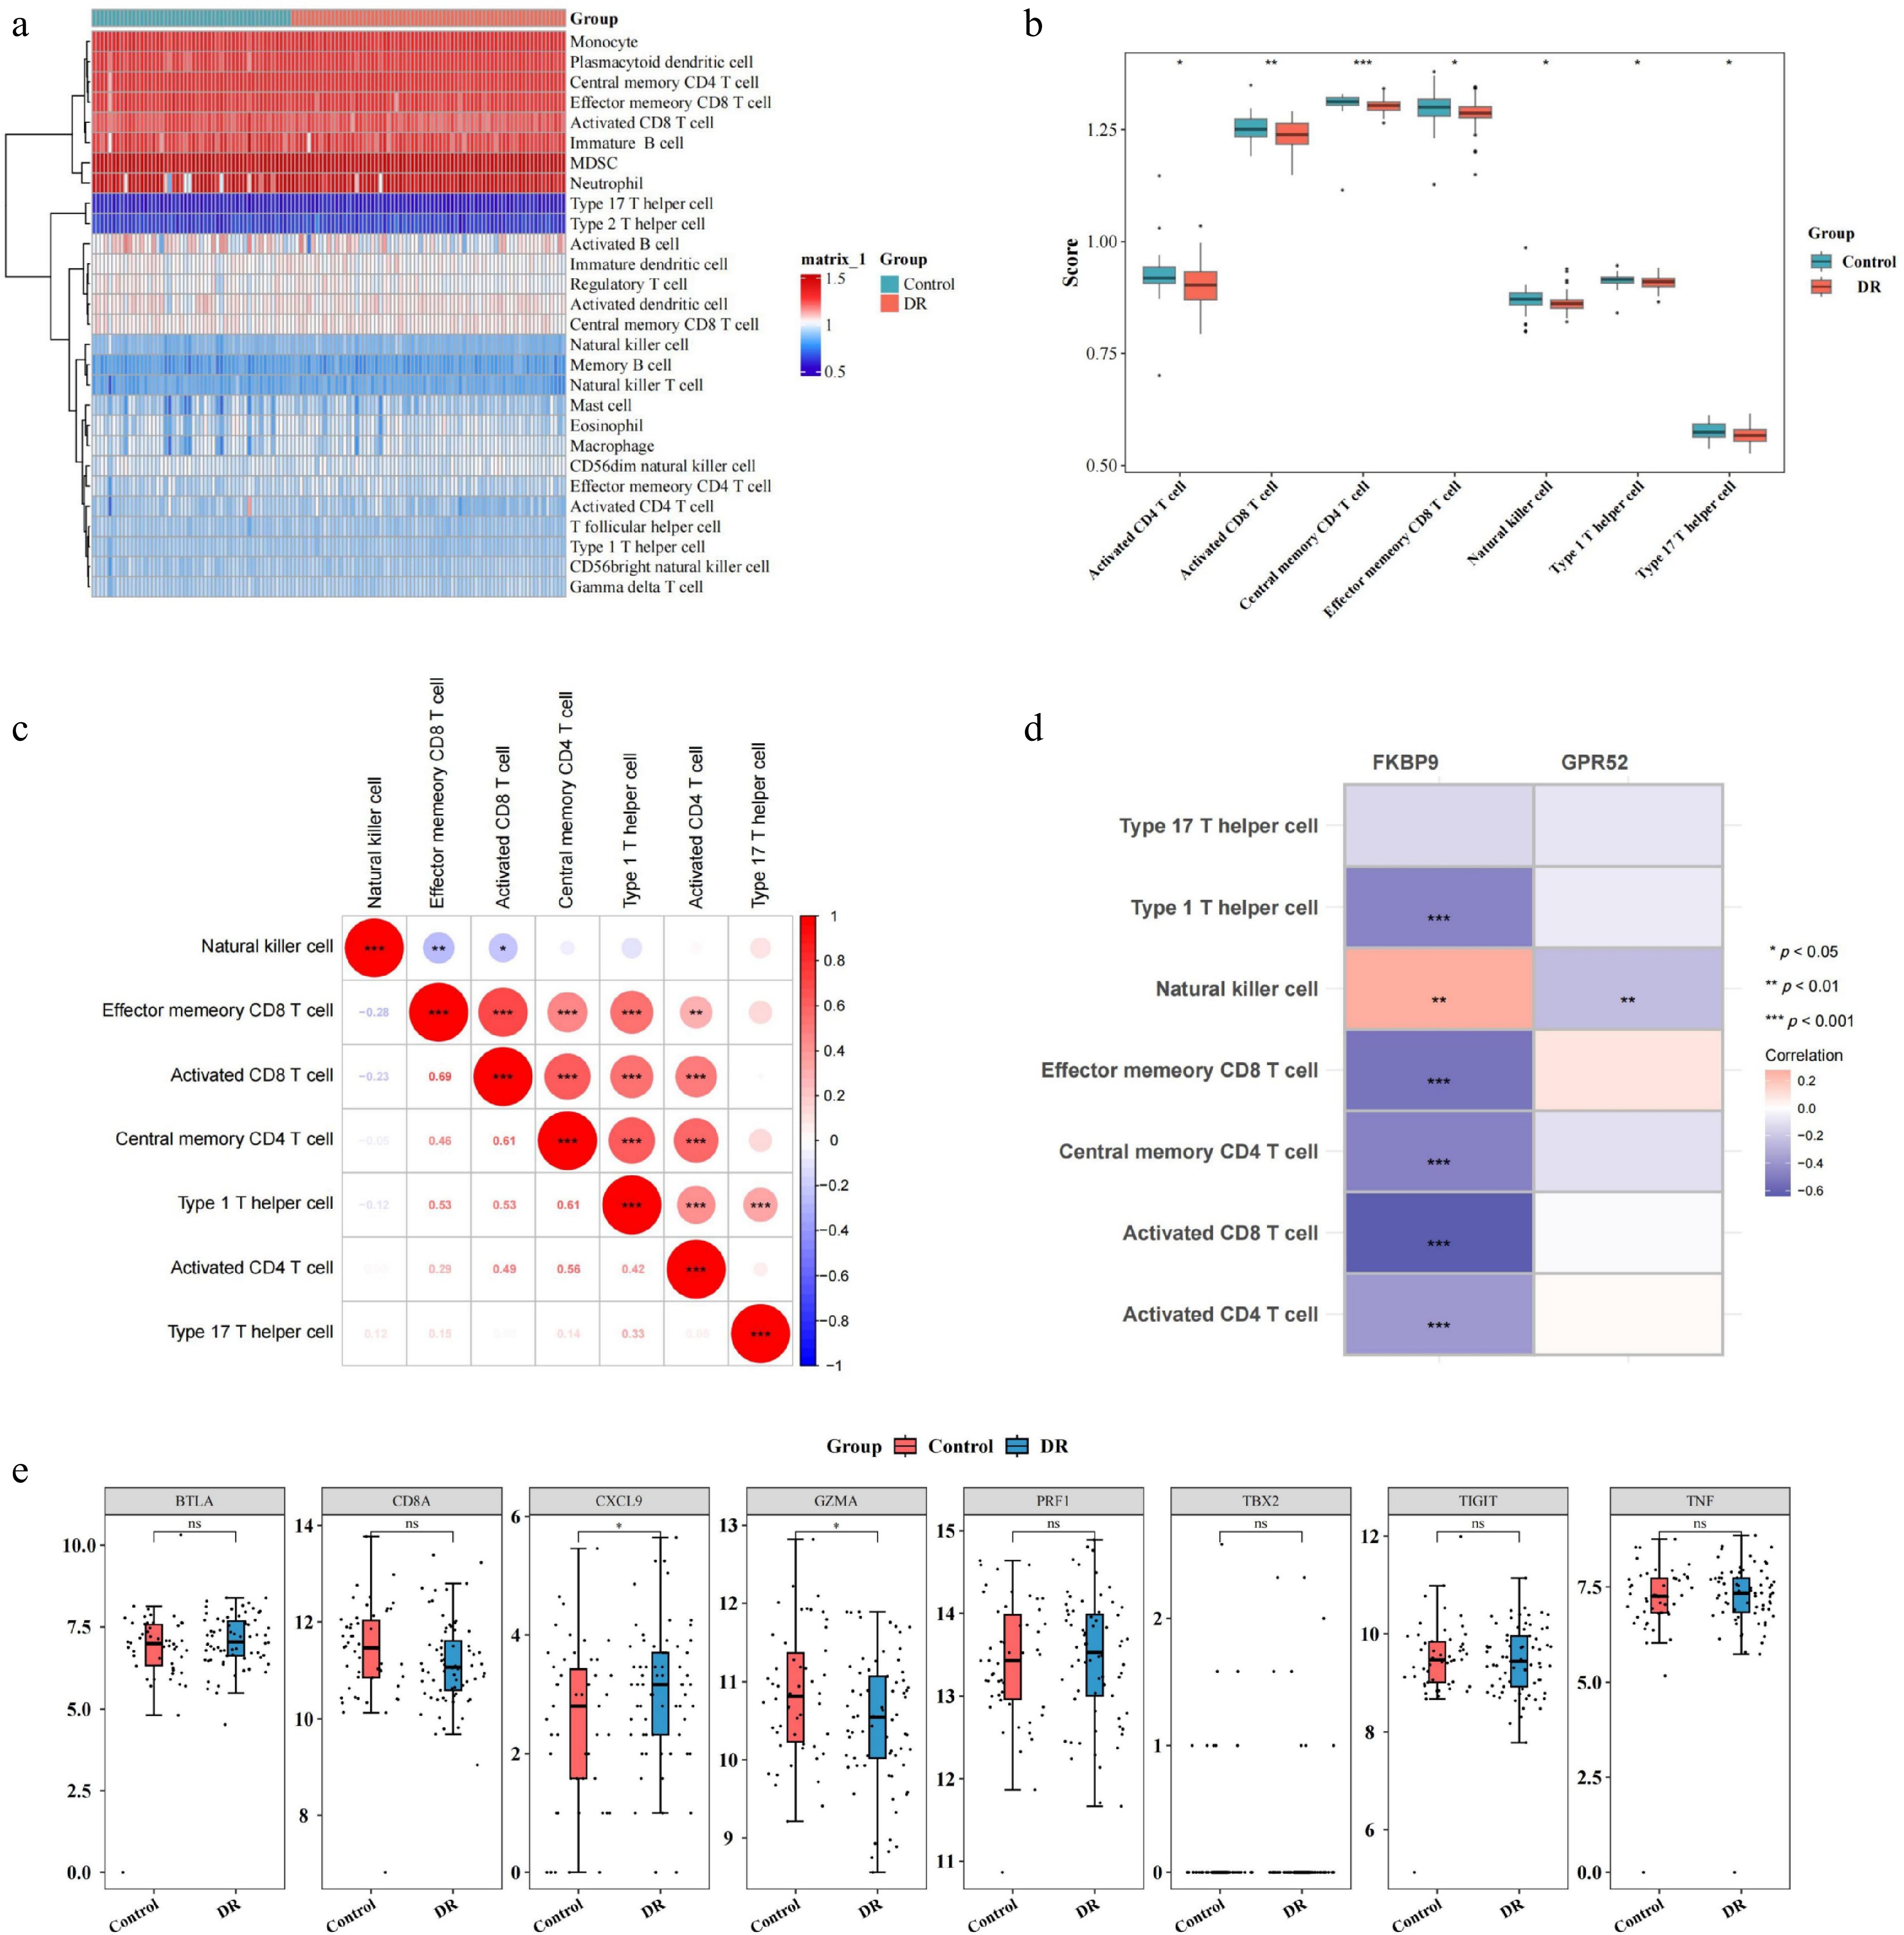
Figure 6.
Relationship between two biomarkers (GPR52 and FKBP9) and immune cell infiltration. (a) Heatmap of immune cell infiltration in the DR and control groups. (b) Differences in infiltrated immune cells between the DR and control groups. (c) Correlation analysis between immune cells. (d) Correlation between differentially infiltrated immune cells and biomarkers. (e) Differences in the expression of specific immunological activity-related genes between the DR and control groups. * p-value < 0.05, ** p-value < 0.01, *** p-value < 0.001.
RT-qPCR analysis of biomarkers
-
The RT-qPCR detected the expression patterns of GPR52 and FKBP9 in the control and DR groups to confirm the transcriptomic sequencing results. The qPCR analysis revealed a significant upregulation of the expression of both GPR52 and FKBP9 in the DR group (p < 0.05) (Fig. 7a, b), which was consistent with previous analyses.
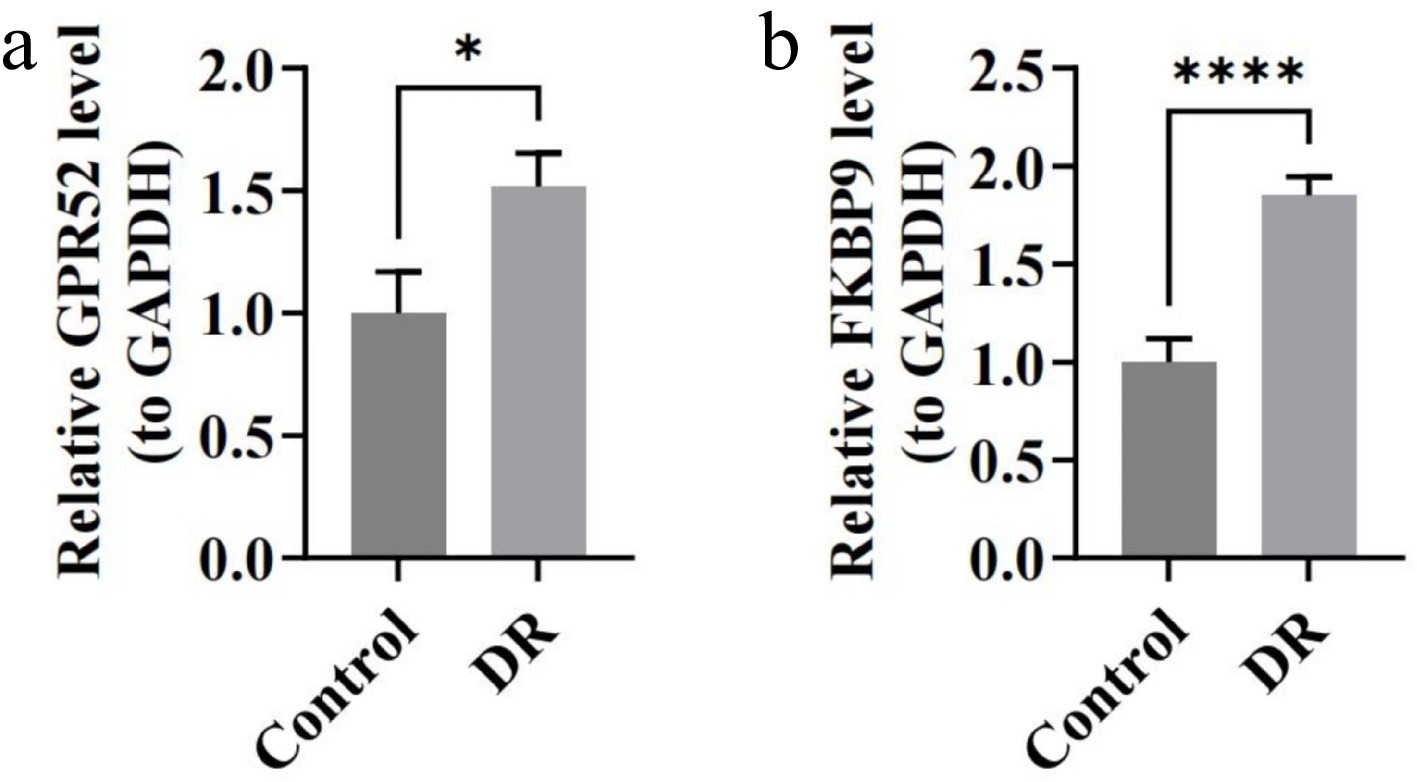
Figure 7.
The expression of biomarkers in blood samples of DR patients by RT-qPCR. (a) Relative expression of GPR52. (b) Relative expression of FKBP9. * p < 0.05, **** p-value < 0.0001.
-
DR is a complex disease driven by hyperglycemia-induced oxidative stress, metabolic disturbances, and chronic inflammation[28]. The UPRmt has recently emerged as a key mechanism for maintaining mitochondrial quality and regulating cellular stress. While its importance in diabetes has been acknowledged, its specific role in DR remains poorly understood[29]. In this study, we conducted a series of bioinformatic analyses and identified two UPRmt-related biomarkers, GPR52 and FKBP9, in DR. Their elevated expression levels were further validated in blood samples from DR patients. This finding suggests that UPRmt may become dysregulated in the chronic hyperglycemic retinal environment, potentially exacerbating retinal damage through the metabolic, immune, and inflammatory pathways. This finding is consistent with the observations reported by Liu et al.[29], who reported that in diabetic nephropathy, UPRmt initially provides protection by reducing reactive oxygen species (ROS) production and apoptosis, but prolonged activation may lead to ROS accumulation, increased inflammatory factor expression, and aggravated cellular injury. These results imply that UPRmt may exhibit a biphasic effect in DR.
GPR52 is an orphan G-protein-coupled receptor (GPCR) that has garnered significant attention due to its potential therapeutic implications, particularly in neuropsychiatric disorders such as Huntington's disease and schizophrenia[30−32]. This study is the first to report the significant overexpression of GPR52 in DR patients. GSEA identified that GPR52 is enriched in the phosphatidylinositol signaling pathway, the insulin signaling pathway, and the T cell receptor signaling pathway, suggesting its involvement in multiple mechanisms contributing to DR's progression. Within the phosphatidylinositol signaling cascade, GPR52 potentially activates the PI3K/Akt pathway, thereby enhancing the expression of vascular endothelial growth factor (VEGF). This mechanism may contribute to endothelial cell survival and mitigate oxidative stress during the initial phases of DR. However, in advanced stages, elevated VEGF levels can exacerbate neovascularization and retinal leakage[33,34]. Similarly, in the insulin signaling pathway, GPR52 may enhance insulin receptor activity, helping to stabilize the blood–retinal barrier and reduce microvascular leakage. However, prolonged activation could disrupt metabolic balance and worsen microvascular damage[35,36]. Furthermore, GPR52's involvement in the T cell receptor signaling pathway indicates a potential role in amplifying inflammatory responses by facilitating T cell activation and the release of cytokines such as TNF-α and IL-1β, destabilizing the retinal microenvironment[37]. In addition to these pathways, GPR52 is implicated in metabolic regulation, including fatty acid biosynthesis and insulin sensitivity, which may influence the retinal metabolic environment in DR[38]. Collectively, these findings suggest a dual role for GPR52: providing metabolic and vascular protection in the early stages of DR but driving inflammation and vascular abnormalities in later stages, ultimately exacerbating disease progression. Further studies are needed to investigate and confirm these potential mechanisms in depth.
FKBP9, a molecular chaperone belonging to the FK506-binding protein family, has been linked to the modulation of endoplasmic reticulum (ER) stress and is implicated in various malignancies[39]. This study is the first to have demonstrated its significance in DR, particularly its association with UPRmt-related signaling pathways. GSEA analysis revealed that FKBP9 is significantly enriched in the Toll-like receptor signaling pathway and the neurotrophin signaling pathway, both of which play critical roles in modulating immune responses and maintaining retinal cell survival. The Toll-like receptor signaling pathway is a major driver of inflammation in DR. FKBP9 may activate Toll-like receptor-mediated inflammatory signaling, promoting the expression of pro-inflammatory cytokines such as TNF-α, IL-1β, and IL-6, thereby exacerbating retinal inflammation and compromising the integrity of the blood–retinal barrier. Additionally, FKBP9 may induce oxidative stress and activate the NF-κB signaling pathway, promoting microvascular leakage and pathological neovascularization[40,41]. Elevated FKBP9 expression may also regulate retinal neuronal survival and repair via the neurotrophin signaling pathway. In the early stages of DR, FKBP9 might enhance the neuroprotective effects of neurotrophins, such as BDNF and NT-4/5, to preserve neuronal function. However, under chronic hyperglycemic conditions, its protective capacity may diminish, leading to neuronal apoptosis and functional decline[42,43]. These findings demonstrate that FKBP9 may play a dual role in DR's pathogenesis, with neuroprotective effects predominating in the early stages and pro-inflammatory effects driving disease progression in later stages. This duality positions FKBP9 as a promising therapeutic target for DR, warranting further investigation into its mechanisms and potential for clinical application.
Drug prediction analysis identified GPR52 and FKBP9 as potential targets of folic acid, suggesting their involvement in DR's pathogenesis through the modulation of metabolic and immune pathways. The role of folic acid in maintaining metabolic homeostasis has been extensively studied, with evidence demonstrating its ability to enhance mitochondrial function and suppress inflammatory responses, thereby indirectly mitigating the progression of DR[44,45]. This study further suggests that folic acid may exert its effects by modulating GPR52 and FKBP9, thereby influencing critical signaling pathways, including the PI3K/Akt and Toll-like receptor pathways, which are essential for the metabolic, inflammatory, and immune responses in DR. Additionally, small-molecule compounds targeting GPR52 and FKBP9 were found, paving the way for targeted therapies. Furthermore, our molecular docking results further confirmed the strong binding affinities between FKBP9 and bisphenol A (−6.1 kcal/mol), FKBP9 and tetrachlorodibenzodioxin (−5.0 kcal/mol), as well as GPR52 and ethinyl estradiol (−8.7 kcal/mol). These binding energies suggest stable interactions between the predicted compounds and the identified biomarkers. Key residues identified in these interactions, such as HIS-87, GLN-53, and ASN-101/THR-1012, may play essential roles in mediating the biological activity of these drug–protein complexes. The docking findings support the potential clinical utility of these compounds in modulating GPR52 and FKBP9 activities, thereby reinforcing the feasibility of targeting these biomarkers in DR. Future research should validate these drugs' mechanisms with thorough laboratory and clinical tests to ensure their effectiveness and safety in DR treatment.
The miRNA network analysis identified several miRNAs that may play a role in the regulation of GPR52 and FKBP9, primarily through pathways associated with metabolic homeostasis, inflammatory responses, and oxidative stress. These miRNAs are posited to contribute to the maintenance of cellular metabolic balance under hyperglycemic conditions by modulating the expression of key genes involved in metabolic pathways, while also impacting the chronic inflammatory microenvironment through the regulation of inflammatory factor expression[46,47]. Additionally, transcription factor network analysis identified POU2F1 as a shared regulator of GPR52 and FKBP9, suggesting its involvement in their expression and the dual-phase effects of UPRmt. However, direct experimental evidence supporting POU2F1's regulatory role in DR remains lacking, highlighting a need for further investigation. Understanding the specific regulatory mechanisms of these miRNAs and TFs could provide novel insights into the molecular mechanisms of DR.
Immune infiltration analysis demonstrated significant changes in the activity of CD8+ T cells and NK cells in patients with DR, which were closely associated with the expression of the UPRmt-related gene FKBP9. CD8+ T cells play a crucial role in the pathogenesis of DR, with increased infiltration observed in all stages of DR and the vitreous humor[48]. A negative correlation between FKBP9 and activated CD8+ T cells suggests that FKBP9 may modulate UPRmt signaling to inhibit excessive activation of CD8+ T cells, thereby reducing their direct cytotoxic effects on retinal cells[49]. Previous studies have highlighted the pro-inflammatory role of CD8+ T cells in DR, where their activation drives the release of pro-inflammatory cytokines like TNF-α and IL-1β, which exacerbate the inflammatory environment[50,51]. Conversely, the positive correlation between FKBP9 and NK cell activity indicates that it may enhance NK cell activation, potentially driving the elevated release of pro-inflammatory cytokines, which, in turn, amplify inflammatory responses and disrupt the blood–retinal barrier[52,53]. Although GPR52 was not directly implicated in the analysis of immune infiltration, its established role in metabolic regulation suggests a potential indirect influence on T cell activity. In addition to immune cell infiltration, we also observed significant group differences in the expression of immune activity-related genes, notably the upregulation of CXCL9 and downregulation of Granzyme A (GZMA) in DR. These alterations further support the presence of an imbalanced immune microenvironment. CXCL9, a chemokine induced by IFN-γ, facilitates the recruitment of CD8+ T cells and NK cells, and is known to exacerbate inflammatory responses and pathological angiogenesis in retinal disorders[54,55]. Its elevated expression in DR is consistent with the enhanced immune activation associated with FKBP9 expression. Conversely, GZMA, a cytotoxic granzyme secreted by CD8+ T cells and NK cells, plays a dual role in immune-mediated cytotoxicity and the regulation of inflammatory cascades[22]. Its downregulation may reflect impaired cytotoxic immune function or a shift toward chronic low-grade inflammation. These findings reinforce the hypothesis that GPR52 and FKBP9 may influence DR's progression not only through metabolic and mitochondrial pathways but also by reshaping the immune gene expression landscape.
Although this study identified DR biomarkers associated with UPRmt, it is still important to point out that this study also has some limitations. Firstly, this research was conducted using two publicly available datasets, validated with a few clinical samples, which may not fully capture the heterogeneity of DR across diverse populations. Larger and more diverse cohorts are necessary to confirm the generalizability of these findings. Although the RT-qPCR validation cohort included a relatively small number of samples (n = 5 per group), the observed expression patterns of GPR52 and FKBP9 were consistent with those found in the transcriptomic datasets, supporting their potential as reliable biomarkers. Secondly, although this study investigated the roles of UPRmt-related biomarkers GPR52 and FKBP9 in DR, the findings are limited by a lack of comprehensive in vivo and in vitro experimental validation. Thirdly, although the bioinformatic analyses highlighted the involvement of these biomarkers in metabolic, inflammatory, and immune pathways, the underlying molecular mechanisms remain incompletely understood and require further exploration. Future research that addresses these limitations will enhance the translational relevance of the findings and facilitate the development of precise diagnostic and therapeutic strategies for DR.
In conclusion, this study identified two UPRmt-related biomarkers, GPR52 and FKBP9, in DR and systematically explored their potential roles in disease progression through bioinformatic analyses. Our findings indicated that these genes may serve as valuable biomarkers for the early diagnosis of DR and offer a foundation for future research to develop novel targeted therapies in DR.
This research was supported by the General Guidance Project for Western Medicine of the Guangzhou Medical and Health Science and Technology Project (Grant No. 20231A011083), the Young PhD 'Qihang' Project of the Guangzhou Science and Technology Bureau (Grant No. 2025A04J3634), the Joint Funding Project for City-University (Institute) of the Guangzhou Science and Technology Program (Grant No. 2025A03J4315), and the Young Scientists' Fund of the National Natural Science Foundation of China (Grant No. 82401252).
-
This study was conducted in accordance with the Declaration of Helsinki and approved by the Medical Ethical Committee of the First Affiliated Hospital of Guangzhou Medical University (ES-2024-155-01).
-
The authors confirm their contributions to the paper as follows: conceptualization: Lin J, Cheng H; methodology: Lin J, Xue J, Meng J, Li J; investigation: Meng J, Ye D; data curation: Huang X, Zhang J; writing – original draft: Lin J, Xue J, Meng J; writing – review and editing: Cheng H, Li J; supervision: Cheng H. All authors reviewed the results and approved the final version of the manuscript.
-
All data are contained within the article. The raw qPCR expression values and ΔCt data are available from the corresponding author upon reasonable request.
-
The authors declare that they have no conflict of interest.
-
Authors contributed equally: Jianqiang Lin, Jingfei Xue, Jie Meng
- Copyright: © 2025 by the author(s). Published by Maximum Academic Press, Fayetteville, GA. This article is an open access article distributed under Creative Commons Attribution License (CC BY 4.0), visit https://creativecommons.org/licenses/by/4.0/.
-
About this article
Cite this article
Lin J, Xue J, Meng J, Ye D, Huang X, et al. 2025. Mitochondrial unfolded protein response in diabetic retinopathy: biomarker identification and mechanistic exploration. Visual Neuroscience 42: e016 doi: 10.48130/vns-0025-0015 

Mitochondrial unfolded protein response in diabetic retinopathy: biomarker identification and mechanistic exploration
- Received: 24 May 2025
- Revised: 27 June 2025
- Accepted: 07 July 2025
- Published online: 02 September 2025
Abstract: Diabetic retinopathy (DR) is a common microvascular complication of diabetes. The mitochondrial unfolded protein response (UPRmt) is a key stress-adaptive mechanism, yet its role in DR remains unclear. This study aimed to investigate the involvement of UPRmt-related genes (MRGs) in DR. Transcriptomic datasets (GSE221521 and GSE189005) were analyzed to identify differentially expressed MRGs. Weighted gene co-expression network analysis (WGCNA), machine learning, and reverse transcription-quantitative polymerase chain reaction (RT-qPCR) were used to screen and validate biomarkers. Functional enrichment, nomogram construction, immune infiltration analysis, drug prediction, molecular docking, and regulatory network exploration were performed. GPR52 and FKBP9 were consistently upregulated in DR and showed good diagnostic potential (area under the curve [AUC ≥ 0.7]). A nomogram based on their expression demonstrated high predictive accuracy. Enrichment analysis suggested their roles in PI3K/Akt, Toll-like receptor, and neurotrophin signaling. FKBP9 correlated with altered CD8+ T cell and NK cell infiltration. Differential expression of CXCL9 and GZMA supported immune dysregulation. Molecular docking indicated stable interactions with small molecules, including ethinyl estradiol and bisphenol A. POU2F1 and several miRNAs were identified as potential regulators. GPR52 and FKBP9 may serve as UPRmt-related biomarkers in DR, contributing to metabolic and immune dysregulation. These findings offer insights into DR pathogenesis and may inform future personalized diagnostic and therapeutic strategies.
-
Key words:
- Diabetic retinopathy /
- Mitochondrial unfolded protein response /
- Bioinformatic analysis /
- GPR52 /
- FKBP9