













-
Land plants are sessile organisms with life cycles alternating between diploid sporophyte and haploid gametophyte generations. This alternation is mediated by meiosis, which produces spores or their derived homologs, pollen. Bryophytes, lycophytes, and ferns are spore-producing plants that rely on spores for dispersal[1]. In seed plants, pollen delivers male gametes to the stigma, enabling sexual reproduction[2,3]. During dispersal, spores and pollen of land plants are directly exposed to atmospheric stressors like desiccation and ultraviolet (UV) radiation without the protection of water. To ensure survival and reproductive success, plants have evolved strategies to protect spores/pollen from environmental stresses[4]. Among these stressors, ultraviolet B (UV-B) radiation (290–320 nm) poses a significant threat by inducing DNA damage[5]. Land plants primarily mitigate UV-B damage through UV-B absorption and DNA repair mechanisms[5,6]. However, spores and pollen, as metabolically inactive haploid gametophytes with dehydrated DNA, are exceptionally sensitive to UV-B[7]. Exposure to UV-B often reduces pollen quantity and causes structural malformations[8−10], underscoring the critical role of UV-B absorption in protecting these reproductive units.
Spores/pollen are covered by an outer cell wall exine, which is mainly constituted by sporopollenin[11]. The sporopollenin is the major structure for absorbing UV radiation[12−14]. Recent studies show that both phenylpropanoid phenolics and naringenin are components of sporopollenin[15−19]. Chemical evidence indicates that the phenolics are linked by C-C bonds to form the core structure of the sporopollenin, and naringenin may be linked to the core structure by ester bonds[20]. Genetic evidence shows that the phenolics and naringenin in sporopollenin are involved in the UV defense of pollen in Arabidopsis[15−17]. Moreover, the abundance of para-coumaric acid (p-CA) and ferulic acid (FA) in sporopollenin correlates with ambient UV-B levels, enabling their use as proxies for reconstructing historical UV irradiance[12,21−27]. However, Nuclear Magnetic Resonance Spectroscopy (NMR) analysis indicates that besides para-coumaric acid and ferulic acid, para-hydroxybenzoate, naringenin, lignin guaiacyl (G) unit, and cinnamyl alcohol groups are also present in the sporopollenin, which may also have the ability to absorb UV-B[15,16,20]. Furthermore, different plants accumulate distinct phenolics in their sporopollenin[15]. Identifying a universal sporopollenin-based marker for UV resistance could advance studies of plant reproductive evolution.
Sporopollenin autofluorescence is widely observed in land plants[13,15,28,29]. In this study, we established a method to quantify the Integral of Sporopollenin Autofluorescence Intensity (ISAI), which is a potential parameter for indicating the pollen UV resistance ability. The ISAI was analyzed in 55 representative land plants. We showed that the ISAI variations in spores/pollen are associated with the solar irradiance gradients. Using 18 Arabidopsis ecotypes, we further demonstrate that ISAI is heritable and correlates with pollen UV resistance. Our findings establish ISAI as a diagnostic parameter for assessing spores/pollen UV tolerance, offering insights into plant adaptation to terrestrial environments.
-
Spores of Marchantia polymorpha, Haplocladium microphyllum, Funaria hygrometrica, Palhinhaea cernua, Phlegmariurus phlegmaria, Isoetes sinensis, Ophioglossum vulgatum, Lygodium japonicum, and Pteris multifida, pollen of Cycas revoluta, Cedrus deodara, Cryptomeria japonica, Metasequoia glyptostroboides, Nymphaea tetragona, Nelumbo nucifera, Yulania denudata, Typha orientalis, Iris pseudacorus, Crocosmia × crocosmiiflora, Ophiopogon bodinieri, Hosta plantaginea, Trachycarpus fortunei, Nandina domestica, Juglans regia, Salix babylonica, Calystegia hederacea, Petunia × hybrida, Vitex negundo, Salvia japonica, Thymus mongolicus, Nerium oleander, Lantana camara, Mimulus hybridus, Paulownia fortunei, Veronica arvensis, Ligustrum lucidum, Osmanthus fragrans, Fraxinus chinensis, Chrysojasminum floridum, Cirsium japonicum, Helianthus tuberosus, Cnidium monnieri, Cuphea hyssopifolia, Lythrum salicaria, Punica granatum, Oxalis corniculata, Malus halliana, Prunus × yedoensis, Spiraea thunbergii, Rosa multiflora, Cercis chinensis, Trifolium repens, Wisteria sinensis, Sedum lineare, and Orychophragmus violaceus were collected in Shanghai, China. All the spores/pollen used in this study were collected from plants grown outdoors under natural light conditions. For each species, spores or pollen were sampled from multiple plants and loaded into a 1.5 mL EP tube. All the samples were stored at −80 °C until use. The A. thaliana Columbia-0 (Col-0) was preserved in our lab. The ecotype seeds used in this study, CS76412 (Fei-0), CS76449 (Bik-1), CS76468 (Co-1), CS76485 (Est), CS76526 (Kil-0), CS76558 (Na-1), CS76572 (Pi-0), CS76598 (Seattle-0), CS76623 (Van-0), CS76626 (Wa-1), CS76883 (Gol-2), CS77013 (LDV-18), CS77040 (LIN S-5), CS77389 (Tsu-0), CS78787 (Set-1), CS78791 (UKID96), and CS78853 (WAR) were obtained from the Arabidopsis Biological Resource Center (ABRC) (
https://abrc.osu.edu )[30]. All these ecotypes of A. thaliana were grown under long-day conditions (16 h light/8 h dark) in a ~22 °C plant incubator, light intensity of 8,000 lux. After three generations were used for this study. Pollen grains from four independent plants were collected and loaded into a 1.5 mL EP tube. All the samples were stored at −80 °C until use.Pollen germination assays and UV-B treatment
-
The pollen germination assay was performed as described previously[15]. Briefly, fine-tipped tweezers were used to smear the pollen from four plants per ecotype evenly on two round dishes covered with germination medium (sucrose 18%, H3BO3 0.01%, CaCl2 1 mM, Ca(NO3)2 1 mM, MgSO4 1 mM, Low melting Agarose 1.5%, pH ~ 7.0) through the binocular stereo anatomy microscope (SHL-7045, Shenzhen Shunhuali Electronics Co, China). One dish from each pair received UV-B treatment (the UV-B treatment energy was set to simulate the UV-B intensity encountered during summer noon in southern China: 302 nm peak wavelength, 1.2 W/cm2 irradiance, 7.5 min exposure) using a UV crosslinker (UV-100, Tanon Science & Technology Co., China). Both treated and untreated pollen were incubated at 24 °C for 16 h in the dark. Germination rates were quantified using an Olympus BX51 microscope (Olympus Corp., Japan) with integrated digital imaging. For statistical analysis, ≥ 200 pollen grains per replicate were analyzed using ImageJ. Four biological replicates (independent plants) were assessed.
Scanning electron microscopy (SEM)
-
Spores/pollen were mounted on SEM stubs, and the mounted samples were then coated with palladium-gold in a sputter coater (pattern) and examined via SEM (SU-8010; HITACHI,
www.hitachi.com.cn ) with an acceleration voltage of 2.0 kV.Confocal microscopy
-
The LSCM fluorescence images were obtained with a Leica STELLARIS 8 laser scanning confocal microscopy (LSCM) (STELLARIS 8, Leica Co, Germany). Spores/pollen were mounted using 1% low-melting-point agarose solution as the mounting medium. To monitor spore/pollen wall autofluorescence, a 405 nm laser line was used for excitation, and emission spectra were recorded in the range of 450−550 nm. The 63× plan apochromats objective (#506350, Leica Co, Germany) was used. For sporopollenin wall autofluorescence of A. thaliana ecotypes, the smart intensity was set as 1.0%, the smart gain was set as 120.0%, and the pinhole was set as 1.00 AU. For sporopollenin wall autofluorescence of other tested species, the smart intensity was set as 0.4%, the smart gain was set as 60.0%, and the pinhole was set as 1.00 AU. LAS X (LAS_X_3.3.0_16799, Leica Co, Germany) software was used for the data analysis.
Computing method of the integral autofluorescence of the spore/pollen wall
-
The auto-fluorescence images at the maximum light section of pollen in the equatorial view were obtained by using the LSCM. The signal intensity of the spore/pollen wall along the distal-proximal axial was extracted by using the line profile, which was provided by LAS X (Leica Co, Germany) software. Using the software of OriginPro 2021 (OriginPro Learning Edition,
www.originlab.com ), the line chart was created, and the auto-fluorescence of the spore/pollen wall was estimated from the integral area. Twelve sites of each spore/pollen were selected for line profiling. For spores/pollen collected from outdoors, nine spores or pollen grains of each species were analyzed, while for Arabidopsis cultivated in a plant incubator, five pollen grains of each Arabidopsis ecotype were measured.Measurement of pollen size and pollen wall thickness
-
Pollen grains from A. thaliana ecotypes were imaged by SEM. The Polar axis of the pollen was defined as the pollen size. Fourty pollen grains were selected from each ecotype, and the pollen size was measured by ImageJ. To measure the pollen wall thickness, pollen from A. thaliana ecotypes and other land plants were dusted into glass vials and mounted on glass microscope slides[31], imaging at the maximum light section of pollen. The pollen wall thickness was measured by ImageJ. Ten sites of each pollen and nine independent pollen grains were selected for measurement of the pollen wall thickness in all these plants.
Data handling
-
To analyze what determines the pollen UV-B resistance ability, we calculated the decline rate of pollen germination of A. thaliana ecotypes tested. And the pollen characteristics, including the pollen wall thickness, the pollen size, and the integral of sporopollenin wall autofluorescence, were measured with the software of ImageJ and OriginPro 2021, respectively. For correlation analysis, we used Spearman correlation analysis to evaluate the effect of pollen characteristics on the UV-B defenses ability in different A. thaliana ecotypes. To analyze the variation of pollen wall thickness, pollen size, and integral of sporopollenin wall autofluorescence into group and inter-group, we used GraphPad Prism 8.0 (GraphPad Software,
www.graphpad.com ) for one-way ANOVA and Tukey's Method for multiple comparisons. The family-wise alpha threshold and confidence level were set as 0.05 (95% confidence interval). To compare the difference of autofluorescence intensity in pollen wall between different plant groups, OriginPro 2021 was used for Mann-Whitney U test. The confidence level was set as 0.05 (95% confidence interval). The data of monthly solar irradiation of East China was plotted with GraphPad Prism 8.0 and fitted with Smoothing spline. -
During pollen dispersal, harmful UV radiation must penetrate the pollen wall to reach the cytoplasm, where it can cause damage (Fig. 1a). Under UV irradiation, the pollen wall exhibits autofluorescence, with a maximum emission wavelength at 450−550 nm[15,29]. The autofluorescence intensity of the pollen wall may reflect its capacity to convert short-wave UV radiation into less harmful long-wave visible light. Consequently, mapping the autofluorescence intensity along the distal-proximal axis of the pollen wall could serve as a functional indicator of UV resistance (Fig. 1a). Autofluorescence images were acquired at the equatorial maximum optical section of pollen grains using LSCM (Supplementary Fig. S1). Signal intensity along the distal-proximal axis of the pollen wall was extracted, defining a parameter termed the 'Integral of Sporopollenin Autofluorescence Intensity (ISAI)' (Fig. 1b).
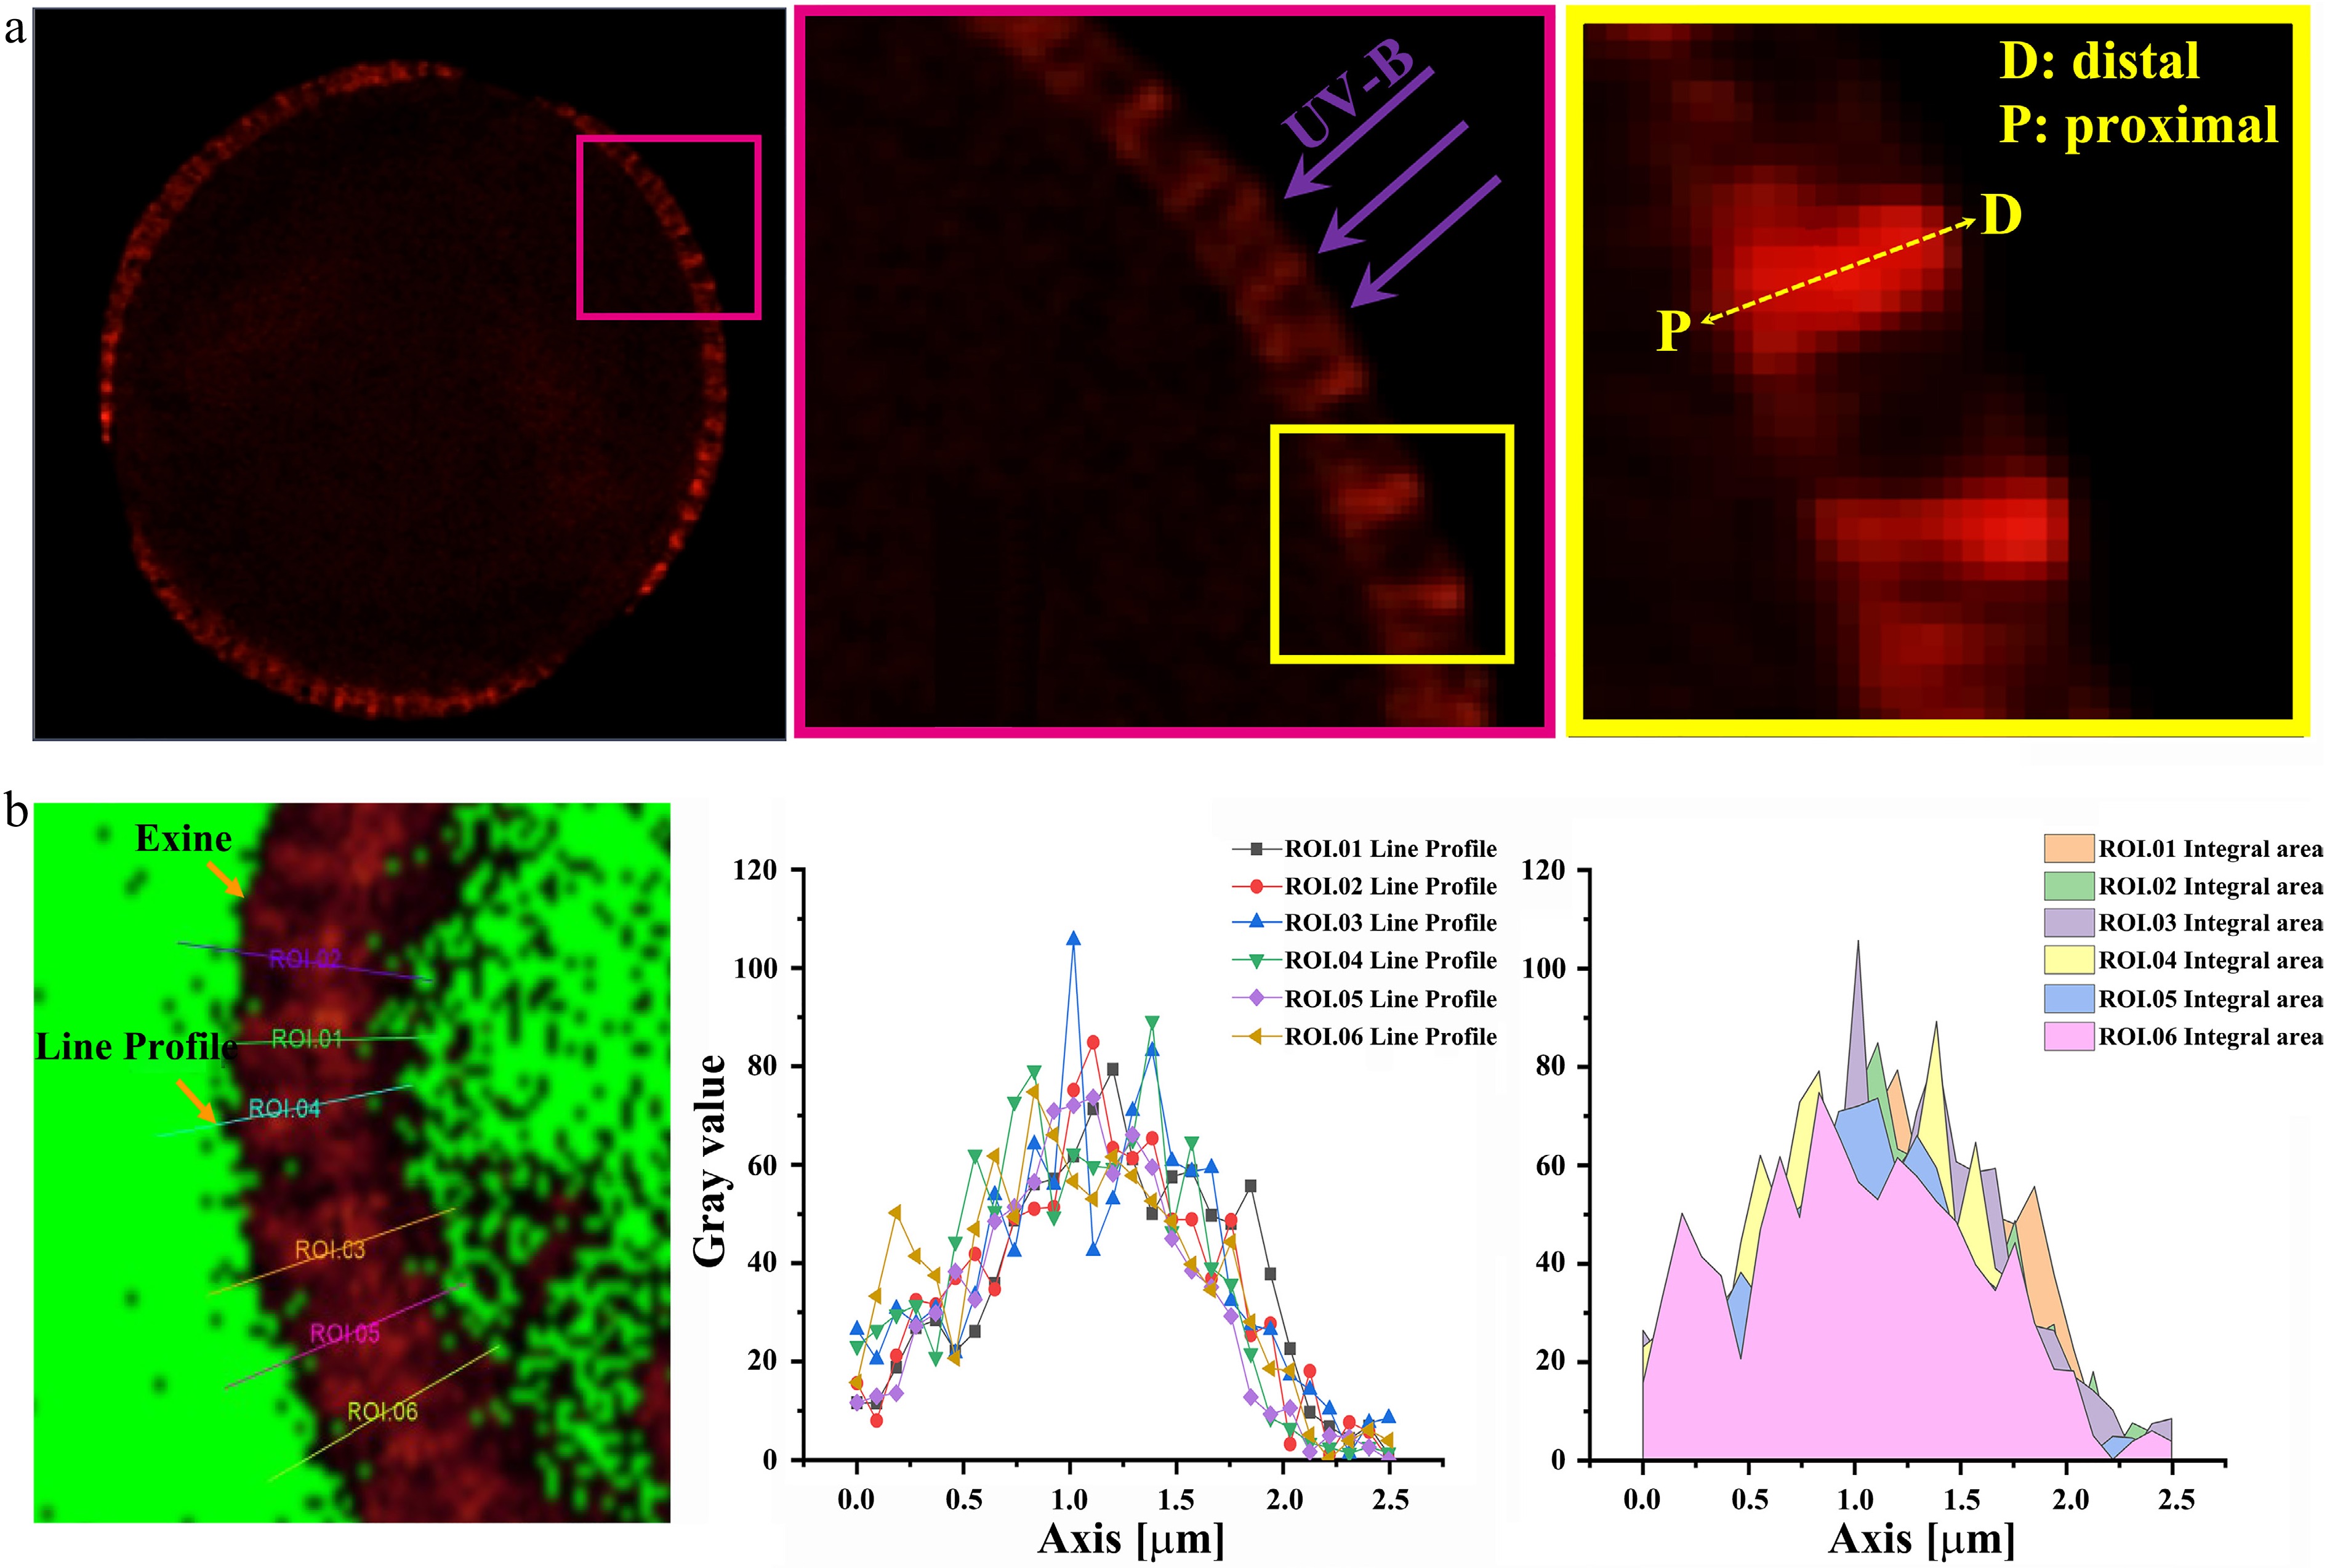
Figure 1.
The quantification of ISAI by using laser scanning confocal microscopy (LSCM). (a) The LSCM image of the maximum light section of spore/pollen wall in equatorial view. Left: the maximum light section of the spore/pollen in equatorial view. Middle: the magnified image of the pink box in the left image. UV-B damage the protoplasm only after they pass through the pollen wall. Right: the diagrammatic sketch of the distal-proximal axial of spore/pollen wall, and it is the magnified image of the yellow box in the middle image. UV-B damage the protoplasm only after they pass through the pollen wall along the distal-proximal axial. (D: distal; P: proximal). (b) Detection of autofluorescent intensity of the pollen by LSCM. ROI: region of interest. Left image: the diagram of the line profile of the pollen wall autofluorescence. The image is in the maximum light section of spore/pollen in the equatorial view. The signal intensity of exine was obtained using the line profile provided by LAS X (Leica) software. Middle image: line chart of the autofluorescent intensity of the pollen wall. Right image: the signal intensity of the pollen wall autofluorescent was obtained by using the method of integral area.
ISAI variations in spores/pollen are associated with the solar irradiance gradients
-
Land plants, including bryophytes, pteridophytes, and seed plants, occupy distinct ecological niches, leading to differential exposure to UV radiation within the same geographical region. To investigate this relationship, spores and pollen were collected from common land plants in the Shanghai area, East China, and analyzed for ISAI (Fig. 2a; Supplementary Figs S2 & S3, Supplementary Tables S1 & S2). In this area, seed plant pollen is typically exposed to direct sunlight, while pteridophyte spores occupy shaded understory layers with reduced UV exposure. Bryophytes, often growing in damp, shaded microhabitats, experience the lowest UV radiation. Consistent with these ecological differences, the highest ISAI was observed in seed plants (Fig. 2b). Statistical analysis using the Mann-Whitney U test revealed significant differences in ISAI between bryophytes and pteridophytes, as well as between pteridophytes and seed plants (Fig. 2c). These results indicate that solar irradiance gradients influence ISAI levels in pollen and spores.
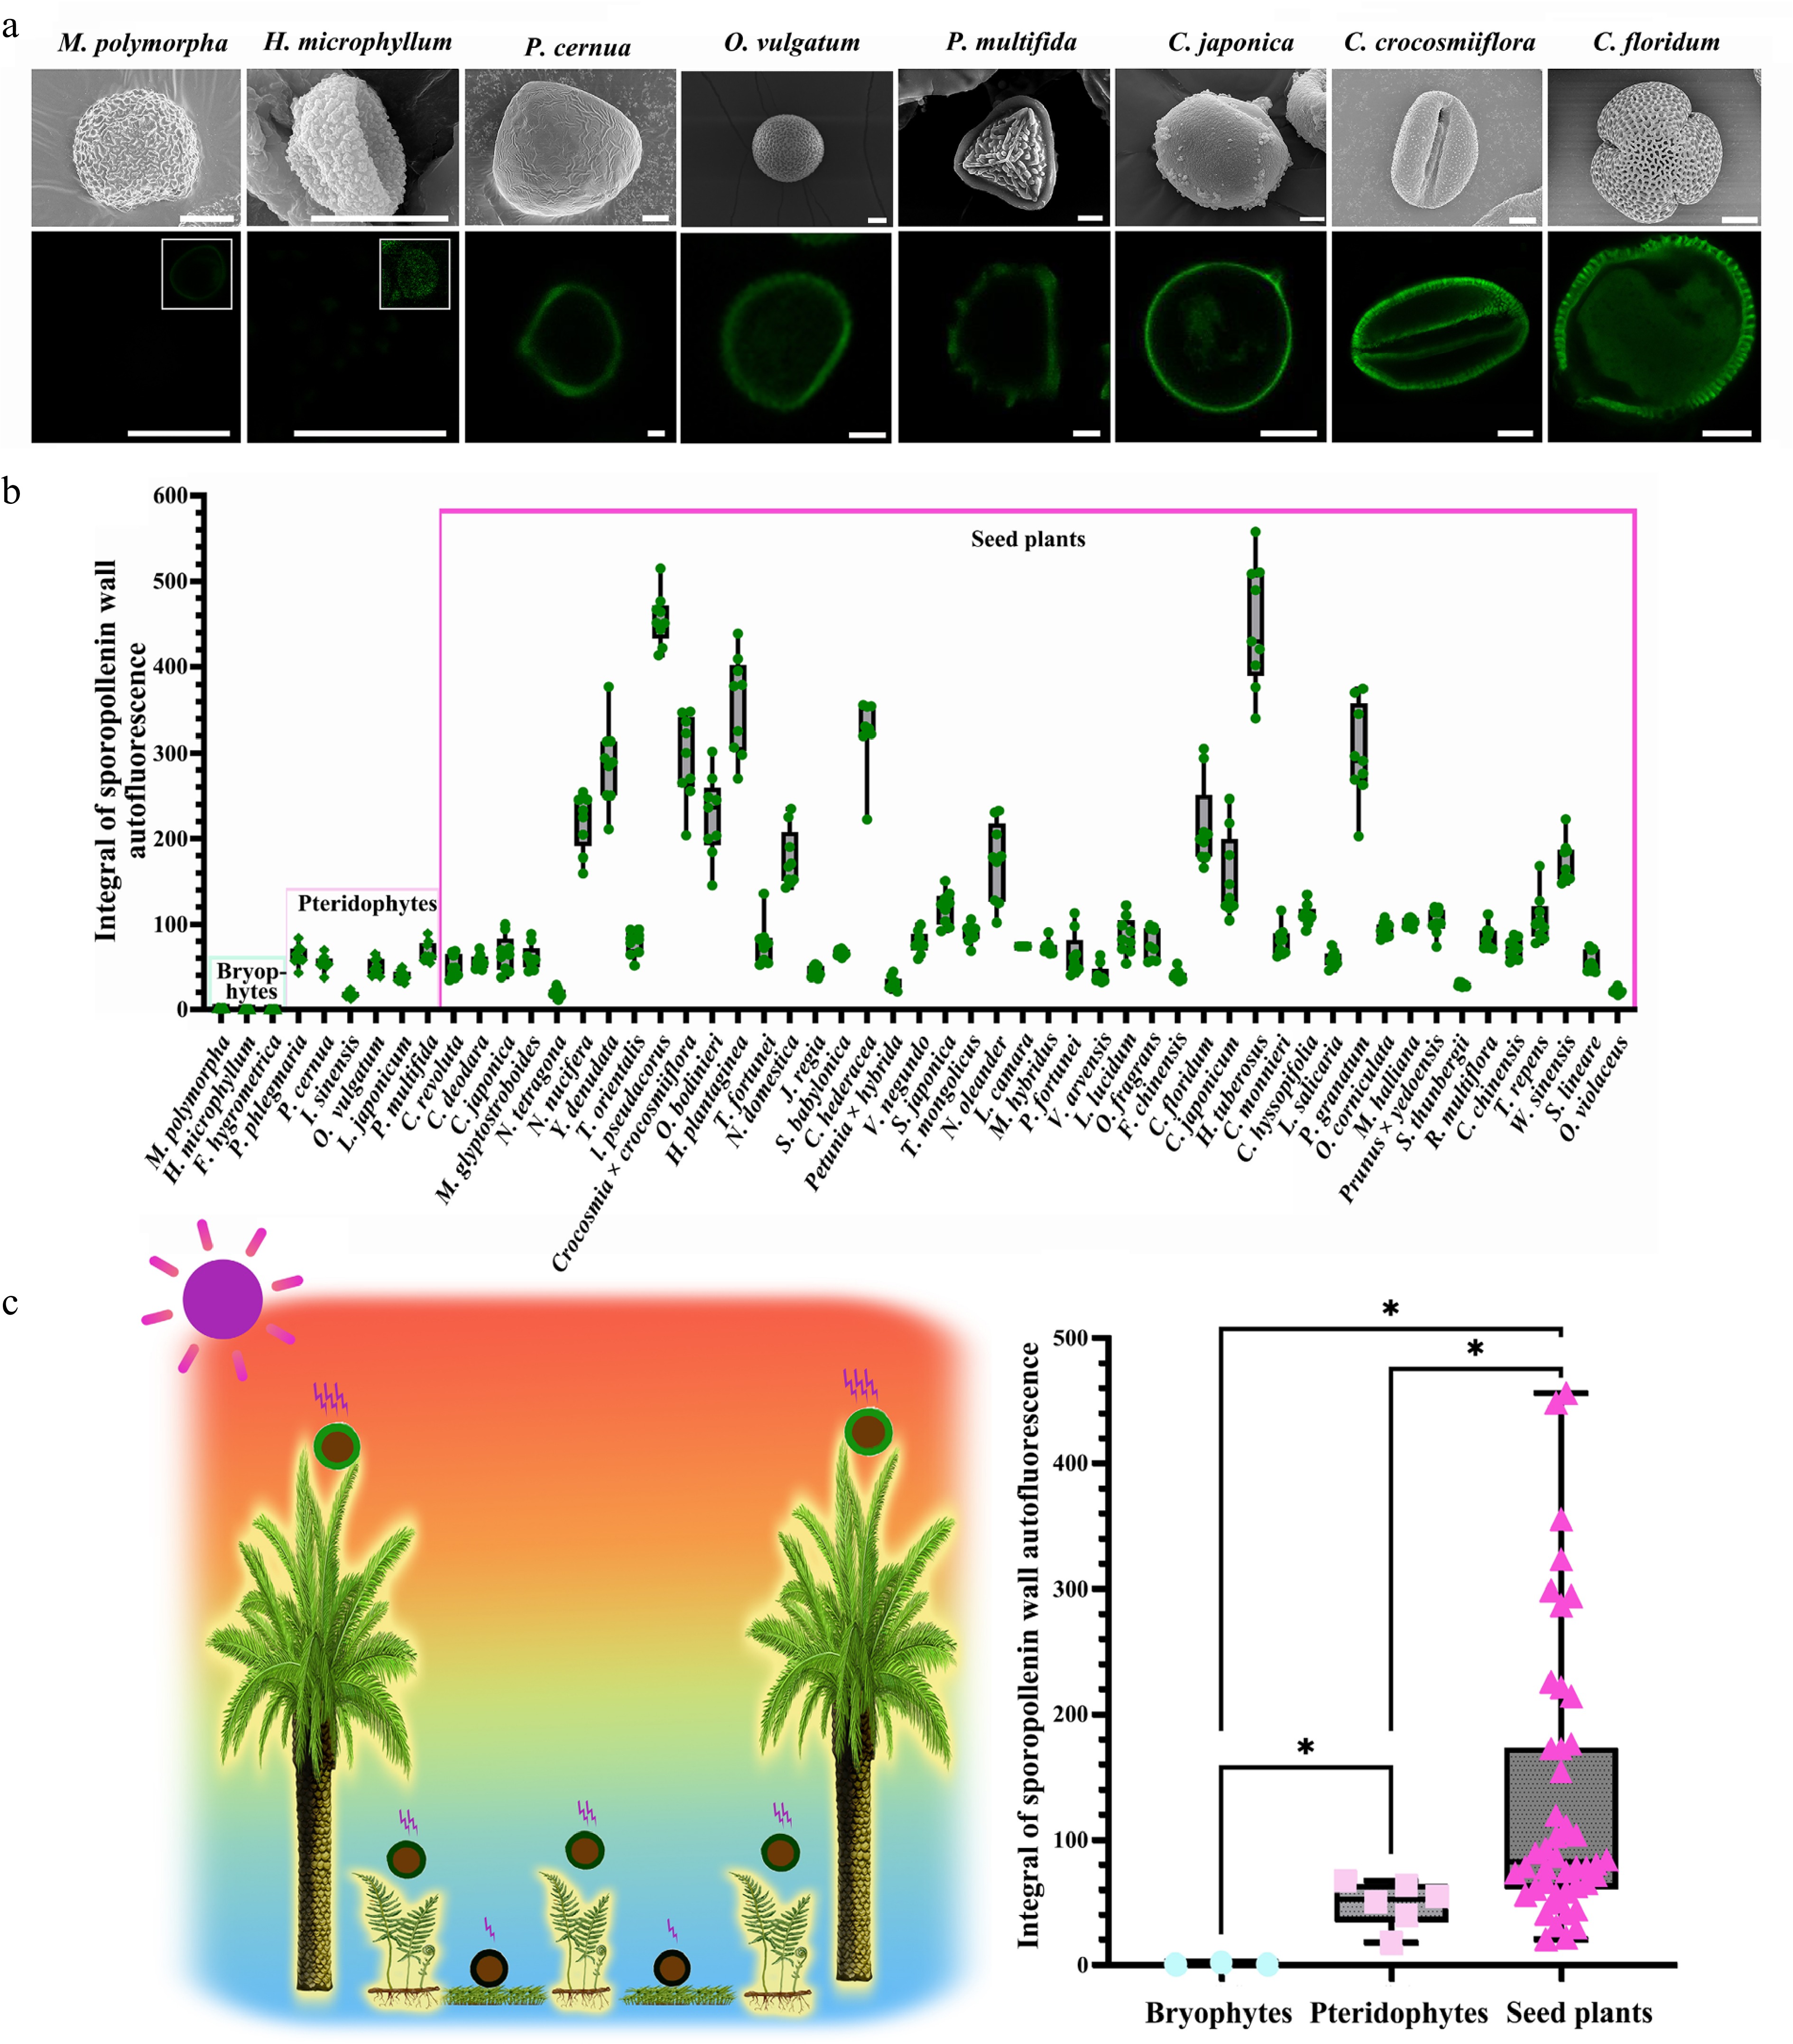
Figure 2.
ISAI varies among spores/pollen from distinct ecological niches. (a) Scanning electron microscope (SEM) and auto-fluorescence (Auto-flu) images of spore/pollen of several representative species. For SEM, scale bars = 10 μm; for LCSM, scale bars = 10 μm. For M. polymorpha and H. microphyllum, since the sporopollenin wall autofluorescence is very low, the picture with the image dynamic range adjusted is displayed in the upper right corner of the fluorescence picture. (b) Columnar diagram of spore/pollen wall autofluorescent intensity, 12 sites of each spore/pollen were selected for line profile, and nine spores or pollen grains were counted from each species. (mean ± SD, n = 9). (c) Statistical analysis of spore/pollen wall autofluorescent intensity. Left: summary of UV-B irradiation experienced by spores/pollen of land plants. Due to variations in the ecological niches of land plants and the spread distance of spores/pollen, the UV-B radiation experienced by spores/pollen in the terrestrial environment differ. Specifically, UV radiation intensities typically follow the order of seed plants > pteridophytes > bryophytes. Right: autofluorescent intensity of spore/pollen wall showed significant differences among bryophytes, pteridophytes, and seed plants (Mann-Whitney U test: Bryophytes vs Pteridophytes: Z = −2.19469, p = 1.19E-2; Bryophytes vs Seed plants: Z = −2.85665, p = 5.43E-5; Pteridophytes vs Seed plants: Z = −2.62071, p = 3.14E-3; *, p < 0.05).
Notably, while many seed plant species exhibited high ISAI, others displayed values comparable to pteridophytes (Fig. 2). Seed plants produce pollen across different seasons, during which solar UV radiation varies significantly[32]. East China's subtropical monsoon climate features intense UV radiation from June to August (Fig. 3a). The relationship between seasonal UV radiation and ISAI was analyzed. Plants with higher pollen ISAI predominantly flowered during high-radiation seasons (Fig. 3b). Based on monthly average radiation levels in East China, species flowering between June and August were classified as high-solar-radiation groups, while others were categorized as low-solar-radiation groups (Supplementary Table S3). Plants flowering under high solar radiation exhibited significantly higher ISAI than those in low-radiation periods (Fig. 3c). Furthermore, all species with extreme ISAI values belonged to the high-radiation group (Fig. 3c), consistently supporting the hypothesis that ISAI elevation is associated with high UV radiation environments.
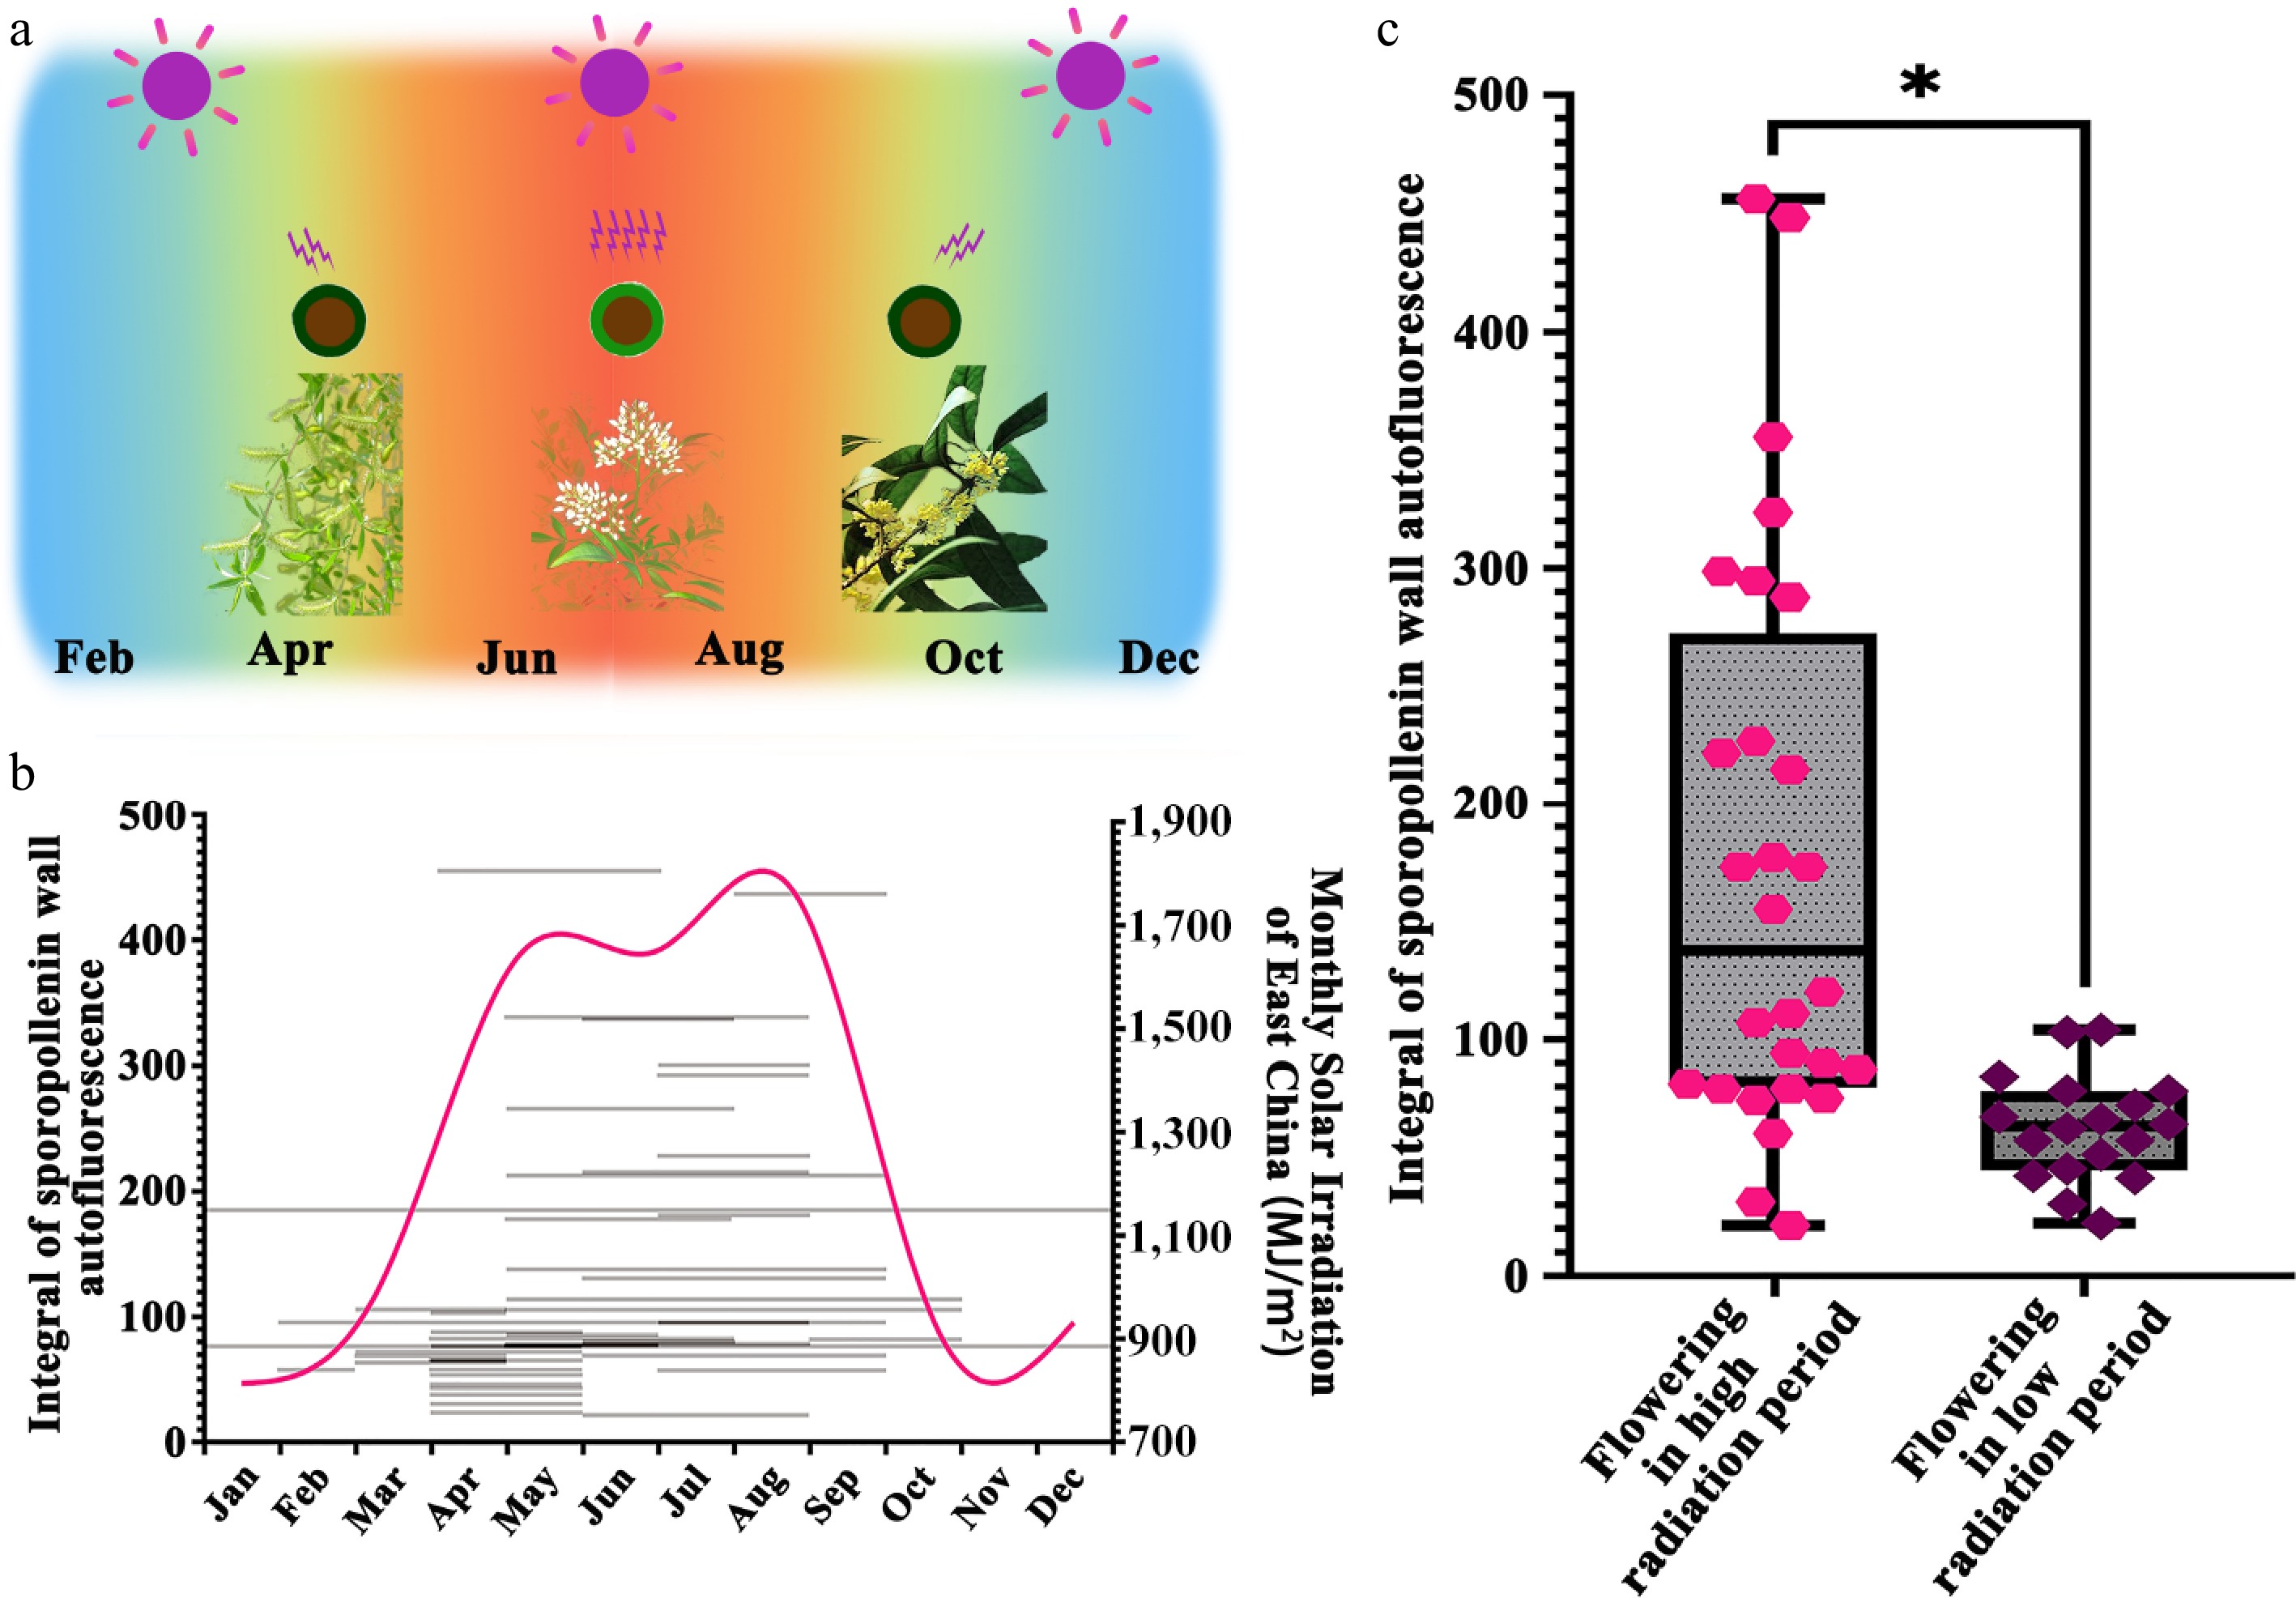
Figure 3.
Pollen ISAI of seed plants across different flowering periods. (a) Summary of UV-B irradiation experienced by the pollen of land plants in East China. East China's subtropical monsoon climate features intense UV radiation from June to August, during which flowering species may subject their pollen to increased solar irradiation. (b) Summary of florescence, integral of sporopollenin wall autofluorescence intensity, and the monthly solar irradiation of East China. The grey lines show the florescence and the integral of sporopollenin wall autofluorescence intensity of seed plants tested. The magenta line shows the variation of monthly solar irradiation of East China. The tested seed plants have different florescence and integral of sporopollenin wall autofluorescence intensity. (c) Statistical analysis of autofluorescent intensity of pollen wall of seed plants which flower under high and low radiation conditions. The pollen wall autofluorescence is significantly different between species which flowering in high radiation environment and low radiation environment (Mann-Whitney U test: Flowering in high radiation period vs Flowering in low radiation period: Z = −4.10761, p = 1.23E-5; *, p < 0.05).
Heritable ISAI of Arabidopsis ecotypes is correlated with pollen UV resistance
-
Previous studies indicate that plants accumulate higher levels of UV-absorbing compounds in the pollen wall when briefly exposed to UV radiation during development[12]. To investigate whether ISAI variation arises solely from solar UV exposure during spores/pollen development or is partly attributable to heritable genetic variation, and the association between ISAI and the UV resistance capacity of pollen, we analyzed multiple Arabidopsis thaliana ecotypes. Arabidopsis thaliana, a globally distributed species, has evolved distinct ecotypes adapted to diverse environments[33,34]. This makes it an excellent research object for bridging field studies and laboratory studies. In this study, 81 ecotypes sourced from varied environments were obtained from the Arabidopsis Biological Resource Center (ABRC). Under long-day conditions (16 h light/8 h dark, ~22 °C growth chamber, 8,000 lux light intensity), 41 ecotypes failed to flower. Of the remaining, 22 exhibited varying degrees of delayed flowering. Eighteen ecotypes with comparable growth rates were selected for the study, including four from North America's eastern and western coasts, 11 from across Europe, two from East and West Asia, and Col-0 (Fig. 4a). These ecotypes were grown in a plant incubator for three generations to minimize effects of prior environmental disparities. Pollen ISAI analysis revealed significant variation among ecotypes (Fig. 4b; Supplementary Table S4), demonstrating that genetic variation contributes to ISAI differences.
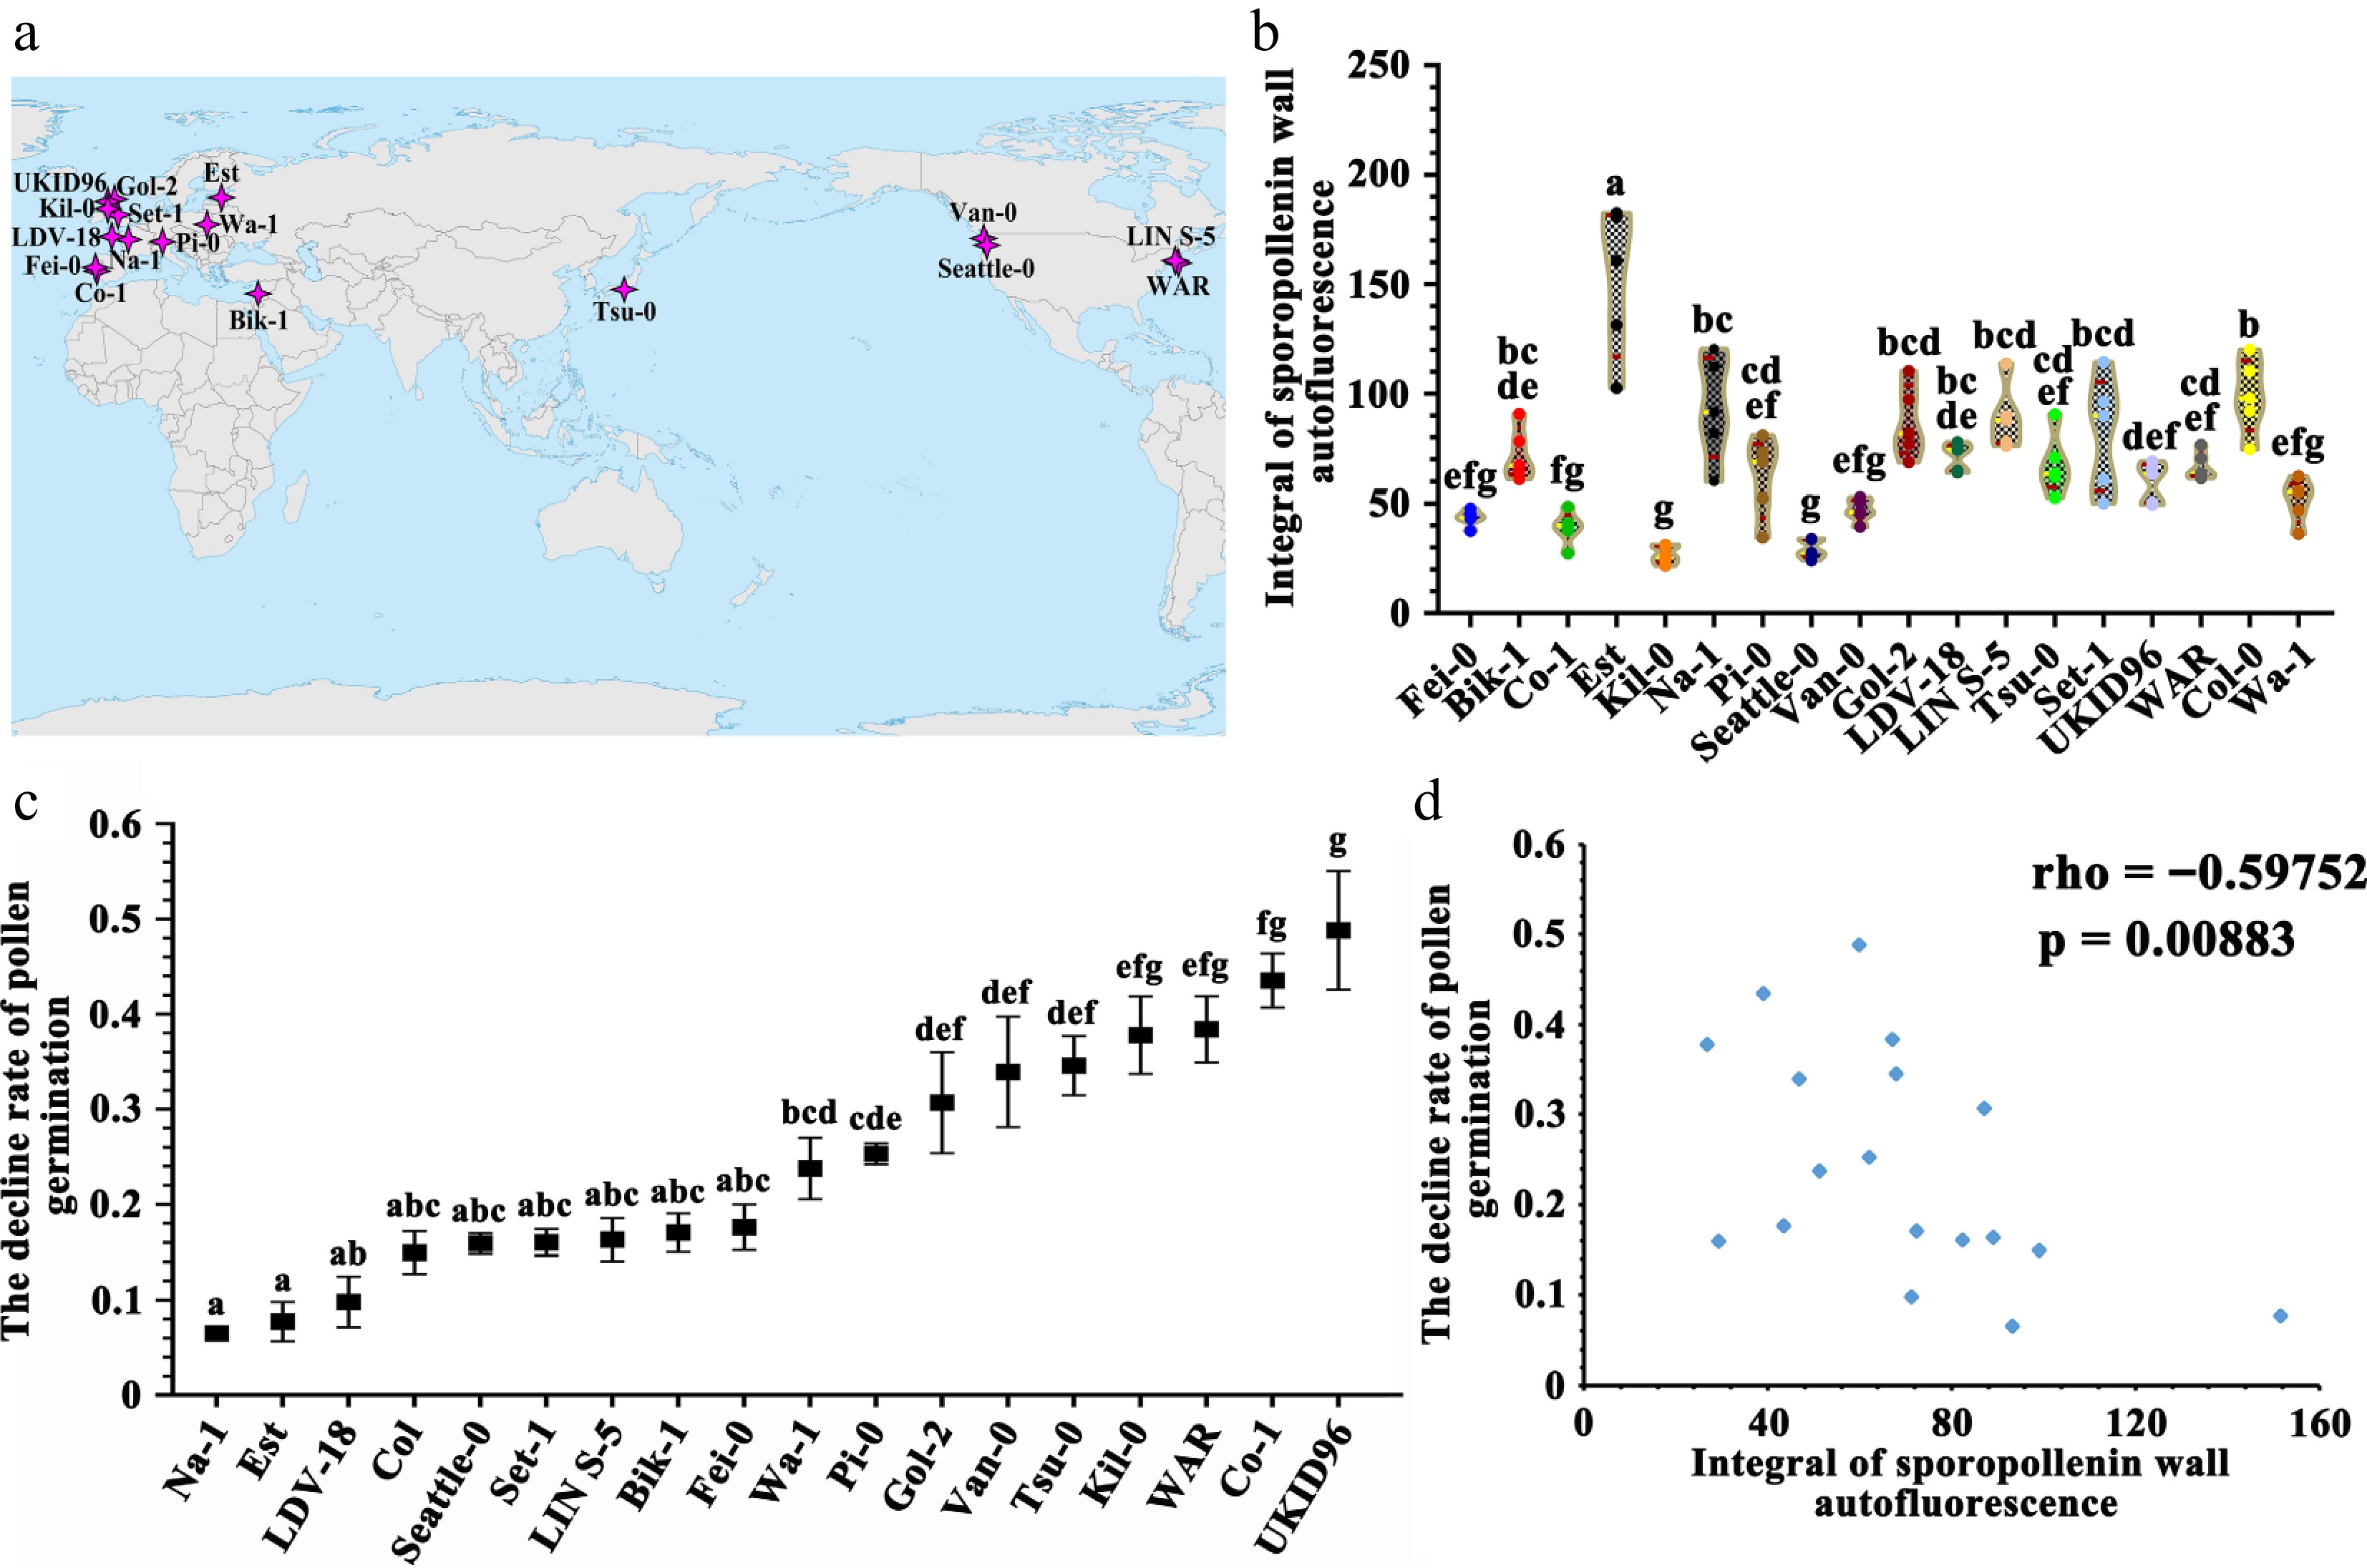
Figure 4.
The sporopollenin wall autofluorescence is correlated with UV-B defense ability of pollen grains in Arabidopsis thaliana ecotypes. (a) The geographical distribution of ecotypes used in this experiment. (b) Violin plot of the integral of sporopollenin wall autofluorescence intensity in A. thaliana ecotypes. The yellow line indicates the average value, the red line indicates the quartile value, and the data points are showed in the graph. Twelve measurement lines each pollen grain, five pollen grains each A. thaliana ecotype (mean ± SD, n = 5). Grouping information using the Tukey's Method and 95% confidence. Means that do not share a letter are significantly different. The A. thaliana ecotypes showed significant difference in the integral of sporopollenin wall autofluorescence. (c) Determination of pollen germination rate (mean ± SD, n = 4). Grouping information using Tukey's method and 95% confidence. Means that do not share a letter are significantly different. These A. thaliana ecotypes showed different decline rates under the UV-B treatment. (d) Spearman correlation analysis of the decline rates of pollen germination under the UV-B treatment in different A. thaliana ecotypes vs the integral of sporopollenin wall autofluorescence intensity (Spearman correlation: rho = −0.59752, p = 0.00883).
Furthermore, pollen germination rates of these ecotypes under UV-B treatment were evaluated (302 nm, 7.5 min, 1.2 W/cm2) (Supplementary Fig. S4). Germination rates were normalized to untreated controls (set as 100%), with post-treatment reductions defined as 'pollen germination decline rates'. Ecotypes exhibited divergent decline rates (Fig. 4c, Supplementary Table S5). Spearman's rank correlation analysis revealed a significant negative association between ISAI and pollen germination decline (rho = −0.60, p = 0.009) (Fig. 4d), indicating that higher ISAI correlates with stronger UV-B resistance. In addition, we showed that pollen size varied significantly among ecotypes, whereas pollen wall thickness showed no significant differences (Supplementary Figs S5 & S6, Supplementary Tables S6 & S7), and the ISAI had no correlation with the pollen wall thickness (rho = 0.35, p = 0.160) (Supplementary Fig. S7), suggesting ISAI is influenced by pollen wall chemistry rather than thickness. These results demonstrate natural variation in sporopollenin chemistry, with ISAI, a chemically determined trait, positively linked to pollen UV-B resistance.
Genetic evidence demonstrates that phenylpropanoid phenolics are essential for ISAI
-
Recent studies identified para-coumaric acid, ferulic acid, para-hydroxybenzoate, naringenin, lignin G units, and cinnamyl alcohol as sporopollenin components[20]. In Arabidopsis, these compounds are synthesized via the phenylpropanoid pathway[35]. Within this pathway, CINNAMATE-4-HYDROXYLASE (C4H) catalyzes the conversion of cinnamic acid to para-coumaric acid. This intermediate is subsequently metabolized: CINNAMOYL-CoA REDUCTASE (CCR) converts it into hydroxycinnamyl alcohols and ultimately into lignin units, while Chalcone Synthase (CHS) channels it into flavonoids[36−38]. To investigate the function of phenylpropanoid pathway in ISAI, we collected pollen from Col-0, ref3-1 (mutant of C4H gene), ccr1-4 (mutant of CCR gene), and chs (mutant of CHS gene). ISAI was dramatically reduced in both ref3-1 and ccr1-4 mutants (Supplementary Fig. S8), indicating that para-coumaric acid and its downstream products hydroxycinnamyl alcohols and lignin units are essential for pollen ISAI. Both flavonoid and hydroxycinnamyl alcohol/lignin biosynthesis share para-coumaric acid as a common precursor. Blocking flavonoid synthesis in the chs mutant likely redirects this precursor flux towards hydroxycinnamyl alcohol/lignin production. Consistent with this metabolic shift, we observed increased ISAI in the chs mutant (Supplementary Fig. S8). Taken together, these results demonstrate that phenylpropanoid-derived phenolics are essential for ISAI.
-
In this study, we developed a method to measure the intensity of sporopollenin wall autofluorescence by using LSCM (Fig. 1). We analyzed the ISAI of 55 representative land plants collected from the wild and 18 Arabidopsis ecotypes cultivated in the laboratory (Figs 2, 4; Supplementary Figs S2, S3). The results show that the ISAI is associated with the intensity of environmental radiation encountered by spores/pollen. All seed plants with high ISAI values flower during summer months (Fig. 3); seed plants flowering in low-radiation seasons showed comparable ISAI levels to pteridophytes (Supplementary Fig. S9); and Arabidopsis ecotypes exhibited pollen UV resistance capacities that are correlated to their ISAI values. These findings collectively indicate ISAI enhancement as an adaptive response to high-radiation environments. The results align with prior chemical studies showing UV-B-dependent phenolic acid variations in sporopollenin[12,22−24,39], while introducing LSCM-based ISAI analysis as a novel nondestructive method requiring minimal samples. Methodological advantages encompass the absence of complex pretreatment and the capability to acquire quantitative data directly reflecting the pollen UV resistance ability from individual pollen grains in-situ, which expands current UV-B reconstruction methods.
Natural selection may act on genes regulating spore/pollen wall components, thereby increasing the ISAI and UV-B resistance
-
Organismal adaptation to environmental change involves both short-term plastic responses and long-term genetic modifications[40−42]. Understanding these adaptive mechanisms, particularly under shifting environmental pressures, remains a central focus in evolutionary biology. Prior studies have explored short-term environmental stressors, such as altered radiation levels, on pollen autofluorescence[21,31,43−46]. In this study, we analyzed Arabidopsis ecotypes collected from diverse ecological habitats. As shown in Fig. 4, ecotypes that grow under identical conditions exhibit distinct ISAI levels, which correlate with their UV-B resistance. Further analysis reveals no significant correlation between pollen size or wall thickness and either ISAI or UV adaptation (Supplementary Figs S5−S7, S10, S11). This suggests that genetic variation primarily shapes pollen wall composition (rather than pollen wall thickness), which is critical for ISAI in Arabidopsis. Furthermore, analysis across land plants also demonstrates that ISAI is not correlated with pollen or spore wall thickness (Supplementary Fig. S12, Supplementary Tables S8, S9). Supporting this, fluorescent analysis indicates divergent sporopollenin compositions among different land plants[15], highlighting the critical role of sporopollenin chemistry in pollen UV adaptation. ISAI arises primarily from autofluorescent compounds. Genetic evidence shows that mutants defective in the phenylpropanoid pathway have reduced ISAI and decreased UV-defense ability, underscoring the pathway's critical role[15]. These findings imply that genes in regulating the phenylpropanoid pathway are likely the targets of natural selection to enhance UV-B defense in spores and pollen. Future studies into the mechanisms underlying of this selection process, as well as the relative contributions of short-term plasticity and long-term genetic alterations in species' environmental adaptation, will deepen our comprehension of spores/pollen to the changing UV radiation.
This work was supported by grants from the National Natural Science Foundation of China (31900165), Shanghai Municipal Education Commission (2019-01-07-00-02-E00006), Science and Technology Commission of Shanghai Municipality (17DZ2252700, 18DZ2260500, and 21DZ2202300), and the Postdoctoral Fellowship Program (Grade C) of China Postdoctoral Science Foundation (GZC20231699). We would like to thank Dr. Zong-Xin Ren (Kunming Institute of Botany, Chinese Academy of Sciences) for the helpful comments on the manuscript.
-
The authors confirm their contributions to the paper as follows: experiments conception and design: Xue JS, Xiao Y, Yang ZN, Jia XL; experiments performing: Xue JS, Jia XL, Chen YY, Wang XL, Mao LM; data analysis: Xue JS, Jia XL, Mao LM, Yang ZN; manuscript writing: Xue JS, Yang ZN, Jia XL, Mao LM, Shen H. All authors reviewed the results and approved the final version of the manuscript.
-
All data generated or analyzed during this study are included in this published article and its supplementary information files, further inquiries are available from the corresponding author upon reasonable request.
-
The authors declare that they have no conflict of interest.
- Supplementary Table S1 Measurement data of auto-fluorescent intensity of spore plants.
- Supplementary Table S2 Measurement data of auto-fluorescent intensity of seed plants.
- Supplementary Table S3 Florescence of seed plants.
- Supplementary Table S4 Measurement data of auto-fluorescent intensity of A. thaliana ecotypes.
- Supplementary Table S5 Pollen germination rates of A. thaliana ecotypes under UV-B treatment.
- Supplementary Table S6 Measurement data of pollen wall thickness of A. thaliana ecotypes.
- Supplementary Table S7 Measurement data of pollen size of A. thaliana ecotypes.
- Supplementary Table S8 Measurement data of spore wall thickness of spore plants.
- Supplementary Table S9 Measurement data of pollen wall thickness of seed plants.
- Supplementary Fig. S1 The diagrammatic sketch of the maximum light section of spore/pollen in equatorial view.
- Supplementary Fig. S2 Autofluorescence of sporopollenin wall of other bryophytes, ferns and seed plants.
- Supplementary Fig. S3 Autofluorescence of sporopollenin wall of remaining seed plants.
- Supplementary Fig. S4 Technical route of pollen germination assay.
- Supplementary Fig. S5 The pollen size of A. thaliana ecotypes.
- Supplementary Fig. S6 The pollen wall thickness of A. thaliana ecotypes.
- Supplementary Fig. S7 Spearman correlation analysis of the integral of sporopollenin wall autofluorescence and the pollen wall thickness in Arabidopsis thaliana ecotypes.
- Supplementary Fig. S8 Integral of sporopollenin wall autofluorescence (ISAI) of sporopollenin biosynthesis mutants in Arabidopsis thaliana.
- Supplementary Fig. S9 Statistical analysis of auto-fluorescent intensity of spores from pteridophytes and pollen from low-radiation flowering seed plant.
- Supplementary Fig. S10 Spearman correlation analysis of the decline rate of pollen germination and the pollen size in Arabidopsis thaliana ecotypes.
- Supplementary Fig. S11 Spearman correlation analysis of the decline rate of pollen germination and the pollen wall thickness in Arabidopsis thaliana ecotypes.
- Supplementary Fig. S12 Spearman correlation analysis of the integral of sporopollenin wall autofluorescence vs the pollen wall thickness in land plants.
- Copyright: © 2025 by the author(s). Published by Maximum Academic Press on behalf of Hainan Yazhou Bay Seed Laboratory. This article is an open access article distributed under Creative Commons Attribution License (CC BY 4.0), visit https://creativecommons.org/licenses/by/4.0/.
-
About this article
Cite this article
Jia XL, Wang XL, Chen YY, Mao LM, Shen H, et al. 2025. Integral of Sporopollenin Autofluorescence Intensity (ISAI), a novel marker for UV adaptation in spores/pollen. Seed Biology 4: e017 doi: 10.48130/seedbio-0025-0016 

Integral of Sporopollenin Autofluorescence Intensity (ISAI), a novel marker for UV adaptation in spores/pollen
- Received: 14 April 2025
- Revised: 28 July 2025
- Accepted: 11 August 2025
- Published online: 10 October 2025
Abstract: Sporopollenin, a key adaptation enabling plants' transition to terrestrial environments, shields spores and pollen from UV damage, ensuring their survival and dispersal on land. The concentration of UV-absorbing p-CA and ferulic acids within sporopollenin correlates with UV levels, offering a proxy for reconstructing UV irradiance. However, the composition of UV-absorbing compounds varies across species, and a universal marker linking sporopollenin chemistry to UV resistance has yet to be identified. Given that UV-absorbing components may convert UV radiation into visible light, we developed a method to quantify the Integral of Sporopollenin Autofluorescence Intensity (ISAI), a novel parameter hypothesized to reflect pollen UV resistance. We analyzed ISAI in spores/pollen from 55 plant species and 18 Arabidopsis thaliana ecotypes. Our results reveal significant ISAI variation, which associates with solar-irradiance gradients. Species exposed to sunlight exhibited higher ISAI values than those adapted to shaded environments. Plants flowering during periods of elevated solar radiation displayed increased ISAI. Notably, analysis of A. thaliana ecotypes demonstrated that ISAI is heritable and correlated with pollen UV resistance. This study indicates ISAI as a metric in spore and pollen research, linking sporopollenin autofluorescence to UV adaptation. ISAI provides a novel tool for investigating plant responses to UV environments.
-
Key words:
- Spores/pollen /
- UV-B defense /
- Sporopollenin /
- Autofluorescence /
- LSCM