


-
For all living organisms to survive, clean water is essential; however, little or no access to clean water exists in certain regions of the world due to increased human activity polluting the water[1]. Therefore, water pollution is one of the significant issues negatively affecting the ecosystem, and posing a major threat to human health. The most common method to treat polluted water is through applying disinfectants, and this has led to more than 100,000 commercially available disinfection products being added to the aquatic environment[2]. The widespread use of disinfectants results in multiple environmental and health concerns. For example, chlorine-containing disinfectants, including sodium hypochlorite, calcium hypochlorite, and chlorine dioxide, can: (1) react with organic contaminants present in water to produce disinfection by-products (DBPs) that exhibit mutagenic, carcinogenic, and teratogenic effects; and (2) promote the mutation of bacterial genes that show strong antibiotic resistance, which pose a great threat to public health upon the spread of such resistance genes among bacteria and accelerate their generation and spreading[3]. As a result, it is important to search for an alternative method to reduce or eliminate the use of disinfectants to clean up wastewater. To date, a variety of wastewater treatment approaches have been established to reduce wastewater discharge and control hazardous pollutants, including physical methods (adsorption, coagulation, and flocculation), biological treatment using enzymes and microbes, and chemical methods (advanced oxidation and ozonation). In recent years, novel approaches like photocatalytic degradation, electro-flocculation, and electro-coagulation have been evaluated[4]. To select the most suitable method, it is essential to consider not only the treatment efficiency but also the energy consumption, cost, and environmental impact.
Among them, carbon-based material adsorption has been regarded as a cost-effective, technologically feasible, easy-to-operate, and non-destructive technique. It has demonstrated excellent performance in adsorbing organic pollutants[5,6], heavy metals[6], antibiotics[7], and pesticides[8]. The most commonly used carbon-based material is activated carbon[9]. Due to increasingly stringent environmental regulations worldwide, the global activated carbon market was valued at US
${\$} $ ${\$} $ At present, large amounts of organic dyes have been produced and consumed as a result of the increasing global production of textiles, printed materials, and cosmetics[16]. Methylene blue (MB, C16H18ClN3S), which was originally developed in the 1870s, has been extensively applied in a variety of industries, including paper, textiles, cosmetics, and medicine[17]. The presence of MB in aquatic ecosystems prevents light penetration and photosynthesis, thus altering the general equilibrium of aquatic life and disrupting the ecosystems[18]. In addition, MB pollution in drinking water sources causes skin irritation, respiratory problems, and potential cancerous effects from prolonged exposure[19]. Thus, it is important to ensure that MB is removed and that regulatory requirements are met without affecting the ecosystem and human health. Another knowledge gap in the literature is that the majority of studies are only focused on the use of batch experiments and the use of either one or multiple pollutants. However, it is critical to explore the use of a fixed-bed column for the adsorption of contaminants from real wastewater.
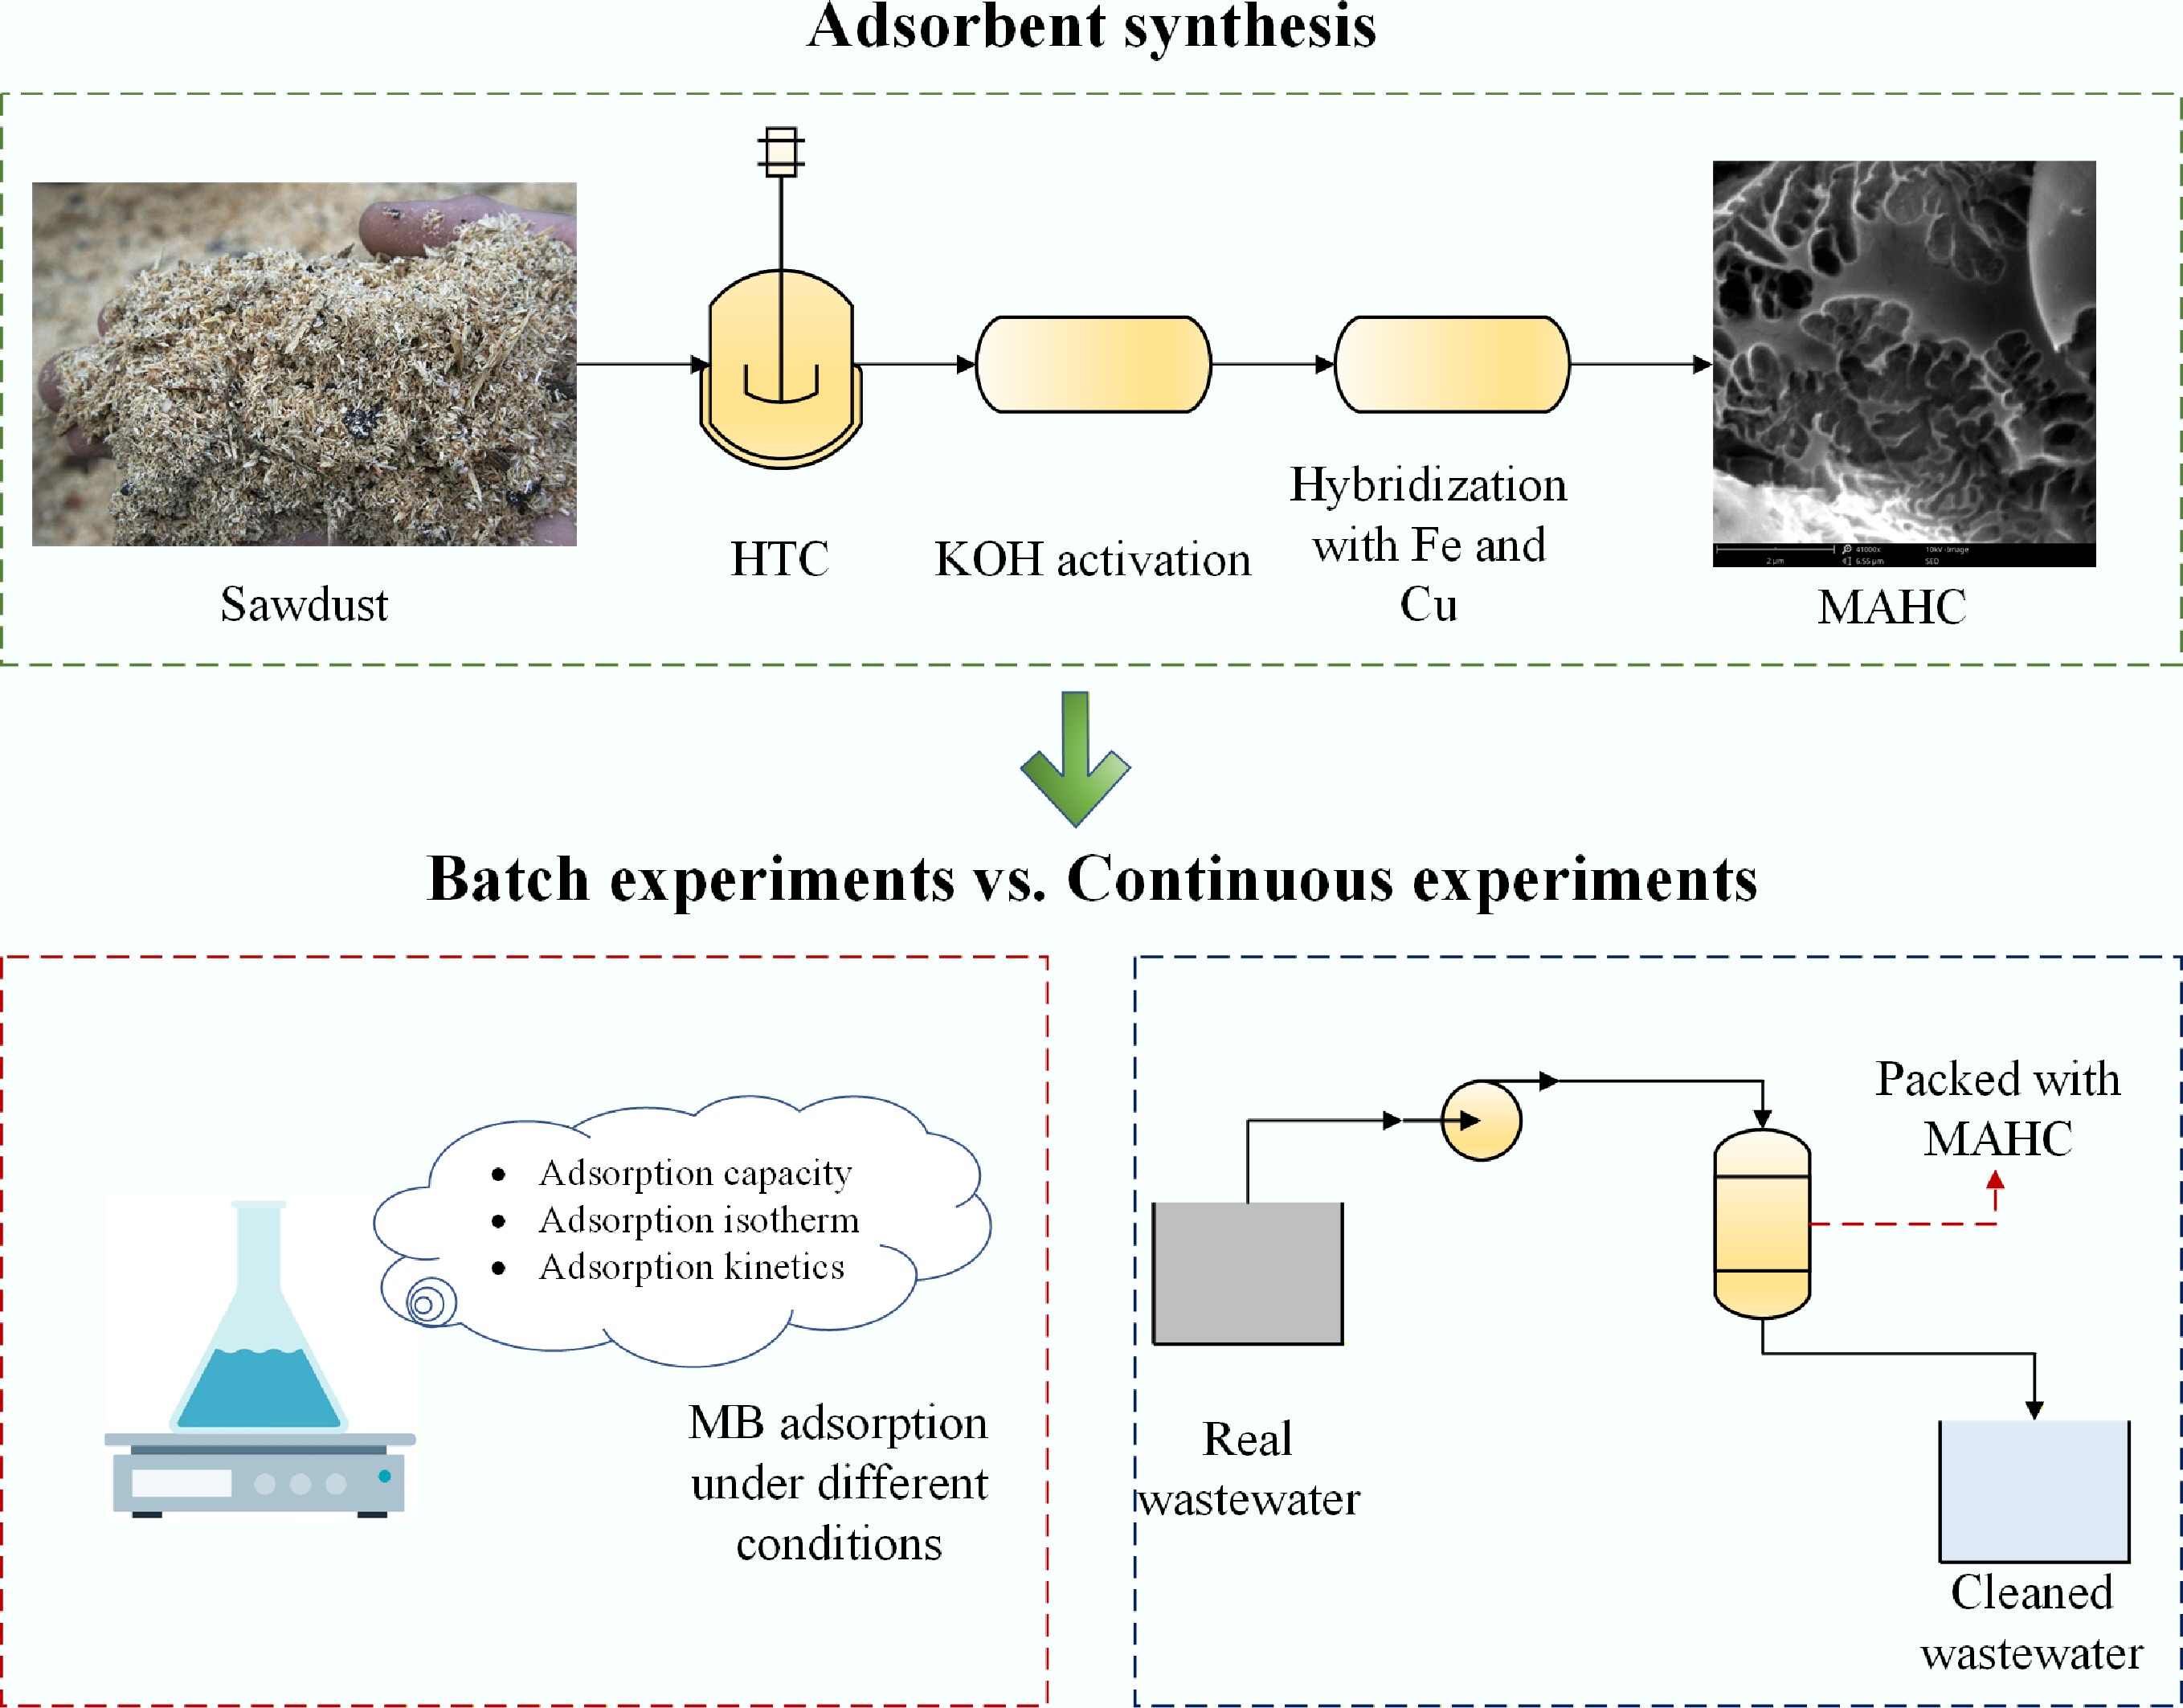
To address the above-mentioned problems, this study aims to synthesize Fe-Cu bimetallic activated hydrochar from sawdust using HTC, KOH activation, followed by hybridization. In the first phase of this work, MB adsorption efficiency was evaluated using the synthesized adsorbent at different operating conditions (e.g., pH, temperature, MB concentration, and adsorbent amount) through batch experiments. Next, the effectiveness of this adsorbent in removing contaminants from MB solution and real industrial wastewater was studied in a fixed-bed adsorption column by measuring electrical conductivity and the concentration of total N, P, and K. Finally, a series of analytical instruments were applied to thoroughly characterize the physiochemical properties of bimetallic activated hydrochar.
-
The local sawmill in Montague, Prince Edward Island, Canada, supplied the sawdust for this study. Sawdust was pulverized using a grinding machine and sieved to 600 μm. It was then dried in a furnace for 24 h at 100 °C to remove moisture.
All chemicals used in this investigation were acquired from Sigma Aldrich and VWR and used as received.
Hydrochar production
-
The HTC experiment was carried out in a 1 L HT/HP Parr reactor vessel. Sawdust was mixed with deionized water at a weight ratio of 1:10, and then the slurry was loaded into the reactor. The reactor was properly sealed and flushed with N2 to eliminate air inside the reactor. The reactor was pre-pressurized using N2 to ~15 bar. HTC experiments were conducted at 210 °C and kept at this temperature for 4 h. At the end of the reaction, the reactor vessel was cooled to room temperature, and then the gases were removed from the reactor through an exit valve. The reactor was opened, and the solid/liquid mixture was poured into a beaker and filtered under vacuum. Following filtering, the solid hydrocarbon residue on the filter paper was cleaned with deionized water and dried for 24 h at 105 °C.
Activation
-
The activation procedure and the selected activation parameters were based on our previous work[20]. Briefly, hydrochar was ground with the produced hydrochar at a ratio of 1:2 (hydrochar/KOH) and placed in a lab-built tube furnace (Supplementary Fig. S1). The activation reaction was conducted at 800 °C for 2 h under a continuous N2 flow at 100 mL/min. After cooling, the produced activated hydrochar was poured into a dilute HCl solution (10 vol.%) and left in the acid for 1 h to remove the unwanted by-products of the reaction. Finally, samples were washed and filtered with deionized water until the pH reached 7, followed by drying in an oven at 105 °C for 24 h.
Hybridization
-
The synthesis process was carried out as described in our previous study[21]. Briefly, 3 g of activated hydrochar was added to 35 mL of deionized water, followed by adding 1 g of FeCl3 and 0.75 g of CuSO4·5H2O. The mixture was then continuously stirred at 500 rpm for 30 min. In the next step, the solution was heated to 80 °C using a hot plate to create a gel, followed by carbonization in the lab-built tube furnace under an N2 atmosphere at 300 °C for 2 h. The product was washed using ethanol and deionized water, dried in a furnace at 105 °C for 24 h, ground, and sieved to pass through a 600 μm sieve. The final product was denoted as MAHC.
Batch adsorption experiment
-
The effects of pH level, adsorbent concentration, temperature, and MB concentration on the adsorption efficiency of MAHC were evaluated. For a typical experiment, MAHC at different concentrations was added to 200 mL of MB solution at different MB concentrations. Dilute KOH and HCl solutions were used to adjust the pH level of the mixture. The mixture was stirred at 500 rpm for 1 h, and the temperature was monitored using a hot plate. Every 10 min, a syringe was used to take a solution, which was then transferred into a cuvette. The absorption was then measured using a UV-Vis spectrometer (V-1200, VWR) at a wavelength of 665 nm, and the concentration of MB was determined using a calibration curve (Supplementary Fig. S2). The adsorption efficiency was calculated using Eq. (1).
$ Adsorption\;e f ficiency=\dfrac{{C}_{\mathrm{o}}-{C}_{t}}{{C}_{\mathrm{o}}}\times 100 $ (1) where, Co is the concentration at t = 0, and Ct is the concentration at time t.
The adsorption capacity of MAHC was also evaluated at equilibrium time and at any time, qe (mg/g) and qt (mg/g), and were determined using Eqs (2) and (3), respectively.
$ {q}_{\mathrm{e}}=\dfrac{{C}_{\mathrm{o}}-{C}_{\mathrm{e}}}{W} \times V $ (2) $ {q}_{\mathrm{t}}=\dfrac{{C}_{\mathrm{o}}-{C}_{t}}{W}\times V $ (3) where, Co is the initial concentration at t = 0, Ct is the concentration at time t, Ce is the concentration at equilibrium at time te, V (L) is the volume of solution, and W (g) is the mass of MAHC.
Continuous adsorption experiment
-
To evaluate the effectiveness of the synthesized adsorbent, the real wastewater that was supplied by a local potato processing plant was used as the raw feed in the continuous adsorption experiment. A 50 mL Falcon tube was used as the fixed-bed column for the experiment. This fixed-bed column was packed with 1.5 g of synthesized adsorbent. Before the experiment, the column was equilibrated with a continuous flow of deionized water using a peristaltic pump (Masterflex L/S, USA). Then, the influent was changed to an MB solution (initial MB concentration of 120 ppm) at a flow rate of 36 mL/min, and effluent sampling was carried out for 180 min. The MB concentration in the effluent was measured using UV-Vis spectrometry (V-1200, VWR) at a wavelength of 665 nm. Following this, the influent was changed to the real wastewater at a flow rate of 6.2 mL/min, and effluent sampling was conducted for 360 min. The total concentrations of N, P, and K, and the electrical conductivity were determined using a handheld tester (CCH0006B-CA, Yitrust, China). The initial concentrations of N, P, K, and the electrical conductivity of this real wastewater are given below in Table 1.
Table 1. Analysis of real wastewater provided by a local potato processing facility
Property Value Electrical conductivity (μs/cm) 2,961 Total nitrogen (mg/g) 588 Total phosphorus (mg/g) 1,219 Total potassium (mg/g) 1,269 Adsorption isotherms
-
The experimental equilibrium adsorption data, which are normally presented as isotherms showing the solid phase concentration plotted against the aqueous phase concentration, are correlated using either theoretical or empirical isothermal models. Adsorption isotherms are critical to help understand the interaction between adsorbent and adsorbate and can provide guidance in the optimization of the use of adsorbent. In this study, the Langmuir, Freundlich, and Temkin isotherms were applied to fit the experimental equilibrium isotherm data, and the fitness to each empirical equation was determined using the correlation coefficient R2.
Langmuir isotherm
-
Langmuir isotherm is the simplest and most widely used adsorption kinetic model for many sorption processes involving monolayer adsorption, and it assumes that the adsorption sites are energetically homogeneous. Hence, the occupation of one adsorption site does not affect the occupation of another adsorption site[22]. The Langmuir isotherm equations contain constants that represent the adsorbent's affinity and surface characteristics. The Langmuir isotherm equation is given in Eq. (4)[23].
$ \dfrac{{C}_{\mathrm{e}}}{{q}_{\mathrm{e}}}=\dfrac{1}{{q}_{\mathrm{m}}}{C}_{\mathrm{e}}+\dfrac{1}{{k}_{\mathrm{L}}.{q}_{\mathrm{m}}} $ (4) where, Ce (mg/L) is the concentration of adsorbate (i.e., MB) at equilibrium, and qe (mg/g) is the adsorption capacity at equilibrium. The maximal adsorption capacity (mg/g) is denoted by qm. The Langmuir adsorption constant is denoted by kL. Plotting Ce/qe against Ce gives a straight line, and the resulting slope and intercept are used to determine qm and ka.
Freundlich isotherm
-
The Freundlich isotherm is an empirical equation that describes a model in which the surface of the adsorbent is heterogeneous with varied adsorption energies, unlike in the Langmuir isotherm. The Freundlich isotherm can only be applied in low to intermediate concentrations of adsorbate since it does not imply a finite uptake capacity of adsorbate[24]. Equation (5) describes the Freundlich isotherm.
$ ln{q}_{\mathrm{e}}=ln{k}_{\mathrm{f}}+\dfrac{1}{{n}_{\mathrm{f}}}ln{C}_{\mathrm{e}} $ (5) where, kf is the Freundlich constant (mg/g)(L/mg)1/nf) and 1/nf is an empirical parameter that correlates the adsorption intensity with adsorbent heterogeneity. Plotting of lnqe against lnCe yields a straight line, and the slope and intercept can be used to determine 1/nf and kf, respectively.
Temkin isotherm
-
Even though the Temkin isotherm is not as popular as the Langmuir and Freundlich isotherms, it is often applied to model water contaminant adsorption and is compared with the Langmuir and Freundlich isotherms. The Temkin isotherm considers the effects of the interaction between the adsorbent and adsorbate, and is only valid for an intermediate range of concentrations. It assumes that the heat of adsorption decreases linearly with increasing surface coverage, reflecting that the interaction between the adsorbent and adsorbate becomes more pronounced as more adsorbate molecules accumulate on the surface of the adsorbent, which results in a decrease in the overall heat of adsorption[25]. It is described using Eq. (6).
$ {Q}_{\mathrm{e}}=\dfrac{RT}{{b}_{T}}\times ln{k}_{t}+\left(\dfrac{RT}{{b}_{T}}\right)\times ln{C}_{\mathrm{e}} $ (6) where, R is the universal gas constant (J/(mol∙K)), T is the temperature (K), bT is the parameter related to the adsorption energy (J/mol), and kT is the adsorption equilibrium constant (1/Pa).
Adsorption kinetics
Pseudo-first-order model
-
The pseudo-first-order model was proposed by Lagergen in 1898[26], and describes the rate of adsorption in accordance with the assumption that the adsorption rate depends on the diffusion of adsorbate on the adsorbent surface, and is proportional to the difference between the amount adsorbed at equilibrium and the amount adsorbed at time t. This model is widely used when the rate-limiting step is diffusion, which is often associated with physisorption[27]. The empirical equation is given as follows:
$ ln\;({q}_{\mathrm{e}}-{q}_{t})=ln{q}_{e}-{k}_{1}t $ (7) where, qe and qt are the adsorption capacities at equilibrium and at time t, respectively. k1 is the pseudo-first-order model equilibrium rate constant.
By plotting ln(
$ {q}_{e}-{q}_{t}) $ Pseudo-second-order model
-
The pseudo-second-order model is normally applied to describe adsorption processes that take a longer time to fill the adsorption sites. The assumption made in the pseudo-second-order model is that the adsorption process, particularly the rate-limiting step, involves chemisorption where the interaction between adsorption sites on the adsorbent surface and adsorbate, involving electron transfer, can be observed[27,28]. The linearized form of this model is given below.
$ \dfrac{t}{{q}_{t}}=\dfrac{1}{{k}_{2}q_{e}^{2}}+\dfrac{t}{{q}_{e}} $ (8) where, qe and qt are the adsorption capacities at equilibrium and at time t, respectively. t is the time. k2 is the pseudo-second-order model equilibrium rate constant.
Intraparticle diffusion model
-
The intraparticle diffusion model, also known as the Weber-Morris model, describes the rate-limiting step in the adsorption process where the molecules diffuse into the internal pores of an adsorbent. Equation (9) can be used to illustrate this model:
$ {q}_{t}={k}_{t}{t}^{1/2}+C $ (9) Characterizations of MAHC
-
The surface structure of MAHC was initially determined using a Brunauer-Emmett-Teller (BET) analyzer (Microtrac MRB BELSORP-Mini X). The surface morphology and elemental composition were determined by scanning electron microscopy (SEM) coupled with energy-dispersive X-ray spectroscopy (EDX) at Western University (London, Canada). A CHNS analyzer (Flash 2000, Thermo Scientific) was utilized to determine the C, H, O, N, and S content. Thermal degradation characteristics were determined by using a PerkinElmer TGA 4000 to heat from 30 to 800 °C in air at a heating rate of 10 °C/min, and an air flow rate of 30 mL/min, respectively. The iodine number was measured according to ASTM D4607-14[29]. The zeta potential at varying pH levels was measured using a 1 mg/mL sample at 25 °C with a Zetasizer Nano ZS (Malvern Instruments, UK). FTIR spectra of sawdust, hydrochar, activated hydrochar, and hybridized activated hydrochar were recorded using a Spectrum Two FTIR (PerkinElmer, US) over the range of 4,000 to 400 cm−1 with a resolution of 4 cm−1.
-
The adsorption and desorption curves of MAHC and its pore size distribution are given in Fig. 1. As shown in Fig. 1a, it can be found that the quantity of adsorbed adsorbate (i.e., N2) increases sharply at the low pressure range and then plateaus, reaching a saturation limit, which suggests that this adsorption isotherm belongs to Type I and MAHC is a microporous solid. This observation was also reported in the study of activated hydrochar derived from coffee husk waste for MB removal[30]. The BET surface area and total pore volume of MAHC were determined to be 1,266.1 m2/g and 0.7394 cm3/g, respectively. In comparison, it is observed that the specific surface area of activated carbon derived from peach stone is 915 m2/g, and the total pore volume is 0.477 cm3/g[31]. This is mainly due to the differences in the activation method, where physical activation using steam was applied. Based on the Non-Local Density Functional Theory (NLDFT) and Grand Canonical Monte Carlo (GCMC), the pore size distribution of MAHC was obtained, and it can be clearly seen that the dominant pore size range is within 0–2 nm, which belongs to the micropore range.
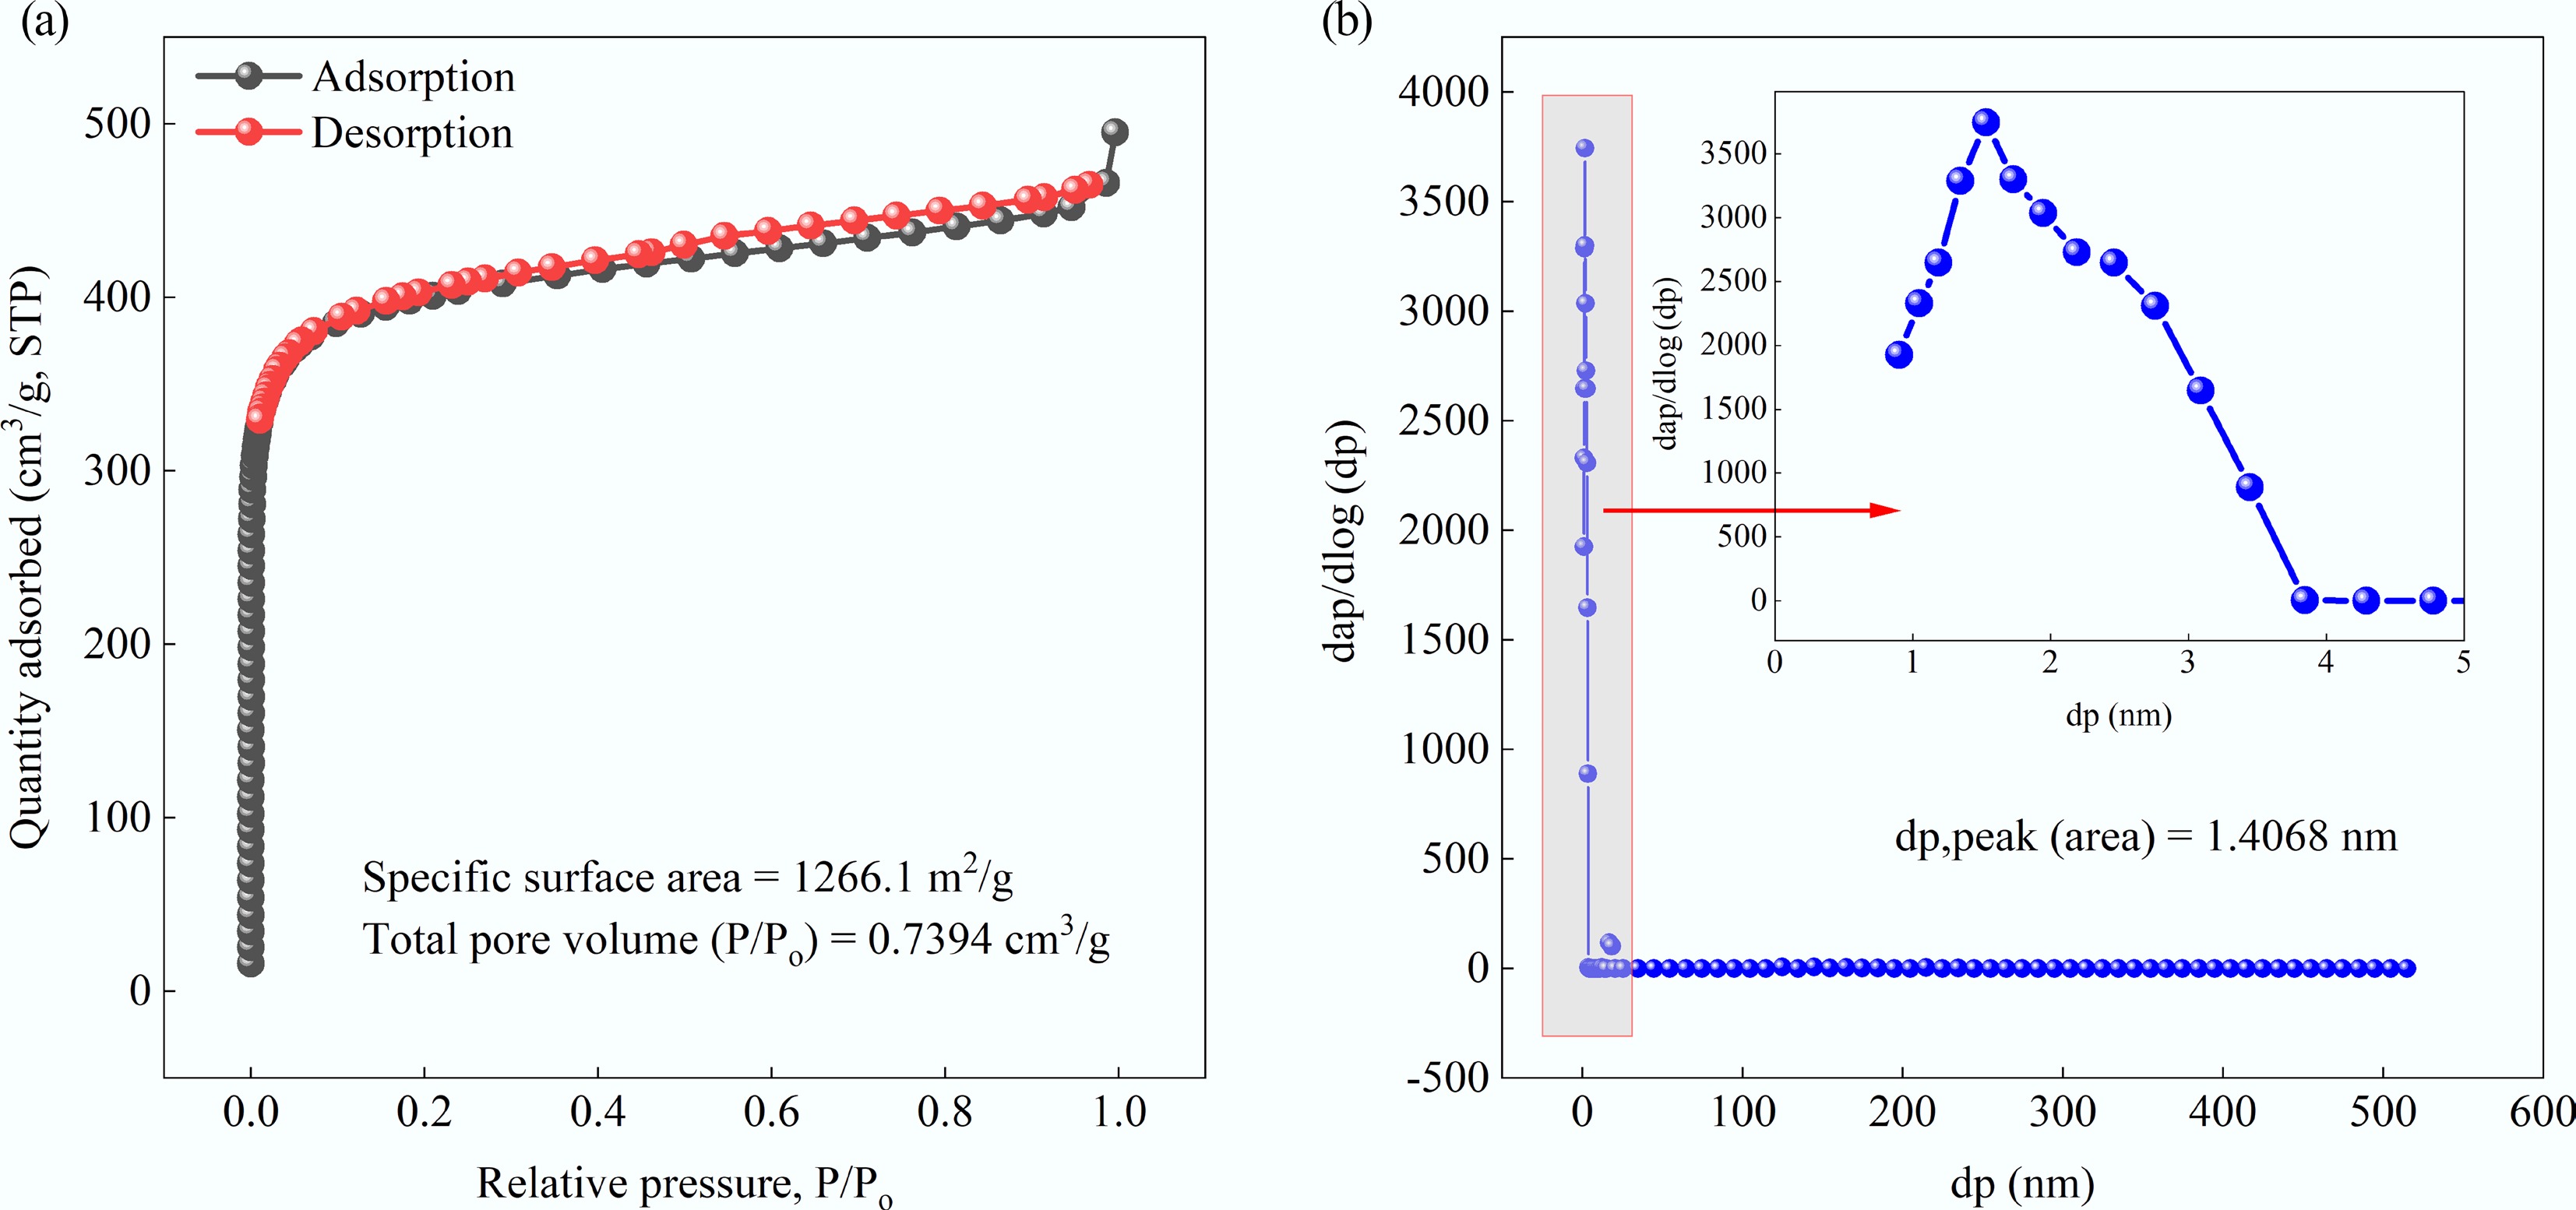
Figure 1.
(a) Adsorption and desorption curves, and (b) pore size distribution of MAHC.
SEM is used as an important tool to understand the surface morphology, the porosity development, and surface structure of MAHC. The obtained SEM images are given in Fig. 2. The SEM images show that MAHC has an irregular, rough, and porous surface, which is commonly observed on the surface of activated carbon[32]. This porous structure with numerous cavities and pores plays a significant role in the adsorption of MB as an adsorbent. The right-hand SEM image at a magnification of 19,000× shows bright spots on the surface of MAHC, which could be related to the introduced Fe and Cu nanoparticles. To confirm this, EDX analysis was also carried out for MAHC. As indicated in Fig. 3, the EDX spectrum of MAHC exhibits the presence of C and O, along with peaks for Fe and Cu. The detection of Fe and Cu suggests the successful incorporation of Fe and Cu nanoparticles during the synthesis process. It can also be found that no K can be observed in the EDX spectrum where KOH was added as a chemical activator. This could imply that acid washing in the synthesis step was complete, and then a cleaner carbon material was produced, thereby resulting in a very low, or even undetectable, K signal in the EDX spectrum.
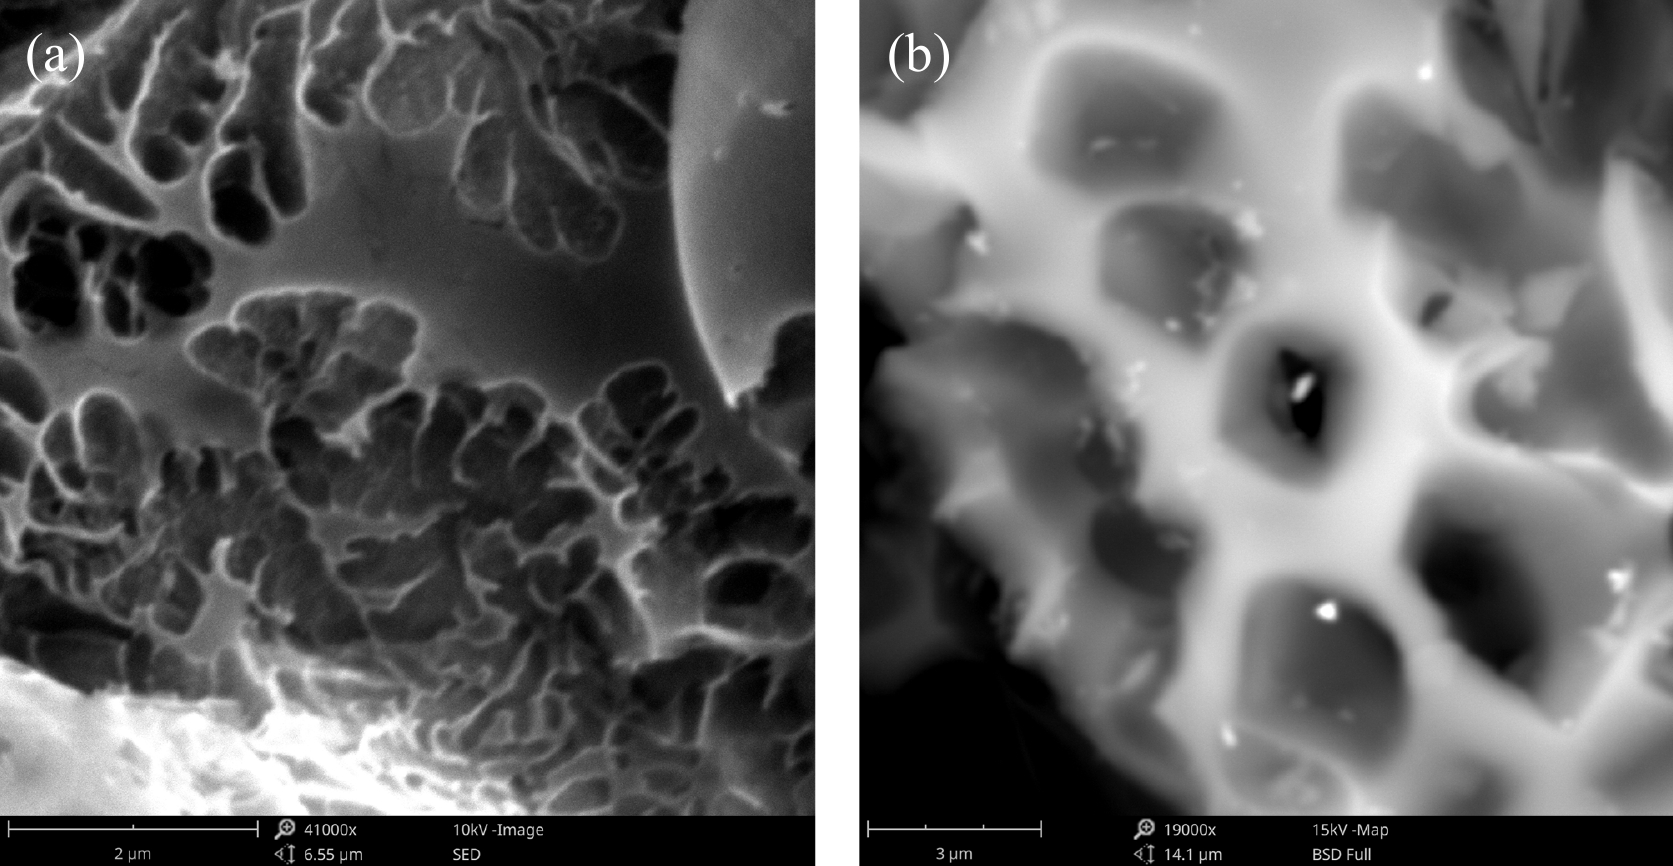
Figure 2.
SEM images of MAHC at different magnifications. (a) 41,000×, and (b) 19,000×.
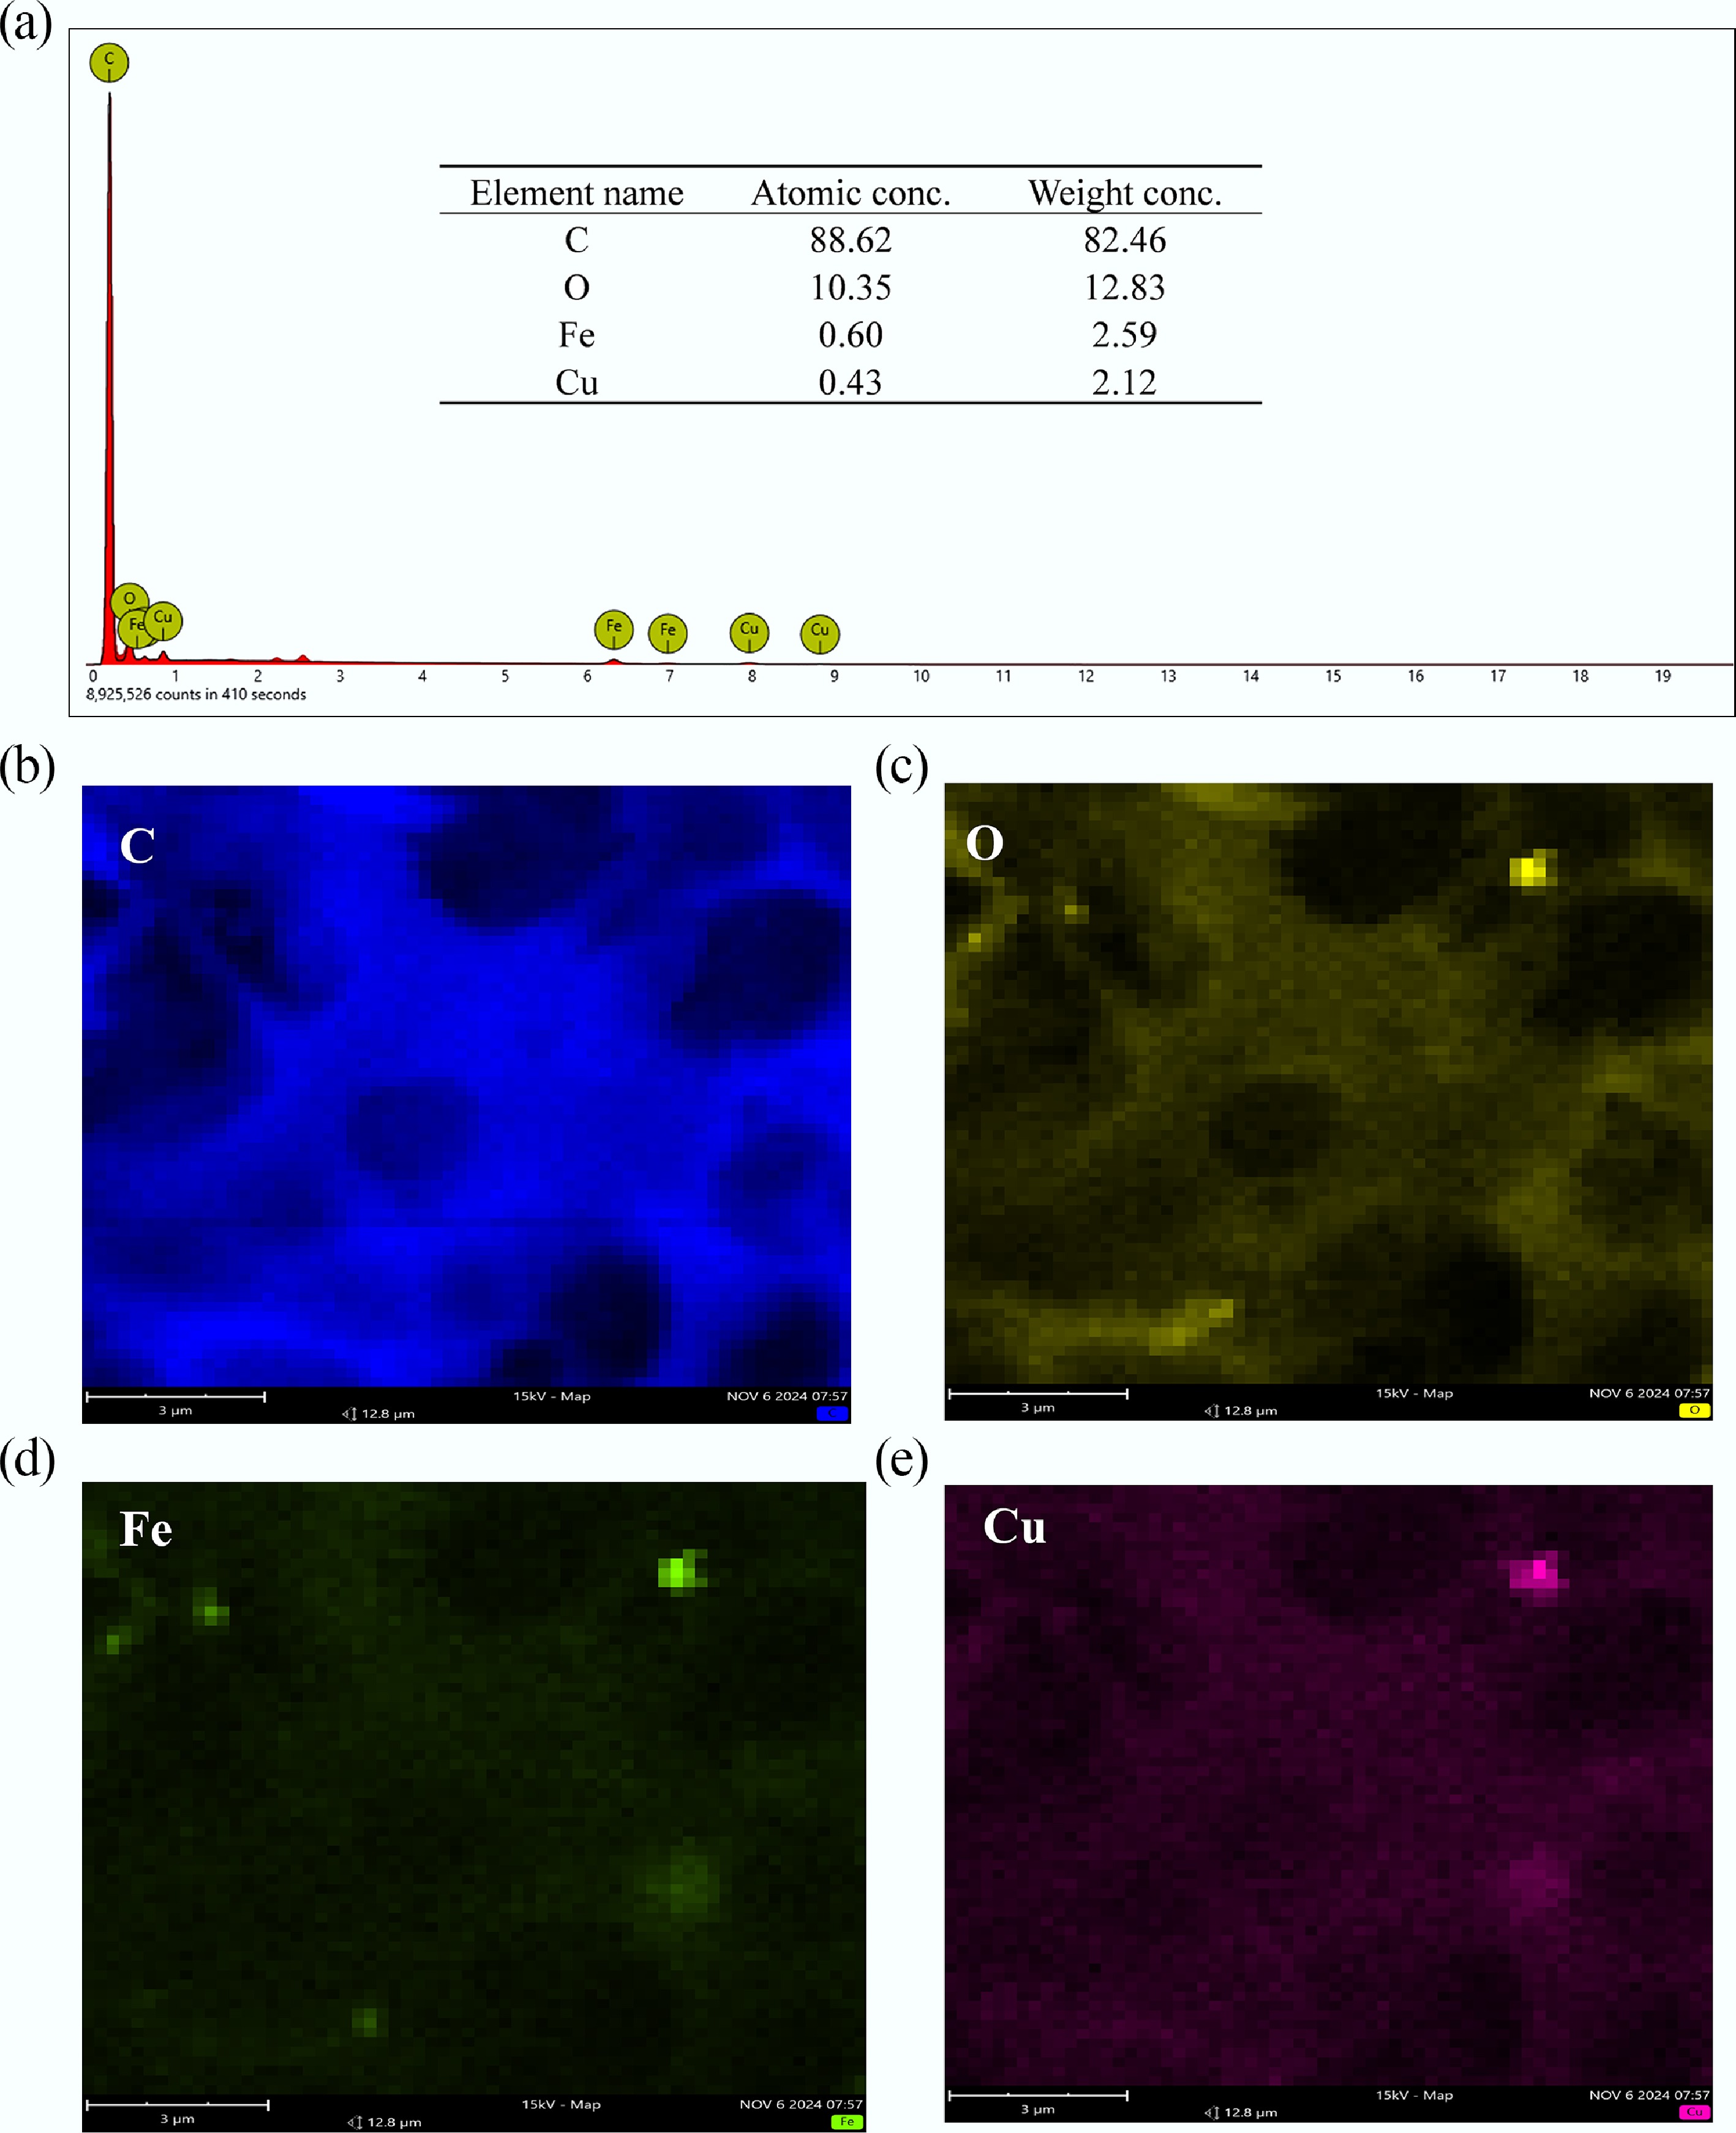
Figure 3.
(a) EDX results of MAHC element composition at the surface, (b) C, (c) O, (d) Fe, and (e) Cu.
To investigate the surface chemistry, the FTIR spectra of sawdust, hydrochar, activated carbon, and hybridized activated carbon are shown in Fig. 4. It can be found that the sawdust and hydrochar showed significant differences in surface functionality; however, no significant differences can be observed in the functional groups on the surface of activated carbon and MAHC. Another major observation is that the functional groups on activated carbon and MAHC are fewer than those of sawdust and hydrochar, which could be due to the high-thermal treatment during the activation step (i.e., 800 °C for 2 h). As indicated in Fig. 4c, d, the peak at 3,667 cm−1 could be related to the −OH group, and peaks at 3,000–2,840 cm−1 could be attributed to the C−H stretching vibration in alkanes. Besides, the peaks between 1,085 and 1,050 cm−1 can be observed in both samples, which could be due to the presence of the C–O stretching vibration present in alcohols. When compared to other activated carbons, and Cu-, Fe-, or Fe/Cu-doped carbon materials, it can be observed that a higher number of functional groups are present. For instance, rice straw-derived activated carbon showed clear peaks corresponding to C=O (1,630 cm−1) and C–C (1,370 cm−1), which were absent in our hybridized activated carbon[33]. This could be due to the differences in the activation methods, where this study applied wet impregnation methods and extremely mild reaction conditions (0.1 M H2SO4 treatment at room temperature, followed by 0.2 M KOH at 25 °C for 24 h). In another study, Cu co-doped activated carbon was prepared for MB removal, and FTIR analysis results indicated that two peaks at 1,750 and 1,500 cm−1, which could represent C=O from carbonyl groups, were observed[34]. Similar to the reason mentioned earlier, aside from the difference in the synthesis method, the low concentration of such functional groups in MAHC makes their detection unachievable by FTIR analysis.
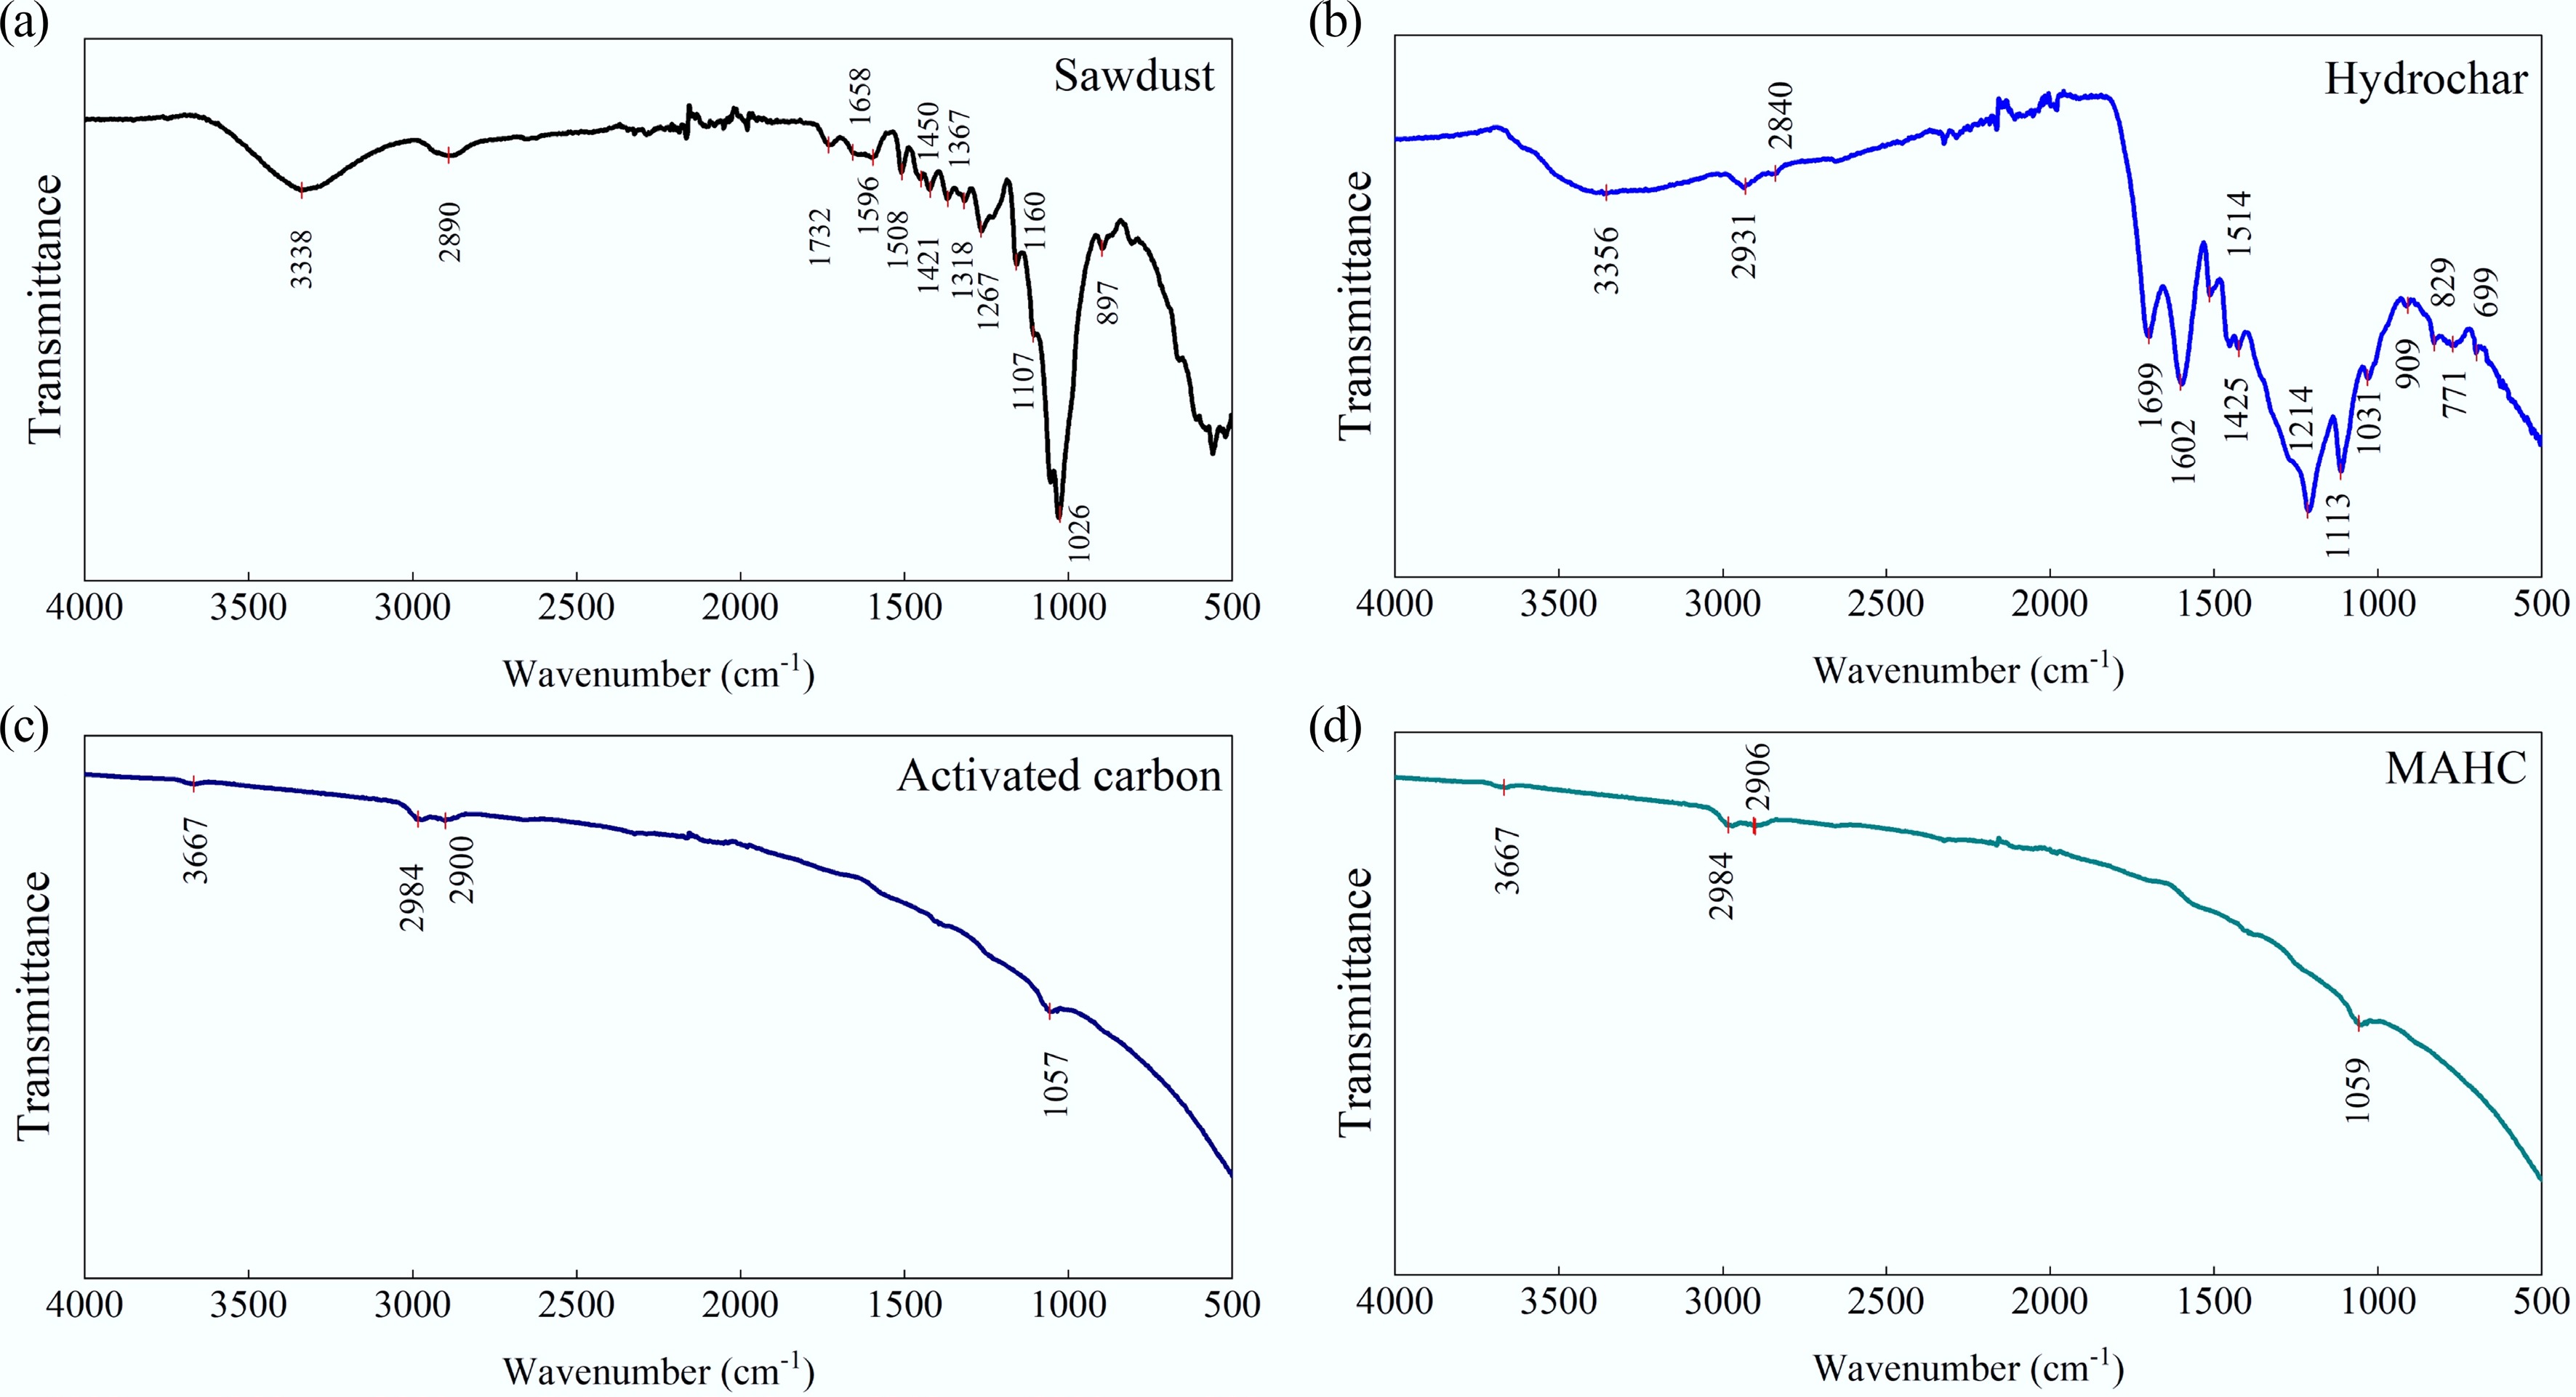
Figure 4.
FTIR spectra of (a) sawdust, (b) hydrochar, (c) activated carbon, and (d) and MAHC.
The thermal degradation characteristics of hybridized activated carbon (i.e., MAHC) in air are shown in Fig. 5. The thermal degradation profile indicates that MAHC showed a slight weight loss of 2.15% at temperatures below 110 °C, which could be mainly related to moisture removal. Two major weight loss stages were observed, peaking at 336 and 386 °C, respectively. This could be owing to the oxidation of carbon. After oxidation, a residual mass of ~7.16 wt.% of the original weight was observed, which could be related to iron oxide and copper oxide[35].
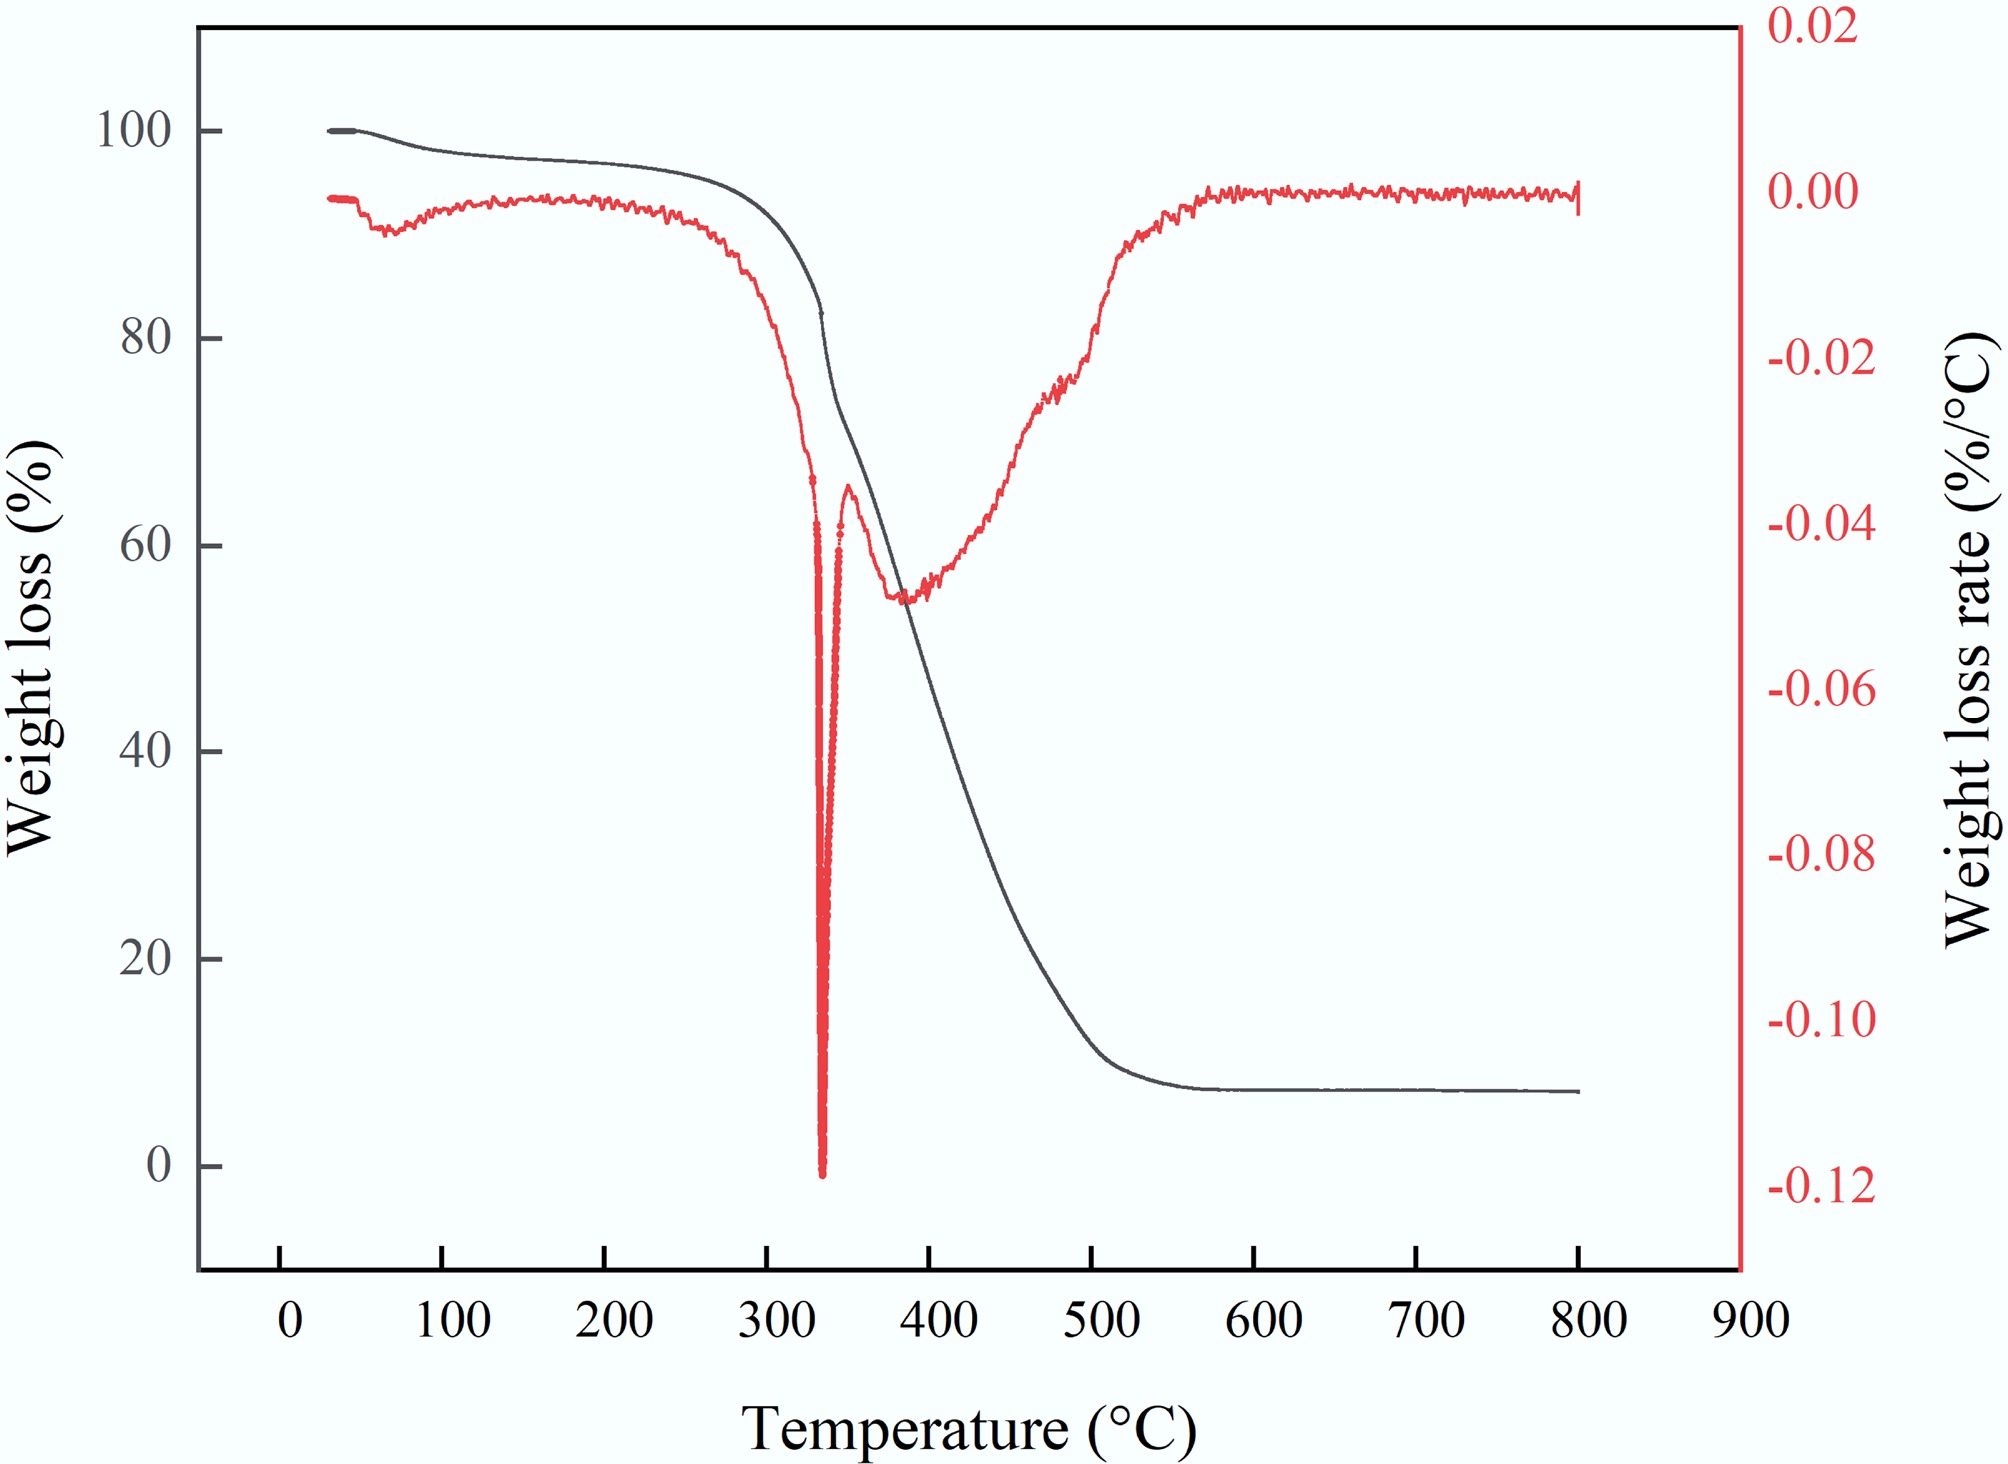
Figure 5.
Thermal degradation characteristics of MAHC.
CHNS results of sawdust, hydrochar, activated carbon, and hybridized activated carbon are summarized in Table 2. Based on the elemental composition results, the Van Krevelen diagram is displayed in Fig. 6. It can be seen that the C content of MAHC was ~79 wt.%, which is higher than that reported in a previous study where the C content of Fe-doped activated carbon from almond shells was 50.48 wt.%–58.78 wt.%. Compared with commercial activated carbon-based adsorbent for wastewater treatment, it can be found that the C content of both MAHC and activated hydrochar is comparable. A high C content may suggest a higher adsorption performance due to better mechanical strength, lower impurity levels, and better chemical inertness, and could contribute to a more developed internal pore structure and hence more adsorption sites for pollutant adsorption. An ash content of 7.16 wt.% was observed in the MAHC, which could be related to the integration of Fe and Cu into the C matrix. Interestingly, it can be found that activated hydrochar contained 10.70 wt.% of ash, which could be caused by the presence of ash in sawdust, and the unwashed K-containing impurities during the KOH activation process. In the KOH activation process, the following chemical reactions could occur.
$ \rm 4KOH+C \leftrightarrow 4K+CO_ {2} +2H_{{2}} {O} $ (10) $\rm 4KOH + 2CO_{2}\leftrightarrow {2K}_{2} {CO}_{ {3}} + 2H_{ {2}} {O} $ (11) Table 2. Elemental composition of sawdust, hydrochar, activated hydrochar, and MAHC
C H O1 N S2 Ash3 Sawdust 47.76 5.90 44.34 n.d. n.d. 2.00 Hydrochar 53.45 3.28 38.18 n.d. n.d. 5.09 Activated hydrochar 78.42 2.72 7.88 0.28 n.d. 10.70 MAHC 79.13 1.26 12.23 0.22 n.d. 7.16 1 Oxygen content was estimated by difference. 2 n.d. represents not detectable. 3 Ash content was measured using thermal gravimetric analysis in air up to 900 °C and held at 900 °C for 30 min. 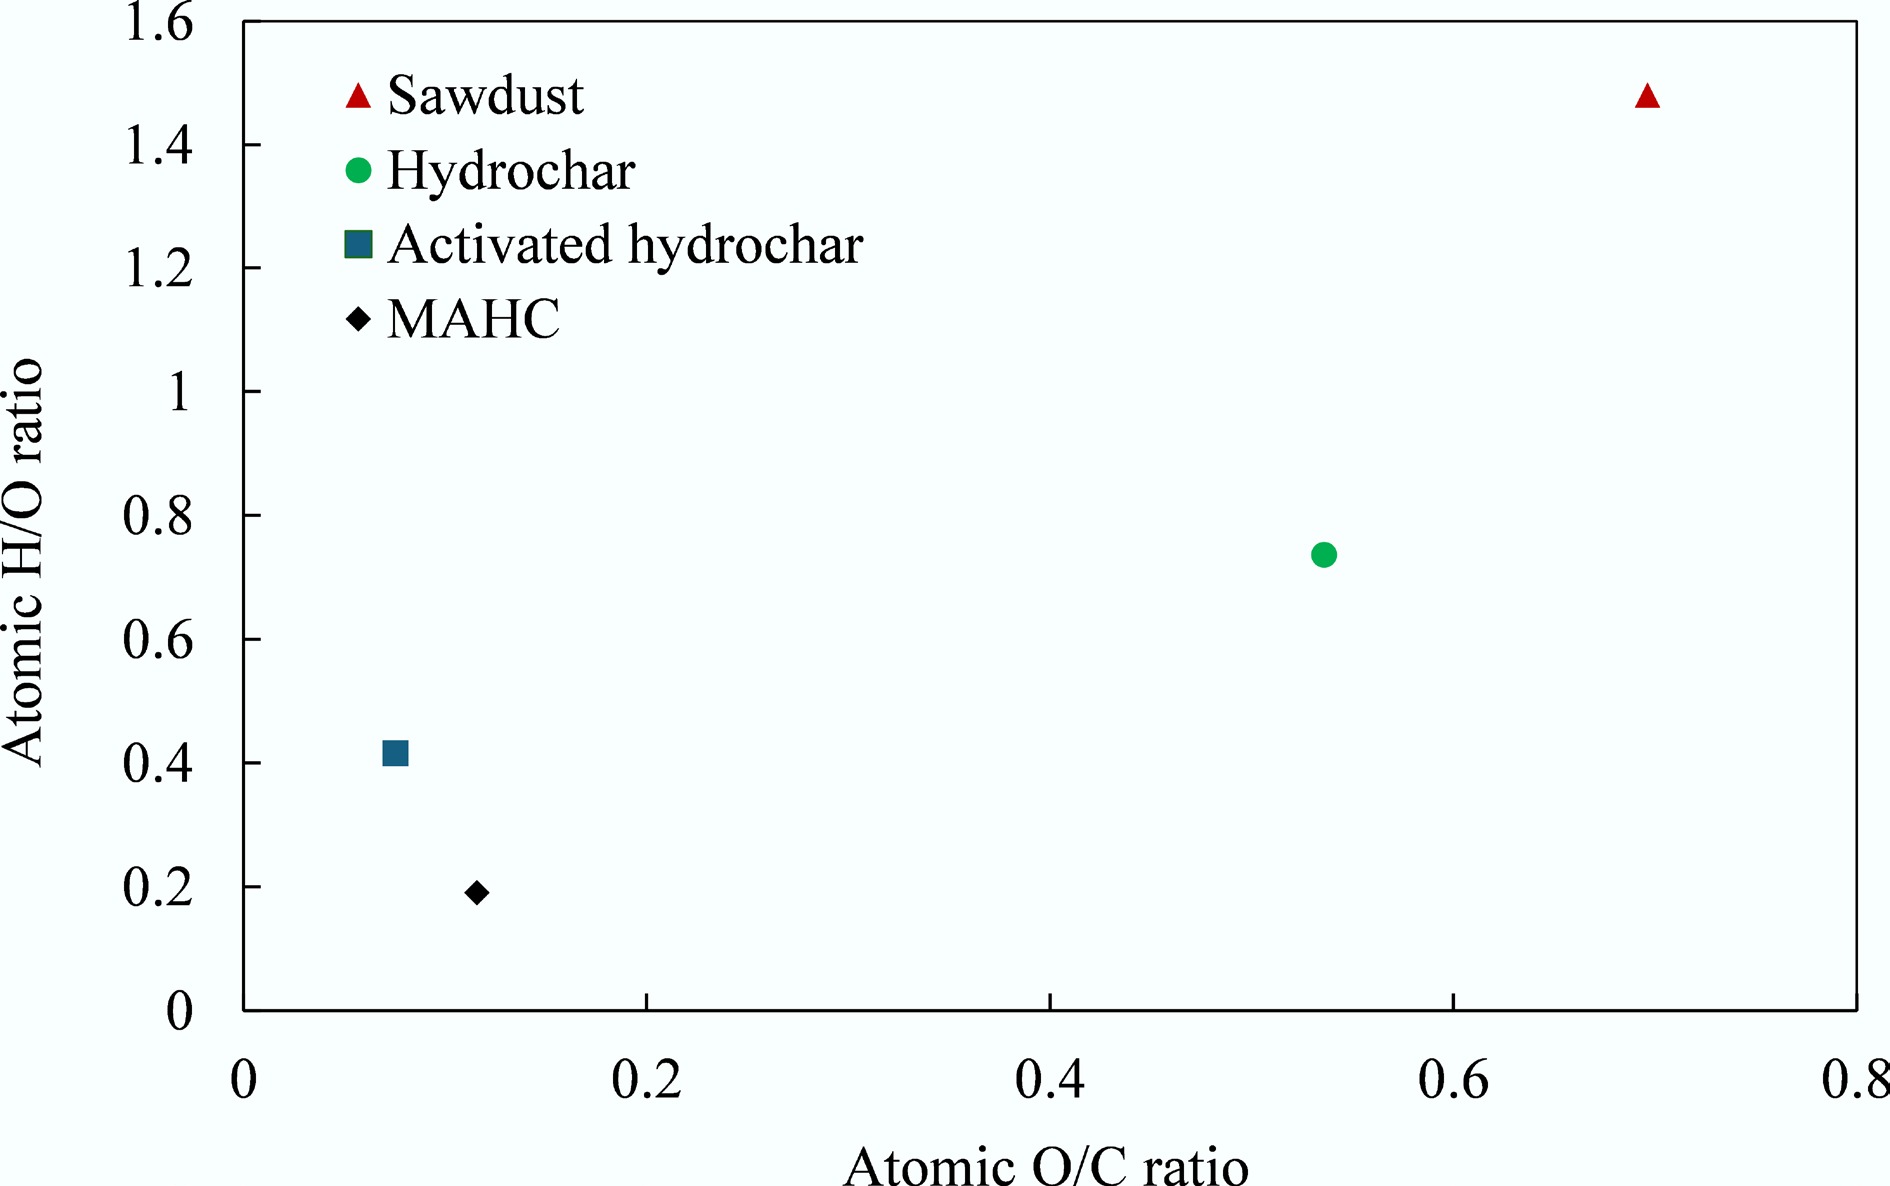
Figure 6.
Van Krevelen diagram.
Iodine number is an indicator for the adsorption performance of activated carbon and is well accepted as a rapid assessment method to determine its quality. The porosity can be characterized by iodine number analysis, and the iodine number result of MAHC was determined to be 612.3 mg/g, as given in Table 3. In general, the iodine number of standard activated carbon falls within the range of 500–1,200 mg/g, and a higher adsorption rate usually can be found in an activated carbon with a higher iodine number. The iodine number of MAHC can be observed to fall within the range of standard activated carbon and is comparable to the results of commercial activated carbon. Compared with the literature, it can be seen that the MAHC provided a higher iodine number than activated carbon derived from sludge with different chemical activating agents. This could be due to the differences in the surface area and micropore volume.
Table 3. Iodine number of MAHC compared with the literature and commercial activated carbon
Iodine number Value (mg/g) This study 612.3 Sludge-derived activated carbon using ZnCl2[36] 531.8 Sludge-derived activated carbon using KCl[36] 376.0 Sludge-derived activated carbon using ZnCl2 and H2SO4[36] 446.9 Sludge-derived activated carbon using ZnCl2 and KOH[36] 363.9 Sludge-derived activated carbon using KOH[36] 439.0 Acorn shell-derived activated carbon using ZnCl2[37] 37–1,209 Calgon carbon (powdered activated carbon) > 500 CS corporation (powdered activated carbon) 500–2,500 Zeta potential is the potential difference between the dispersion medium and the stationary layer of fluid attached to the dispersed particle. It can provide information regarding the surface charge, and the stability of particles, as well as the interaction between solid particles and the bulk phase of the liquid. The results are provided in Fig. 7. The zeta potential of MAHC in the tested pH range (pH = 3–11) was between +11.16 and −55.61 mV. Generally, activated carbon, like MAHC, is considered an amphoteric solid that can react with both acids and bases depending on the surrounding environment, which is owing to the presence of various functional groups on the solid surface. The isoelectric point (pI) , which can be used to qualitatively determine the polarity of the surface charge of the adsorbent, is defined as the pH at which a molecule has no net electrical charge. pI can be determined as the pH value at which the zeta potential becomes zero. Figure 7 shows that the pI of MAHC is ~5.1. At pH < pI, the surface charge of the adsorbent is positive, and thus is favorable for adsorbing anions, while at pH > pI, the surface charge of the adsorbent is negative and hence is beneficial for adsorbing cations[38]. In terms of stability of nanoparticles, a zeta potential with an absolute value greater than 30 mV is critical to ensure their stability in a suspension, as it implies that the electrostatic repulsion between nanoparticles is sufficiently strong to prevent aggregation[39]. The results show that the absolute value of the zeta potential of MAHC is above 30 mV at pH values > ~9.5, suggesting that the Fe-Cu nanoparticles in the activated carbon matrix are colloidally stable.
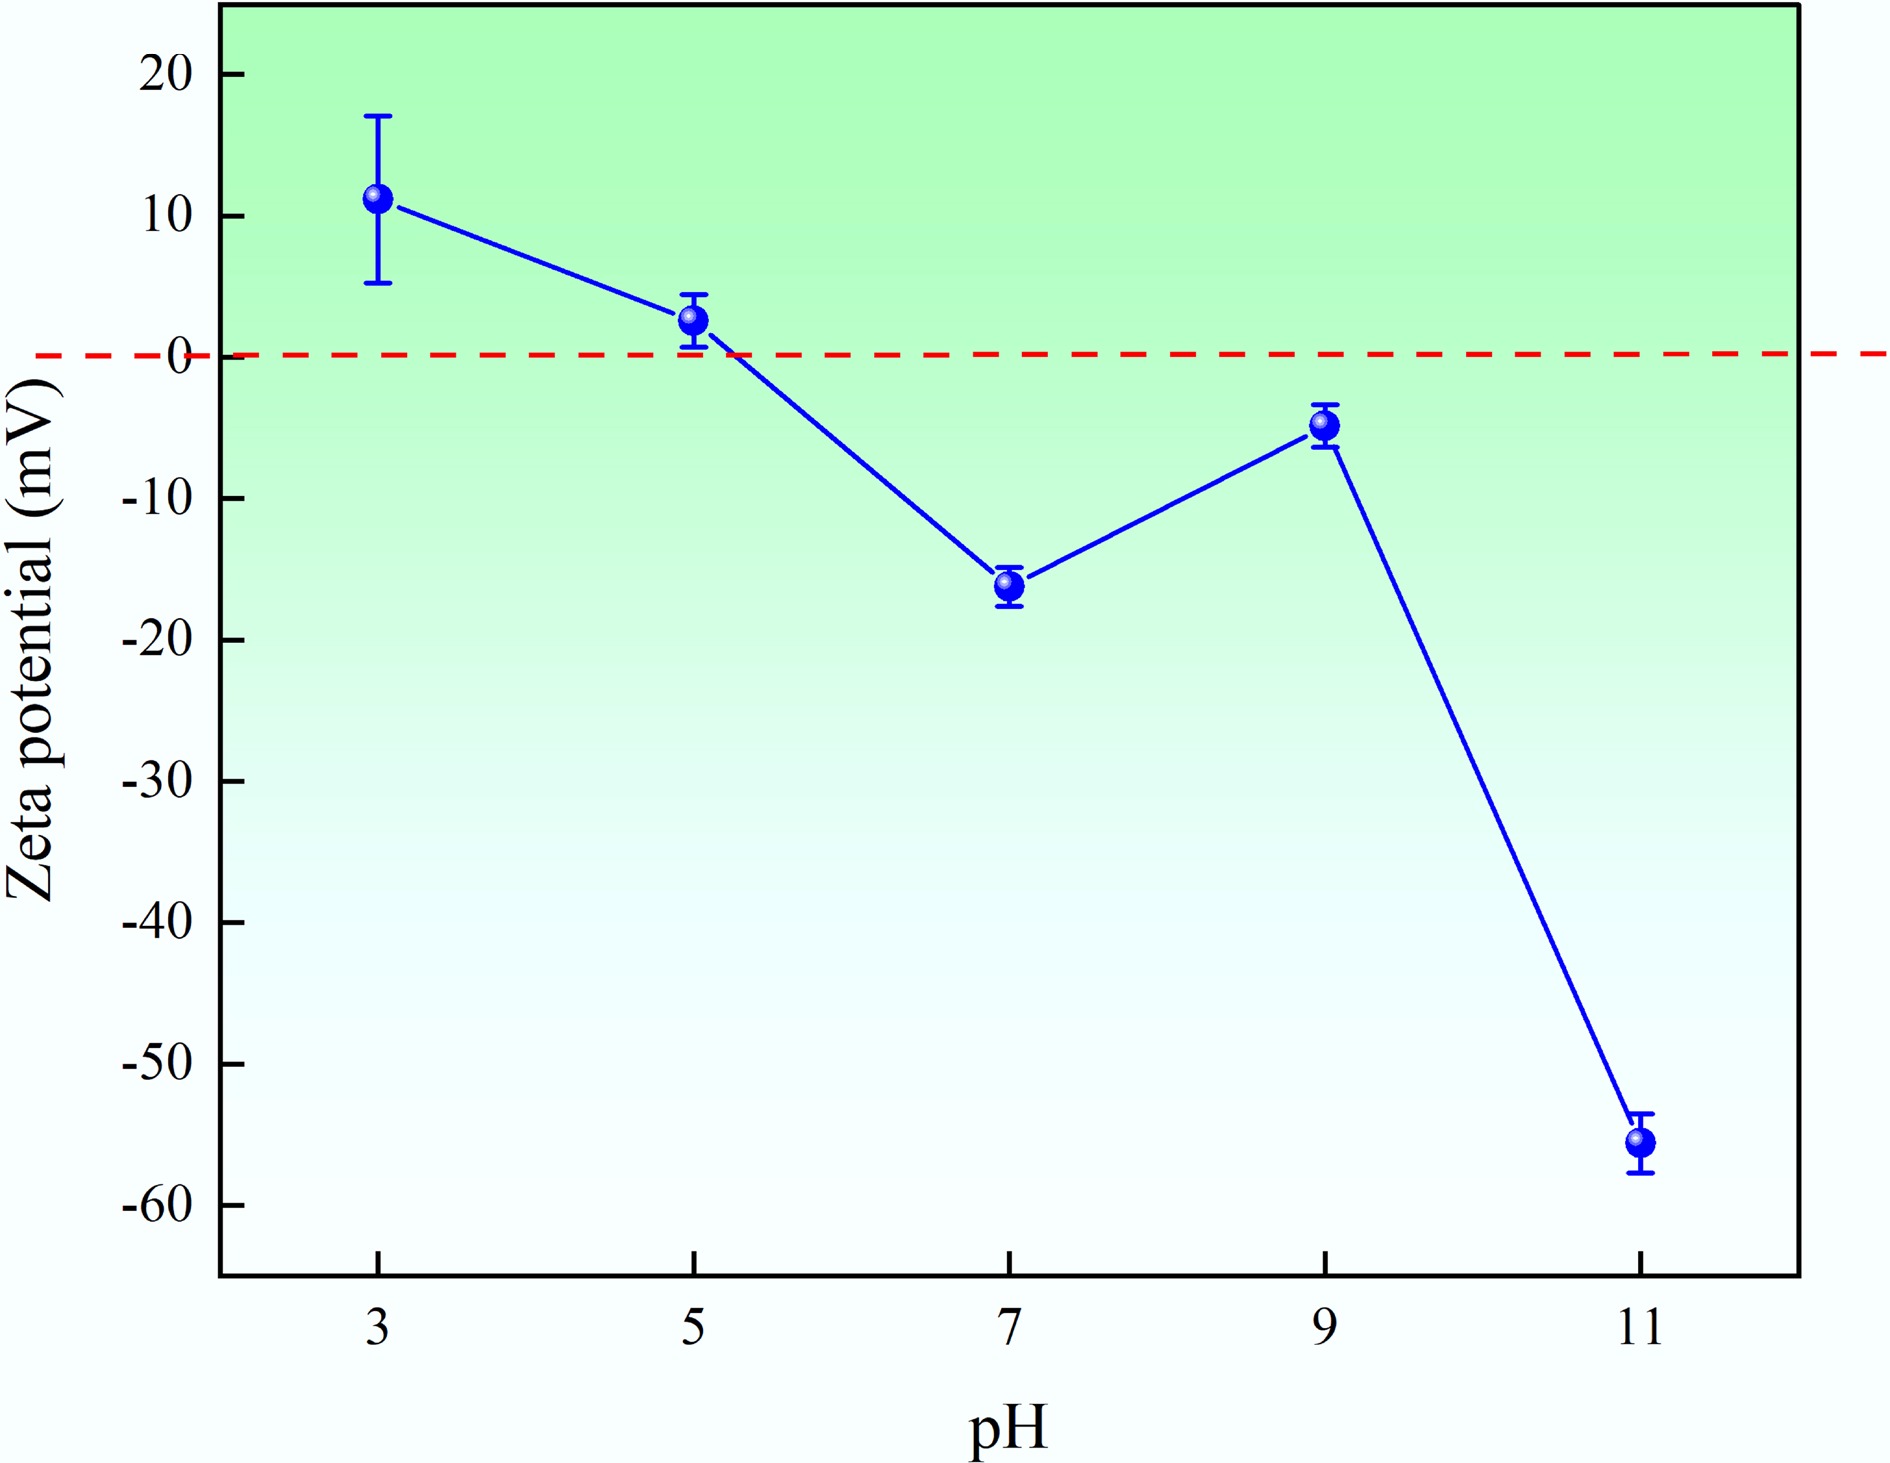
Figure 7.
Zeta potential results of MAHC at different pH levels.
Effect of operational parameters on MB adsorption
Preliminary test
-
In a preliminary experiment, the effect of pH on the adsorption performance of MAHC was investigated at three different pH levels of 4, 7, and 10 at 24 °C. Briefly, MAHC samples in three different concentrations (25, 50, and 75 ppm) were added to a 200 mL aliquot of preprepared 5 ppm MB solution. The resultant adsorption efficiency is given in Fig. 8. It can be observed that at a fixed concentration of MAHC, the effect of pH level on adsorption efficiency was minor. This result could suggest that the surface charge (either positively or negatively charged) does not significantly affect the MB adsorption, and thus, electrostatic attraction is actually not the governing mechanism in the adsorption of MB onto MAHC. On the other hand, with an increase in MAHC concentration, the adsorption efficiency of MB increased proportionally. Similar results were reported by Altıntıg et al.[40]. The increase in adsorbent amounts leads to an increase in the number of available adsorption sites and surface area, thereby enhancing MB adsorption efficiency. This could also explain why adsorption efficiency almost reached 100% at 75 ppm MAHC across all studied pH levels. Overall, together with the zeta potential results, the pH level of 10 was selected for the following batch adsorption experiment.
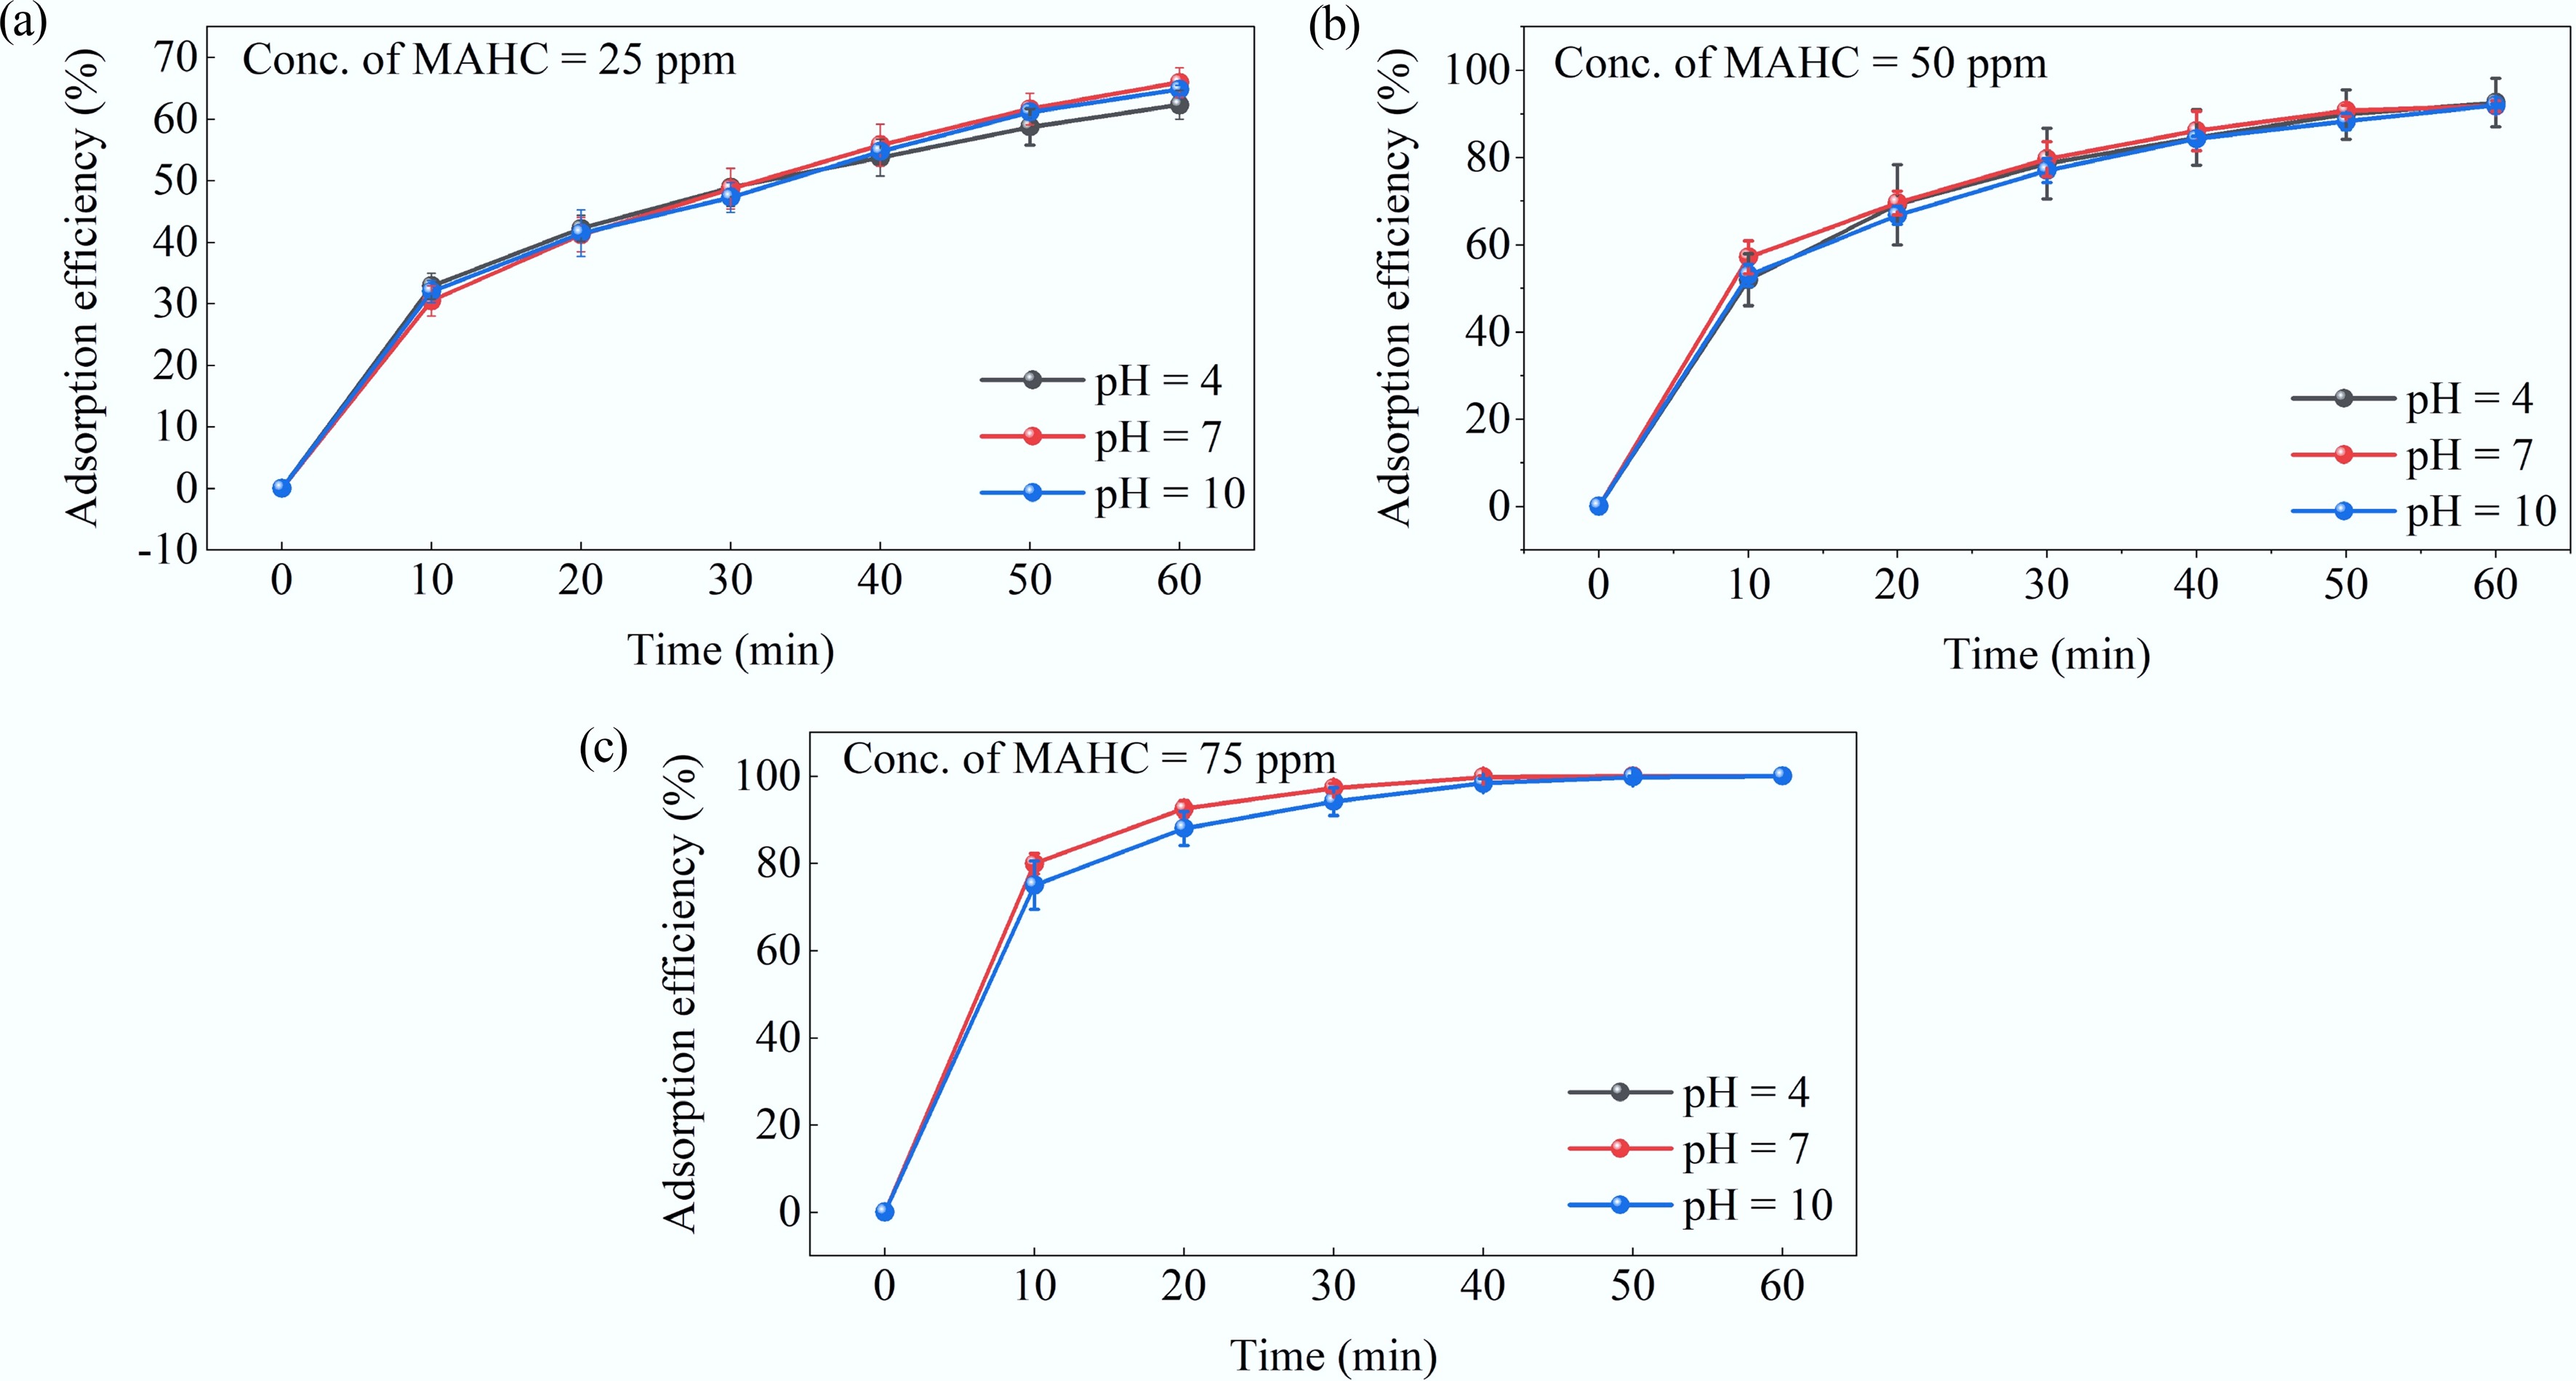
Figure 8.
Effect of pH level on the adsorption efficiency of MAHC obtained at MB concentration of 5 ppm, 24 °C, and (a) 25 ppm MAHC, (b) 50 ppm MAHC, and (c) 75 ppm MAHC.
Batch adsorption experiments
-
Next, batch adsorption experiments were redesigned after selecting the pH based on the preliminary results. Initially, batch adsorption was carried out at two different concentrations (10 and 50 ppm) of MB, and the adsorption capacity of 10 mg of MHAC in 1 L of MB solutions (or 10 ppm) was investigated at pH 10 and 24 °C. The results are given in Fig. 9a. Although there was no significant difference between the MB adsorption capacity for different concentrations at t < 12 h, the increase in the MB concentration enhanced the adsorption capacity at t = 23 h. This trend was also previously reported by Karaer & Kaya[41]. At t = 23 h, the adsorption capacity obtained at 10 ppm MB and 50 ppm MB was 410.6 and 481.6 mg/g, respectively. This result is attributed to the higher concentration gradient of MB between the solution and the adsorbent surface, which increases the driving force for mass transfer at higher MB concentrations and promotes the interaction between MB and the adsorbent's surface, thereby resulting in a higher MB adsorption capacity[42]. One interesting finding is that the adsorption by MAHC slowly reached a plateau after 23 h, but continued to increase in adsorption capacity for MB at 50 ppm after 23 h. Compared to the literature, either hybridized activated carbon or activated composite can reach a plateau in terms of adsorption capacity within 1 or 2 h[41,42]. This could indicate that the adsorption rate of our adsorbent is much lower than that of other materials reported in the literature, and thus it is not kinetically optimal. One possible reason could be related to the highly microporous structure of MAHC, as indicated in the pore size distribution plot (Fig. 1b), since the smaller pore size restricts the movement of adsorbate molecules and thus, slows down their diffusion to the internal surface area for adsorption, like the MB molecule (1.7 nm × 0.76 nm × 0.33 nm). This leads to slow adsorption kinetics, and overall mass transfer will be limited for larger adsorbates. This can be proven by the average pore diameter of activated carbon and magnetic activated carbon of 3.78–4.16 nm reported in the literature, in which the adsorption capacity reached a plateau within 100 min[42]. The concentration of MB of 50 ppm was chosen for the following investigation on the influence of the adsorbent amount on the adsorption capacity.
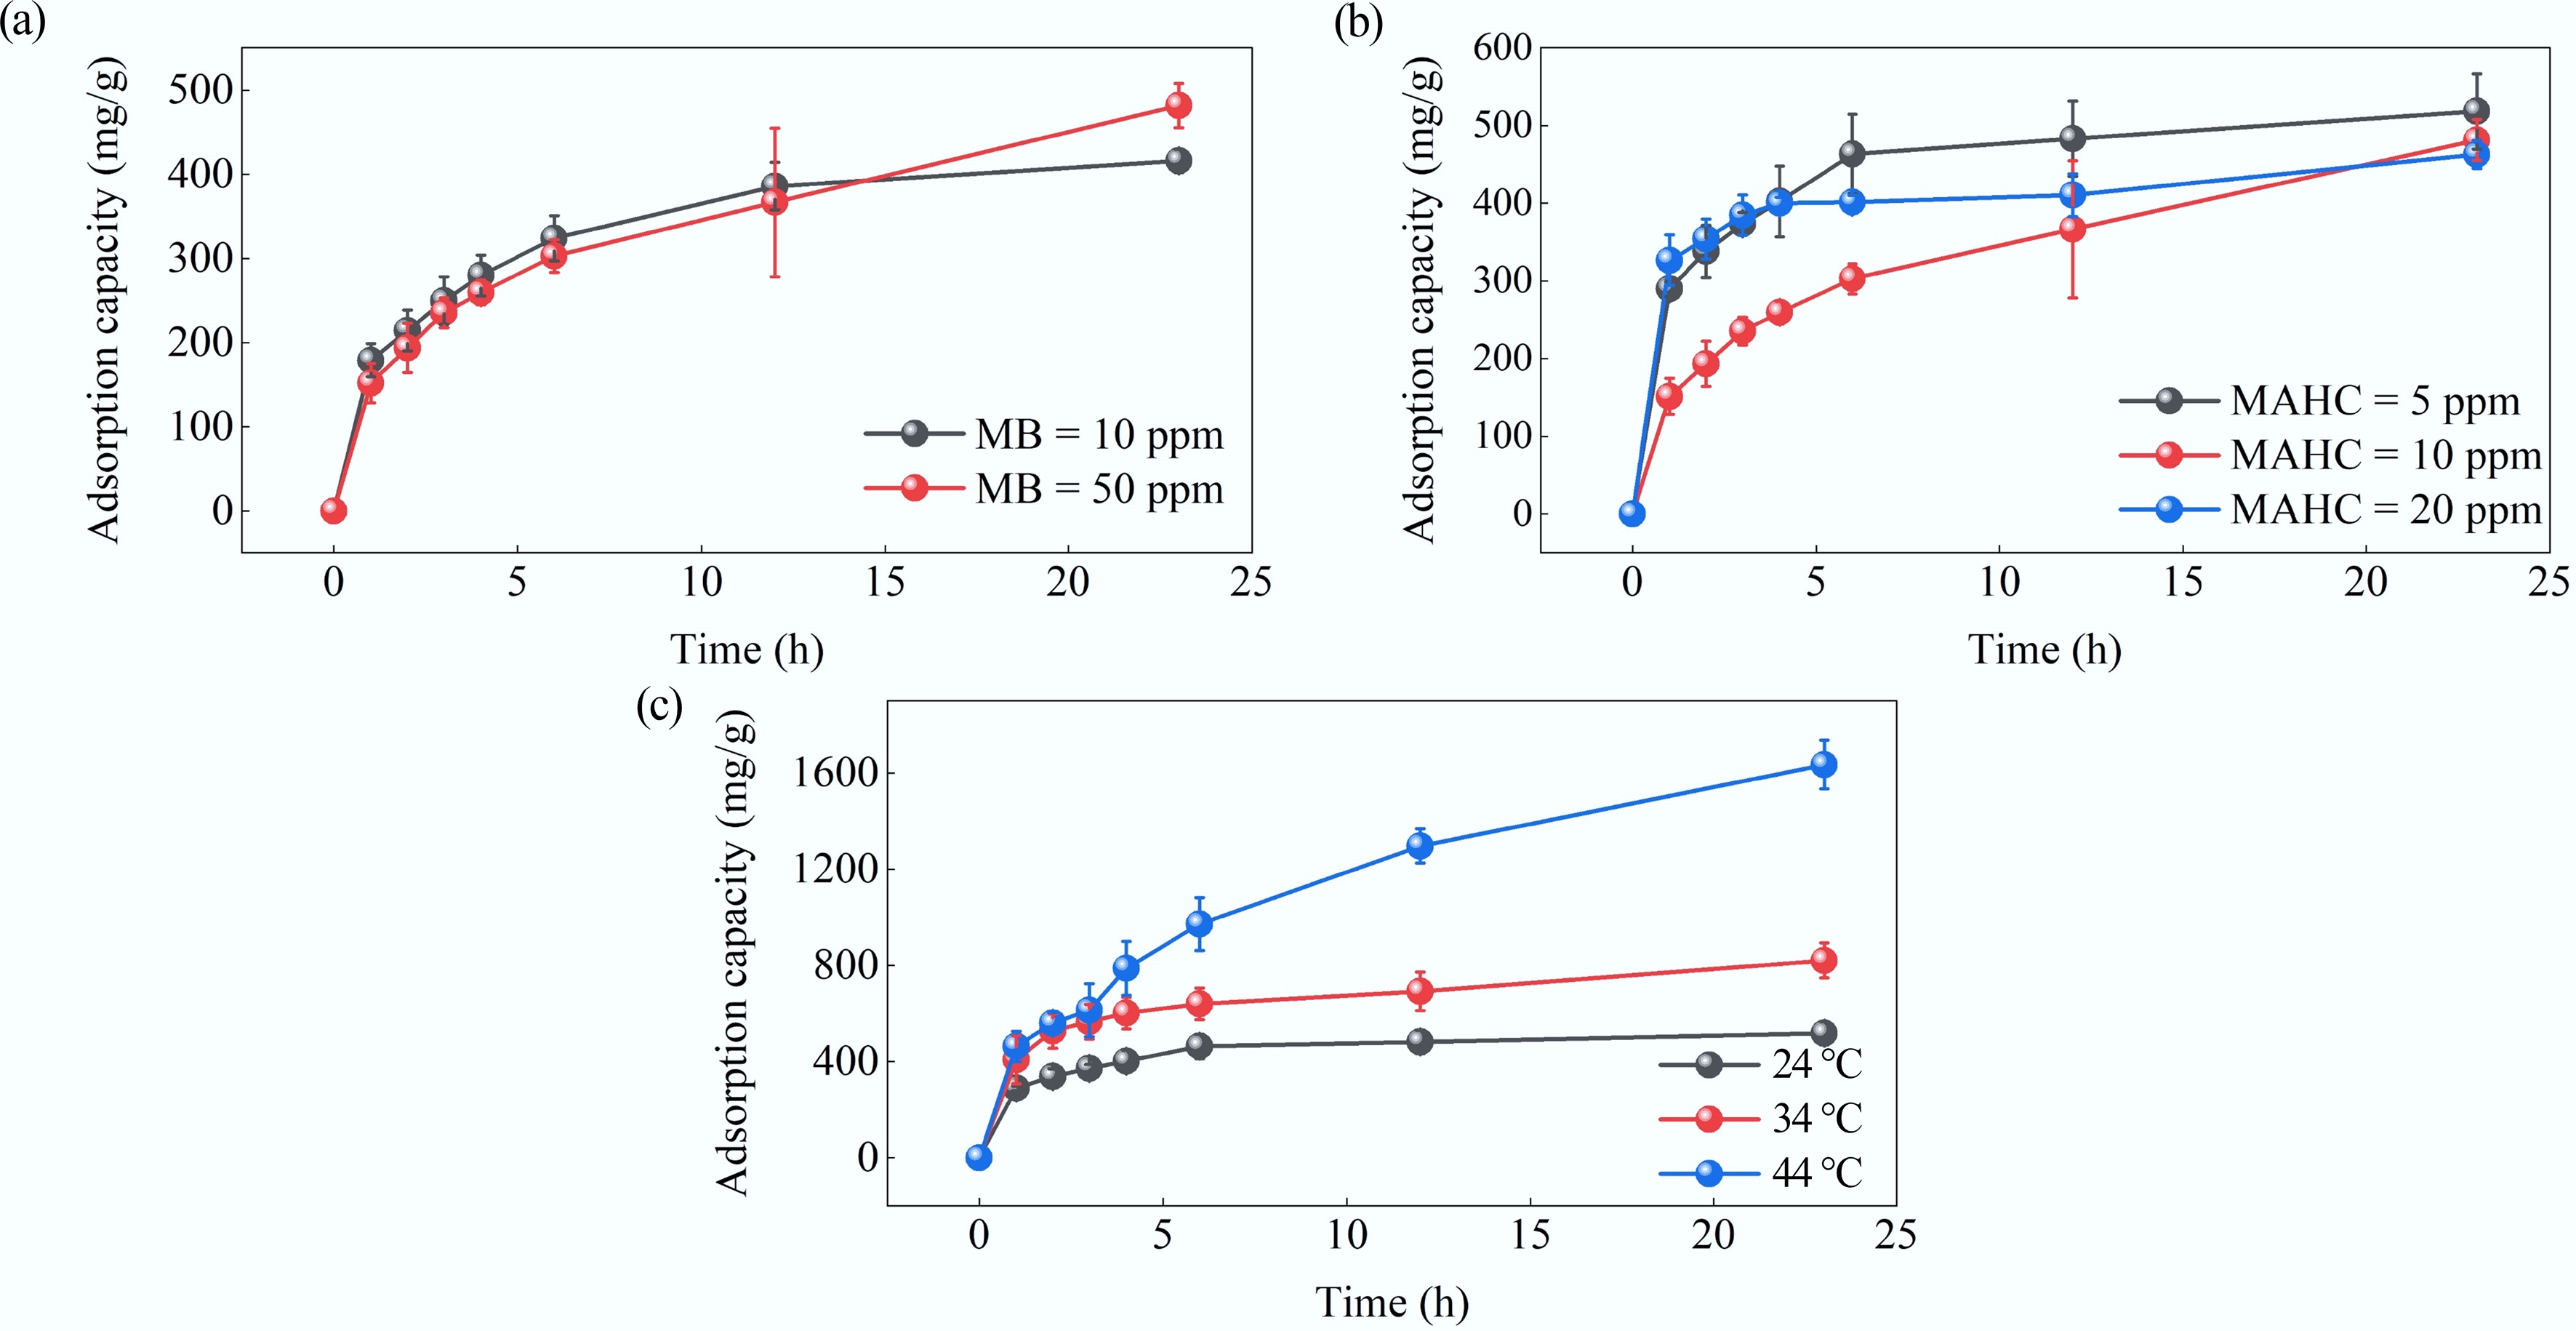
Figure 9.
Effect of (a) MB concentration, (b) MAHC amount, and (c) temperature on adsorption capacity.
The adsorbent concentration is another significant factor that affects MB adsorption capacity, and its effect was explored at 24 °C, pH 10, an MB concentration of 50 ppm, and using three adsorbent amounts: 5, 10, and 20 ppm. The results are shown in Fig. 9b. It can be seen that the adsorption capacity decreases with increasing adsorbent amount, which is in good agreement with the literature[43]. This is because the amount of MB to be adsorbed remains constant at the different MAHC amounts studied, while the total number of available adsorption sites increases with increasing MAHC amounts, thereby resulting in a lower amount of MB adsorbed per unit mass of adsorbent.
The effect of temperature on the adsorption of MB was studied at a pH of 10, an MB concentration of 50 ppm, an MAHC amount of 5 ppm, and three different temperatures of 24, 34, and 44 °C, and the results are depicted in Fig. 9c. The results showed that the highest adsorption capacity of MAHC of 1,635.28 mg/g was achieved at a pH of 10, with 50 ppm MB solution, 5 ppm MAHC, and 44 °C. It can be found that the adsorption capacity was proportional to temperature, implying the endothermic nature of this adsorption process. This is because the adsorption of MB onto hybridized activated carbon is not just a simple physisorption process, but instead a combination of physisorption and chemisorption. The trend was also previously reported by Yao et al.[44] and Ghaedi et al.[45]. Additionally, it should be noted that a big increase in adsorption capacity can be observed when increasing the temperature from 24 to 44 °C. This implies that a higher temperature is required to enhance the adsorption performance of MAHC; however, this leads to a potential limitation of the use of MAHC in wastewater and possibly water purification. In industrial practice for wastewater treatment or water purification, the adsorption of contaminants is typically conducted at or near room temperature. In future studies, it is important to modify the MAHC material to improve its kinetics and adsorption capacity at or near room temperature.
Compared with other adsorbents for removing MB from solution, our adsorbent materials showed comparable or superior adsorption capacity. Hien Tran et al.[46] reported that the maximum MB adsorption capacity was 489.56 mg/g for KOH-activated hydrochar derived from corncob. In another study, at 30 °C, Qian et al.[47] observed that the highest MB adsorption capacity of 655.76 mg/g was achieved using NaOH- and chlorane-modified hydrochar. In a study by Islam et al.[48], it was found that the highest adsorption capacity for MB was 200.01 mg/g at 30 °C when using NaOH-activated coconut shell-derived hydrochar.
Adsorption isotherms
-
The Langmuir, Freundlich, and Temkin adsorption isotherms for MB adsorption onto MAHC, and the associated computational parameters are presented in Fig. 10a–c and Table 4, respectively. The results indicated that the Freundlich model (R2 = 0.97576) fits the experimental data better than the Langmuir and Temkin models (R2 = 0.6629 and 0.97114, respectively). This implies that the Freundlich model is more suitable for describing the adsorption behavior of MB on the MAHC. In contrast to much of the literature, this work demonstrated that the adsorption behavior of MB on the MAHC did not fit well with the Langmuir model, which is widely reported to fit well with adsorption experiments using carbon-based materials[32, 49]. According to this result, it can be stated that multilayer adsorption on a heterogeneous surface with a non-uniform distribution of adsorption heat is more dominant in MB adsorption using MAHC than monolayer adsorption on a homogeneous surface with uniform adsorption sites. The Freundlich adsorption isotherm parameters, including the dimensionless constant kF and n, represent the capacity and intensity of the adsorption, respectively. As shown in Table 4, the value of n is above 1, indicating that the adsorption of MB onto MAHC is favorable[50]. Al-Musawi & Al-Qaim[51] used waste fig fruits to prepare activated carbon for MB adsorption and found that the adsorption process fitted the Freundlich isotherm better than the Langmuir isotherm. A similar finding was previously reported by Buhani et al.[52], who utilized rubber fruit shells as raw materials to fabricate adsorbent materials.
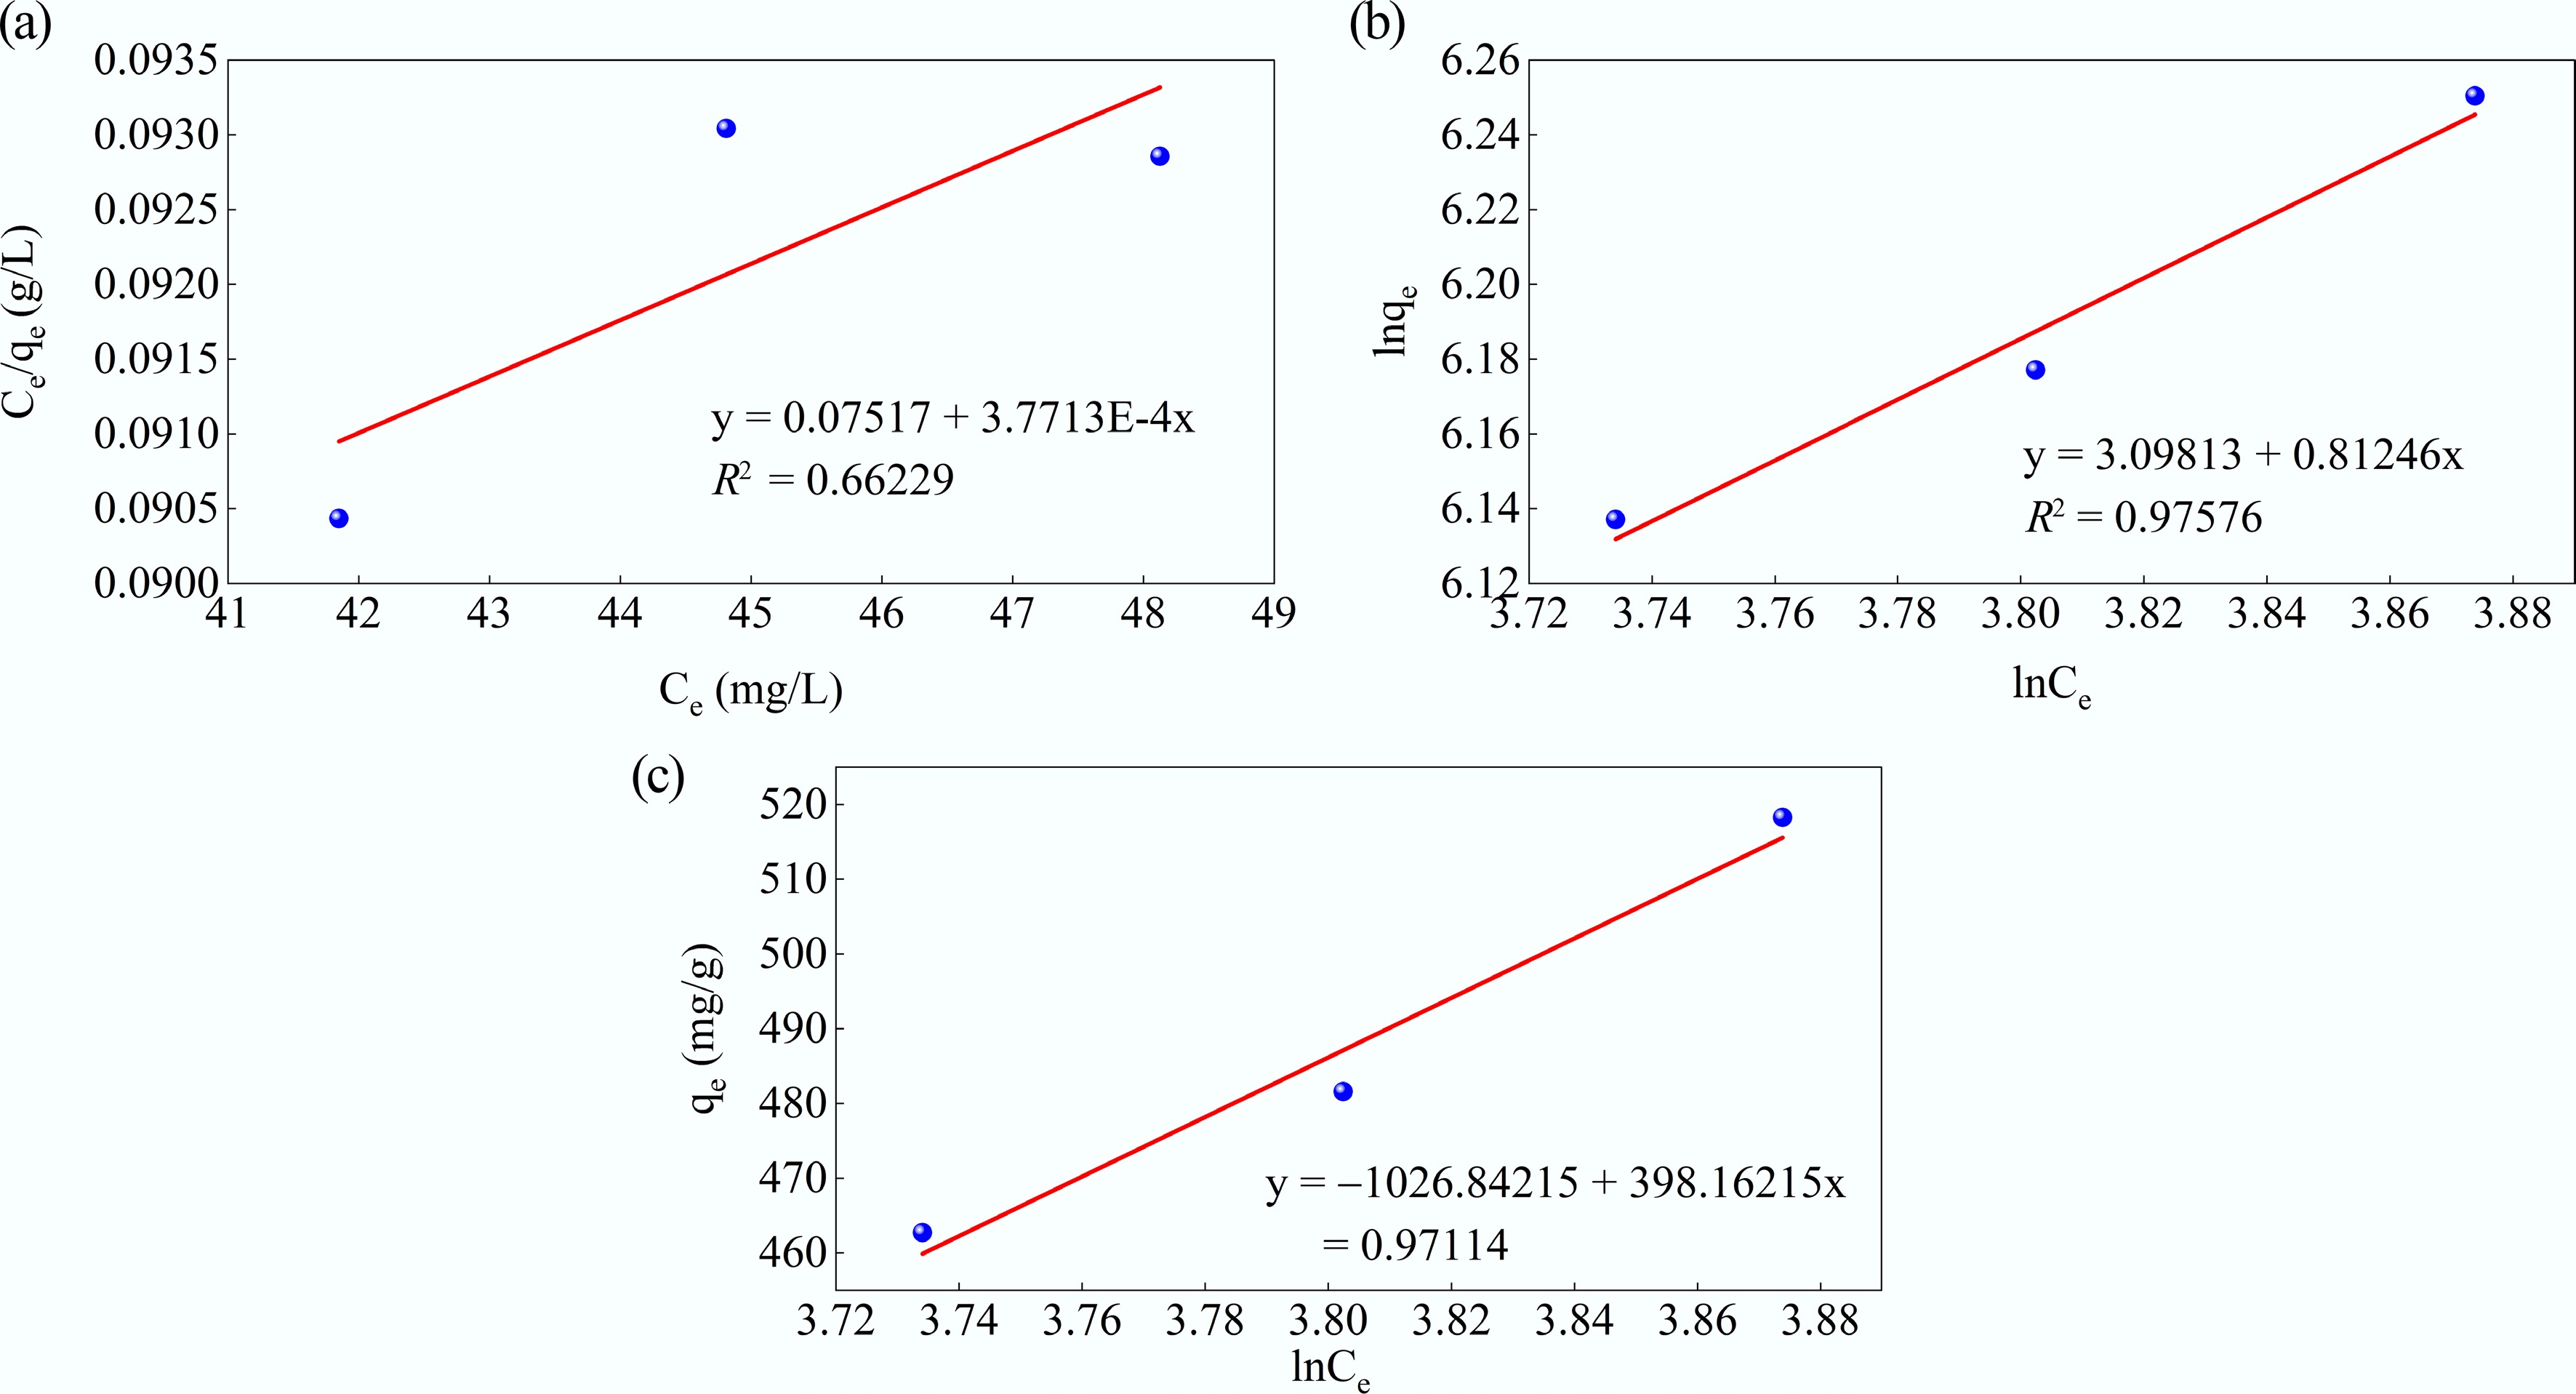
Figure 10.
(a) Langmuir, (b) Freundlich, and (c) Temkin adsorption isotherms for MB adsorption at 50 ppm MB, pH = 10, MAHC = 5–20 ppm, and 24 °C.
Table 4. Isotherm model parameters
Isotherm model Parameter Values Langmuir qm (mg/g) 2,651.606 kL(L/mg) 0.005017 R2 0.66229 Freundlich 1/nf 0.81246 kf (mg/g)(L/mg)1/n 22.15648 R2 0.97576 Temkin bt 0.006205 kT (L/mg) 0.075853 R2 0.97114 Adsorption kinetics
-
The adsorption kinetics of MB onto MAHC were initially evaluated using the pseudo-first-order and pseudo-second-order models at 24–44 °C, pH 10, in a 50 ppm MB solution, and with an MAHC amount of 5 ppm. Both models can help determine whether the interaction between the adsorbate and active sites on the MAHC's surface is chemical or physical in nature, and the resulting model parameters and linear plots are given in Figs 11 and 12, respectively. The associated kinetic model fitting parameters for MB adsorption on MAHC are summarized in Table 5. The pseudo-first-order and pseudo-second-order models showed fitness with experimental data, with correlation coefficient (R2) values in the range of 0.739–0.980, and 0.978–0.999, respectively. It can be clearly seen that the pseudo-second-order model provided a better fit than the pseudo-first-order model, implying that the chemisorption is a rate-limiting step for the MB adsorption onto MAHC. As shown in Table 5, the calculated qe values from pseudo-second-order model were also in good agreement with experimental values (see Fig. 9). Similar findings were previously reported by Lyu et al.[53]. The pseudo-second-order model was also identified to be the most suitable kinetic model when using activated carbon derived from Coriandrum sativum to adsorb MB[54]. Typically, the pseudo-second-order model is more accurate than the pseudo-first-order model, since the pseudo-first-order model assumes the rate of adsorption is controlled by the number of available active sites, whereas the pseudo-second-order model considers the interaction between the adsorbate and adsorbent.
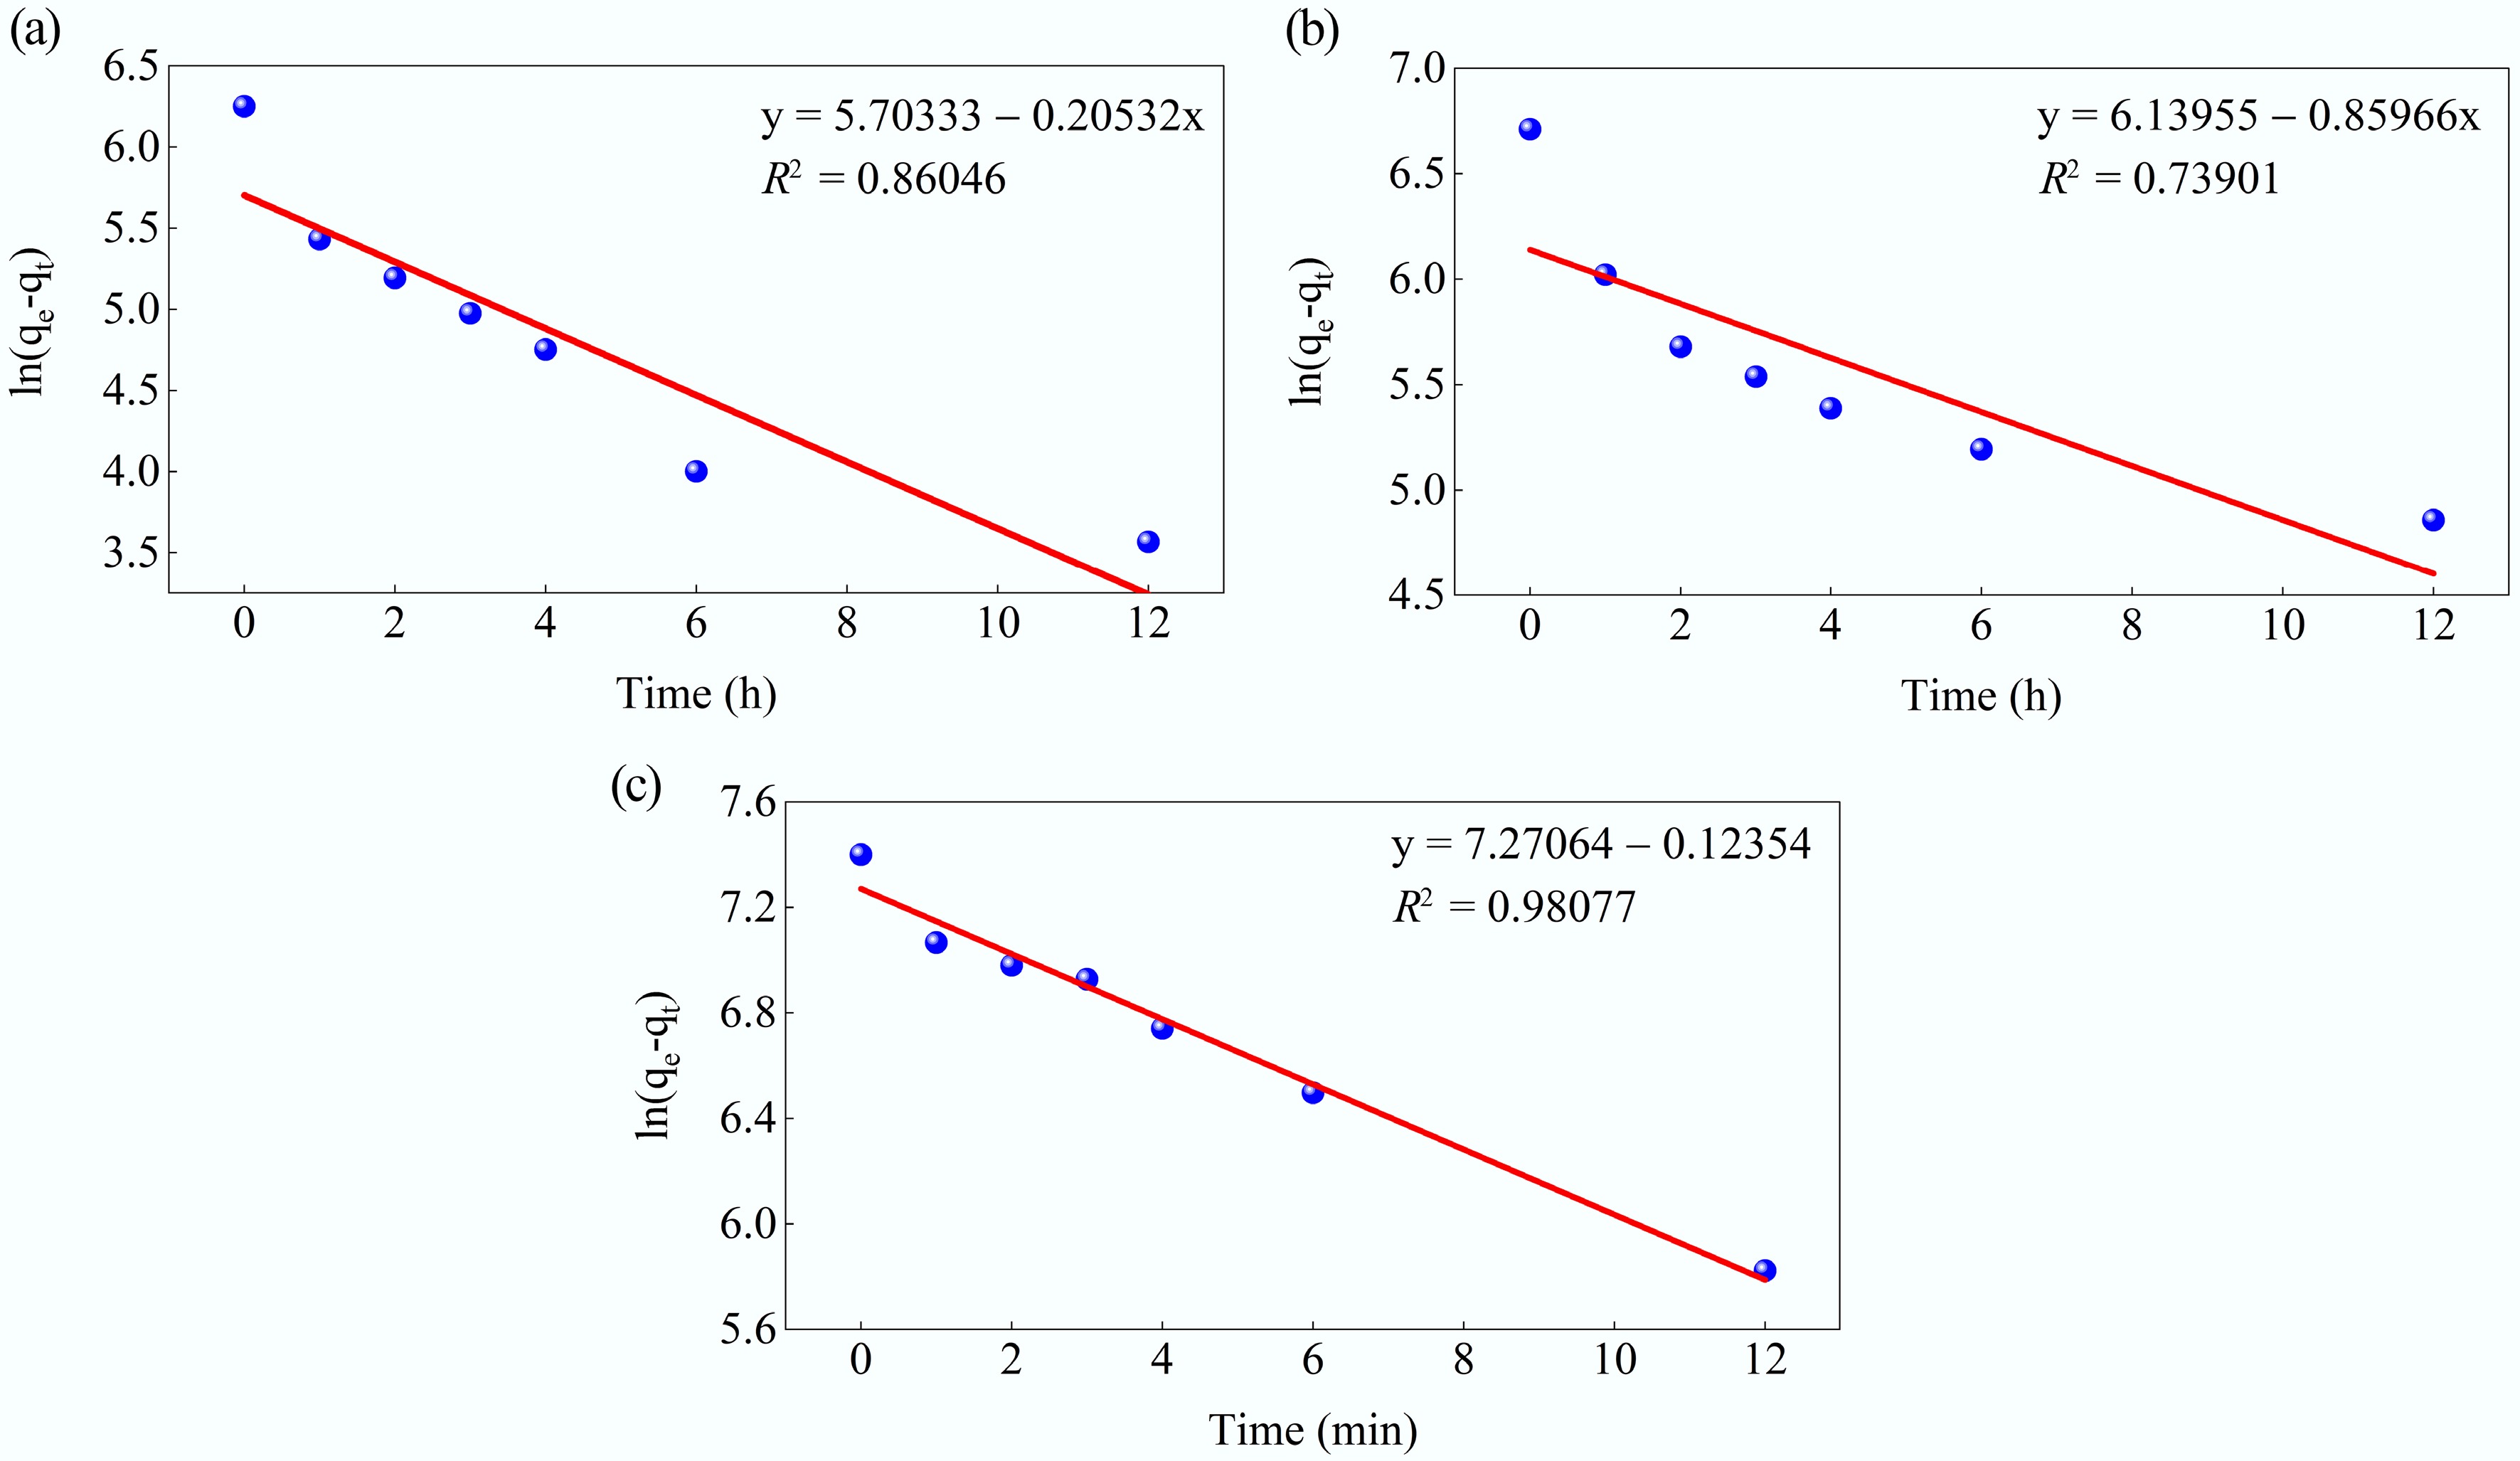
Figure 11.
Kinetic fits for MB adsorption on MAHC at (a) 24 °C, (b) 34 °C, and (c) 44 °C, using the pseudo-first-order model.
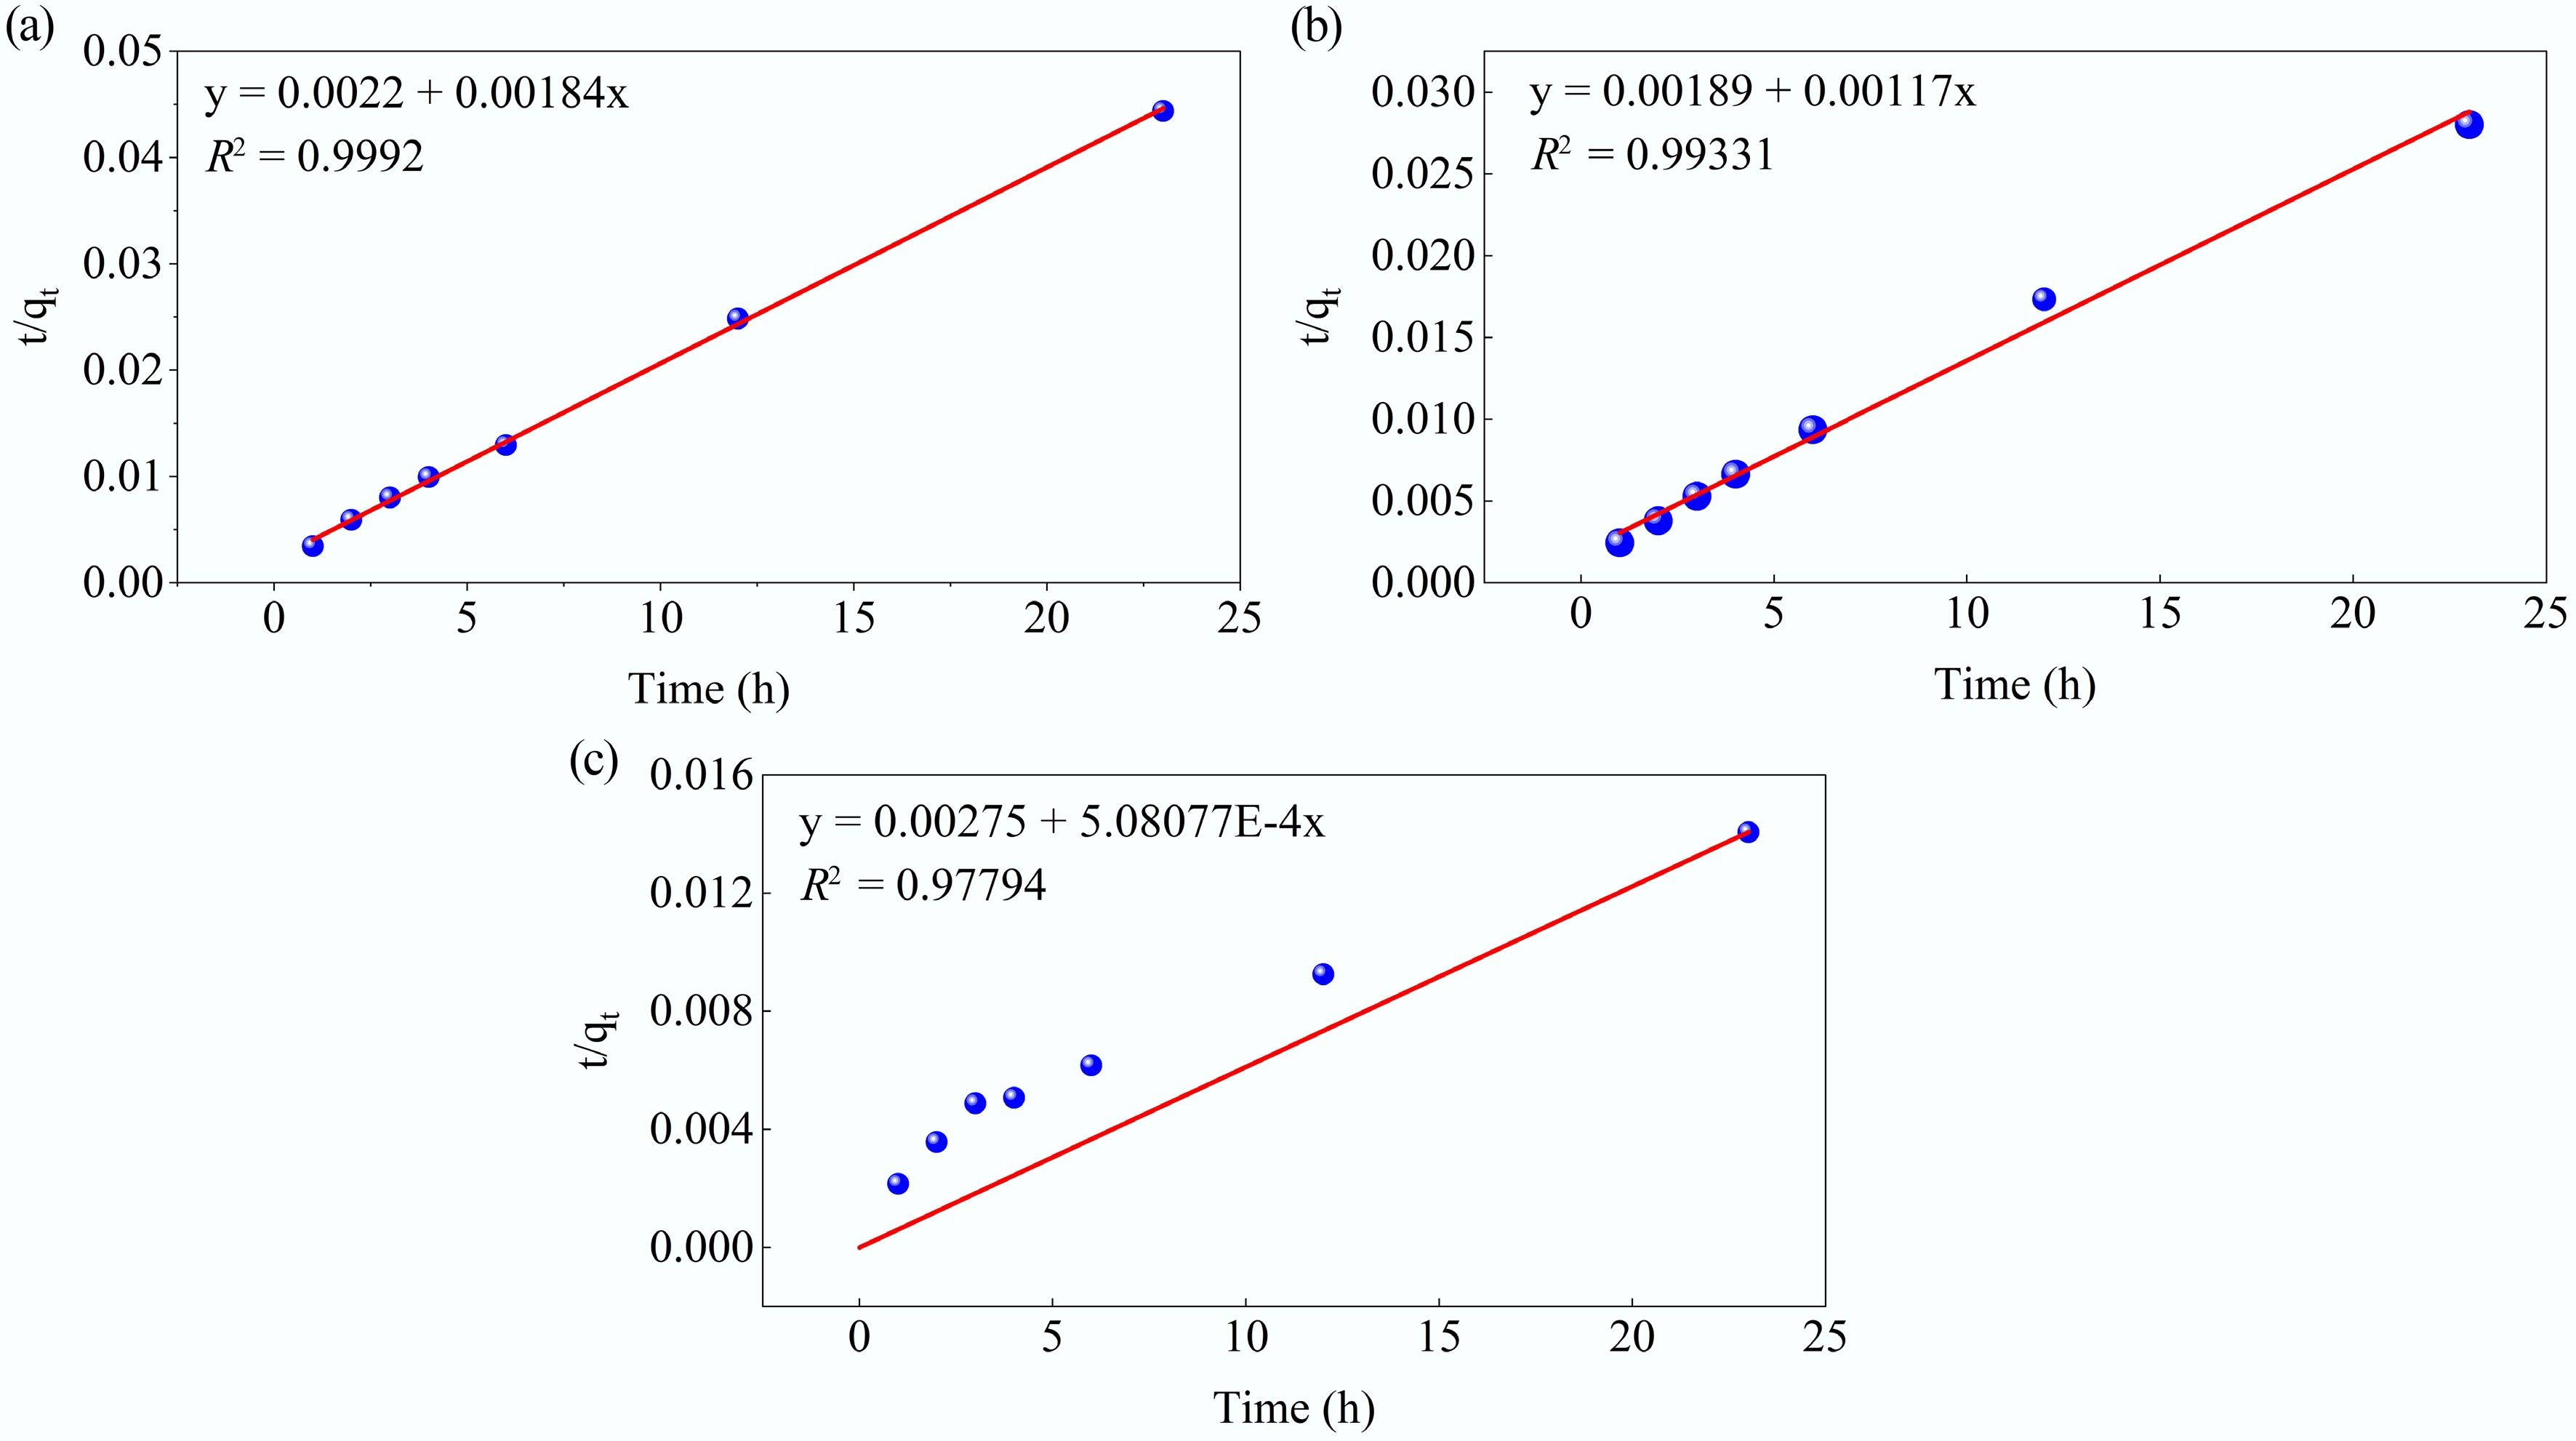
Figure 12.
Kinetic fits for MB adsorption on MAHC at (a) 24 °C, (b) 34 °C, and (c) 44 °C, using the pseudo-second-order model.
Table 5. Kinetic model fitting parameters for the pseudo-first-order and pseudo-second-order models
T Pseudo-first-order Pseudo-second-order qe (mg/g) k1 (min−1) R2 qe (mg/g) k2 (min−1) R2 24 °C 299.8643 0.20532 0.86046 543.4783 0.001539 0.9992 34 °C 463.8448 0.85966 0.73901 854.7009 0.000724 0.9931 44 °C 1437.47 0.12354 0.98077 1968.206 9.39E-05 0.9779 Next, the intraparticle diffusion model was taken into consideration. The relevant kinetic model fitting parameters are provided in Table 6. In Fig. 13, it can be seen that three linear segments can be clearly observed at 24 and 34 °C, which indicates that MB adsorption onto MAHC involves three stages. In the first step, the adsorbate diffuses quickly through the thick, static fluid film (the boundary layer) to the external adsorbent surface, which is characterized by a higher intraparticle diffusion rate (Kp) than the second and third stages (Table 4). The second stage occurs when the adsorbate molecules diffuse into the internal pores of the MAHC. Finally, the third stage reaches equilibrium, where the low residual adsorbate moves slowly from larger pores to smaller pores (micropores), which is characterized by the lowest value of Kp (Table 4). The constant C is related to the boundary layer thickness. In general, it can be found that the constant C at the second and third stages is larger than that at the first stage, suggesting a thicker boundary layer and a longer diffusion path, which contributes to a greater resistance to mass transfer[32,55]. When the temperature increases to 44 °C, the kinetics of three individual diffusion steps as observed at 24 and 34 °C cannot be distinguished because the temperature plays a role in diffusion by increasing the kinetic energy of the adsorbate molecules and lowering solution viscosity. This can help lower the resistance to mass transfer and make the adsorbate molecules move faster, which is evidenced by a higher value of Kp and a relatively lower value of C.
Table 6. Kinetic model fitting parameters for the intraparticle diffusion model
Temperature Stage Kp (mg/(g·min1/2)) C (mg/g) R2 24 °C First stage 289.7151 0 1 Second stage 118.5603 169.5876 0.99787 Third stage 23.48912 404.37198 0.99186 34 °C First stage 379.8602 6.56063 0.9974 Second stage 109.46267 376.3959 0.98987 Third stage 77.83848 439.9813 0.97312 44 °C First stage 340.61243 73.82852 0.98758 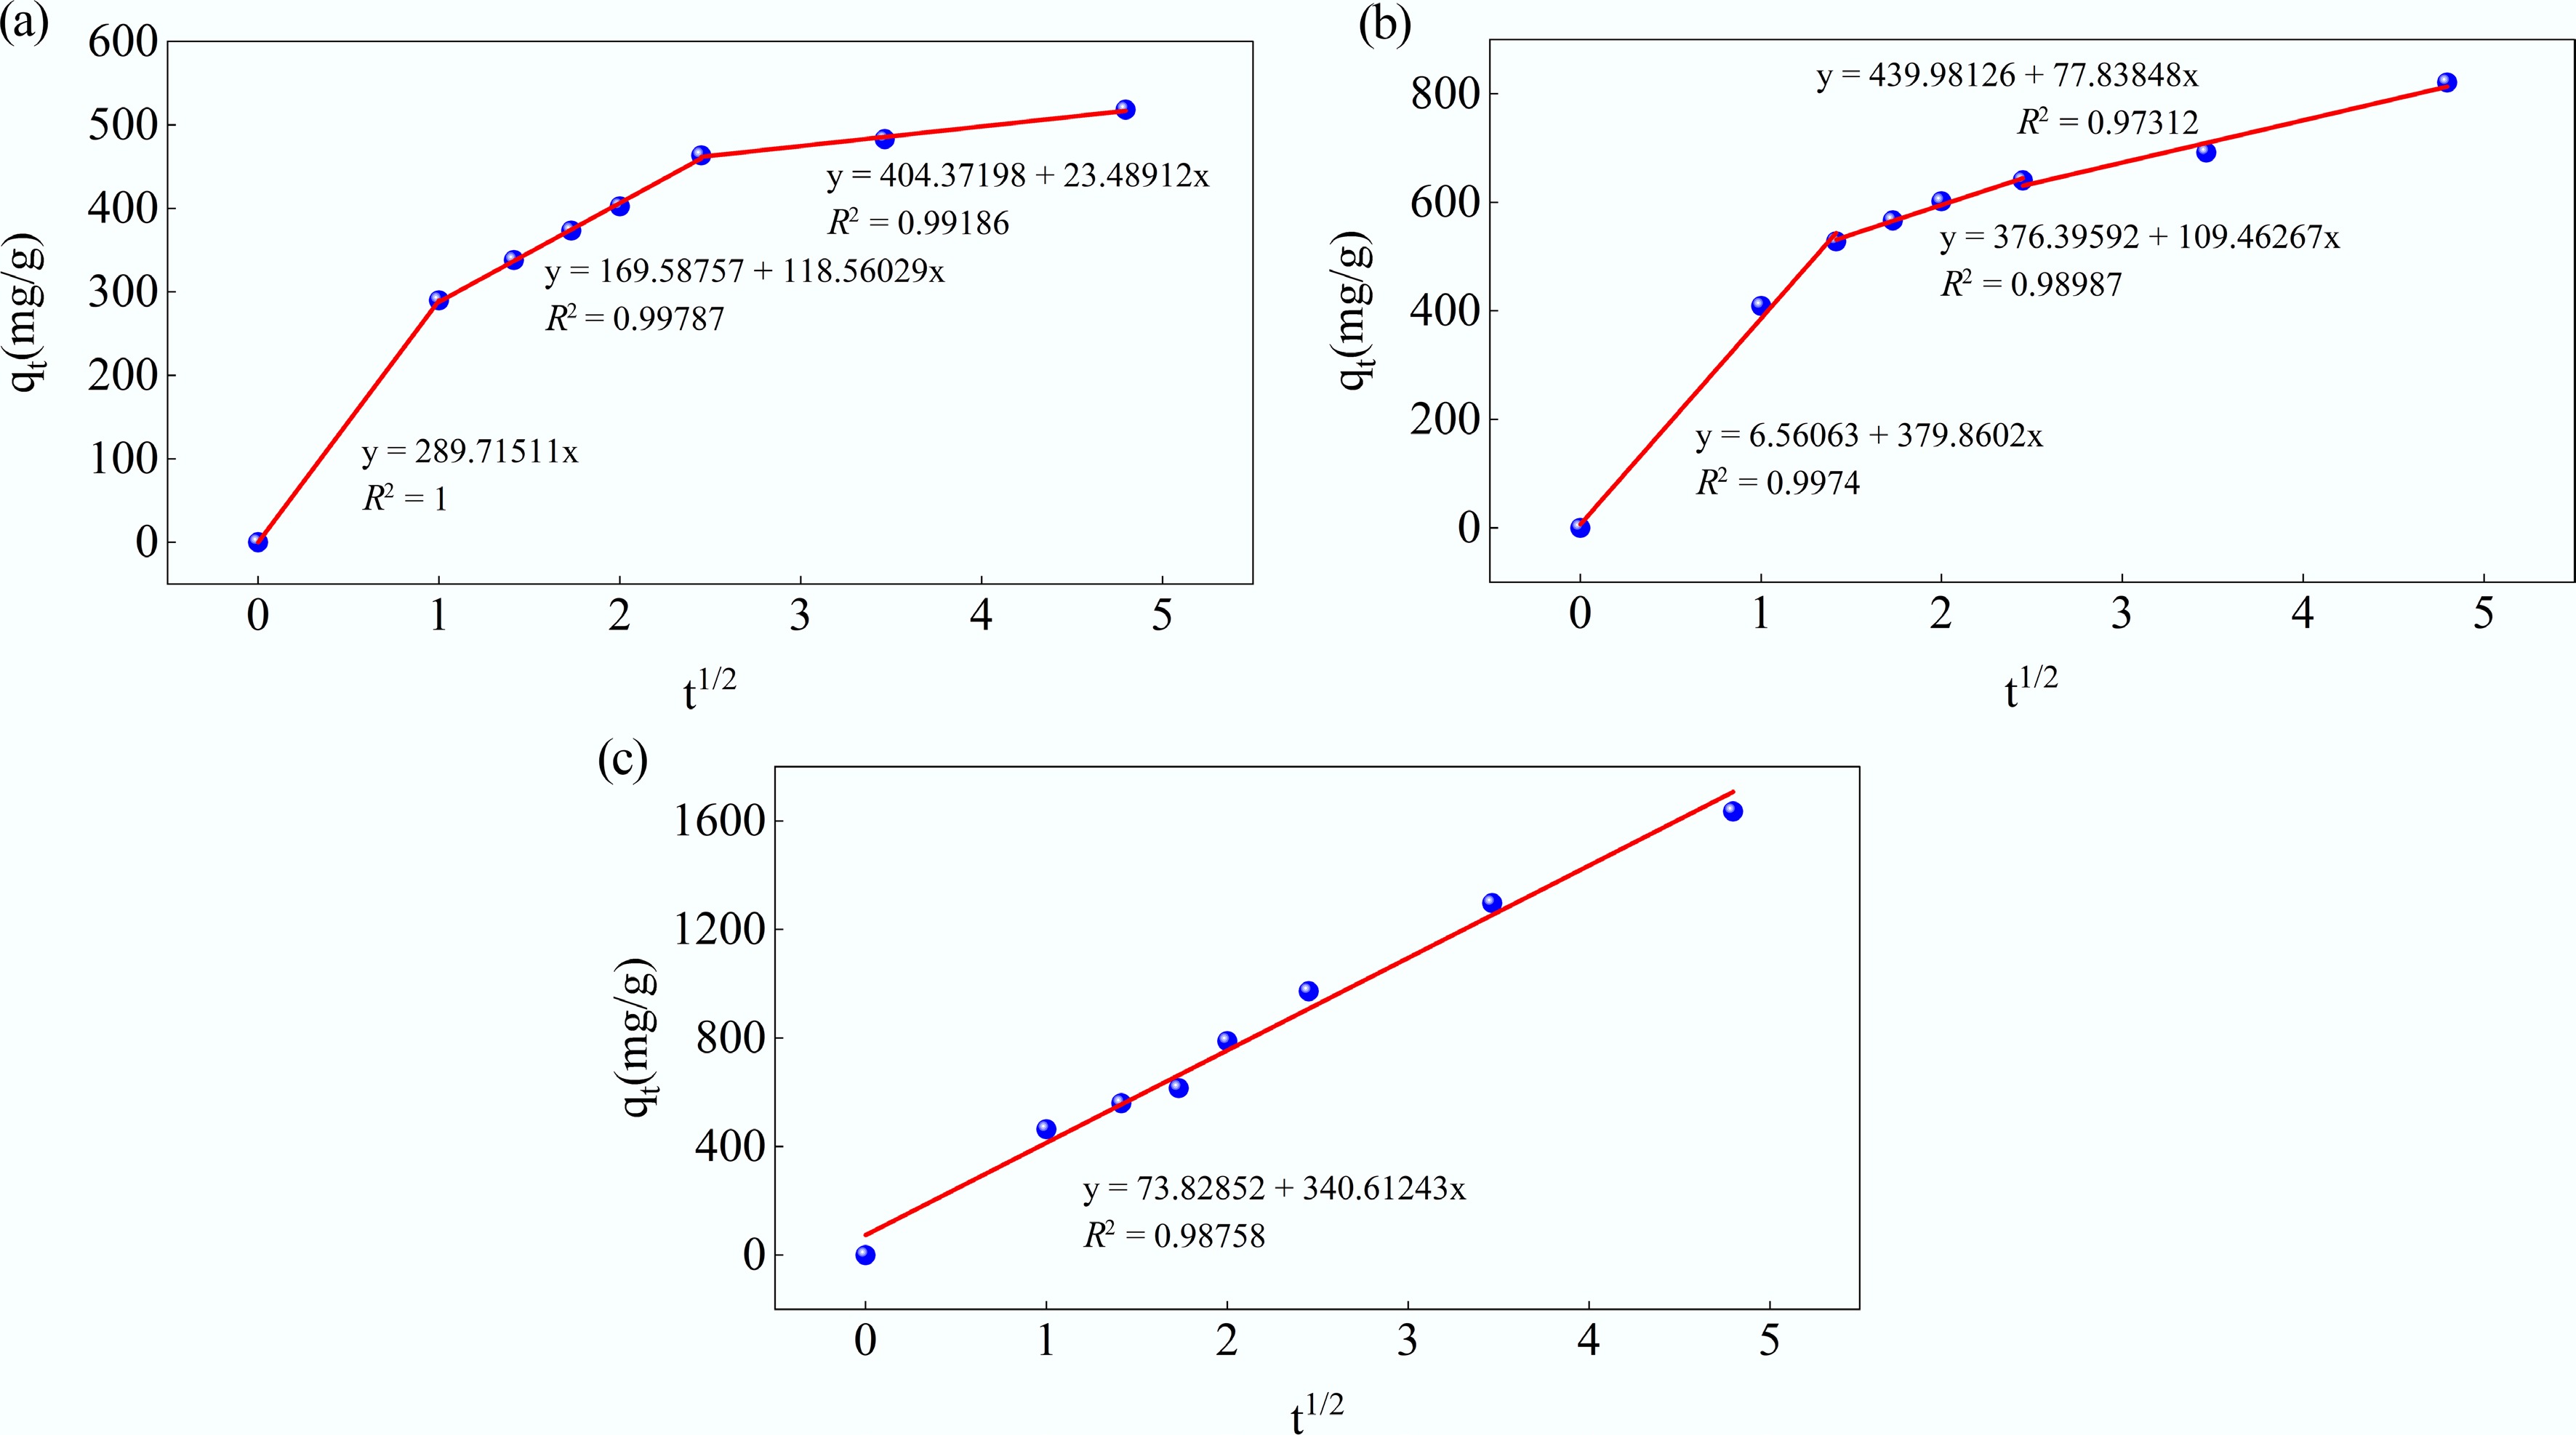
Figure 13.
Kinetic fits for MB adsorption on MAHC at (a) 24 °C, (b) 34 °C, and (c) 44 °C using the intraparticle diffusion model.
Proposed MB adsorption mechanisms
-
The adsorption of MB over MAHC can be achieved by both physical and chemical adsorption, as confirmed by the kinetic study. As illustrated by BET (see Fig. 1), and SEM analysis (see Fig. 2), MAHC showed a porous structure with a large specific surface area (1,266.1 m2/g), which makes it easily accessible to MB and promotes physical adsorption onto the surface of the adsorbent. A similar finding was reported by Wang et al.[56]. To further prove this finding, BET analysis of the used MAHC was carried out, and the results are shown in Fig. 14. It can be seen that the specific surface area and total pore volume were reduced from 1,266.1 to 97.0 m2/g and from 0.7394 to 0.1369 cm3/g, respectively. Based on this observation, pore filling can be proven to be one of the adsorption mechanisms.
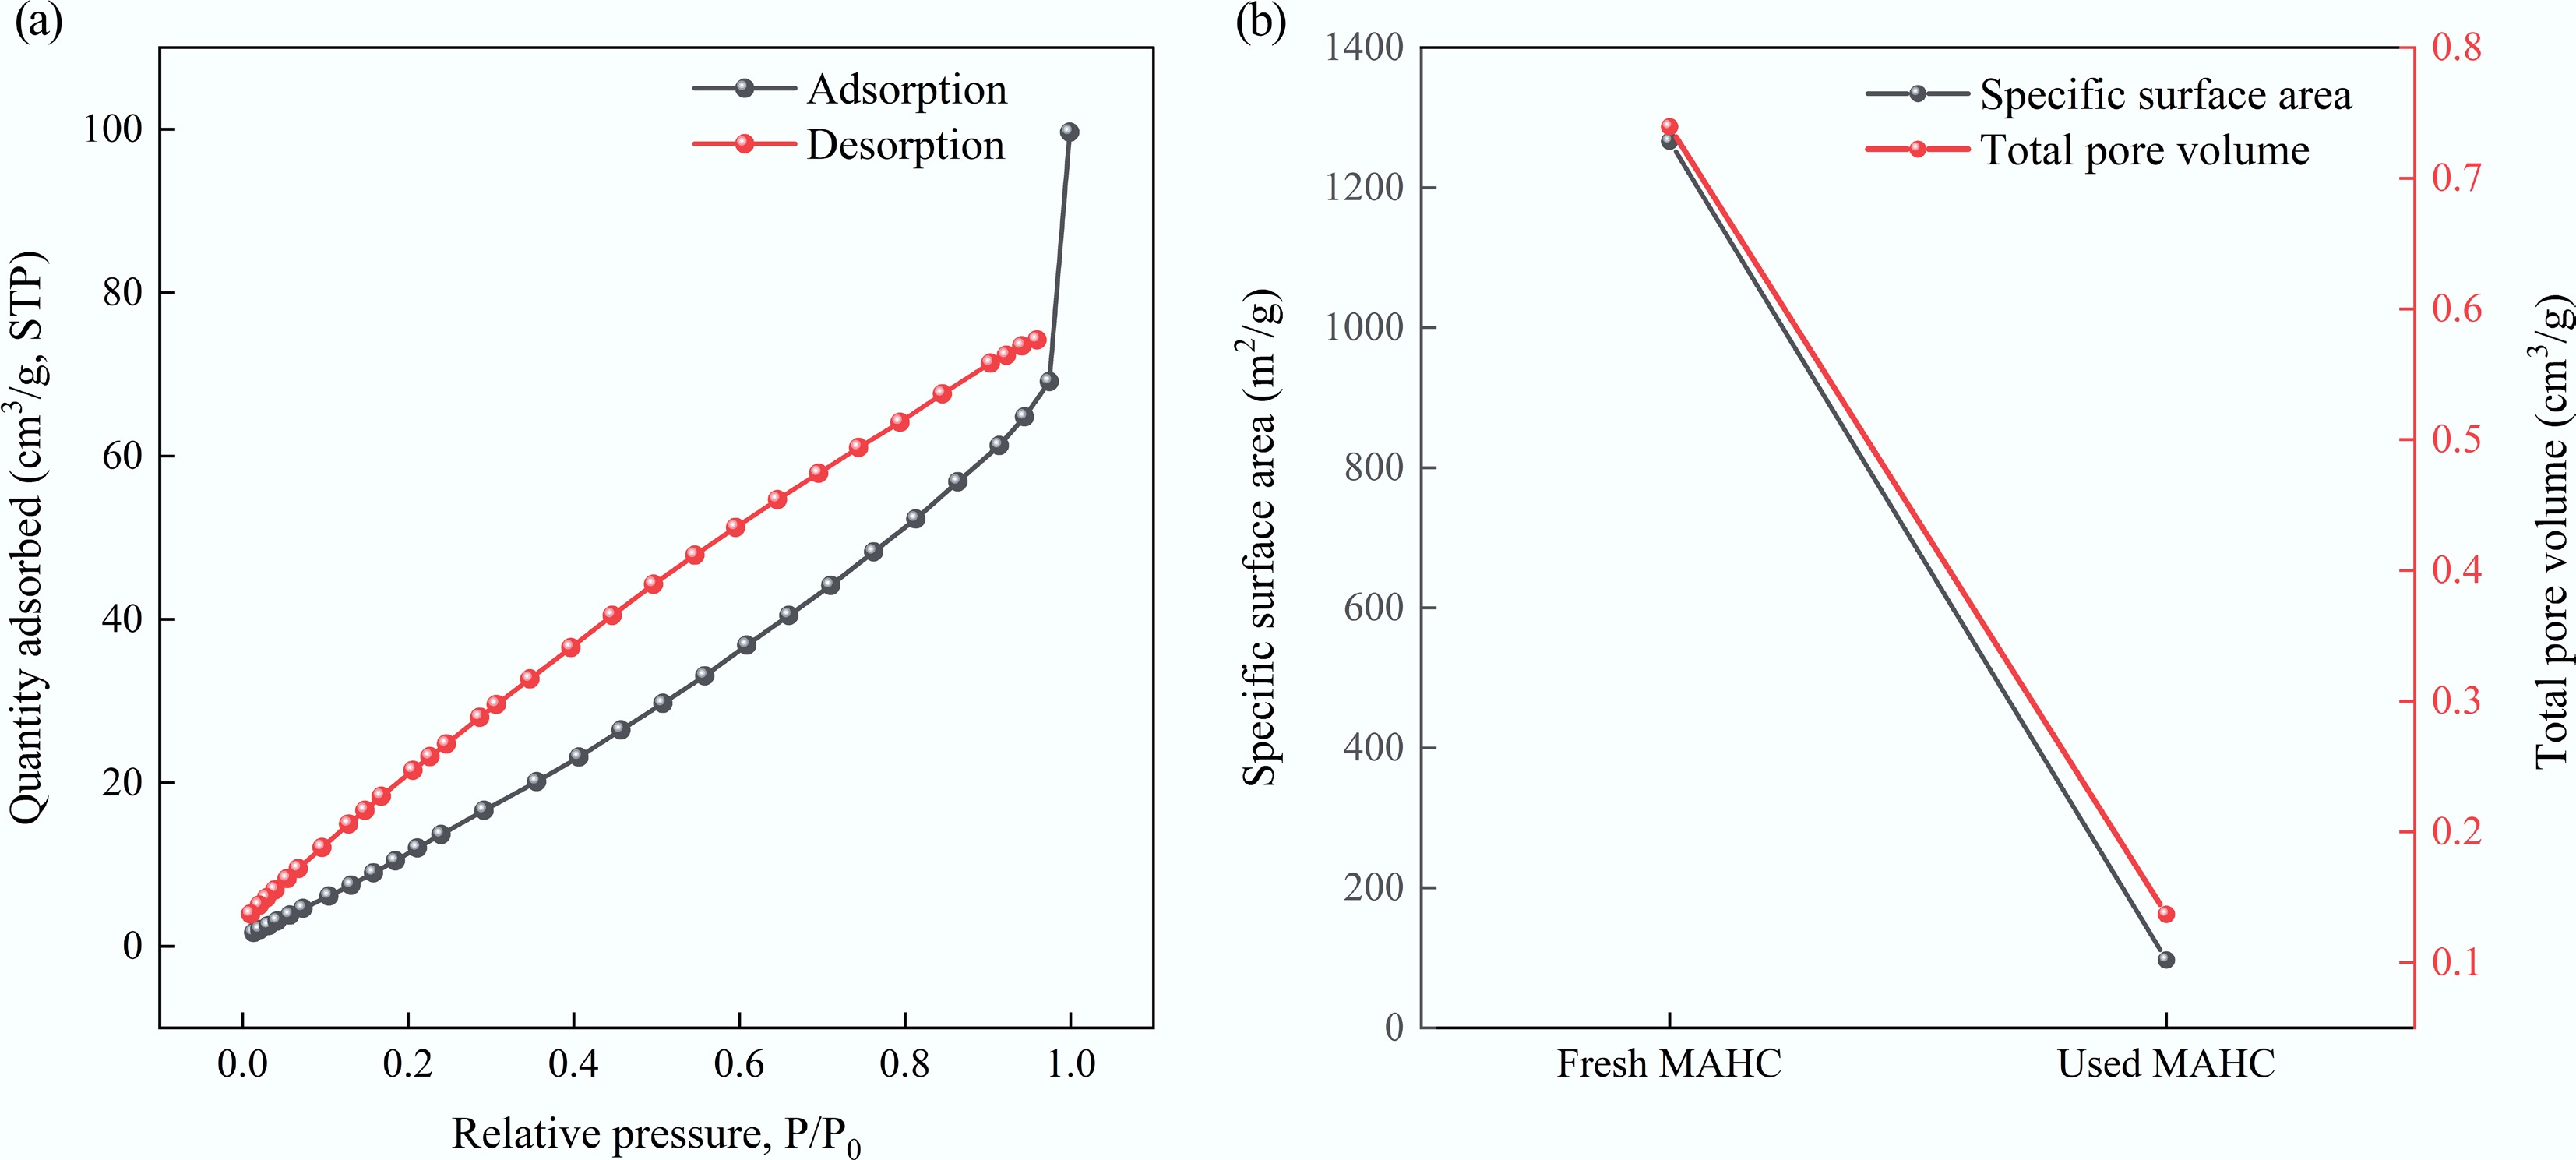
Figure 14.
(a) Adsorption/desorption isotherm of used MAHC, and (b) comparison of specific surface area and total pore volume between fresh MAHC and used MAHC.
To further understand another possible mechanism of MB adsorption onto MAHC, the surface interaction between MB and MAHC before and after the adsorption experiment was investigated using XPS. Initially, based on the survey scan results (see Fig. 15), it can be clearly found that the peaks related to the XPS spectra of Fe 2p and Cu 2p3 were significantly changed in the used MAHC. The result suggests that Fe and Cu nanoparticles participated in the MB adsorption process, which could be due to the chemical interaction between the specific active sites provided by Fe and Cu nanoparticles and the functional groups of MB through surface complexation and the formation of chemical bonds. To further investigate, the Fe and Cu peaks were deconvoluted, and the results are given in Supplementary Fig. S3.
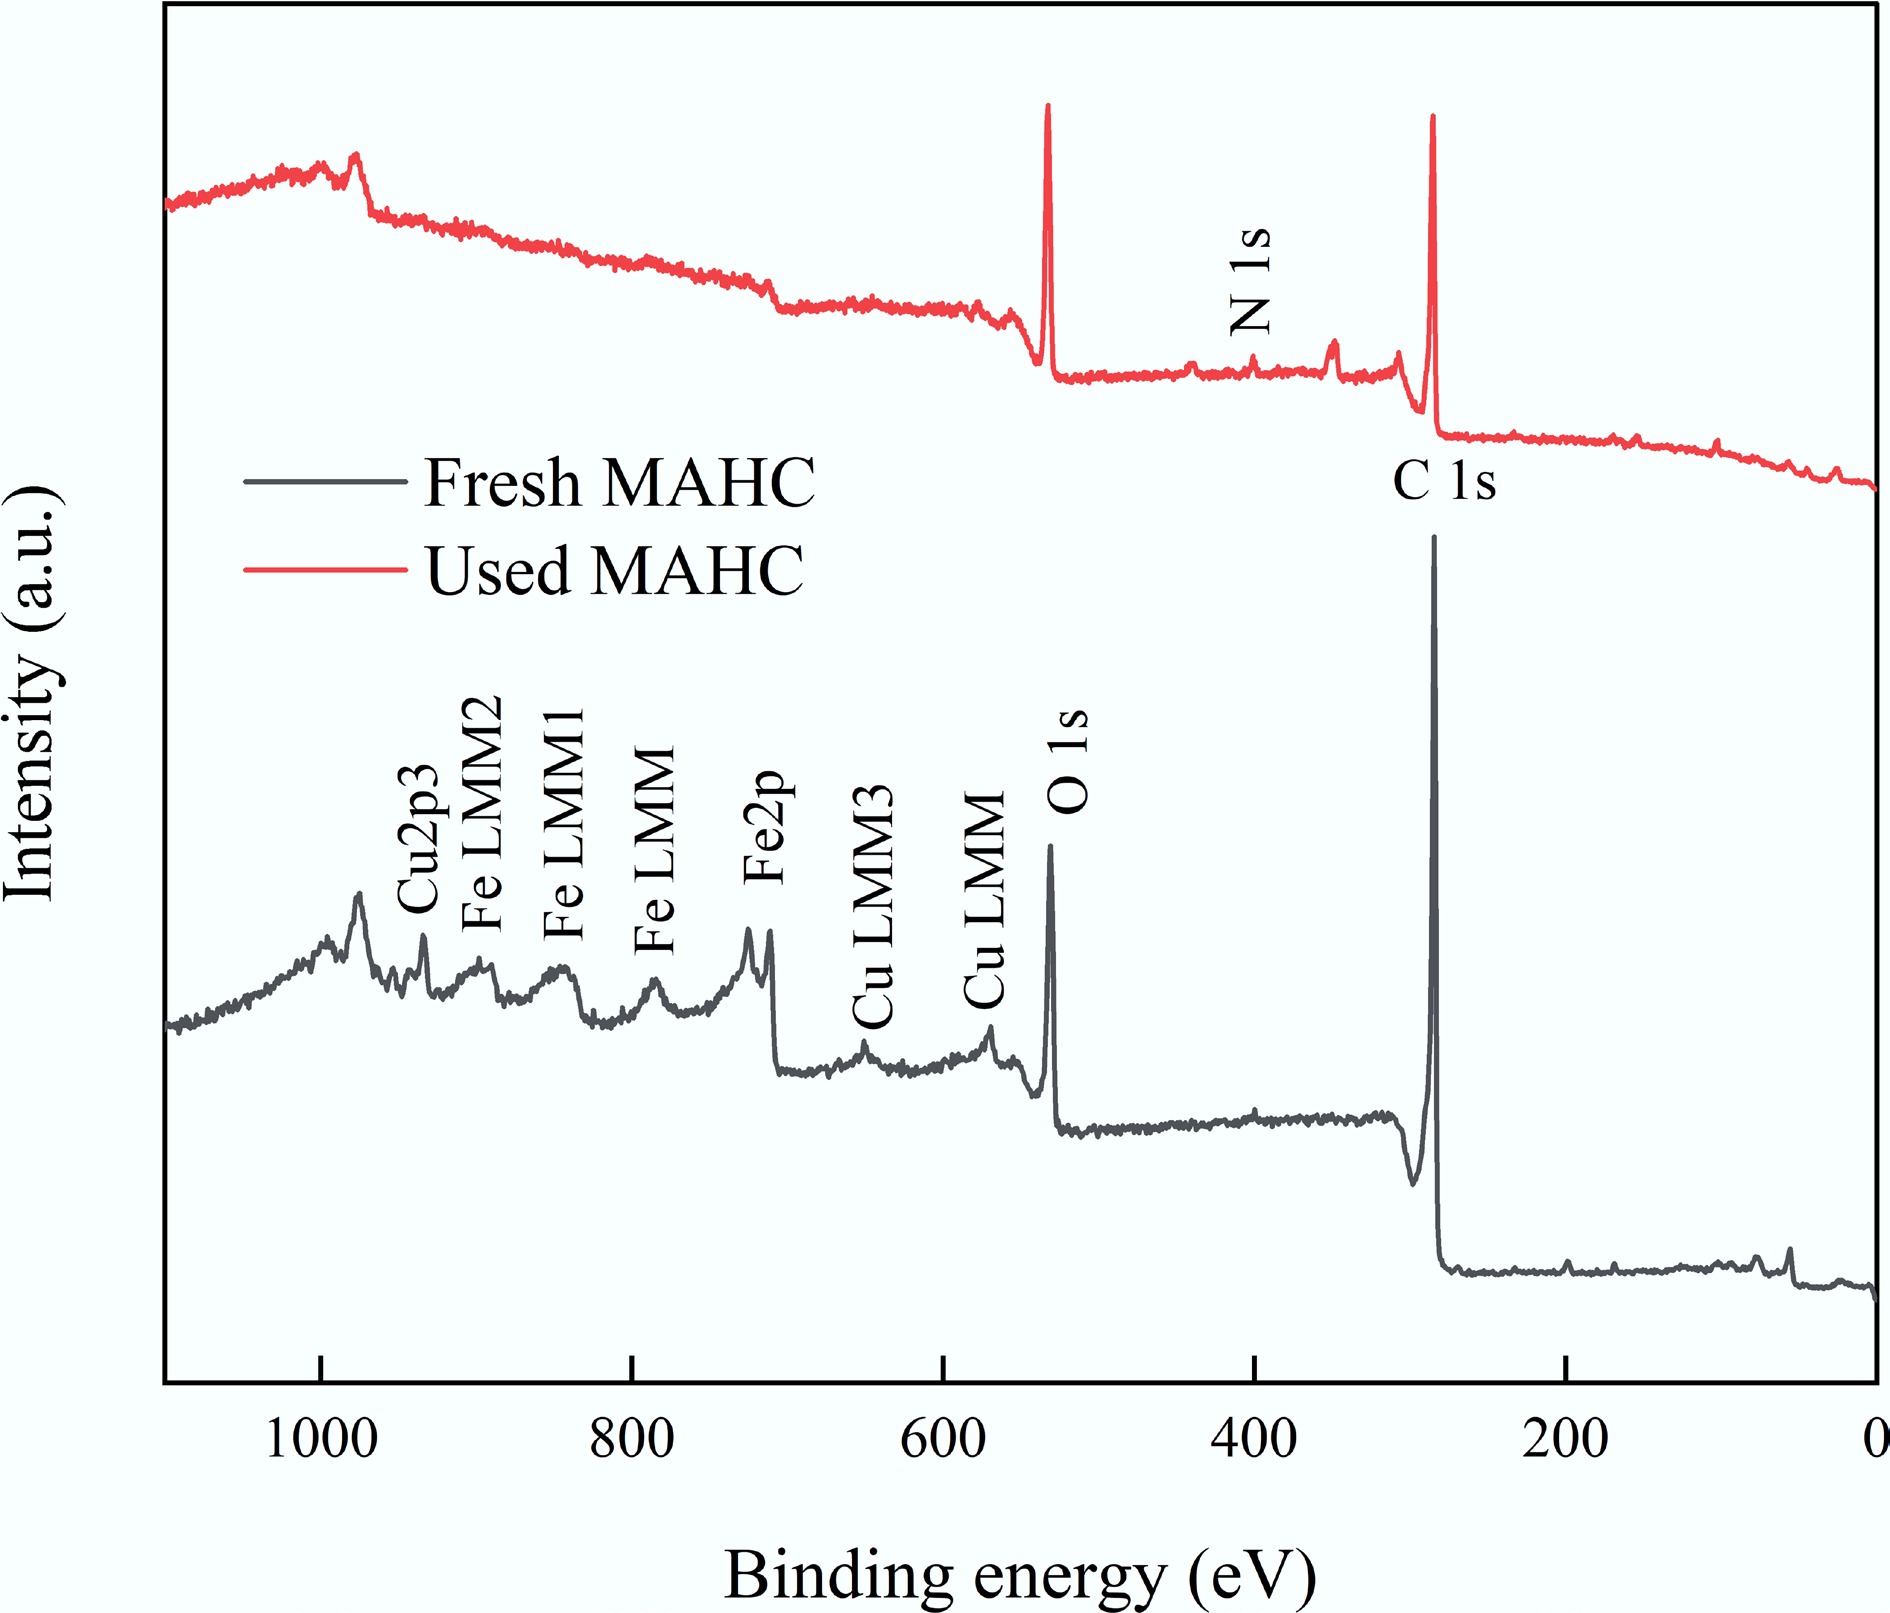
Figure 15.
XPS survey scan results of MAHC before and after MB adsorption.
In addition, an N1s peak at 400.36 eV was observed in the used MAHC (Supplementary Fig. S4) but was absent in the fresh MAHC. This could be attributed to the N atoms of the adsorbed MB. The binding energy of 400.36 eV is higher than the binding energy of pure MB (i.e., 399.2 ± 0.2 eV), which could be related to the positively charged quaternary ammonium structure of methylene blue. This indicates that the N in MB was in a more electron-deficient environment because of the interaction with the Fe and Cu active sites and/or C. Because N in MB is positively charged, its electron density was pulled away by Fe/Cu and/or C, making it become electron-deficient and thus leading to an increase in XPS binding energy. This can be proven by the appearance of a deconvoluted C−N peak in the used MAHC at 285.66 eV, a peak that was absent in the fresh MAHC.
As depicted in Supplementary Fig. S5, the deconvolution of the C 1s spectra in fresh MAHC shows peaks corresponding to −C=C at 284.30 eV, −C−C and C−H at 284.80 eV, −C−OH and C−O−C at 286.30 eV, −C=O at 287.80 eV, and −O−C=O at 289.46 eV. For comparison, in the used MAHC, −C−C and C−H at 284.80 eV, −C−OH and C−O−C at 286.30 eV, and −C=O at 287.80 eV were also observed. However, the −C=C peak was absent in the used MAHC. This could be attributed to the π-π interaction between the aromatic ring of MB and the C skeleton sheet of MAHC. As mentioned earlier, a new peak corresponding to C−N was found in the used MAHC. The −O−C=O peak shifted from 289.46 eV (fresh MAHC) to 289.39 eV (used MAHC). The reduced binding energy may indicate higher electron density of the O atom, as N is more electronegative and tends to accept electrons, while O donates electron pairs[56].
The deconvolution of O 1s spectra in fresh MAHC showed peaks at 529.95 eV (metal oxide), 531.26 eV (metal oxide, adventitious), and 532.41 eV (sulfate, adventitious), as displayed in Supplementary Fig. S6. On the other hand, in the used MAHC, two deconvoluted O 1s peaks were observed at 531.05 and 532.64 eV, respectively. Clearly, the deconvolution results of O 1s between fresh and used MAHC are different. The differences could be attributed to electronic transfer between N+ in MB and metal oxides, or −O−C=O in MAHC[57].
Continuous adsorption experiment of MAHC for wastewater treatment
-
The continuous adsorption experiment of MAHC was conducted initially for the MB solution at room temperature for 180 min, followed by the test of real wastewater supplied by a local potato processing facility. The breakthrough curve, which represents the concentration of contaminants in the effluent of a column over time, indicates how the adsorbent changes as it becomes saturated. The breakthrough curve for the MB solution is given in Fig. 16. It can be seen that the MAHC reached a breakthrough point at 165 min, as shown in Fig. 17. For real wastewater, Fig. 18 indicates that the electrical conductivity and concentration of N, P, and K of effluent at 360 min (the last sampling time) are 2,652 μS/cm, 564 mg/kg, and 1,164 mg/kg, respectively, which are similar to the initial influent (as shown in Table 1).
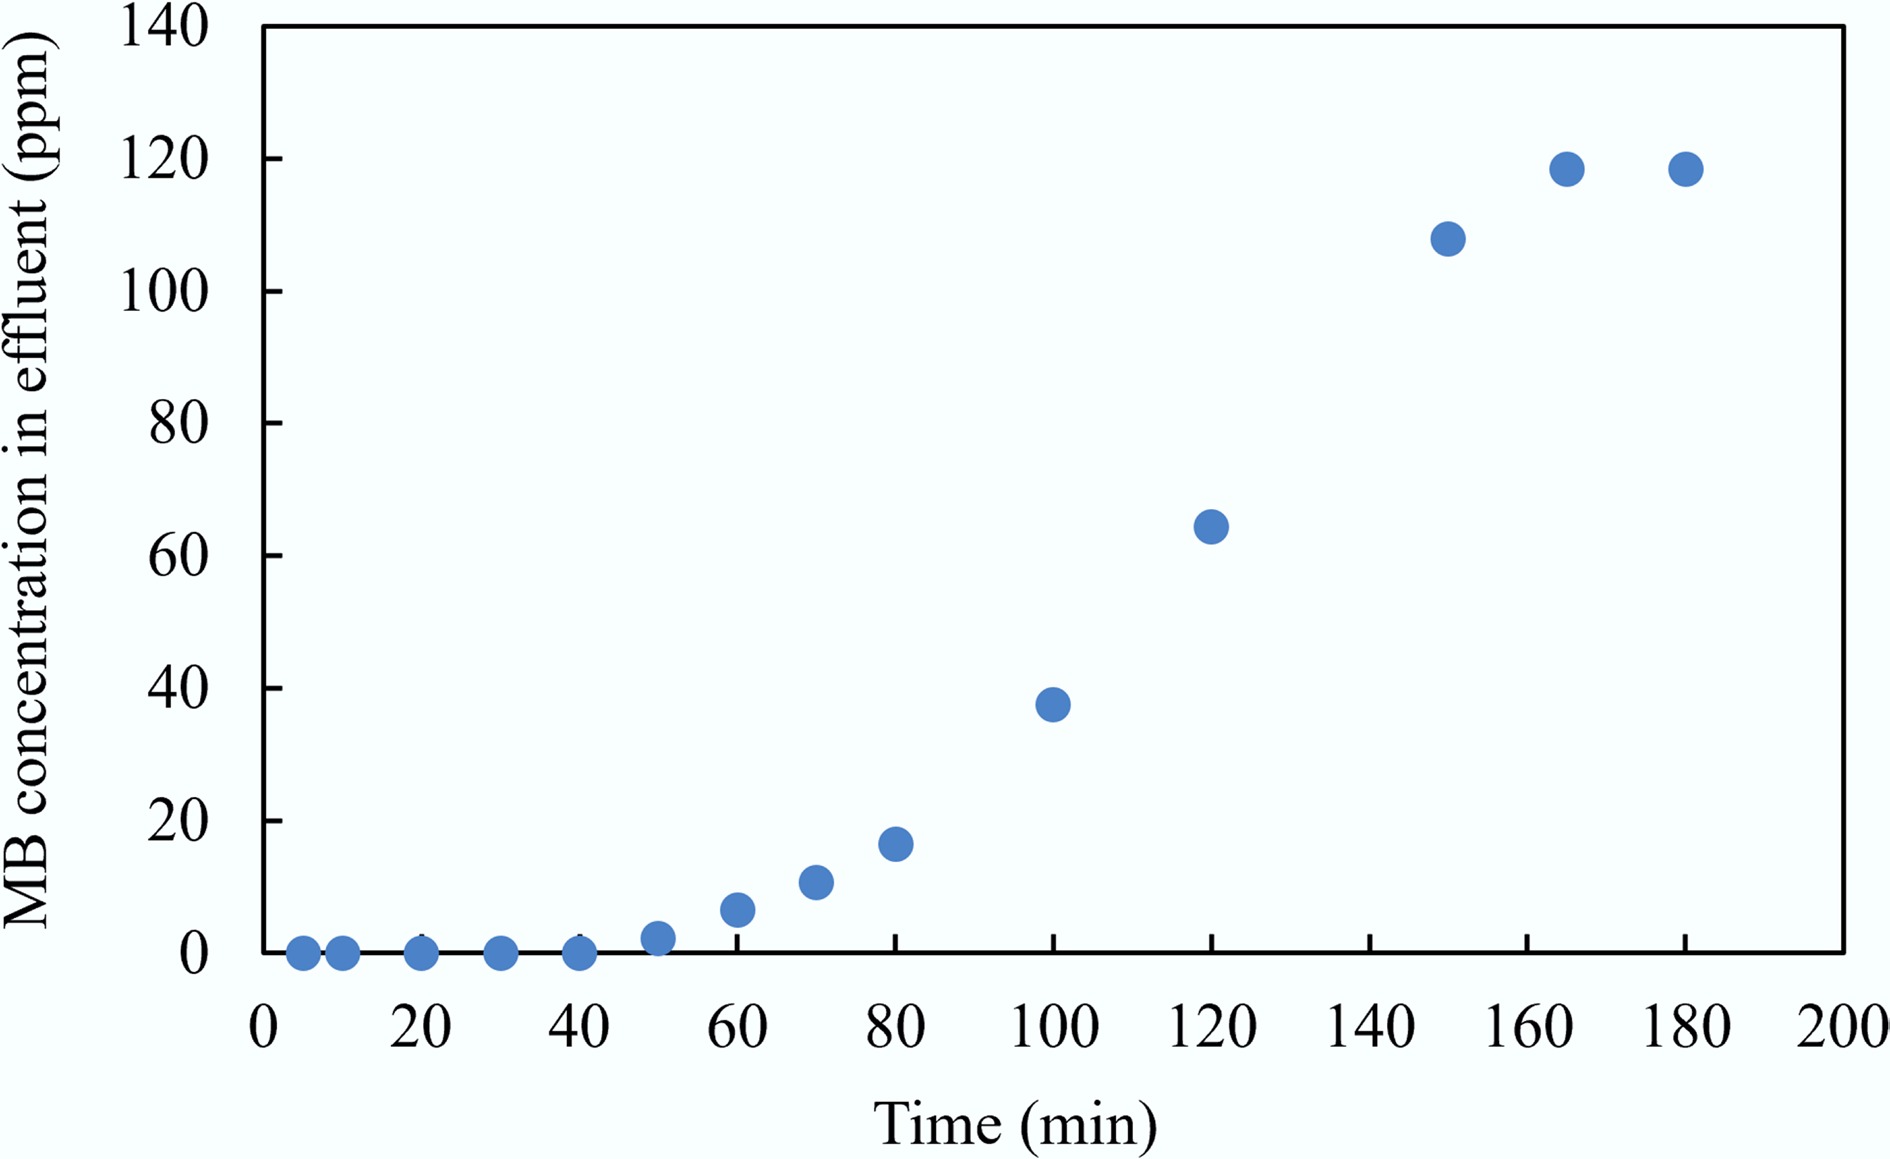
Figure 16.
Breakthrough curve of MAHC to treat the MB solution.
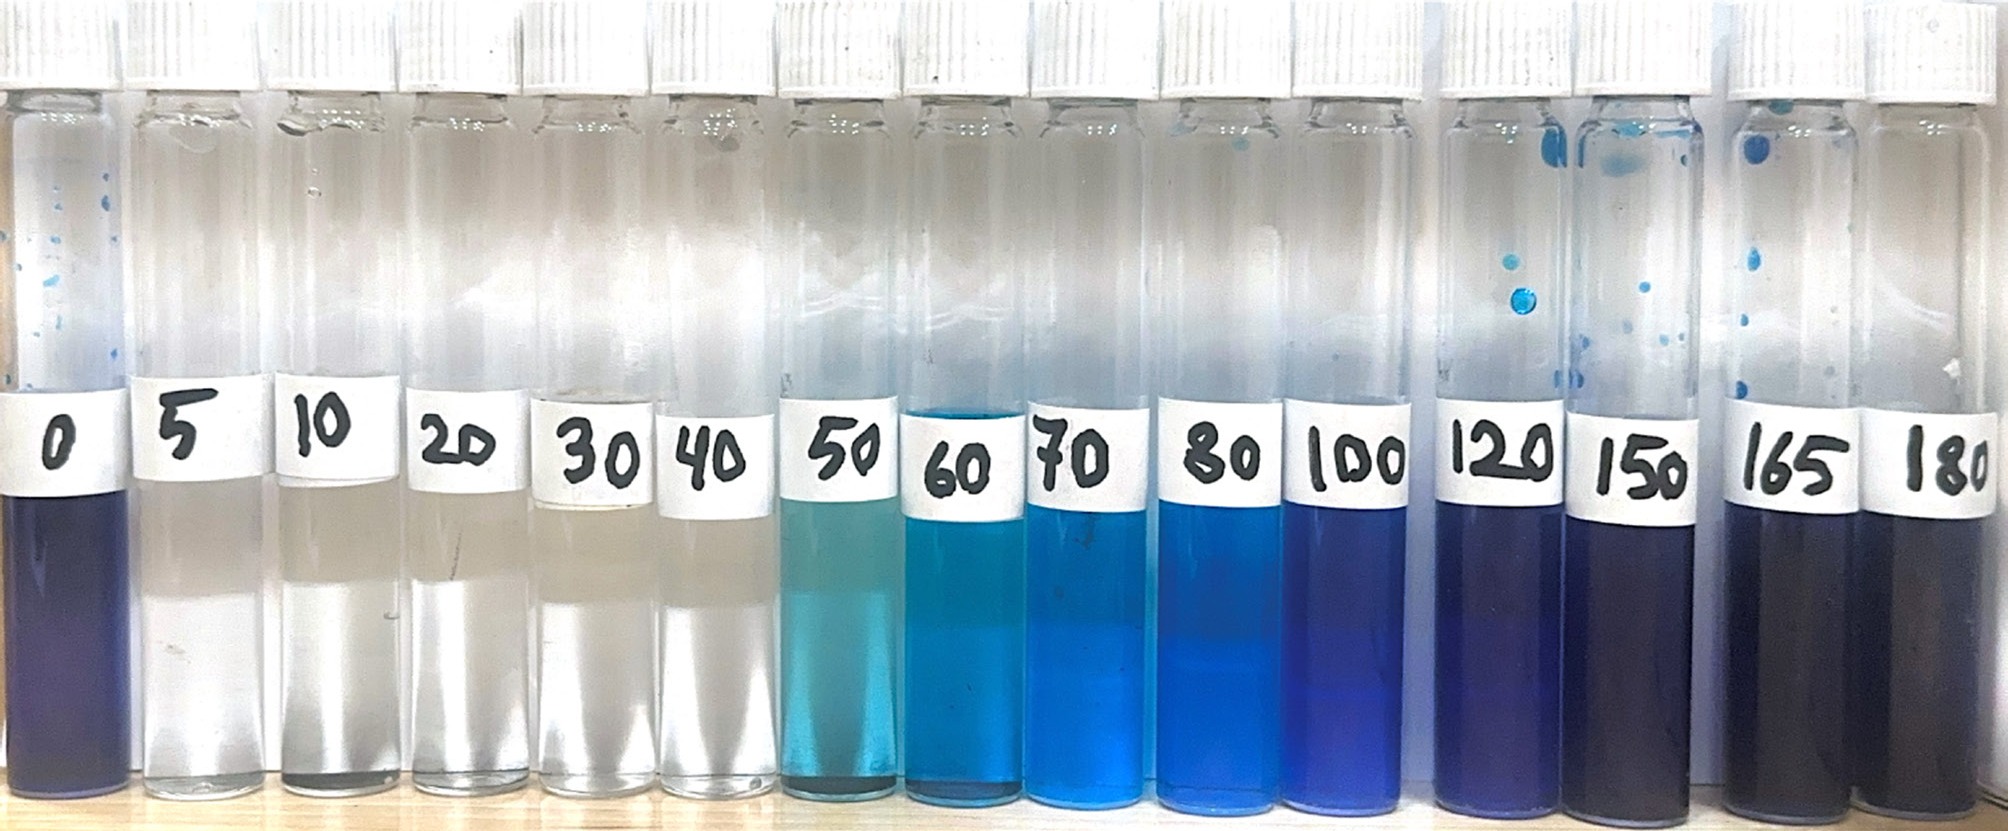
Figure 17.
MB adsorption experiment in a fixed bed column over 180 min.
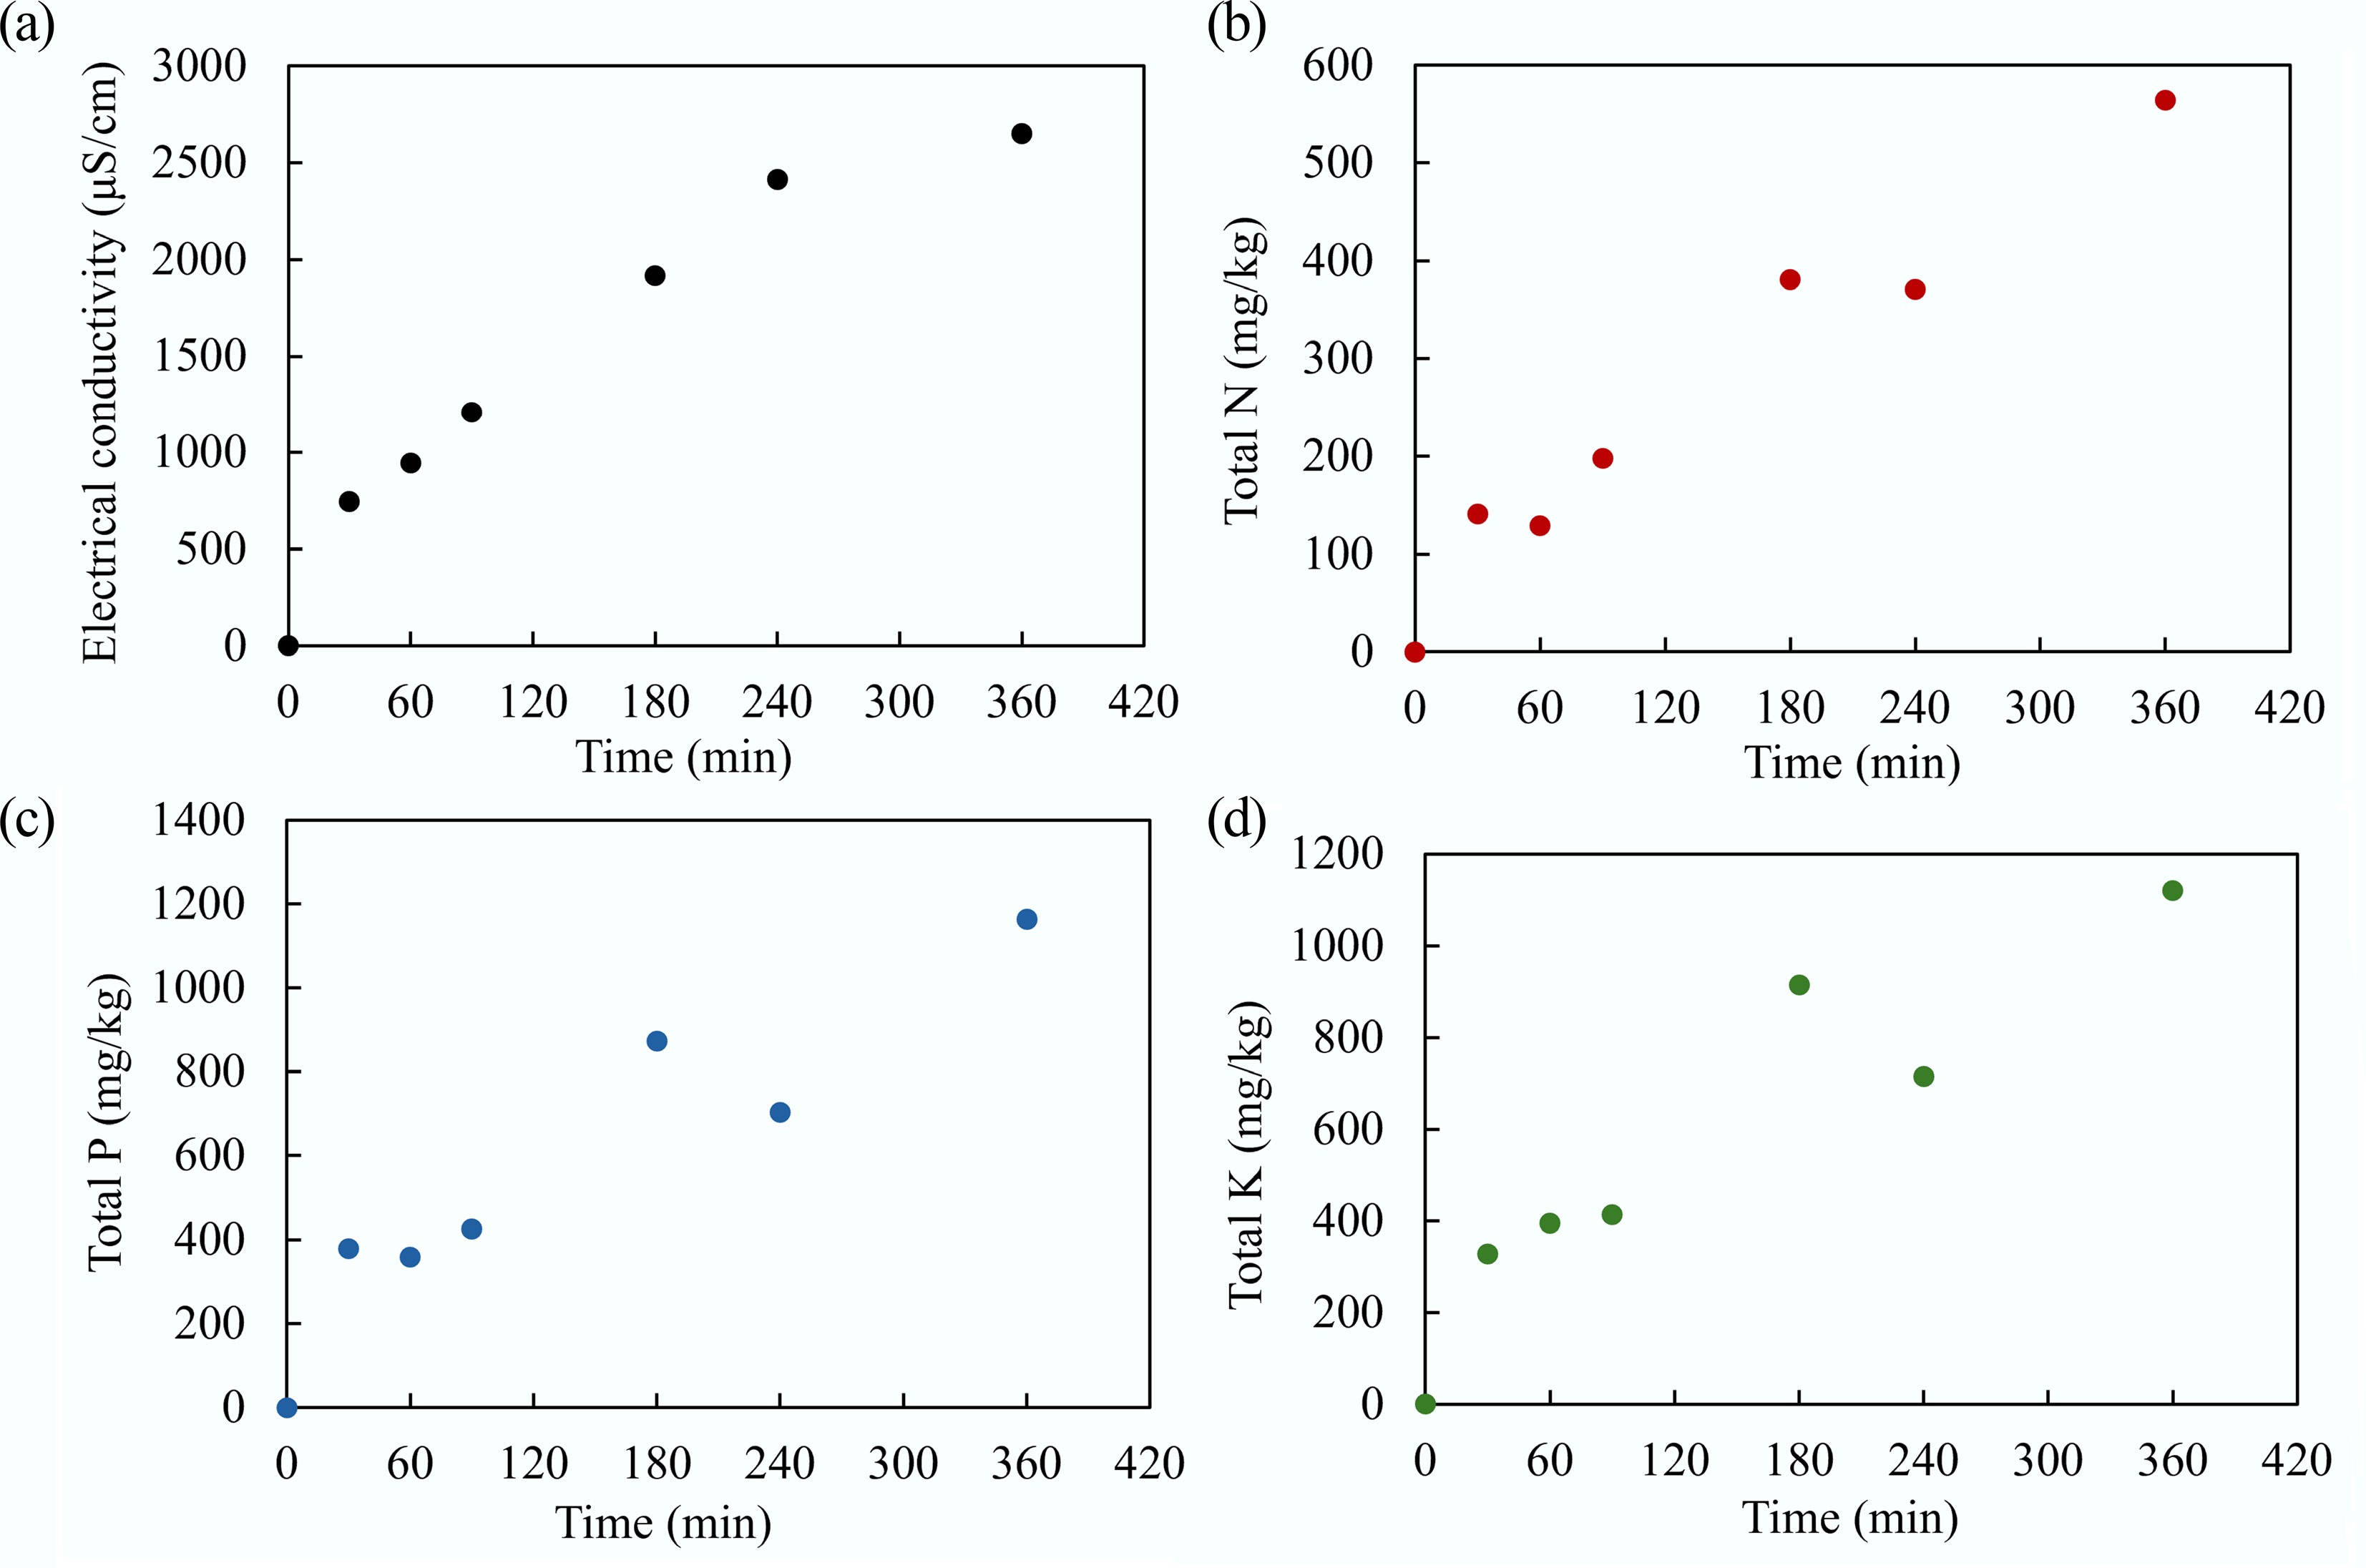
Figure 18.
(a) Electrical conductivity, and the concentration of (b) total N, (c) total P, and (d) total K in the effluent over 360 min.
Several limitations of this work have been identified: (1) the variability in feedstock characteristics could affect the properties of MAHC and consequently its performance in adsorbing MB from solution and cleaning up wastewater. This work is limited to the use of wood sawdust as the raw material, but it would be worthwhile to evaluate other types of feedstock, particularly third-generation biomass like microalgae and seaweed, in order to understand the influence of feedstock characteristics on adsorption performance; (2) although this work included adsorption experiments in both batch and continuous mode, future studies should carry out a comparative study to compare the adsorption performance of MAHC with that of commercial activated carbon; and (3) aside from a high adsorption capacity under optimized conditions, the high stability and recyclability are important properties for any type of adsorbent materials. This leads to another major limitation of the current work, i.e., the lack of study on the stability and recyclability of MAHC for adsorbing MB from solution and cleaning real wastewater, an issue which must be addressed in future work.
-
In this study, the bimetallic activated hydrochar was synthesized from sawdust to conduct adsorption using both batch and fixed-bed column experiments to remove MB and treat real wastewater. The main conclusions drawn from this study are given below.
• The highest adsorption capacity of MAHC of 1,635.28 mg/g was achieved at a pH of 10, an MB concentration of 50 ppm, an MAHC amount of 5 ppm, and a temperature of 44 °C.
• The Freundlich model fitted the experimental data better than the Langmuir and Temkin models, indicating that multilayer adsorption on a heterogeneous surface with a non-uniform distribution of adsorption heat is more dominant in MB adsorption using MAHC.
• The Pseudo-second-order model provided a better fit than the pseudo-first-order model, implying that the MB adsorption onto MAHC is a complex process.
• The intraparticle diffusion model suggests that adsorption occurred in three stages at 24 and 34 °C, but these stages were not observed at 44 °C, which suggests that higher temperatures lower resistance to mass transfer and allow adsorbate molecules to move faster.
• For the MB adsorption mechanism using MAHC, as evidenced by BET and XPS analysis, pore filling and surface interaction, such as the interaction between Fe and Cu active sites and MB and π-π interaction, were found to be the dominant mechanisms for MB adsorption onto MAHC. However, electrostatic attraction was not significant, since the influence of pH on MB adsorption capacity was minor.
• In the fixed-bed column experiments, the breakthrough point was achieved at 165 and 360 min for the MB solution and real wastewater, respectively.
The authors are grateful for the Natural Science and Engineering Research Council (NSERC), Canada, and Mitacs Global link program.
-
It accompanies this paper at: https://doi.org/10.48130/scm-0026-0014.
-
The authors confirm their contributions to the paper as follows: Milad Jalilian: study conception and design, data collection, analysis and interpretation of results, draft manuscript preparation; Bisma Nawazish: study conception and design, data collection; Regiane Taborda: study conception and design, data collection; Quan Sophia He: manuscript revision; Yulin Hu: manuscript revision. All authors reviewed the results and approved the final version of the manuscript.
-
The datasets generated during and/or analyzed during the current study are available from the corresponding author on reasonable request.
-
This work was financially supported by Discovery Grants (Grant numbers: RGPIN-2022-03203 and RGPIN-2020-05695) and the Mitacs Global link program (Project ID: 45224 and Project ID: 45223).
-
The authors declare that they have no conflict of interest.
-
Full list of author information is available at the end of the article.
- The supplementary files can be downloaded from here.
- Copyright: © 2026 by the author(s). Published by Maximum Academic Press, Fayetteville, GA. This article is an open access article distributed under Creative Commons Attribution License (CC BY 4.0), visit https://creativecommons.org/licenses/by/4.0/.
-
About this article
Cite this article
Jalilian M, Nawazish B, Taborda R, He QS, Hu YL. 2026. Adsorption of methylene blue dye and potato processing wastewater using bimetallic activated hydrochar: batch and fixed bed column experiments. Sustainable Carbon Materials 2: e019 doi: 10.48130/scm-0026-0014 

Adsorption of methylene blue dye and potato processing wastewater using bimetallic activated hydrochar: batch and fixed bed column experiments
- Received: 29 January 2026
- Revised: 09 February 2026
- Accepted: 13 March 2026
- Published online: 08 April 2026
Abstract: Fe-Cu bimetallic activated hydrochar (denoted as MAHC) was prepared from sawdust by hydrothermal carbonization (HTC), KOH activation, and hybridization. Initially, the effectiveness of MAHC on methylene blue (MB) removal was investigated. The fixed-bed adsorption column was then employed to study MAHC's performance in treating MB and potato processing wastewater. Results showed that the highest adsorption capacity of MAHC of 1635.28 mg/g was achieved at pH 10, with 50 ppm MB, 5 ppm MAHC, and 44 °C. The Freundlich model had a better fit than the Langmuir and Temkin models. The pseudo-second-order model provided a better fit than the pseudo-first-order model. The intraparticle diffusion model suggests that higher temperatures lower resistance to mass transfer and allow adsorbate molecules to move faster. Pore filling and surface interactions, such as the interaction between Fe and Cu active sites with MB and π-π interactions, were the dominant mechanisms for MB adsorption onto MAHC. In the fixed-bed column experiments, the breakthrough point was achieved at 165 and 360 min for MB and wastewater, respectively. Overall, this study offers new insights into the removal of pollutants using bimetallic activated hydrochar, as demonstrated by experiments conducted in both batch and fixed-bed column systems.
-
Key words:
- Bimetal /
- Activated hydrochar /
- Adsorption /
- Batch experiments /
- Continuous experiments