













-
Stroke is one of the leading causes of disability and death globally, with ischemic stroke accounting for approximately 85% of all cases[1−3]. Despite advances in medical interventions, treatment options remain limited, particularly for post-stroke recovery[4]. Traditional Chinese Medicine (TCM) has played a pivotal role in managing cerebrovascular diseases for centuries[5,6]. According to TCM theory, the pathogenesis of ischemic stroke is mainly attributed to blood stasis and qi deficiency, leading to impaired circulation of cerebral collaterals and loss of nourishment for brain collaterals[7,8]. Panax notoginseng (PNS) and Panax ginseng (PGS) are two representative herbs for stroke intervention. PNS is characterized as 'activating blood and resolving stasis', which is used to improve blood circulation and eliminate vascular obstruction[9,10]. PGS is defined as 'replenishing qi and consolidating constitution', which is applied to enhance vitality and restore physical function[11,12].
Modern pharmacological studies have confirmed that PNS and PGS exert neuroprotective effects via anti-inflammatory, antioxidant, and anti-apoptotic pathways[13−20]. However, most existing studies focus on the overall transcriptomic or in vitro single-cell level, failing to reveal the spatial heterogeneity of drug effects in different brain regions and cell populations during ischemic stroke. Acute ischemic stroke presents obvious spatial heterogeneity, including the ischemic core, penumbra, and surrounding normal tissues, which requires high-resolution spatial detection technology[21].
Spatial transcriptomics technology enables precise mapping of gene expression while preserving spatial information within tissue sections. Spatial-seq is a laser capture microdissection (LCM)-based spatial transcriptomics platform that reconstructs bulk RNA-seq data at spatially resolved single-cell resolution through spatial barcode-guided sequencing[22]. Compared with the original Spatial-seq platform, Spatial-seq 2.0 incorporates substantial improvements in both experimental workflow and analytical performance rather than representing a simple protocol optimization. According to the original benchmarking study by Liao et al., Spatial-seq 2.0 consistently outperformed the initial workflow in terms of RNA capture efficiency, transcript recovery, the median number of genes detected per spatial location, reproducibility across biological replicates, effective spatial resolution, and spatial signal consistency. These quantitative improvements were comprehensively validated in both mouse tissues and human clinical samples, demonstrating substantially enhanced sensitivity while maintaining robust spatial fidelity[22]. By improving transcript capture efficiency and reducing technical noise, Spatial-seq 2.0 enables more reliable characterization of transcriptional heterogeneity within small pathological regions. Collectively, these published benchmarking data demonstrate that Spatial-seq 2.0 represents a substantial methodological advancement over the original platform and provides the technical foundation for accurately resolving the molecular architecture of the ischemic penumbra in the present study. Therefore, Spatial-seq 2.0 was selected as the spatial transcriptomic platform for all subsequent analyses. Because transcriptional remodeling within the ischemic penumbra is most prominent during the first 24 h after ischemic stroke, the present study focused on this acute-stage time point to characterize the early spatial molecular responses to PNS and PGS. Consequently, Spatial-seq 2.0 was employed to enable reliable detection of these early spatial transcriptomic alterations within the ischemic penumbra.
In this study, we employed Spatial-seq 2.0 to compare the neuroprotective effects of PNS and PGS in a mouse model of acute ischemic stroke, with a particular focus on the ischemic penumbra. By integrating pharmacodynamic evaluation, spatial transcriptomic profiling, and multi-level experimental validation, we aimed to investigate the distinct spatial and molecular responses to PNS and PGS and to explore the modern molecular mechanisms that may be associated with the TCM concepts of 'activating blood' and 'replenishing qi'. This work is expected to provide mechanistic insights into the complementary pharmacological characteristics of PNS and PGS and to support the evidence-based application of TCM in ischemic stroke.
-
P. Notoginseng saponins and P. Ginseng saponins used in this study were standardized commercial preparations purchased from Shanghai Yuanye Bio-Technology Co., Ltd (Shanghai, China). To ensure experimental reproducibility, all experiments were performed using materials from the same production batch throughout the study. According to the manufacturers' certificates of analysis, the assay contents of PNS and PGS were 70.4% (Lot No. S05HS193585) and 80.4% (Lot No. J23HS189039), respectively, meeting the corresponding quality specifications. Since both preparations were commercially standardized products and all animal experiments were conducted under identical experimental conditions, the observed biological differences primarily reflect the differential biological responses elicited by the two standardized saponin preparations rather than batch-to-batch variation. All dosages were calculated based on total saponin content to ensure equivalent saponin exposure between the two groups.
Animals
-
All animal experiments were approved by the Animal Care and Use Committee of the Zhejiang University School of Medicine (Zhejiang, China) and were carried out in strict accordance with the Guidelines for the Care and Use of Laboratory Animals. Male C57BL/6 mice (8- to 10-week-old) were obtained from Beijing Vital River Laboratory Animal Technology Co., Ltd (Beijing, China). The mice were housed in a temperature-controlled animal facility (24–26 °C) under a 12-h dark/light cycle and with free access to clean water and a standard diet.
Animal model of permanent middle cerebral artery occlusion (pMCAO)
-
After 7 d of acclimatization, a mouse model of pMCAO was established by the improved suture-occlusion method. Briefly, mice were anesthetized with 1% pentobarbital sodium before operation. In order to monitor the cortical cerebral blood flow changes corresponding to the middle cerebral artery in real time, the fibre-optic probe of the Laser Doppler Flowmeter was fixed on the exposed skull surface (center area: 2 mm behind bregma, middle suture 6 mm right; peripheral area: 2 mm behind bregma, middle suture 3 mm right).
After disinfecting the exposed neck with 75% alcohol, an incision was made on the middle right side of the neck to expose and isolate the right common carotid artery (CCA). The proximal end was lapped with a 5/0 surgical suture, and the distal end was temporarily clipped with an arterial clamp. Having created a moderately sized incision at the distal end of the CCA with microsurgical scissors, the prepared filament was inserted through the incision, and the cut was gently secured with suturing thread. Subsequently, the arterial clamp was released, and the silicone filament was gently pushed into the CCA until encountering slight resistance to block the middle cerebral artery, resulting in focal ischemia. If the cerebral blood flow in the core area dropped to about 20% of its original level shown on the Laser Doppler Flowmeter, the pMCAO model was considered successful and could be used for subsequent experiments. After the neck incision was sutured and disinfected with iodophor, the mice were placed in a thermostatically controlled incubator to maintain body temperature and then put in the cage after recovery.
Grouping and treatment
-
Using a random number table method, all mice were divided into the following seven groups. Immediately after pMCAO surgery, mice received the corresponding treatments according to group allocation. (1) Sham group: mice underwent pMCAO surgery without filament insertion; (2) Model group: mice successfully established the pMCAO model; (3) Low-dose P. ginseng saponins group (PGS-L): after establishing the pMCAO model, mice were administered with a gavage of 100 mg·kg−1 PGS suspension; (4) High-dose P. ginseng saponins group (PGS-H): after establishing the pMCAO model, mice were administered with a gavage of 200 mg·kg−1 PGS suspension; (5) Low-dose P. notoginseng saponins group (PNS-L): after establishing the pMCAO model, mice were administered with a gavage of 100 mg·kg−1 PNS suspension; (6) High-dose P. notoginseng saponins group (PNS-H): after establishing the pMCAO model, mice were administered with a gavage of 200 mg·kg−1 PNS suspension; (7) edaravone (Eda) positive control group: after establishing the pMCAO model, mice were intraperitoneally injected with 4 mg·kg−1 Eda solution (the approximate mouse equivalent dose converted from the clinical dosage of Eda injection, 30 mg per occasion, twice a day). Eda was selected as a positive control for its confirmed neuroprotective effect in acute ischemic stroke[23−25]. The Sham and Model groups were administered an equal volume of sodium carboxymethylcellulose solution via gavage. The neurological deficit score was evaluated at 24 h after modeling. Additionally, 32 mice were randomly divided into four groups (n = 8) comprising the Sham, Model, PGS-H, and PNS-H groups, with the same treatments as above to observe the survival of mice in each group over 7 d.
Neurological deficit scores
-
Neurological deficit scores were obtained 24 h after modeling using the modified Longa's five-point test[26], with higher scores indicating more severe neurological dysfunction (0: normal score; 4: maximal deficit score). The reason for choosing the Longa score is that it is simple to operate and highly sensitive to acute neurological deficits after pMCAO, which is widely used in acute stroke studies[27]. The specific criteria for evaluation are as follows: (1) no symptoms: 0 points; (2) inability to fully extend the contralateral forepaw: 1 point; (3) circling to the paralyzed side while walking: 2 points; (4) falling to the paralyzed side while walking: 3 points; (5) inability to walk spontaneously and presence of consciousness loss: 4 points.
TTC staining of mouse brain tissue
-
Twenty-four hours after modeling, mice were rapidly euthanized by cervical dislocation, and the brain tissues were carefully extracted. The cerebellum, olfactory bulbs, and lower brainstem were removed, and the mouse brains were sliced into five coronal sections, each approximately 2 mm thick. These slices were then placed in a 0.25% solution of 2,3,5-Triphenyltetrazolium chloride (TTC) and incubated at 37 °C in a dark environment for 20 min, occasionally flipped with tweezers to ensure even staining. After staining, infarcted areas appeared white, normal tissue appeared red, and areas transitioning between infarcted and normal tissue appeared pink. Then the brain slices were fixed in 4% paraformaldehyde for 4 h, rinsed with saline, and photographed. Image analysis for calculating the relative infarct volume of each mouse's brain was performed using ImageJ software.
Hematoxylin-eosin (H&E) staining of mouse brain tissue
-
In the Spatial-seq protocol, one of the frozen sections was placed in a 4% paraformaldehyde solution for 10–15 min. Subsequently, the section was rinsed with PBS to remove the stationary liquid, usually two to three times for 5 min each time. For staining, the section was placed in hematoxylin stain for 5 min and eosin stain for 3 min. Then, the section was dehydrated in a graded alcohol series (70%, 85%, 95%, and 100% ethanol), spending 1 min in each concentration. Following dehydration, the section was placed in xylene for 2 min to achieve clarification and mounted using neutral balsam. Finally, the stained section was observed under a microscope, and images were acquired through an image acquisition system for analysis.
Nissl staining of mouse brain tissue
-
In the Spatial-seq protocol, after fixation and rinsing, one of the frozen sections was stained with Nissl stain for 5 min. Following staining, the section was sequentially dehydrated in a graded alcohol series (70%, 85%, 95%, and 100% ethanol), spending 1 min in each concentration. Subsequently, the section was placed in a 65 °C oven for 4 h for desiccation and immersed in xylene for 10 min for clarification, followed by mounting with neutral balsam. Finally, the stained neuronal cells and tissue structures were observed under a microscope, and images were collected and analyzed.
Terminal deoxynucleotidyl transferase-mediated dNTP nick end labeling (TUNEL) assay
-
In the Spatial-seq protocol, after fixation and rinsing, one of the frozen sections was covered with Proteinase K solution and incubated at 37 °C for 30 min, followed by washing two to three times with PBS. Excess liquid was gently shaken off, and film-breaking solution was added to incubate at room temperature for 20 min, followed by washing with PBS. For apoptosis marking, reagent 1 and reagent 2 in the TUNEL kit were mixed at a ratio of 1:29 and coated on tissue sections. The section was then incubated in a 37 °C water bath for 120 min and washed again with PBS. Subsequently, the section was soaked in DAPI dye and incubated in the dark at room temperature for 10 min, followed by a final wash with PBS. After staining, the section was sealed with a mounting medium for preservation. Detailed observations and image recordings were made using a NIKON inverted fluorescence microscope at a 400× magnification, with each experimental group including three samples. This process aimed to precisely identify and record the state of cell apoptosis within the brain tissue, providing a crucial foundation for subsequent data analysis.
Spatial transcriptomics and data analysis with Spatial-seq 2.0
-
Spatial-seq is a high-throughput mixed sampling sequencing method for spatial transcriptomics based on Laser Capture Microdissection (LCM) previously developed by our research group[22]. The experimental workflow is as follows: (1) synthesis and quality control of DNA spatial barcodes; (2) sampling, slicing, staining, and spatial registration of mouse brain tissue; (3) microdissection and barcode capture tagging; (4) reverse transcription, amplification, and cDNA library preparation; and (5) high-throughput mixed sampling sequencing and data analysis. Further optimizations are based on the initial experimental protocol, including: (1) improving the efficiency of barcode synthesis; (2) enhancing RNA quality; (3) increasing the capture rate of spots; (4) optimizing reagents to improve the efficiency of reverse transcription, amplification, and library preparation. The specific optimization strategies are as follows.
Improving the efficiency of DNA spatial barcode synthesis
-
The original three-step synthesis method was optimized to a two-step synthesis method. The first step of the synthesis was to connect the first segment of the spatial barcode to the spatial magnetic beads. First, the carboxyl magnetic beads were thawed at 4 °C, and then the EDC solution was prepared. In particular, the EDC solution should be ready for use and operated quickly on ice to avoid deliquescence. Next, the magnetic beads were cleaned and divided into four 1.5 mL centrifuge tubes, with approximately 1.67 × 10⁶ carboxyl magnetic beads (about 232 μL) in each tube. After the carboxyl magnetic beads were washed once or twice with 0.1 mol·L−1 MES buffer, approximately 31.6 μL of the washed bead suspension remained in each tube. Subsequently, 358 μL of 0.1 mol·L−1 MES buffer and 34.4 μL of freshly prepared EDC solution containing 2.06 mg of EDC were added to each tube, bringing the total volume to approximately 424 μL. After thorough mixing, 400 μL of the suspension was transferred from each tube and divided equally among four 1.5-mL PCR tubes, with 100 μL in each tube. After mixing, 400 μL of the mixture was removed from each tube and evenly divided into four 1.5 mL PCR tubes, 100 μL each. Subsequently, 80 μL of 0.2 mol·L−1 MES and 80 μL of the corresponding first segment of spatial barcode primer (primer A) were added to each tube and thoroughly mixed. The EP tube was attached to the rotator and rotated at room temperature on a low speed for 20 min. During this process, the EDC solution was prepared fresh again, with 32.36 μL (0.45 mg) of EDC solution added to each tube and the rotation repeated again, including one 20-min and one 80-min low-speed rotation. After the rotation, the tubes were placed on the magnetic rack, sucked and cleaned, and then the beads were washed and re-hung successively with 100 μL 0.1 mol·L−1 PBS with 0.02% Tween-20, enzyme-free water, and TE with pH = 8.0. Finally, the beads were suspended in 280 μL enzyme-free water.
The second step of synthesis was to connect the second and third segments of the spatial barcode to the spatial magnetic beads. First, primer B, primer C, and Vazyme 2× Phanta Master Mix were removed from 4 °C in advance, mixed, and centrifuged quickly. In the PCR connection phase, the volume of beads required was calculated based on the amount of sequence to be connected, and the corresponding beads suspension was added at about 1.2 times the volume. The mixed reactants were distributed into 96-well PCR plates, with a specific ratio of the mixture shown in Table 1.
Table 1. Table of reactants and volumes per well.
Reaction mix μL·well−1 Vazyme 2 × Phanta Master Mix 13.5 Beads 4 Primer B (50 μmol·L−1) 1 Primer C (50 μmol·L−1) 1.5 Total 20 After the 96-well plate was mixed and centrifuged rapidly, subsequent PCR amplification was performed. The amplification procedure is shown in Table 2.
Table 2. PCR connection second and third sequence reaction program settings.
Step Temperature Time 1 94 °C suspend beads 5 min 2 95 °C suspend beads 15 s 3 48.8 °C 4 min 4 72 °C 4 min 5 Go to step 2, total five cycles / 6 94 °C suspend beads 5 min 7 48.8 °C 20 min 8 72 °C 20 min 9 4 °C Hold After completing the PCR reaction, the next step was to post-process the 96-well plate to ensure the accuracy and usability of the barcodes. First, the 96-well plate was placed on a magnetic rack and operated on ice to remove the supernatant, followed by a cleaning of each well with enzyme-free water to remove the residual PCR reaction mixture. Next, 10 μL of Exonuclease Mix was added to each well and incubated at 37 °C for 15 min to digest the unamplified single-stranded DNA. In order to ensure the reaction was fully carried out, beads need to be suspended every 6 min to promote full contact between the enzyme and the DNA. After that, a series of washing and re-suspension steps are performed, including 10 μL TE-SDS, TE-TW, and 20 μL enzyme-free water to completely remove residues that may affect the next step of the experiment. The sealing plate film was then removed, and the 96-well plate was placed in a metal bath at 95 °C for about 6 min. The supernatant was quickly removed and washed with 20 μL of enzyme-free water; this step was repeated twice. Finally, 15 μL TE-TW beads were added to each well and stored at 4 °C after labeling. These detailed post-processing steps not only ensured the quality of the DNA barcode but also provided a stable and reliable basis for subsequent applications.
Quality control of DNA spatial barcodes
-
Having removed the supernatant and washed it with 20 μL of enzyme-free water on the magnetic rack, 1 μL of beads was diluted to 100 μL with enzyme-free water. Then, 9 μL of qPCR mix and 1 μL of diluted magnetic beads were added to each well of a 96-well plate to prepare a complete qPCR system, as shown in Table 3.
Table 3. qPCR reactants and volume table for each well.
Reaction mix μL·well−1 2 × SYBR Green Mix 10 Beads 1 Primer Universal (10 μmol·L−1) 1 Primer Tail (10 μmol·L−1) 1 Enzyme-free water 7 Total 20 After the 96-well plate was mixed and centrifuged rapidly, subsequent PCR amplification was performed. The amplification procedure is shown in Table 4. Finally, the beads in the 96-well plates were suspended with 15 μL TE-TW and stored at 4 °C.
Table 4. qPCR reaction program settings.
Step Temperature Time 1 95 °C 1 min 2 95 °C 5 s 3 55 °C 15 s 4 Go to step 2, total 35 cycles 5 Melt curve Sample and section of mouse brain tissue
-
Enzyme-free phosphate-buffered saline (PBS), and RNAlater solution were precooled before tissue collection. Mice in the Sham, Model, PNS-H, and PGS-H groups were deeply anesthetized with 1.5% pentobarbital sodium and transcardially perfused with 20 mL of enzyme-free PBS, followed by 5 mL of RNAlater solution. Brains were rapidly dissected, gently rinsed with precooled PBS to remove residual blood, blotted dry using RNase-free filter paper, immediately snap-frozen in liquid nitrogen for 30–60 s, and stored at −80 °C until further processing.
For spatial transcriptomic analysis, frozen brain tissues were embedded and sectioned into 10-μm-thick coronal slices using a cryostat. Ten consecutive sections from each brain were collected for subsequent spatial transcriptomic analysis, as well as parallel histological and molecular experiments, including H&E staining, Nissl staining, TUNEL assay, and other experiments.
Three biologically independent mice were included in each experimental group (Sham, Model, PNS-H, and PGS-H; n = 3 per group), resulting in a total of 12 mice for spatial transcriptomic analysis. This sample size is consistent with commonly adopted experimental designs in current spatial transcriptomics studies, considering the substantial technical complexity, high sequencing cost, and demanding tissue preparation procedures associated with spatial transcriptomic experiments. In addition, establishment of the pMCAO model involves considerable surgical difficulty and postoperative mortality, further limiting the feasibility of larger-scale experiments. Importantly, this experimental design is also consistent with previous spatial transcriptomic studies in mouse brain tissue, in which three biological replicates per group were commonly adopted for exploratory spatial transcriptomic analyses[28−30]. Therefore, the use of three biological replicates per group represents a practical and widely accepted strategy for exploratory spatial transcriptomic studies.
Importantly, during downstream statistical analyses, each mouse was regarded as one independent biological replicate, whereas individual spatial spots were treated as spatial sampling units to characterize intratissue transcriptional heterogeneity rather than independent biological replicates, thereby avoiding pseudoreplication.
Microdissection and marking with spatial barcodes
-
The first frozen section was scanned with high resolution and divided into 32 spots on the right side, each spot with a radius of about 125 μm, covering an area of about 50,000 μm2 and containing 600 cells. A total of 384 spatial spots were collected from 12 mice (32 spots per section × 1 section per mouse × 3 mice per group × 4 groups). Each spatial spot represented an individual spatial sampling unit rather than an independent biological replicate. All biological comparisons were performed at the animal level, whereas spatial spots were used to characterize intra-tissue spatial heterogeneity and regional transcriptional patterns. Cutting areas were identified automatically using the laser microdissection instrument, setting the parameters to objective 10×, final pulse mode, power = 17, aperture = 1, speed = 20, bridge size = 5, final pulse = 16. Use enzyme-free 96-well plates for collection and store at −80 °C.
Magnetic bead plates stored at 4 °C were rapidly centrifuged to remove residual liquid and cleaned with enzyme-free water one to two times with 15−20 μL enzyme-free water, followed by re-suspension with 20 μL of enzyme-free water solution. The entire operation was carried out on ice.
Subsequently, 19 μL of lysis buffer and 1 μL magnetic bead suspension were added to each well of a deep 384-well plate on ice. The stored 96-well collection plate was removed from −80 °C, and instantaneous centrifugation was performed to remove possible ice crystals. A 20 μL sample of lysis buffer containing magnetic beads was added to each well, lysed at room temperature for 5 min, and incubated on ice for 12 min. During this period, the magnetic beads were resuspended every 2 min to promote effective capture of mRNA. After incubation, the magnetic beads were collected into a 1.5 mL centrifuge tube.
Next, the beads were rinsed with 500 μL 6× SSC two to three times, and the supernatant was removed after a final rapid centrifugation. Then, 300 μL 50 mmol·L−1 Tris pH 8.0 was added to resuspension beads, and 20 μL reverse transcription premix RT Mix prepared on ice was added immediately for reverse transcription of mRNA.
Reverse transcription, amplification, and cDNA library preparation
-
The conditions of the reverse transcription reaction were set to react in a 42 °C metal bath for 90 min, with suspension mixing required every 15 min. After the reaction was complete, the supernatant was briefly centrifuged for a few seconds, the Eppendorf (EP) tube was placed on a magnetic stand, and the supernatant was carefully aspirated. The magnetic beads were washed with 200 μL TE-SDS, TE-TW, and 10 mmol·L−1 Tris-HCl (pH 8.0) and resuspended with 200 μL exonuclease system, incubated in a 37 °C incubator for 60 min, with suspension mixing required every 10 min. After the reaction and the removal of supernatant, beads were cleaned again with 200 μL of TE-SDS, TE-TW, and 10 mmol·L−1 Tris-HCl (pH 8.0).
The Pre-Amp PCR system was used to amplify magnetic beads; detailed conditions are shown in Table 5.
Table 5. PCR amplification reaction program settings.
Step Temperature Time 1 98 °C 3 min 2 98 °C 20 s 3 65 °C 45 s 4 72 °C 6 min Go to Step 2, total six cycles 5 72 °C 10 min 6 4 °C Hold VAHTS DNA Clean Beads were balanced to room temperature in advance and swirled well. The PCR product was placed on a magnetic rack, and the supernatant was transferred to a new EP tube. The process of purifying PCR products with 0.8× VAHTS DNA Clean Beads is as follows: VAHTS DNA Clean Beads were added to an EP tube, mixed, and placed at room temperature for 15 min; the supernatant was absorbed and cleaned twice with 200 μL newly configured 80% ethanol and incubated at room temperature for 30 s. The tube was removed from the magnetic rack, and cDNA was eluted with 13 μL nuclease-free water; 12 μL supernatant was put into a new EP tube at room temperature for 10 min, and mixed with 12.5 μL 2× Kapa HiFi HotStart Readymix and 0.5 μL 10 μmol·L−1 TSO-PCR primer for the second PCR amplification, as shown in Table 6.
Table 6. qPCR amplification reaction program settings.
Step Temperature Time 1 98 °C 3 min 2 98 °C 20 s 3 72 °C 6 min Go to Step 2, total 10 cycles 5 72 °C 10 min 6 4 °C Hold The amplified products were purified again with 0.7× VAHTS DNA Clean Beads, as above. The cDNA concentration was determined by a Qubit 4.0 fluorometer, and the cDNA bands were detected by Agilent 4,200 nucleic acid microfluidic electrophoresis.
cDNA library construction and sequencing
-
The cDNA Library was constructed according to the TruePrep DNA Library Prep Kit v2 for Illumina operating instructions, and HiSeq-PE150 double-ended sequencing was performed by the Illumina® Xten platform.
RNA-sequencing processing
-
In order to achieve effective gene mapping, the raw sequencing data were first separated into separate files using a custom Python script based on the spatial barcodes (barcode 1−384) for subsequent analysis using Hisat2[31] or STAR[32]. This procedure was modified from the recommended procedure in the Drop-seq Alignment Cookbook[33], ensuring accuracy and efficiency of the analysis. The initial quality control of the sequencing data in the 'fq' format was done by FastQC.
The processed 'fq' file was converted to 'bam' format and sorted by queryname using the 'FastqToSam' feature of the Picard tool. Next, through the Drop-seq toolkit, TagBamWithReadSequenceExtended functions were performed to extract the Barcode and UMI information, respectively. Using the FilterBam function, barcodes and UMIs of low quality were removed, and further, using the TrimStartingSequence function, the primer sequence at the 5' end and polyA tail at the 3' end were removed. After that, the 'bam' file was converted back to the 'fastq' format for sequence alignment with the SamToFastq feature.
STAR was chosen for sequence alignment in this study, and GRCm38 or mm10 were selected as references for mapping. After completing the sequence alignment, results were sorted by the SortSam function of Samtools and merged with the MergeBamAlignment function of Picard. Finally, the Drop-seq tools (v2) were used to label the gene function and generate the digital expression matrix of each sample.
Space registration of frozen sections
-
High-resolution microscopic images of coronal incision of brain tissue obtained with LCM were mapped to the standard 3D reference Allen Brain Atlas with QuickNII, a mouse brain tissue spatial registration software, for identifying and labeling regions of each brain section.
Analysis of Spatial-seq spatial transcriptome data
-
The spatial transcriptomic gene expression matrix was normalized and scaled using the edgeR package to minimize the influence of sequencing depth and RNA composition on gene expression estimation. Differential gene expression analysis was subsequently performed using the Likelihood Ratio Test (LRT), which evaluates differential expression by comparing the goodness-of-fit between a full model and a reduced model. To control for multiple hypothesis testing, P-values were adjusted using the False Discovery Rate (FDR) method. Genes with P < 0.05 and |log2foldchange| > 1 were defined as significantly Differentially Expressed Genes (DEGs).
Importantly, statistical inference was conducted at the level of biological replicates, with each mouse regarded as one independent biological replicate (n = 3 per group). Individual spatial spots were treated as spatial sampling units for transcriptomic profiling and characterization of intratissue transcriptional heterogeneity, rather than as independent biological replicates, thereby avoiding pseudoreplication while preserving spatial resolution within each biological sample.
To identify the spatial regions exhibiting the strongest transcriptional responses following ischemic injury, all spatial spots were ranked according to the abundance of DEGs, and the top 25% were defined as stroke-related key spatial regions for subsequent analyses. To further evaluate regional responsiveness to therapeutic intervention, Network Recovery Index for Organism Disturbed Network (NRIODN) algorithm was used to rank spatial regions according to their transcriptomic responses to treatment, and the top 40% of NRIODN-ranked regions were designated as drug-responsive key callback regions. These thresholds were adopted as predefined analytical criteria to balance spatial specificity, biological interpretability, and statistical robustness, rather than representing statistically optimal cutoffs. This strategy enabled prioritization of the spatial regions exhibiting the strongest biological responses while retaining sufficient spatial coverage for robust downstream comparative analyses. Accordingly, the selected regions represent the most biologically responsive spatial domains rather than statistically exclusive regions.
Functional enrichment analyses, including Gene Ontology (GO) and Kyoto Encyclopedia of Genes and Genomes (KEGG) pathway analyses, were subsequently performed on the identified key spatial regions using the Metascape online platform (
https://metascape.org ), and the enrichment results were visualized using the ggplot2 package in R.Cytotoxicity experiment
-
BV2 cells at the logarithmic growth stage were counted using Trypan blue and inoculated into 96-well plates at an inoculation density of 5 × 10³ well−1. After being cultured for 24 h and the culture medium discarded, different concentrations of PNS and PGS prepared in DMEM medium were treated to the treatment group (800, 400, 200, 100, 50, 25, and 12.5 μg·mL−1), while DMEM medium was added to the control group, including a blank well containing only complete medium without cells. After being incubated for 24 h in the cell incubator, the drug toxicity was tested using the CCK-8 kit. Specifically, 100 μL CCK-8 solution was added to each well, mixed well, and incubated for 2 h in the dark. Water-soluble, orange-yellow formazan products were gradually produced, the color of which was inversely proportional to the cytotoxicity. The value of optical density (OD) was measured at 450 nm by an enzymoleter, and the effects of PNS and PGS on BV2 cell viability were calculated according to Eq. (1). The experiment was repeated three times, and statistical plots were made.
$ Cell\;activity\left( {\text{%}} \right) =\frac{OD\left( Treat\right) -OD\left( Blank\right) }{OD\left( 0Treat\right) -OD\left( Blank\right) }\times 100 $ (1) Oxygen-glucose deprivation (OGD) model and drug treatment
-
BV2 cells at the logarithmic growth stage were counted using Trypan blue and inoculated into 6-well plates at an inoculation density of 1.5 × 10⁵ well−1 for culturing for 24 h. Drug intervention was performed, grouped as follows: Control group (cultured with high glucose medium); Model group (cultured with serum-free sugar-free DMEM medium); PNS group (100 μg·mL−1 PNS); and PGS group (100 μg·mL−1 PGS). Then, the oxygen-glucose deprivation (OGD) model was used to simulate the hypoxic and glucose-deficient environment in vivo. The 6-well plate was placed in an anoxic chamber, aerated with a gas mixture of 95% N2 and 5% O2 for 5 min. Then, alternating aeration and venting operations and the exhaust pipe was tightened at the last aeration. The anoxic chamber was placed in a constant-temperature incubator for 2 h for hypoxia, and cultured with 5% CO2 and 95% N2 for 2 h. Normal medium under normal oxygen conditions was used as the control.
Cell RNA extraction
-
RNeasy Mini Kit was used to extract RNA from each group of cells. Briefly, cells were digested with trypsin, and cell precipitates were collected and transferred to a homogenate tube without RNase. Two magnetic beads (diameter 1 mm) were added to the homogenate tube, 360 μL Buffer RLT was added, swirled for 1 min, centrifuged at 12,000 r·min−1 for 3 min, and 350 μL was transferred into a 1.5 mL centrifuge tube. This was followed by the addition of 350 μL 70% ethanol into the centrifuge tube and mixing the pipette well. The resulting 700 µL sample was transferred to a RNeasy Mini rotating column, centrifuged at 12,000 r·min−1 for 30 s, and the liquid in the collection tube was discarded. A 700 µL volume of Buffer RW1 was centrifuged at 12,000 r·min−1 for 30 s, and the liquid was discarded into the collection tube. A 500 µL volume of Buffer RPE was centrifuged at 12,000 r·min−1 for 30 s, and the liquid was discarded into the collection tube; this step was repeated once. Finally, the RNeasy rotating column was placed in a new 1.5 mL centrifuge tube. A 30 µL volume of DEPC water was added directly to the rotating column film. This was covered, centrifuged at 12,000 r·min−1 for 1 min, and the RNA was eluted into a new centrifuge tube.
Real-time fluorescence quantitative PCR validation
-
Quantitative real-time PCR (qRT-PCR) was used to verify the sequencing data. Candidate genes for qRT-PCR validation were selected from the significantly DEGs identified by Spatial-seq analysis based on their expression abundance, statistical significance, consistency across biological replicates, and biological relevance to the major enriched pathways associated with ischemic stroke. Representative genes were chosen to independently verify the reliability of the spatial transcriptomic sequencing results.
NanoDrop 2000 was used to detect the concentration and quality of the RNA. According to the instructions on the QuantiNova Reverse Transcription Kit, 13 µL RNA (2 μg) and 2 μL gDNA Removal Mix were evenly mixed and incubated at 45 °C for 2 min. Then, 4 µL Reverse Transcription Mix and 1 µL Reverse Transcription Enzyme were added and mixed, incubated at 25 °C for 3 min and then at 45 °C for 10 min. The reverse transcription process was completed following incubation at 85 °C for 5 min. After cooling, the cDNA samples were stored at −20 °C for the qRT-PCR assay. qRT-PCR was performed in the CFX96 Touch™ real-time PCR system using the Biosharp SYBR Green PCR Kit. Briefly, 10 µL 2× qPCR Master Mix, 0.6 µL of 10 µmol·L−1 forward primers and reverse primers, 3 µL cDNA template (30 ng), and 5.8 µL enzyme-free water were placed in the PCR apparatus, incubated at 95 °C for 1 min, and then treated in a two-step cycle 40 times; 95 °C for 5 s and 60 °C for 15 s at each cycle. In this study, 2−ΔΔCᴛ was used to calculate the relative gene expression. The reference gene was Actb (β-actin), and the primer sequence is shown in Table 7.
Table 7. Sequences of primers for q-PCR.
Gene Forward primers (5'-3') Reverse primers (5'-3') Thy1 CTAGCCAACTTCACCACCAAGGATG CTTATGCCGCCACACTTGACCAG Mif GCATCGGCAAGATCGGTGGTG GTTGGCAGCGTTCATGTCGTAATAG Rac CCGCAGACAGTTGGAGACACATG TGTCGCACTTCAGGATACCACTTTG Sephs2 GGATCGTTGGCATCGTGGAGAAG CAGCAGCAGCAGCAGCAGAG Dad1 GCGTCTGTGGTGTCCGTCATC GAGATAGGCGTCCAGCAACTTCAG Actb CTACCTCATGAAGATCCTGACC CACAGCTTCTCTTTGATGTCAC Western blot analysis
-
Proteins were extracted from the ischemic penumbra using RIPA lysis buffer (Servicebio, Wuhan, China) supplemented with protease and phosphatase inhibitor cocktails. Protein concentrations were determined using a BCA Protein Assay Kit (Servicebio, Wuhan, China). Equal amounts of protein (20–30 μg per lane) were separated by 10% SDS–PAGE and transferred onto 0.45-μm PVDF membranes. After blocking with protein-free rapid blocking buffer for 30 min at room temperature, the membranes were incubated overnight at 4 °C with the following primary antibodies: Rac1 (1:500, Cat# GB11621, Servicebio, Wuhan, China), VE-cadherin (1:1,000, Cat# 60787T, Cell Signaling Technology, Danvers, MA, USA), SDHA (1:1,000, Cat# GB113278, Servicebio, Wuhan, China), ATP5A (1:1,000, Cat# GB152433, Servicebio, Wuhan, China), NRF2 (1:500, Cat# GB113808, Servicebio, Wuhan, China), and β-actin (1:5,000, Cat# GB15003, Servicebio, Wuhan, China). After washing with TBST, the membranes were incubated with HRP-conjugated goat anti-rabbit IgG (1:3,000, Cat# GB23303, Servicebio, Wuhan, China) for 1 h at room temperature. Protein bands were visualized using an enhanced chemiluminescence (ECL) detection kit (Servicebio, Wuhan, China), and band intensities were quantified using ImageJ software (National Institutes of Health, Bethesda, MD, USA). The expression levels of target proteins were normalized to β-actin.
Statistical analysis
-
All data are expressed as mean ± standard error of the mean (SEM). GraphPad Prism 7 software was used for analysis, and the differences between groups were analyzed by one-way ANOVA, Dunnett posterior analysis, or t-test. P < 0.05 indicated a significant difference.
-
The experimental workflow of this study is illustrated in the schematic diagram (Fig. 1a). Male C57BL/6 mice were subjected to pMCAO, followed by intragastric administration of PNS or PGS at different doses, with Eda as a positive control, and brain tissue was collected at 24 h post-modeling for subsequent analyses.
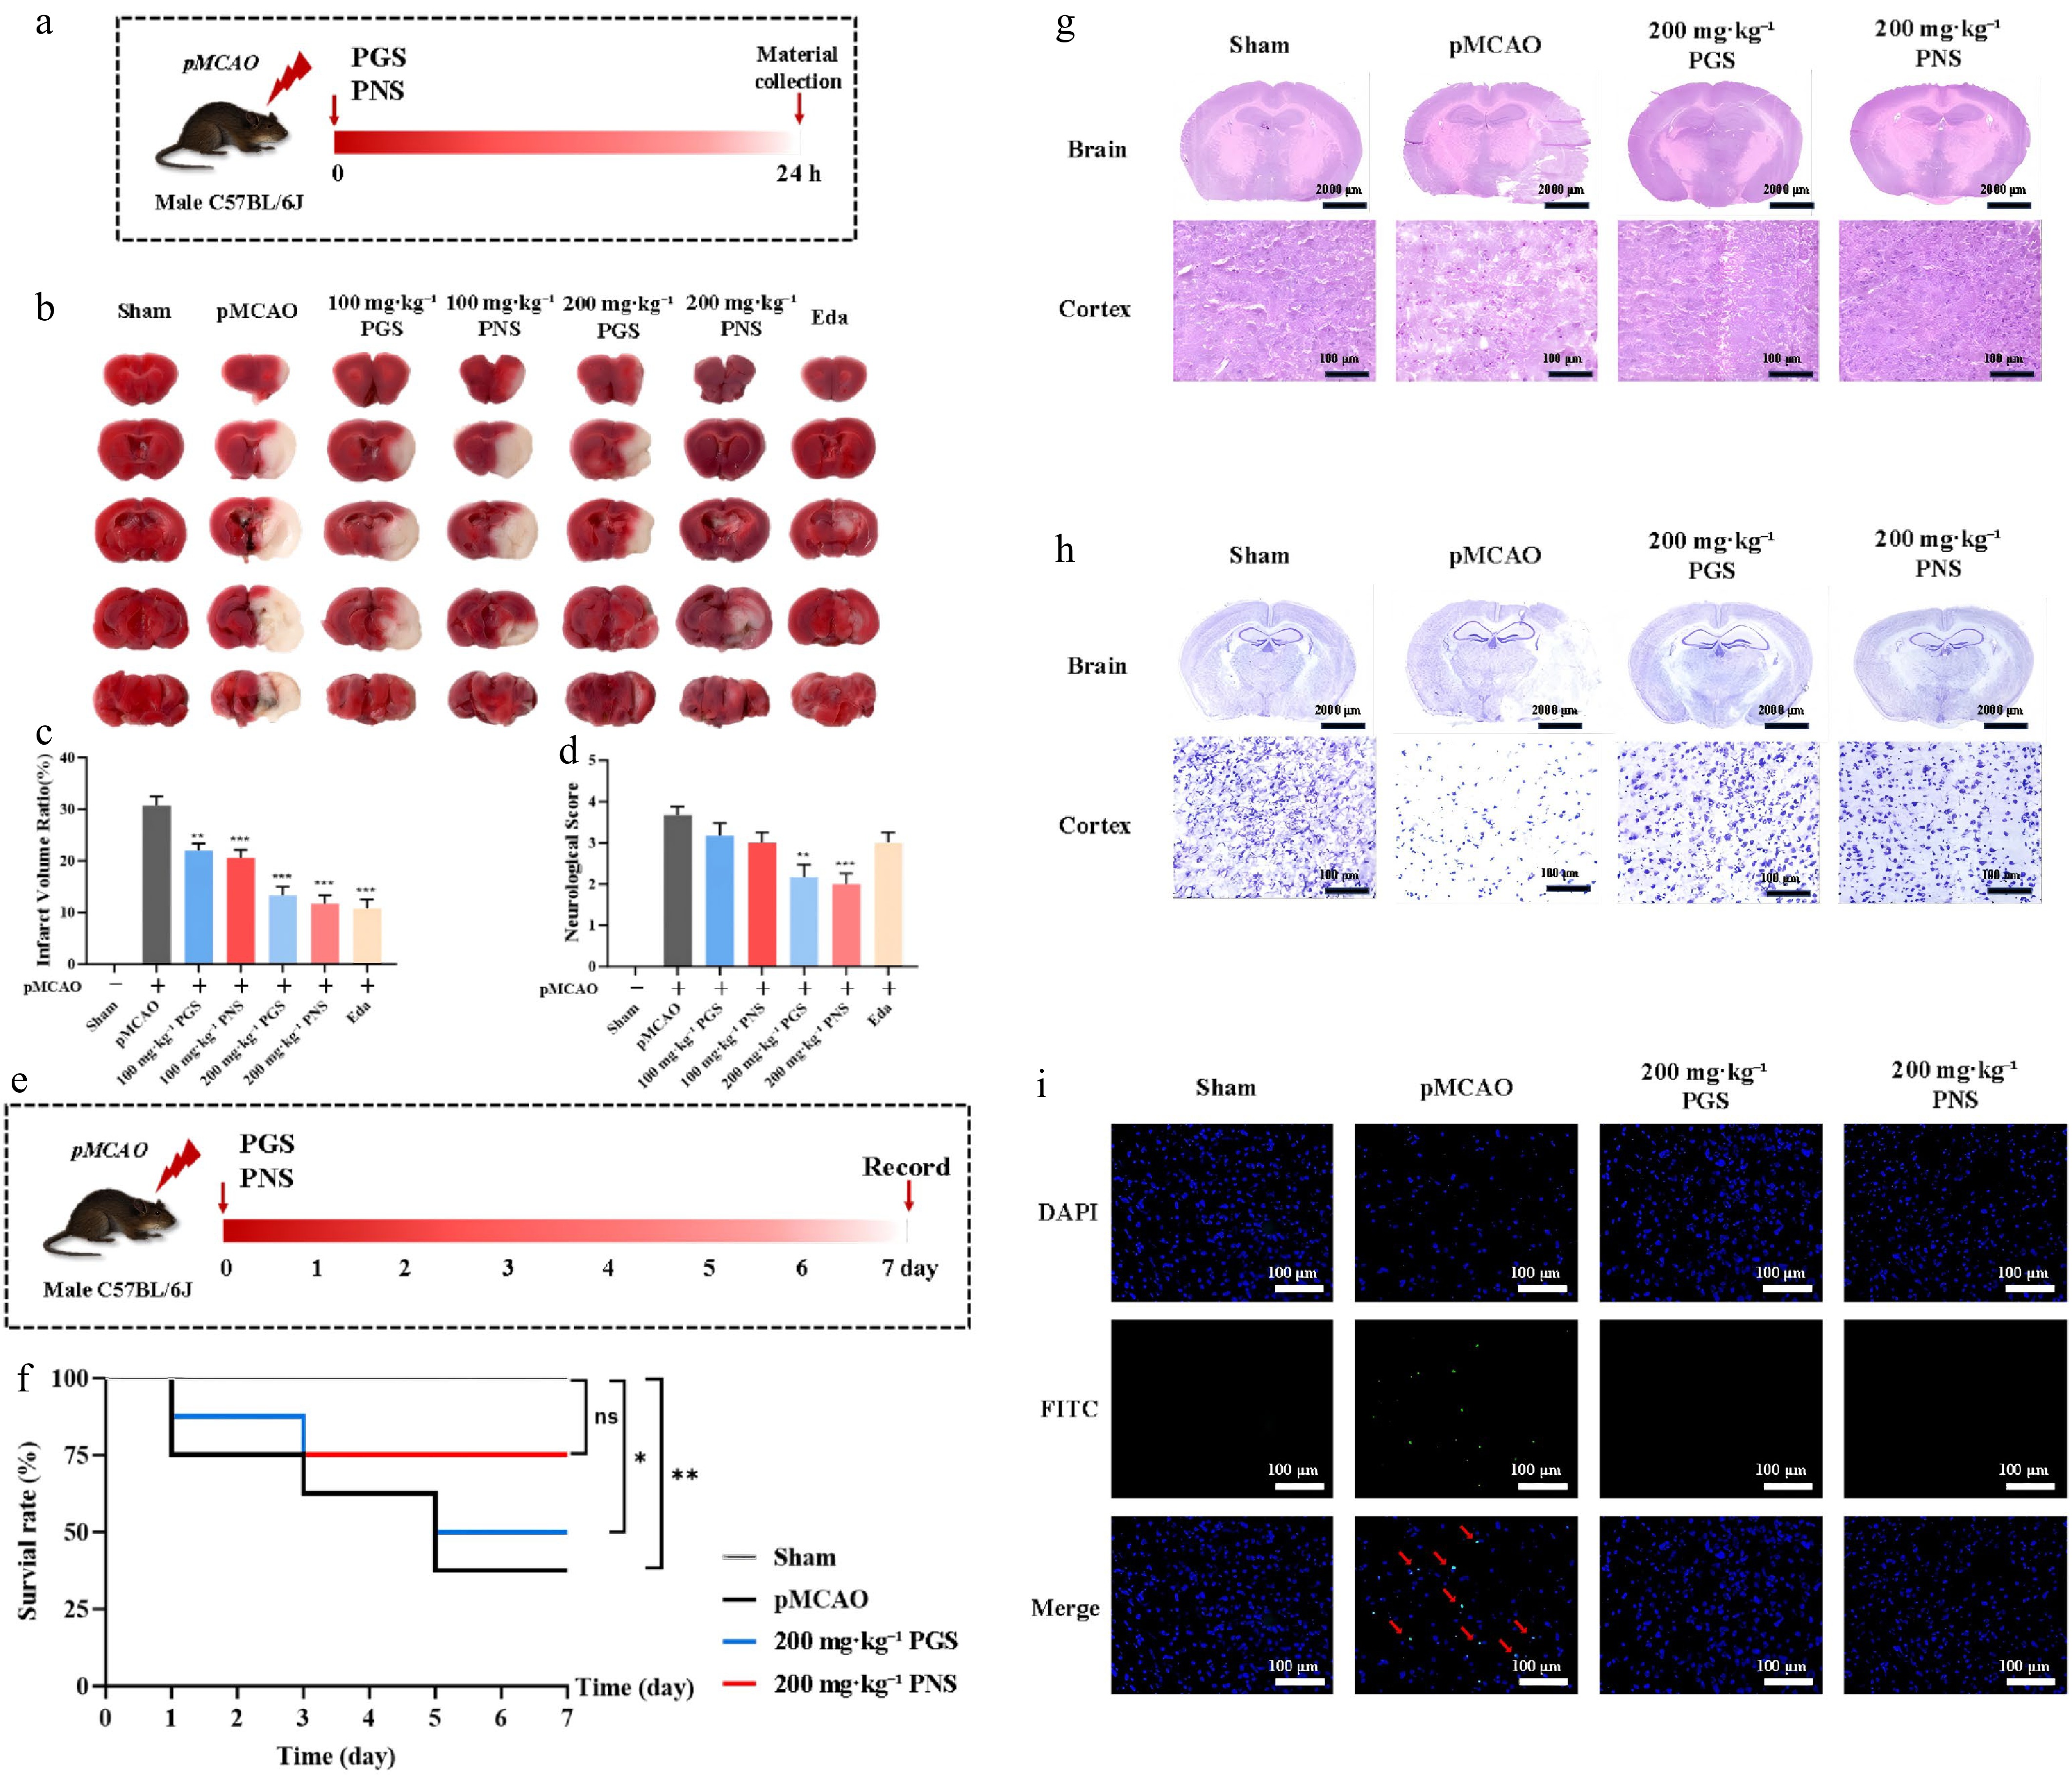
Figure 1.
PNS and PGS alleviate acute cerebral ischemic injury in pMCAO mice. (a) Experimental design of the pMCAO model and drug administration. Mice were subjected to pMCAO followed by intragastric administration of vehicle, PNS (100 mg·kg−1 and 200 mg·kg−1), and PGS (100 mg·kg−1 and 200 mg·kg−1) immediately after surgery. Neurological function was evaluated after 24 h, followed by tissue collection for TTC staining, histological examination, and molecular analyses. (b) Representative TTC-stained coronal brain sections showing cerebral infarct areas in Sham, pMCAO, PNS, and PGS groups. The white region indicates infarcted tissue, whereas the red region represents viable brain tissue. (c) Quantification of cerebral infarct volume calculated from TTC-stained sections. (d) Neurological scores assessed 24 h after pMCAO. (e) Schematic diagram of the experimental design for the 7-d survival study. Mice were subjected to permanent middle cerebral artery occlusion and immediately treated with vehicle, PNS (200 mg·kg−1), or PGS (200 mg·kg−1) by oral gavage after surgery. Survival was monitored daily for seven consecutive days, and survival rates were recorded throughout the observation period. (f) Kaplan–Meier survival curves of mice following pMCAO. Survival was monitored for 7 d after surgery in the Sham, pMCAO, PNS, and PGS groups (n = 8 mice per group). Survival differences among groups were analyzed using the log-rank (Mantel–Cox) test. Data are presented as survival probability over time. Statistical significance was defined as P < 0.05. Compared with the pMCAO group, * P < 0.05 and ** P < 0.01. (g) Representative H&E staining of ischemic brain sections collected at 24 h after pMCAO (acute treatment experiment). Low-magnification images illustrate overall lesion morphology, whereas high-magnification images show neuronal architecture within the ischemic cortex. Scale bars: 2,000 μm (upper panels) and 100 μm (lower panels). (h) Representative Nissl staining of ischemic brain sections collected at 24 h after pMCAO (acute treatment experiment). Intact neurons containing abundant Nissl bodies appear dark blue-purple, whereas injured neurons exhibit reduced Nissl substance and disrupted cellular morphology. Scale bars: 2,000 μm (upper panels) and 100 μm (lower panels). (i) Representative immunofluorescence images of TUNEL staining performed on brain sections collected at 24 h after pMCAO (acute treatment experiment). Blue indicates DAPI-stained nuclei, green indicates TUNEL-positive apoptotic cells, and merged images illustrate the spatial distribution of apoptotic neurons. Red arrows indicate representative TUNEL-positive cells. Scale bar = 100 μm. (n = 3). Data are presented as mean ± SD, n = 6. Statistical analyses were performed using one-way analysis of variance (ANOVA) followed by Tukey's multiple-comparison test. Neurological deficit scores were analyzed using the Kruskal–Wallis test followed by Dunn's post hoc test because the data were non-normally distributed. Statistical significance was defined as P < 0.05; * P < 0.05; ** P < 0.01; *** P < 0.001 vs the pMCAO group.
At 24 h after pMCAO modeling, neurological function scores were evaluated (n = 8 per group). Compared with the Sham group (score = 0), the pMCAO model group exhibited severe neurological deficits with a score of 3.67 ± 0.52 (P < 0.001). After treatment with 200 mg·kg−1 PGS and PNS, the neurological scores were significantly reduced to 2.17 ± 0.75 and 2.00 ± 0.63, respectively, which were markedly lower than those in the model group (P < 0.01, P < 0.001; Fig. 1d).
TTC staining was performed to assess cerebral infarct volume (Fig. 1b). The results showed that the average infarct volume ratio of the model group was 30.73 ± 4.27% (Fig. 1c). Compared with the model group, the infarct volume was significantly reduced in all administration groups. The infarct volume of the high-dose PNS group (200 mg·kg−1) was 11.70 ± 3.96%, representing a 61.93% reduction (P < 0.001), which was comparable to that of the Eda positive control group (10.82 ± 4.14%, P > 0.05). The infarct volume of the high-dose PGS group (200 mg·kg−1) was 13.33 ± 4.09% (P < 0.01), which was significantly higher than that of the high-dose PNS group (P < 0.05; Fig. 1c).
To further evaluate the long-term protective effects, we monitored the body weight and survival status of mice within 7 d after modeling (n = 8 per group, Fig. 1e). The survival curve analysis demonstrated that the survival rate of the model group was only 25% (2/8 survived) on day 7. In contrast, the 200 mg·kg−1 PNS treatment group achieved a survival rate of 75% (6/8 survived, P < 0.01 vs the Model group), while the 200 mg·kg−1 PGS treatment group had a survival rate of 50% (4/8 survived, P < 0.05 vs the Model group; Fig. 1f).
Histopathological staining was performed to verify the neuroprotective effects. H&E staining showed that the Sham group had intact brain tissue structure with clear neuronal morphology. In contrast, the pMCAO model group exhibited severe cerebral edema, extensive vacuolation, and nuclear pyknosis in the cortex. Both high-dose PNS and PGS treatments significantly alleviated brain tissue edema and pathological damage, with PNS showing a more pronounced improvement (Fig. 1g). Nissl staining revealed a severe loss of Nissl bodies in the model group, indicating neuronal damage. Treatment with PNS and PGS significantly reversed Nissl body loss and enhanced neuronal activity, with PNS demonstrating superior efficacy (Fig. 1h). TUNEL staining was used to detect neuronal apoptosis. The results showed that the number of apoptotic cells (FITC-positive, green fluorescence) was significantly increased in the model group, while both PNS and PGS treatments markedly reduced neuronal apoptosis (p < 0.001), with PNS exhibiting a stronger inhibitory effect on apoptosis (Fig. 1i).
Collectively, these results demonstrate that both PNS and PGS exert significant neuroprotective effects in pMCAO mice, as evidenced by reduced infarct volume, improved neurological function, enhanced survival rate, and alleviated neuronal damage and apoptosis. Notably, PNS shows superior pharmacodynamic efficacy compared to PGS at the same dose.
Spatial-seq 2.0 experiment process and results of quality control
-
The experimental process of Spatial-seq 2.0 includes spatial barcode synthesis, tissue section preparation, LCM capture, and high-throughput sequencing (Fig. 2a). qRT-PCR results showed that the CT values of oligo-dT sequences on magnetic beads were mainly distributed between 5 and 15, with stable amplification efficiency (Fig. 2b). A total of 384 spots from four groups (n = 3) were captured from the mouse right brain (Fig. 2c). As shown in Fig. 2d, the y-axis denotes the fluorescence intensity of DNA fragments, which mirrors the concentration and size profile of the sequencing library. The insert sizes mainly fell in the range of 300–1,000 bp with an average of ~330 bp, complying with the quality specifications for Illumina sequencing. The number of genes (nFeature) and total transcripts (nCount) per spot were analyzed, and the median values of nFeature and nCount were relatively higher in the PNS group than in the PGS group, reflecting better preservation of transcriptional activity in ischemic tissue, which was consistent with its superior pharmacodynamic performance (Fig. 2e).
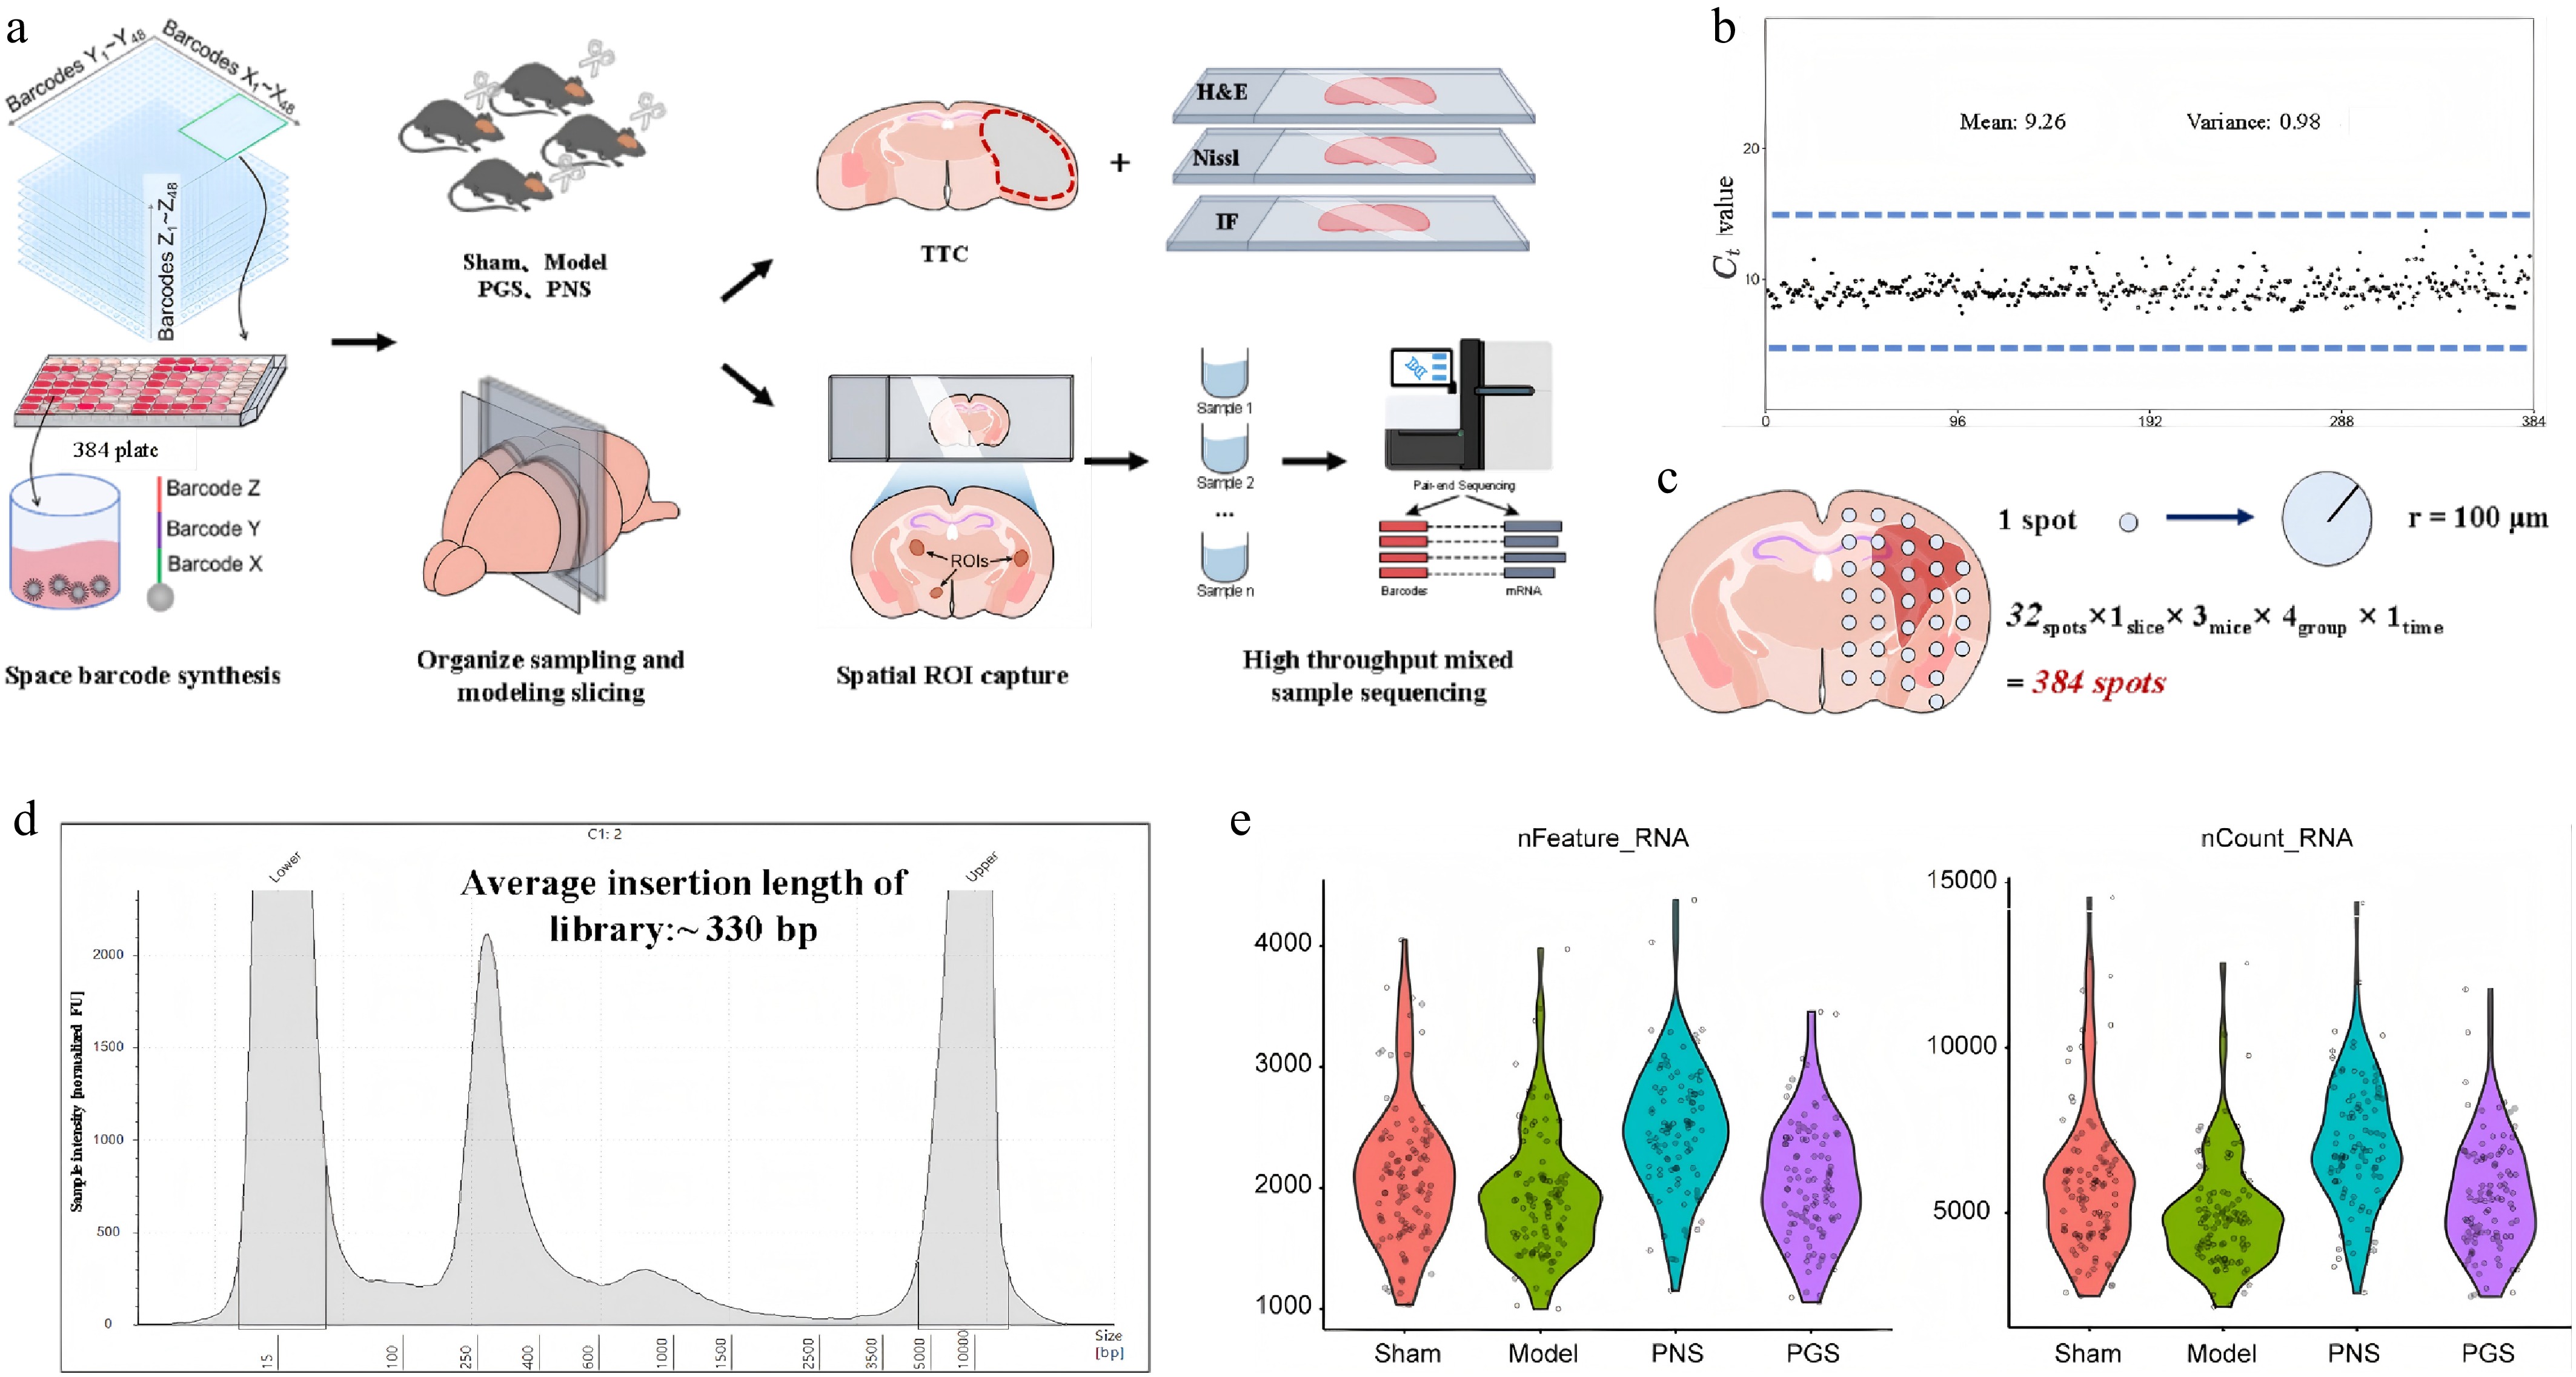
Figure 2.
Overview of the Spatial-seq 2.0 workflow and quality control of spatial transcriptomic data. (a) Schematic illustration of the Spatial-seq 2.0 workflow. The experimental procedure includes spatial barcode synthesis, establishment of the pMCAO mouse model, cryosection preparation, LCM of spatial ROIs, mRNA capture by spatially barcoded magnetic beads, reverse transcription, cDNA library construction, high-throughput sequencing, and downstream bioinformatic analyses. Consecutive brain sections were collected for H&E staining and Nissl staining to facilitate spatial registration and histopathological validation. (b) Quality assessment of spatially barcoded magnetic beads. The Ct values obtained by qRT-PCR were used to evaluate the amplification efficiency and uniformity of all 384 uniquely barcoded magnetic beads. Each black dot represents one barcode, the solid horizontal line indicates the mean Ct value, and the blue dashed lines denote the acceptable quality-control range. The low variance demonstrates the high consistency of barcode synthesis and amplification efficiency. (c) Spatial distribution of captured spots. Spatial ROIs were collected from the ipsilateral hemisphere using LCM. A total of 384 spatial spots were obtained from four experimental groups (32 spots per section × 3 mice per group × 4 groups). Each spot had a radius of approximately 100 μm, corresponding to a localized tissue region for spatial transcriptomic analysis. (d) Sequencing library quality assessment. Representative electropherogram showing the fragment-size distribution of the cDNA library. The average insert size was approximately 330 bp, indicating that the library met the quality requirements for Illumina paired-end sequencing. (e) Quality control of spatial transcriptomic sequencing data. Violin plots show the distributions of the number of detected genes (nFeature_RNA) and total transcript counts (nCount_RNA) across all spatial spots in the Sham, pMCAO, PNS, and PGS groups. Each dot represents one spatial spot.
Analysis and reliability verification of spatial transcriptomic data of Spatial-seq 2.0
-
After normalization, edgeR was used for differential gene analysis and reliability verification of 384 spots. Representative genes for validation were selected from the significantly differentially expressed genes identified by Spatial-seq analysis based on their expression abundance, statistical significance, consistency across biological replicates, and biological relevance to the major enriched pathways associated with ischemic stroke. Key DEGs were subsequently selected according to these criteria. Specifically, Mif, Rac1, and Thy1 were selected as representative genes for validation in the PNS group, whereas Sephs2 and Dad1 were selected for validation in the PGS group.
CCK-8 assay showed that the viability of BV2 cells was more than 90% after being treated with 100 μg·mL−1 PNS or PGS for 24 h, indicating no obvious cytotoxicity (Fig. 3a and b). The dose of 100 μg·mL−1 was selected for subsequent experiments according to the cytotoxicity results and previous studies[13,14]. After 2 h of OGD treatment, the cell viability was about 50%, which was suitable for subsequent experiments (Fig. 3c). qRT-PCR results in BV2 cells, primary neurons, and bEnd.3 cells showed that the expression trends of Mif, Rac1, Thy1, Sephs2, and Dad1 were consistent with the sequencing data (Fig. 3d). These findings further confirmed the reliability and reproducibility of the spatial transcriptomic data. Meanwhile, qRT-PCR verification in mouse penumbra tissues further confirmed the reliability of the transcriptomic data.
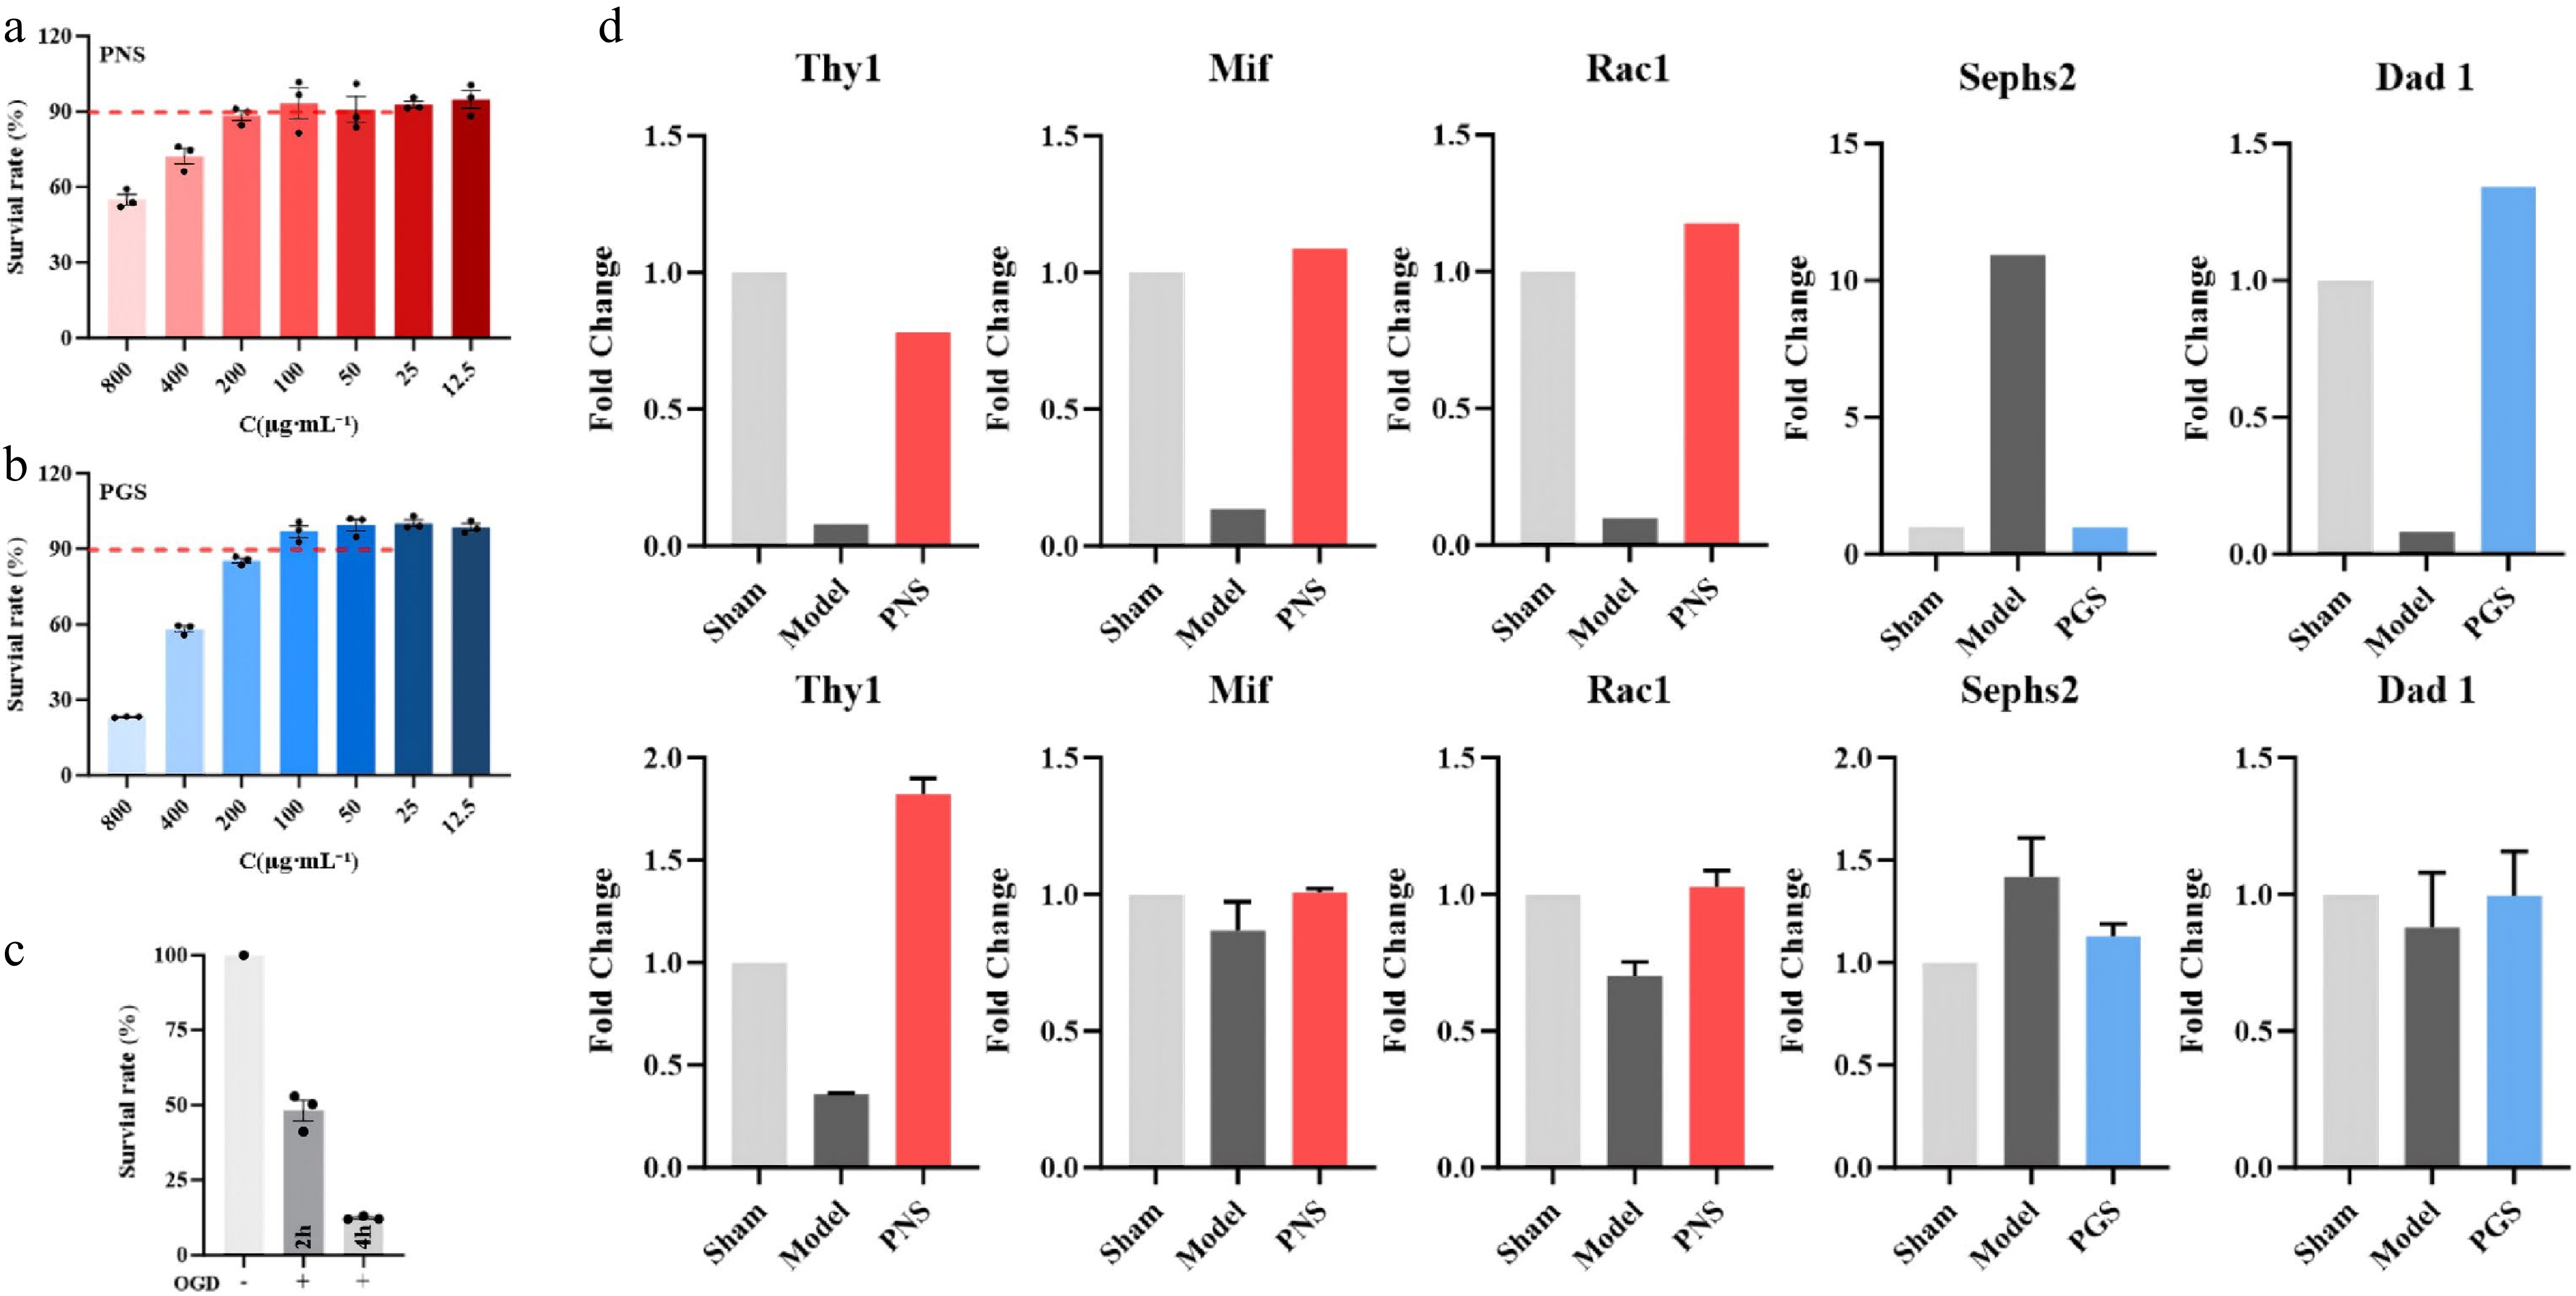
Figure 3.
qRT-PCR validation of Spatial-seq-derived candidate genes. (a) Dose screening of PNS in BV2 cells. The red dashed line indicates the predefined safety threshold for cell viability (> 90%). (b) Dose screening of PGS in BV2 cells. The red dashed line indicates the predefined safety threshold for cell viability (> 90%). (c) Optimization of OGD duration in BV2 cells. (d) qRT-PCR validation of representative differentially expressed genes identified by Spatial-seq. Candidate genes were selected based on differential expression analysis (|log2FC| > 1, adjusted P < 0.05) and biological relevance to cerebral ischemia. Validation was performed in BV2 cells, primary neurons, bEnd.3 cells, and mouse ischemic penumbra tissues. Data are presented as mean ± SD, n = 3. Statistical analyses were performed using one-way ANOVA followed by Tukey's multiple-comparison test. Statistical significance was defined as P < 0.05.
Pathway enrichment analysis of key differential genes (top 25%) of PNS and PGS associated with the stroke penumbra
-
DEGs between the Model and Sham groups were identified at the spot level. The top 25% (8/32) spots with the largest differential change amplitude were defined as key stroke-related spatial regions (Fig. 4a and b). Combined with H&E staining, these eight spots were confirmed to be located in the ischemic penumbra (Fig. 4c). The top 25% threshold was selected to capture the most transcriptionally responsive regions for subsequent analyses.
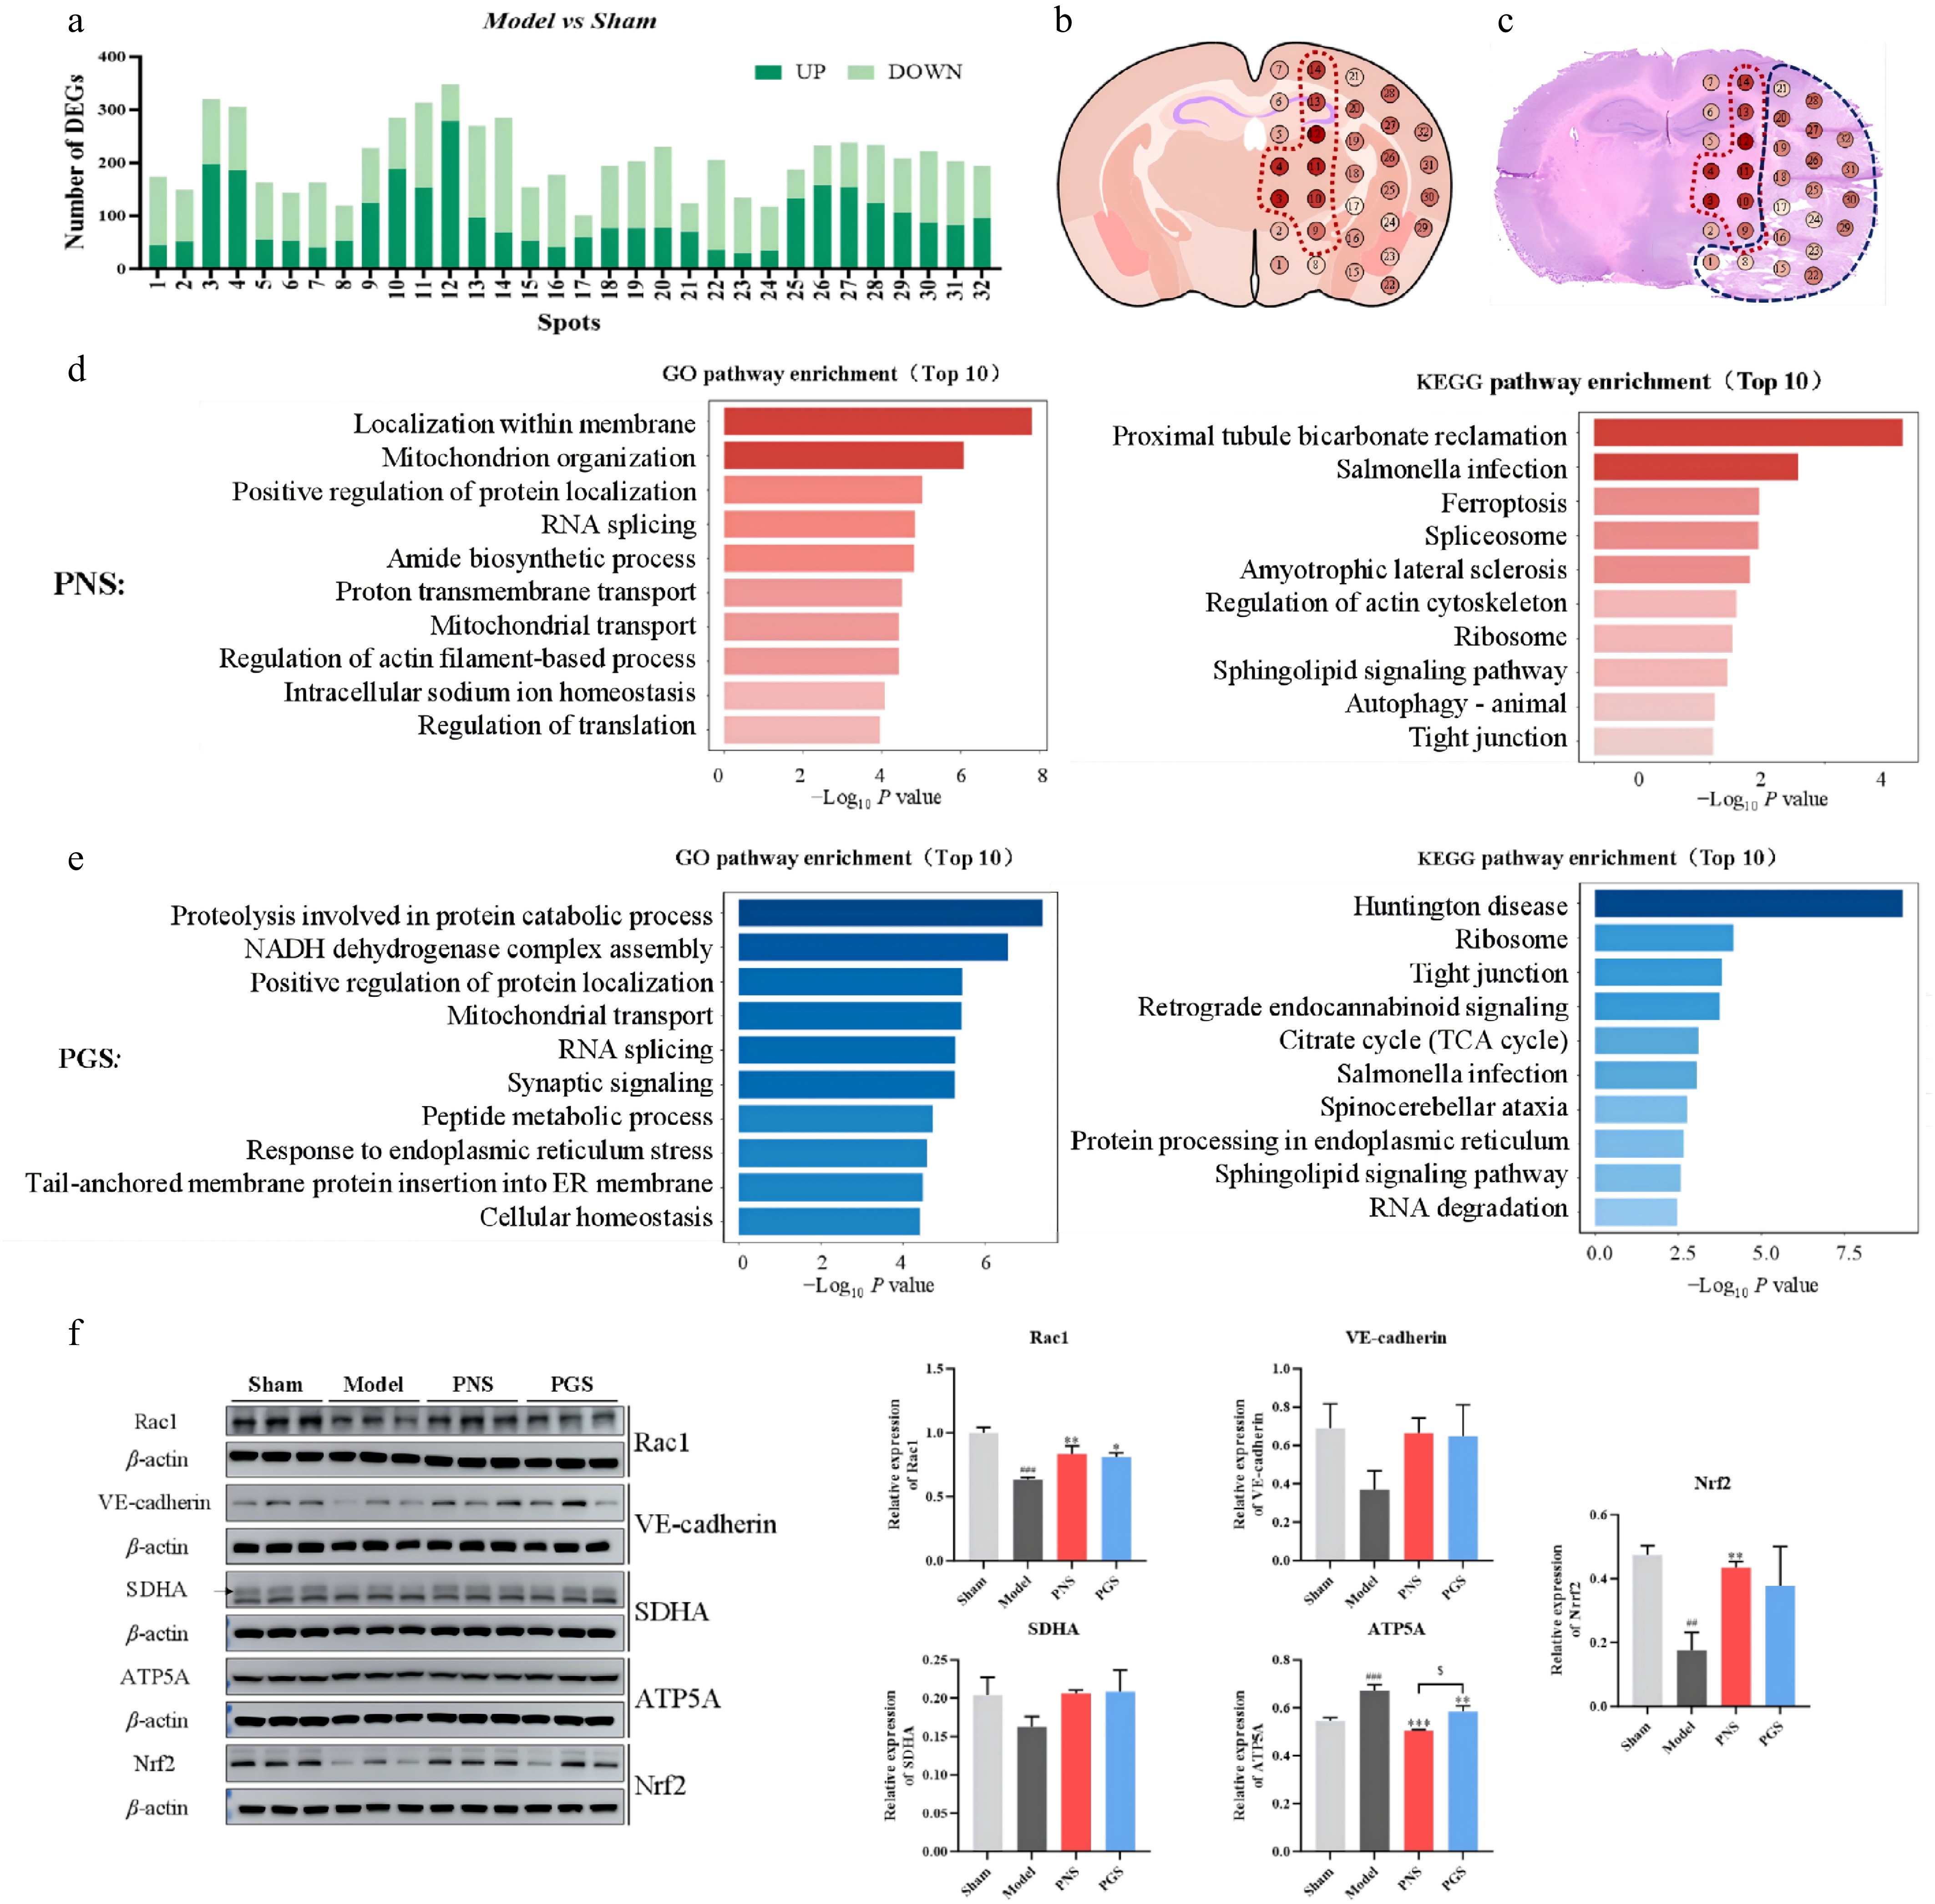
Figure 4.
Spatial identification of ischemic penumbra-associated regions, functional enrichment analysis, and protein-level validation of representative targets. (a) Stacked histogram of the number of DEGs in 32 spatial spots when comparing the Model group with the Sham group. Dark green indicates upregulated genes and light green indicates downregulated genes. (b) Spatial localization of the 32 numbered spatial spots projected onto a coronal mouse brain reference map. Each circle represents an individual Spatial-seq spot and is labeled according to its spot identification number. The light-to-dark red color gradient represents increasing numbers of DEGs per spatial spot, with darker colors indicating higher DEG abundance. The red dotted contour outlines the top 25% of spots (eight of 32) ranked by DEG number, which were selected as key stroke-associated spatial regions for subsequent analyses. (c) Spatial registration of the 32 numbered spatial spots with the corresponding H&E-stained brain section. Spot colors follow the same DEG-count scale shown in (b). The red dotted contour indicates the ischemic penumbra, whereas the blue dotted contour indicates the infarct core. The spatial registration illustrates the anatomical correspondence between the selected high-DEG spatial spots and histopathological regions of ischemic injury. (d) GO biological process (left) and KEGG pathway (right) enrichment analyses of representative DEGs regulated by PNS within the ischemic penumbra. (e) GO biological process (left) and KEGG pathway (right) enrichment analyses of representative DEGs regulated by PGS within the ischemic penumbra. (f) Representative Western blot images (left) and densitometric quantification (right) of Rac1, VE-cadherin, SDHA, ATP5A, and Nrf2 protein expression in ipsilateral ischemic penumbra tissue collected 24 h after pMCAO. Actin served as the loading control, and protein expression levels were normalized to Actin. Each lane represents one biologically independent sample. Bars represent the Sham (light gray), Model (dark gray), PNS (red), and PGS (blue) groups. Data are presented as mean ± SEM, n = 3. Statistical analyses were performed using one-way ANOVA followed by Dunnett's multiple-comparisons test. # P < 0.05; ## P < 0.01; ### P < 0.001 vs the Sham group; * P < 0.05, ** P < 0.01; *** P < 0.001 vs the model group; ${}^{\$} $ P < 0.05 indicates comparisons between the PNS and PGS groups.
GO/KEGG enrichment analysis was performed on all DEGs (|log2FC| > 1, adjusted P < 0.05) in the penumbra. Both PNS and PGS regulated biological processes related to mitochondrial transport, protein localization, and tight junction organization (Fig. 4d and e). In addition, PNS preferentially regulated pathways associated with actin filament-based processes and actin cytoskeleton organization (Fig. 4d), whereas PGS mainly affected pathways involved in the tricarboxylic acid (TCA) cycle and NADH dehydrogenase complex assembly (Fig. 4e). These distinct pathway preferences suggest that PNS and PGS exert neuroprotective effects through partially overlapping yet different molecular mechanisms. Notably, the preferential regulation of cytoskeletal remodeling by PNS and mitochondrial energy metabolism by PGS is consistent with the traditional pharmacological characteristics attributed to 'activating blood' and 'replenishing qi' in TCM, respectively. Rather than serving as direct proof of these traditional concepts, these findings provide a modern molecular perspective that may help explain their biological basis. At the same time, the results were consistent with the results of the earlier comparative study on the influence of PG and PN on the transcriptome disturbance of cells in various tissues conducted by self-developed TCM-seq technology[34]. These analyses revealed the potential value of two TCM materials in modern medical research and provided a scientific basis for further research and application.
To experimentally validate the pathway enrichment results obtained from Spatial-seq analysis, representative proteins involved in the major biological processes were further examined by Western blot (Fig. 4f). Consistent with the transcriptomic findings, PNS markedly increased the expression of Rac1 and VE-cadherin compared with the model group, indicating enhanced actin cytoskeleton remodeling and vascular endothelial repair. In contrast, PGS exhibited a relatively stronger regulatory effect on the mitochondrial metabolism-associated proteins SDHA and ATP5A, supporting its preferential involvement in mitochondrial energy metabolism and the TCA cycle. Furthermore, both PNS and PGS significantly upregulated Nrf2 protein expression, suggesting that attenuation of oxidative stress represents a shared neuroprotective mechanism. Overall, these representative protein-level validation results were in good agreement with the Spatial-seq enrichment analysis, providing direct experimental evidence supporting the distinct yet complementary molecular mechanisms of PNS and PGS in the ischemic penumbra.
Calculation and screening of key spatial regions of PNS and PGS and their effects on different brain regions
-
We employed the NRIODN to quantitatively assess the effects of PNS and PGS on the disease network of ischemic stroke across distinct spatial brain regions. By accounting for the influences of node topological properties and callback efficiency on recovery magnitude, we computed the quantitative indices reflecting the regulatory impacts of PNS and PGS on gene expression within each spatial region (Fig. 5a). Regions ranking in the top 40% of the overall NRIODN distribution were defined as drug-responsive key callback regions, with 12 such regions identified in the PNS group and 10 in the PGS group.
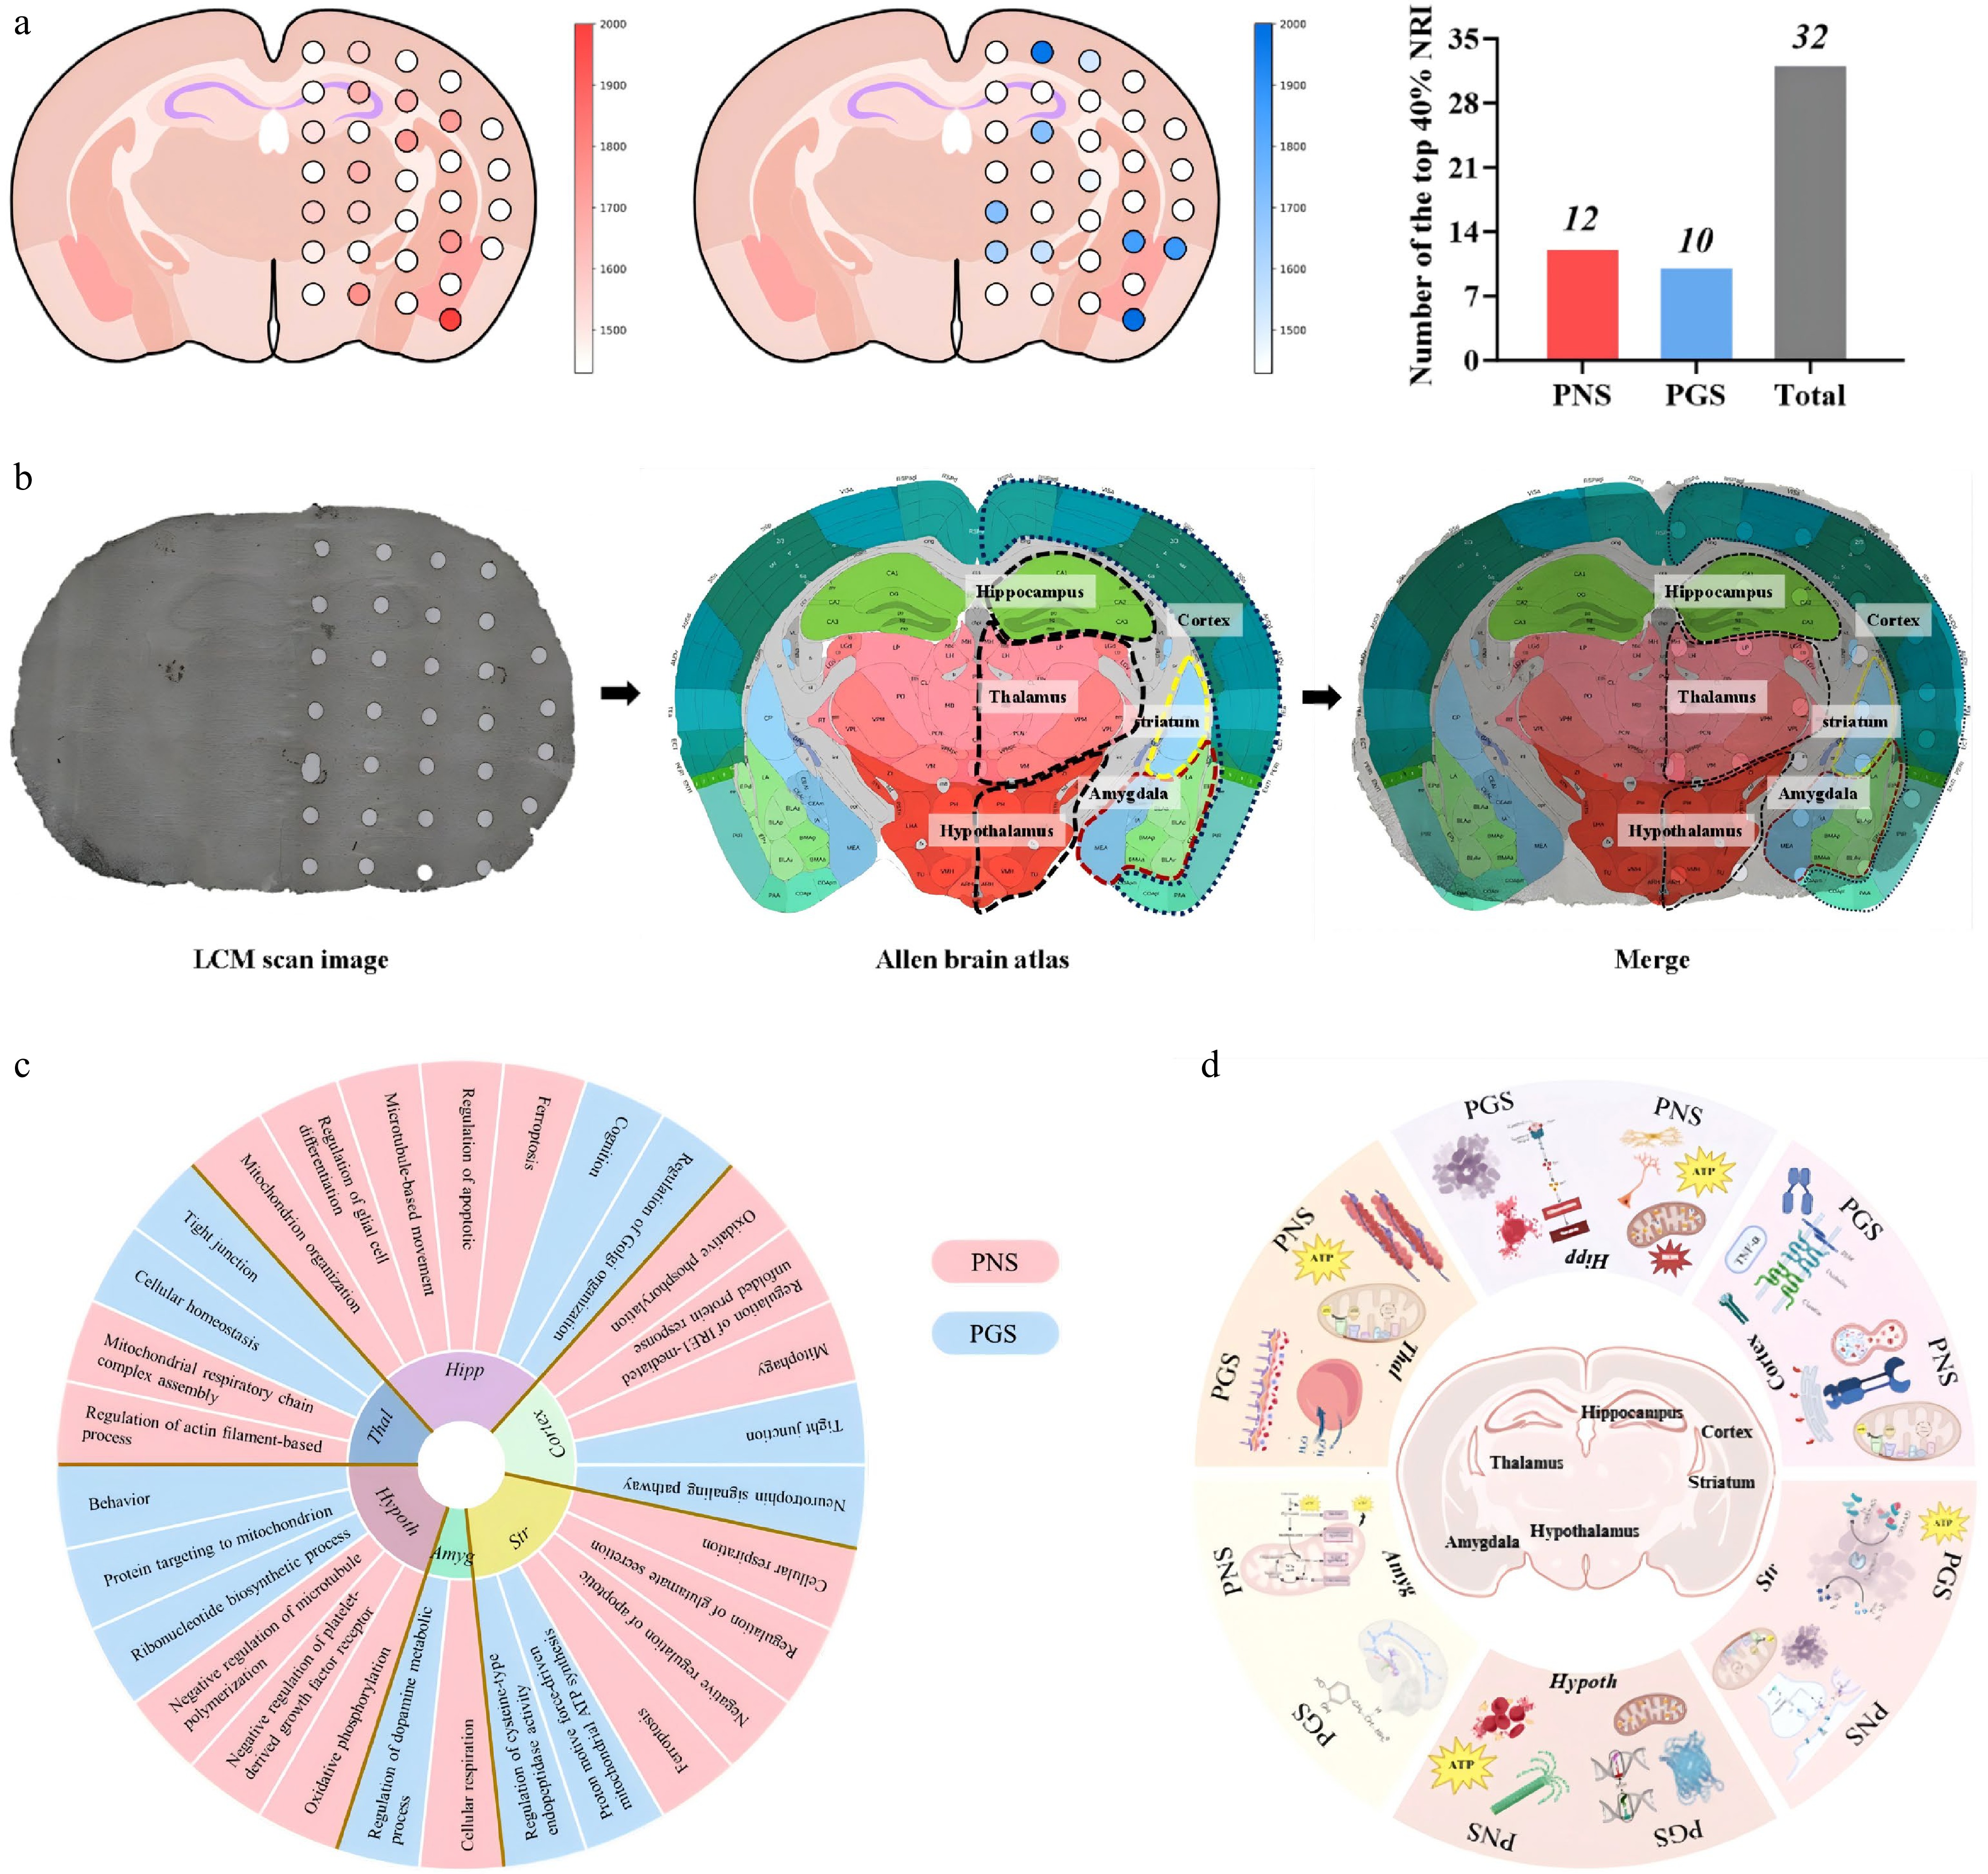
Figure 5.
Identification of key spatial regions regulated by PNS and PGS and their region-specific functional characterization. (a) Identification of key spatial regions regulated by PNS and PGS using the NRIODN algorithm. Spatial spots are projected onto a coronal mouse brain map. The red color gradient indicates increasing NRIODN scores for PNS-regulated spots, whereas the blue color gradient indicates increasing NRIODN scores for PGS-regulated spots. Darker colors represent greater regional intervention potential. The bar graph summarizes the numbers of key spatial regions identified for each treatment. (b) Registration of Spatial-seq spots to the Allen Mouse Brain Atlas. Left, representative tissue section with the corresponding spatial spot distribution. Middle, anatomical annotation generated from the Allen Brain Atlas reference. Right, overlay of the histological section with the annotated brain atlas after spatial registration. Colored contours delineate major anatomical regions, including the hippocampus, cortex, striatum, thalamus, hypothalamus, and amygdala, which were used for region-specific downstream analyses. (c) GO biological process enrichment analysis of representative marker genes identified in different brain regions. Functional enrichment analysis was performed using Metascape based on a hypergeometric test with Benjamini–Hochberg multiple-testing correction. Only enriched terms with adjusted P < 0.05 were retained. The circular heatmap summarizes representative biological processes enriched in each anatomical region. Pink sectors indicate PNS-associated enrichment, whereas light blue sectors indicate PGS-associated enrichment. (d) Schematic summary of the region-specific biological processes regulated by PNS and PGS across different brain regions. The central diagram illustrates the anatomical distribution of the analyzed regions, whereas the surrounding panels summarize representative biological functions and signaling pathways identified by enrichment analysis.
To precisely resolve spatial heterogeneity, we used the QuickNII tool to register LCM images to the Allen Brain Atlas, the standard reference template for the mouse brain (Fig. 5b). Using this atlas, all spatial spots were annotated into six major brain regions: cerebral cortex, hippocampus, striatum, hypothalamus, thalamus, and amygdaloid nucleus. On a single section, these regions comprised five, eight, three, three, four, and nine spatial subregions, respectively.
Pathway enrichment analyses across the six brain regions enabled us to identify key metabolic pathways closely associated with cerebral ischemic injury (Fig. 5c). We then systematically characterized the region-specific effects of PNS and PGS, with a schematic summary of pathway enrichment patterns presented in Fig. 5d. Detailed mechanisms of action in each brain region are provided in the Supplementary Materials. The detailed NRI profiles for PNS and PGS are shown in Supplementary Figs S1 and S2, respectively, and the complete ranking of the NRI values is provided in Supplementary Table S1. Detailed region-specific interpretations are provided in Supplementary Text S1. The corresponding GO-BP and KEGG enrichment results are presented sequentially in Supplementary Tables S2–S5 for the hypothalamus, Supplementary Tables S6−S9 for the thalamus, Supplementary Tables S10−S13 for the hippocampus, Supplementary Tables S14−S17 for the cerebral cortex, Supplementary Tables S18−S21 for the striatum, and Supplementary Tables S22−S25 for the amygdaloid nucleus.
-
In this study, we employed the optimized spatial transcriptomics technique Spatial-seq 2.0 to systematically investigate and compare the differential effects and molecular mechanisms of PNS and PGS in acute ischemic stroke. Integrating spatial heterogeneity of the ischemic penumbra, functional specificity of multiple brain regions, and the TCM concepts of 'activating blood' and 'replenishing qi', we discuss the results comprehensively as follows.
After ischemic stroke, gene expression within the ischemic penumbra undergoes highly dynamic remodeling, making this region a critical spatial domain determining neuronal survival, apoptosis, and repair[35−37]. Our spot-level differential gene analysis revealed that gene clusters with the most significant expression changes were precisely colocalized with the ischemic penumbra, indicating the existence of druggable transcriptional programs that could serve as potential therapeutic targets in the acute phase of stroke. Functional enrichment analysis demonstrated that both PNS and PGS have their own unique neuroprotective mechanisms. PNS preferentially regulated actin filament-related processes and actin cytoskeleton organization, implying enhanced vascular remodeling, endothelial repair, and restoration of cerebral microcirculation after ischemic injury. These observations provide molecular evidence to support the TCM concept of PNS 'activating blood' from the perspective of vascular remodeling. In contrast, PGS predominantly enriched pathways associated with the TCA cycle and NADH dehydrogenase complex assembly, indicating a greater capacity to promote mitochondrial oxidative metabolism and cellular energy production. Given that maintenance of cellular energy metabolism is considered the biological basis of tissue functional recovery after ischemia, these findings provide mechanistic support for the TCM concept that PGS predominantly exerts a 'replenishing qi' effect. These differential transcriptomic signatures may therefore represent distinct biological strategies for neuroprotection within the ischemic penumbra.
To further validate these spatial transcriptomic findings, representative proteins involved in cytoskeletal remodeling, vascular integrity, mitochondrial metabolism, and antioxidant defense were examined by Western blot. The protein expression patterns were largely consistent with the transcriptomic results. Specifically, PNS more effectively restored the expression of Rac1 and VE-cadherin, further supporting its predominant role in regulating cytoskeletal dynamics and vascular endothelial repair. Conversely, PGS induced greater recovery of the mitochondrial metabolic proteins SDHA and ATP5A, reinforcing the transcriptomic prediction that PGS preferentially enhances mitochondrial energy metabolism and oxidative phosphorylation. In addition, both treatments markedly increased Nrf2 expression, indicating that attenuation of oxidative stress constitutes a common neuroprotective mechanism shared by PNS and PGS.
Interestingly, ATP5A expression was increased in the ischemic model compared with the Sham group. Rather than indicating improved mitochondrial function, this increase likely reflects a compensatory response to severe ATP depletion during the acute phase of ischemic injury. Despite this adaptive upregulation, mitochondrial oxidative phosphorylation remains inefficient because of electron transport chain dysfunction and oxidative stress. PGS partially normalized this compensatory response while improving mitochondrial metabolic pathways identified by Spatial-seq, suggesting enhanced mitochondrial efficiency rather than simple overexpression of ATP synthase components. In contrast, PNS showed relatively limited regulation of ATP5A, supporting its predominant action on vascular remodeling and cytoskeletal organization.
The distinct molecular responses induced by PNS and PGS may not only reflect differences in their biological targets but may also be associated with their intrinsic chemical compositions. Although comprehensive phytochemical profiling was beyond the scope of the present study, previous studies have shown that PNS is enriched in notoginsenoside R1 together with ginsenosides Rg1, Rb1, Re, and Rd, whereas PGS mainly contains ginsenosides Rb1, Rg1, Re, Rc, and Rb2 with little or no notoginsenoside R1[38−40]. Such compositional differences may contribute to their preferential regulation of vascular remodeling and mitochondrial energy metabolism, respectively. Collectively, these findings suggest that the distinct spatial transcriptomic signatures of PNS and PGS in the ischemic penumbra may, at least in part, represent the modern biological basis underlying the TCM concepts of 'activating blood' and 'replenishing qi', respectively. Their complementary regulatory effects provide mechanistic support for the therapeutic rationale of the 'activating blood and replenishing qi' strategy in ischemic stroke, although further mechanistic studies are required to establish direct causal relationships. Collectively, the distinct yet complementary neuroprotective mechanisms of PNS and PGS, corresponding to the TCM concepts of 'activating blood' and 'replenishing qi', respectively, are schematically summarized in Fig. 6.
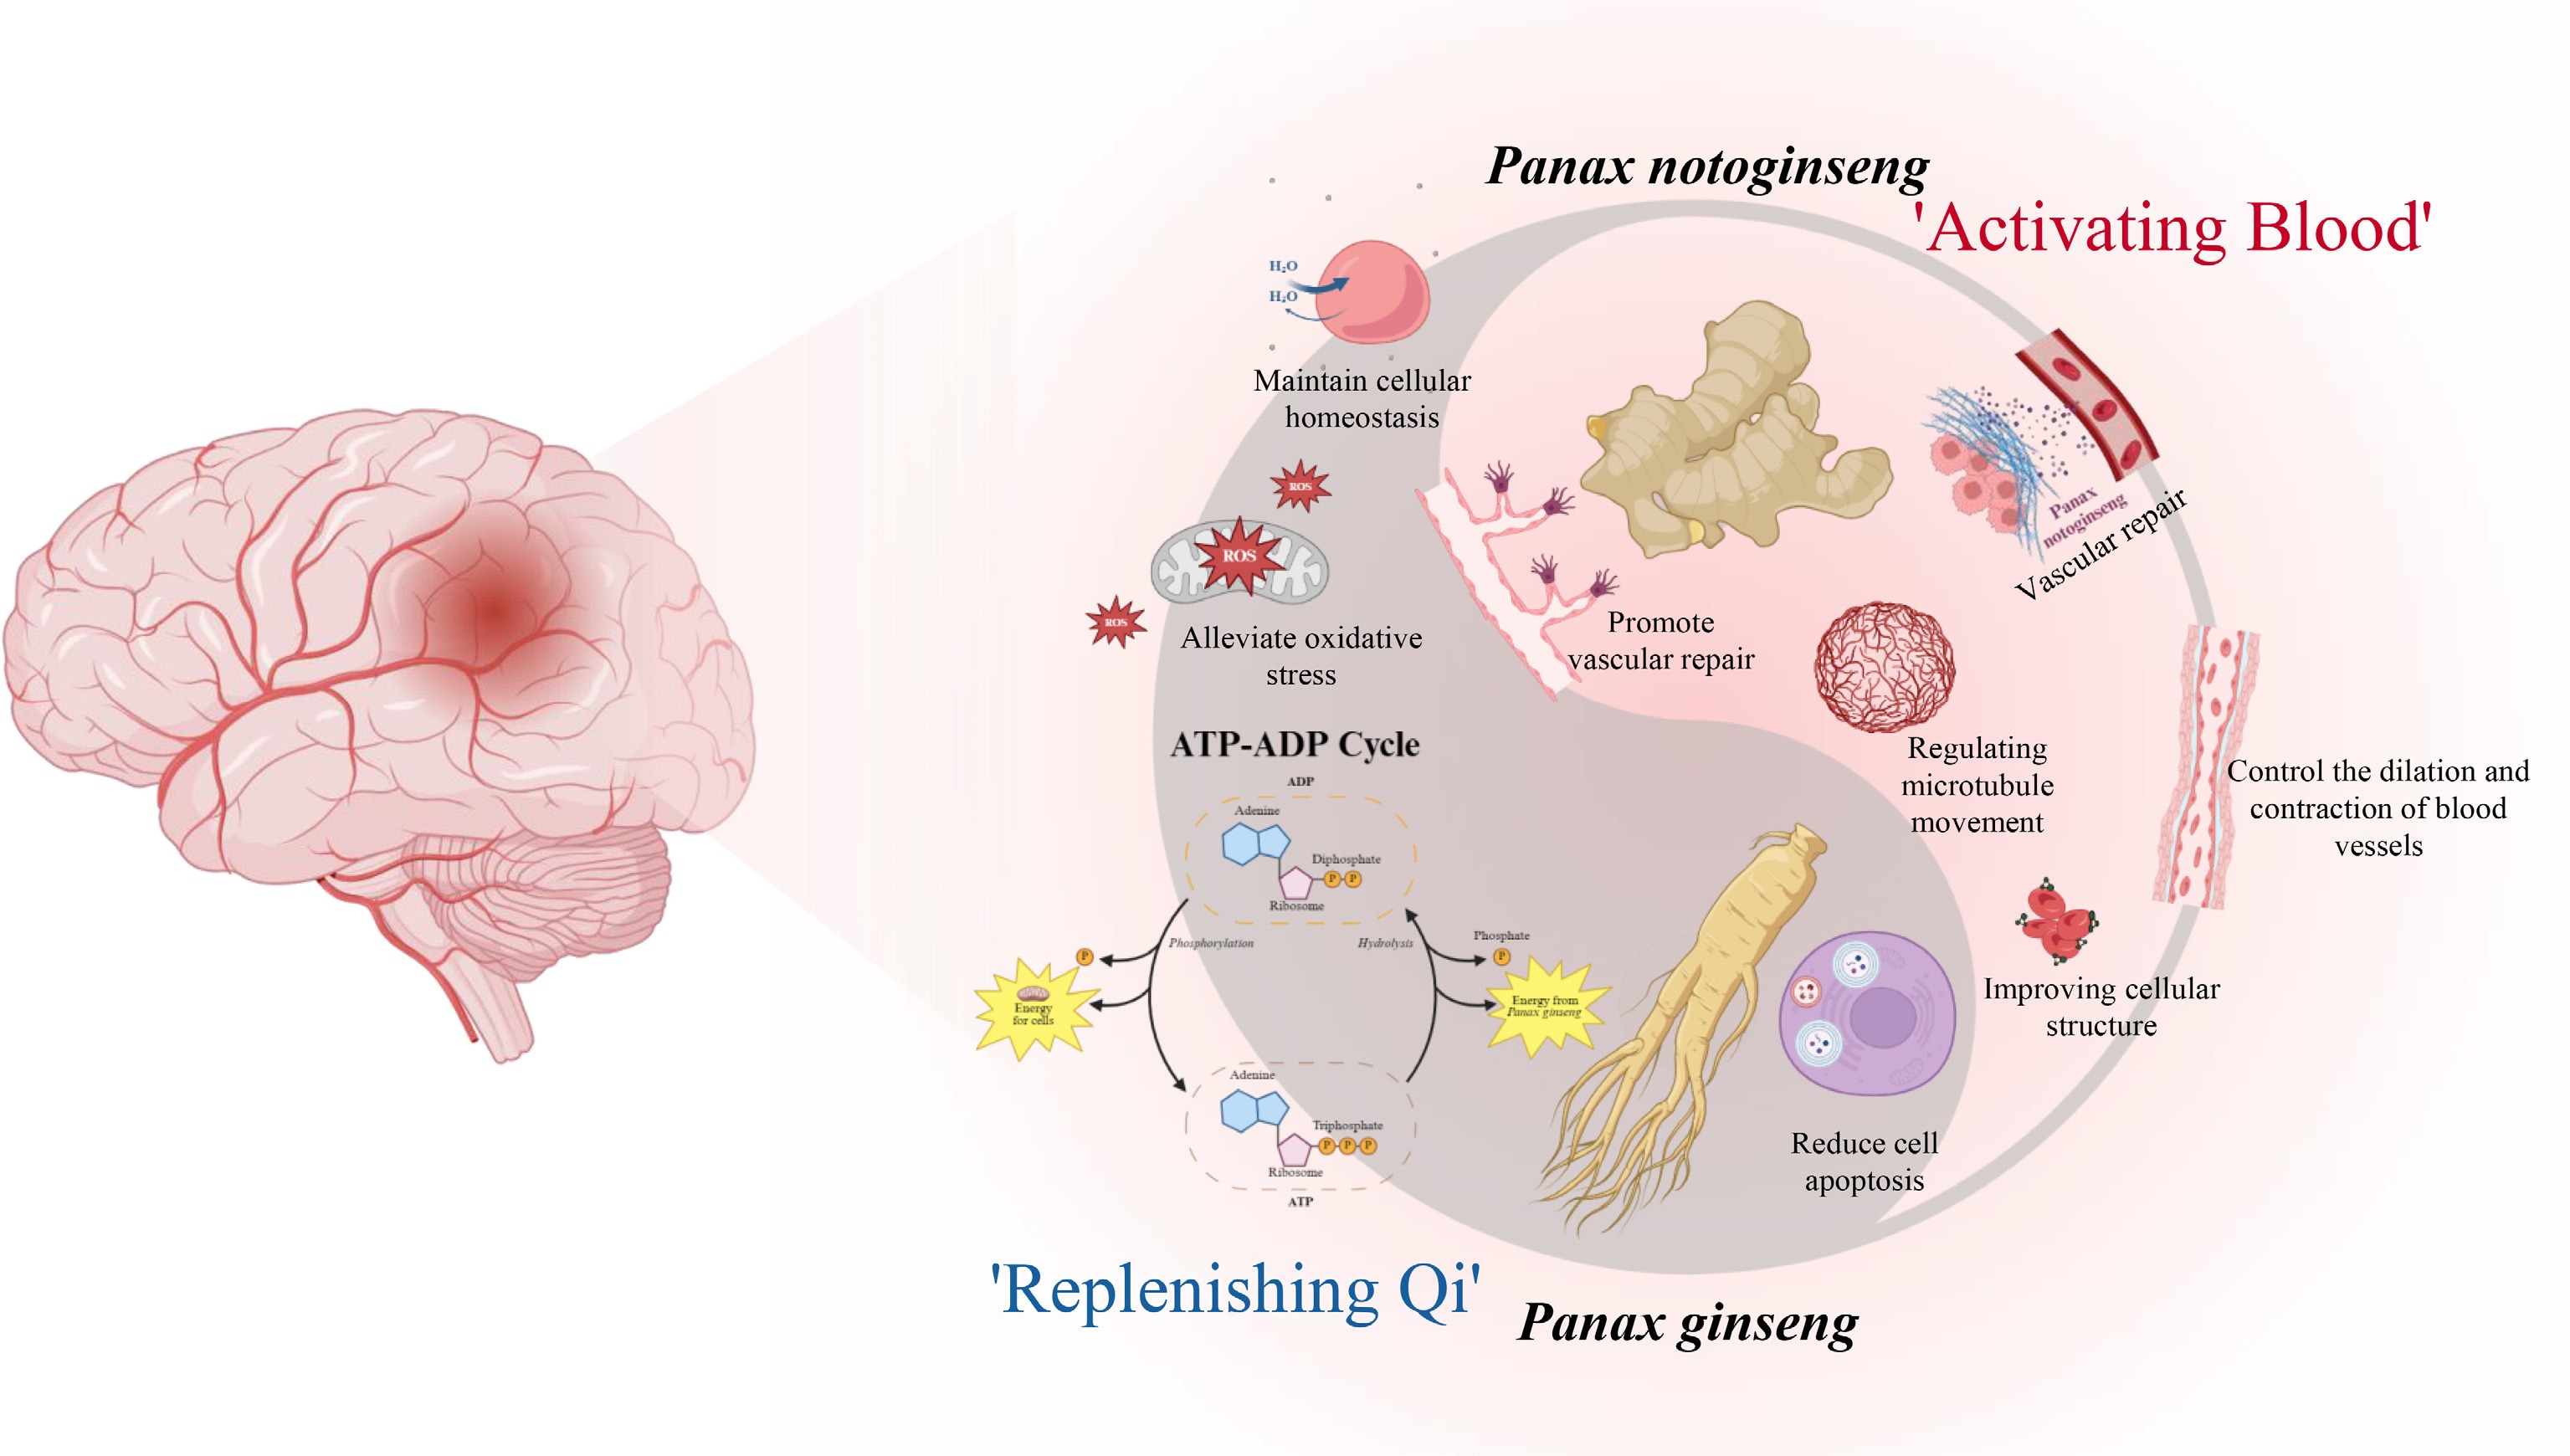
Figure 6.
Schematic summary of the distinct yet complementary neuroprotective mechanisms of PNS and PGS in acute ischemic stroke. PNS preferentially promotes vascular repair, cytoskeletal remodeling, and vascular homeostasis, consistent with the TCM concept of 'activating blood'. In contrast, PGS predominantly enhances mitochondrial energy metabolism, ATP production, and cellular recovery, consistent with the TCM concept of 'replenishing qi'. Both treatments contribute to the attenuation of oxidative stress and apoptosis.
Brain regions exhibit pronounced heterogeneity in their susceptibility to ischemic injury, physiological functions, and endogenous repair programs following stroke[41−43]. By integrating spatial clustering with cell-type deconvolution, the study found that PNS and PGS elicited distinct region-specific transcriptional responses across the hypothalamus, thalamus, hippocampus, cerebral cortex, striatum, and amygdala, consistent with their different pharmacological characteristics. In the hypothalamus, PNS preferentially enhanced oxidative phosphorylation and suppressed inflammatory responses, whereas PGS was more closely associated with nucleic acid repair and mitochondrial protein targeting. In the thalamus, PNS mainly preserved cellular structural integrity and metabolic homeostasis, while PGS preferentially maintained tissue barrier function and cellular homeostasis. Within the hippocampus, PNS was associated with anti-apoptotic and mitochondrial protective pathways, whereas PGS showed stronger enrichment of pathways related to cognitive function. In the cerebral cortex, PNS promoted mitochondrial energy production and alleviated endoplasmic reticulum stress, while PGS enhanced blood-brain barrier maintenance and neurotrophic signaling. In the striatum, PNS preferentially attenuated excitotoxicity and ferroptosis, whereas PGS improved mitochondrial energy efficiency and regulated apoptosis-related enzymatic activity. In the amygdala, PNS mainly stabilized energy metabolism to support neuronal homeostasis, whereas PGS preferentially modulated dopamine-related pathways associated with emotional regulation. Collectively, these findings suggest that PNS preferentially regulates vascular remodeling, cytoskeletal organization, energy metabolism, and cell death-related pathways, whereas PGS exerts stronger effects on mitochondrial bioenergetics, macromolecular biosynthesis, blood-brain barrier maintenance, and cognitive or emotional regulation, indicating complementary therapeutic profiles across different functional brain regions.
Spatial cell deconvolution and cell-cell communication analyses further revealed distinct cellular targets for the two treatments. PNS predominantly influenced vascular endothelial cells and neurons, strengthening endothelial-neuronal interactions that may facilitate cerebral perfusion, vascular remodeling, and neuronal survival. In contrast, PGS primarily regulated astrocytes and neurons, enhancing astrocyte-neuronal communication to support metabolic homeostasis, tissue repair, and functional recovery. These observations provide a potential cellular basis for the differential therapeutic characteristics of the two preparations. Specifically, PNS appears to preferentially act through the vascular-neuronal unit to promote early vascular restoration following ischemia, whereas PGS exerts broader effects on the glial-neuronal unit to sustain metabolic support and neural repair. These distinct cellular regulatory patterns are broadly consistent with the traditional therapeutic concepts of 'activating blood' and 'replenishing qi', respectively.
Compared with previous studies, the present work provides several noteworthy advances. First, by applying high-resolution spatial transcriptomics, we characterized the spatially resolved molecular responses to PNS and PGS across the ischemic core, penumbra, and anatomically distant functional regions, thereby revealing the regional heterogeneity of therapeutic responses that cannot be captured by conventional bulk transcriptomic approaches. Second, under the same experimental conditions, we systematically compared the pharmacological effects of PNS and PGS in an ischemic stroke model and demonstrated that, although both treatments conferred neuroprotection, PNS showed greater efficacy in vascular remodeling and acute tissue protection, whereas PGS more prominently regulated mitochondrial energy metabolism and pathways related to cognitive recovery. Third, by integrating spatial transcriptomics with pharmacological analyses, this study provides spatial molecular evidence that is compatible with the traditional concepts of 'activating blood' and 'replenishing qi', offering a modern biological perspective for understanding their differential therapeutic actions. Finally, our findings suggest that these two standardized saponin preparations may have complementary therapeutic potential during different stages of ischemic stroke, with PNS being more applicable to the acute phase characterized by perfusion impairment and PGS potentially contributing to metabolic recovery and neurological rehabilitation during later stages.
Several limitations of this study should be acknowledged. First, the present study focused on the acute phase of ischemic stroke (24 h after pMCAO), during which transcriptional remodeling within the ischemic penumbra is particularly active and represents a critical therapeutic window for early neuroprotection. This time point was therefore selected to characterize the early spatial molecular responses to PNS and PGS. Nevertheless, ischemic injury and tissue repair are highly dynamic processes, and the spatial transcriptomic landscape may differ substantially across the acute, subacute, and chronic stages. Accordingly, the use of a single post-ischemic time point represents an important limitation of the present study. Future studies incorporating multiple post-ischemic time points will be required to systematically characterize the spatiotemporal evolution of gene expression and to further elucidate the stage-specific neuroprotective mechanisms of PNS and PGS during stroke progression. Second, the present work was primarily based on spatial transcriptomic profiling. Integration with complementary multi-omics approaches, such as spatial proteomics and spatial metabolomics, will provide a more comprehensive understanding of the molecular mechanisms underlying the neuroprotective effects of PNS and PGS. In addition, although both PNS and PGS used in this study were standardized commercial preparations with well-defined quality specifications and batch consistency, comprehensive chemical characterization, such as HPLC or LC-MS profiling of their individual saponin constituents, was not performed. Such analyses would facilitate a more precise interpretation of the relationship between chemical composition and pharmacological activity and therefore represent an important direction for future studies integrating chemical characterization with spatial multi-omics analyses. Although only three biologically independent mice were included in each group for spatial transcriptomic analysis, this sample size is commonly adopted in exploratory spatial transcriptomic studies because of the substantial technical complexity, high sequencing cost, and demanding tissue preparation procedures associated with these experiments. Importantly, biological replication was defined at the animal level rather than the spatial spot level, thereby avoiding pseudoreplication during statistical inference. Moreover, the key findings derived from spatial transcriptomic analysis were independently validated at both the mRNA and protein levels by qRT-PCR and Western blotting, respectively, and were further supported by consistent histopathological observations, thereby strengthening the robustness and reliability of our conclusions. Finally, additional in vitro and in vivo functional studies, including pathway inhibition, gene knockdown/overexpression, and pharmacological intervention experiments, are warranted to verify the causal roles of the identified key genes and signaling pathways and to further elucidate the underlying molecular mechanisms.
-
In conclusion, using the high-resolution spatial transcriptomics platform Spatial-seq 2.0, we systematically characterized the commonality and distinct molecular responses to PNS and PGS in acute ischemic stroke. Both treatments significantly improved neurological function, reduced cerebral infarct volume, and alleviated neuronal apoptosis, while exhibiting distinct spatially resolved regulatory patterns. PNS preferentially regulated pathways related to actin cytoskeleton dynamics, vascular function, and endothelial–neuronal interactions, which are consistent with its TCM characteristic of 'activating blood'. In contrast, PGS predominantly modulated mitochondrial energy metabolism, the TCA cycle, glial support, and cognitive- and emotion-related pathways, consistent with its proposed 'replenishing qi' property. These complementary therapeutic characteristics were consistently observed across the ischemic penumbra, multiple functional brain regions, and distinct cellular communication networks. Collectively, our findings provide a spatial molecular framework that is compatible with the traditional concepts of 'activating blood' and 'replenishing qi', respectively, and offer new mechanistic insights into the complementary therapeutic rationale of the 'activating blood and replenishing qi' strategy for ischemic stroke. More broadly, this study highlights the potential of spatial transcriptomics to elucidate region-specific pharmacological mechanisms of TCM and to facilitate the development of precision therapeutic strategies for ischemic stroke.
-
All animal experiments were conducted in accordance with the Regulations for the Administration of Affairs Concerning Experimental Animals, the Guidelines on the Treatment of Experimental Animals, and the Administrative Measures of Experimental Animals in Zhejiang Province, and in compliance with the institutional guidelines for the care and use of laboratory animals. The experimental protocol was reviewed and approved by the Zhejiang University Laboratory Animal Welfare and Ethics Review Committee (Approval No. ZJU-20260404). All procedures involving experimental animals were performed by trained personnel, with appropriate anesthesia and animal welfare measures implemented throughout the experiments.
-
The authors confirm their contributions to the work as follows: conceptualization: Cui G, Fan X; methodology: Chen R; investigation: Hu Y; formal analysis: Zhao Q; validation, software: Bao H, Xu S, Qian S; visualization: GuoW; supervision, project administration, funding acquisition: Liao J, Fan X; writing - original draft preparation: Cui G; writing - reviewing and editing: Chen R, Guo W; Supervision: Fan X. All authors reviewed the results and approved the final version of the manuscript.
-
The datasets generated and/or analyzed during the current study are available from the corresponding author on reasonable request.
-
The author declares that there are no conflicts of interest.
-
accompanies this paper online at: https://doi.org/10.48130/targetome-0026-0038.
-
#Authors contributed equally: Guoqian Cui, Renjie Chen
- Supplementary Table S1 NRI based callback key spatial region of PNS and PGS. After administration of PGS, the regression risk index (NRI) of 32 disease-related genes at different locations is calculated.
- Supplementary Table S2 GO-BP pathways involved in the reversal of key genes by PNS in the hypothalamic region.
- Supplementary Table S3 KEGG pathways involved in the reversal of key genes by PNS in the hypothalamic region.
- Supplementary Table S4 GO-BP pathways involved in the reversal of key genes by PGS in the hypothalamic region.
- Supplementary Table S5 KEGG pathways involved in the reversal of key genes by PGS in the hypothalamic region.
- Supplementary Table S6 GO-BP pathways involved in the reversal of key genes by PNS in the thalamic region.
- Supplementary Table S7 KEGG pathways involved in the reversal of key genes by PNS in the thalamic region.
- Supplementary Table S8 GO-BP pathways involved in the reversal of key genes by PGS in the thalamic region.
- Supplementary Table S9 KEGG pathways involved in the reversal of key genes by PGS in the thalamic region.
- Supplementary Table S10 GO-BP pathways involved in the reversal of key genes by PNS in the hippocampal region.
- Supplementary Table S11 KEGG pathways involved in the reversal of key genes by PNS in the hippocampal region.
- Supplementary Table S12 GO-BP pathways involved in the reversal of key genes by PGS in the hippocampal region.
- Supplementary Table S13 KEGG pathways involved in the reversal of key genes by PGSin the hippocampal region.
- Supplementary Table S14 GO-BP pathways involved in the reversal of key genes by PNS in the cortical region.
- Supplementary Table S15 KEGG pathways involved in the reversal of key genes by PNS in the cortical region.
- Supplementary Table S16 GO-BP pathways involved in the reversal of key genes byPGS in the cortical region.
- Supplementary Table S17 KEGG pathways involved in the reversal of key genes by PGS in the cortical region.
- Supplementary Table S18 GO-BP pathways involved in the reversal of key genes by PNS in the striatal region.
- Supplementary Table S19 KEGG pathways involved in the reversal of key genes by PNS in the striatal region.
- Supplementary Table S20 GO-BP pathways involved in the reversal of key genes by PGS in the striatal region.
- Supplementary Table S21 KEGG pathways involved in the reversal of key genes by PGS in the striatal region.
- Supplementary Table S22 GO-BP pathways involved in the reversal of key genes by PNS in the amygdala region.
- Supplementary Table S23 KEGG pathways involved in the reversal of key genes by PNS in the amygdala region.
- Supplementary Table S24 GO-BP pathways involved in the reversal of key genes by PGS in the amygdala region.
- Supplementary Table S25 KEGG pathways involved in the reversal of key genes by PGS in the amygdala region.
- Supplementary Text S1 Detailed analysis of the effects of PNS and PGS on key metabolic pathways in six brain regions.
- Supplementary Fig. S1 The intersection of database genes and differential genes is constructed to build a disease-related gene network. After administration of PNS, the regression risk index (NRI) of 32 disease-related genes at different locations is calculated.
- Supplementary Fig. S2 The intersection of database genes and differential genes is constructed to build a disease-related gene network. After administration of PGS, the regression risk index (NRI) of 32 disease-related genes at different locations is calculated.
- Copyright: © 2026 by the author(s). Published by Maximum Academic Press on behalf of China Pharmaceutical University. This article is an open access article distributed under Creative Commons Attribution License (CC BY 4.0), visit https://creativecommons.org/licenses/by/4.0/.
-
About this article
Cite this article
Cui G, Chen R, Hu Y, Zhao Q, Bao H, et al. 2026. Comparing the spatial transcriptomic difference of the protective effect between Panax notoginseng and Panax ginseng against acute stroke with Spatial-seq 2.0. Targetome 2(4): e041 doi: 10.48130/targetome-0026-0038 

Comparing the spatial transcriptomic difference of the protective effect between Panax notoginseng and Panax ginseng against acute stroke with Spatial-seq 2.0
- Received: 17 April 2026
- Revised: 02 August 2026
- Accepted: 04 August 2026
- Published online: 25 August 2026
Abstract: This study investigates the therapeutic effects of Panax notoginseng saponins (PNS) and Panax ginseng saponins (PGS) on acute ischemic stroke using an optimized spatial transcriptomics technology, Spatial-seq 2.0. The aim is to provide spatial insights into their functional differences and mechanisms. A permanent middle cerebral artery occlusion (pMCAO) model was established in C57BL/6 mice. Animals were treated with low and high doses of PNS and PGS. Neurological scores, infarct volumes, survival rates, and histological alterations were analyzed. Spatial-seq 2.0 was utilized to capture the transcriptomic profiles of brain regions, focusing on the ischemic penumbra. Differentially expressed genes were validated using qRT-PCR, and GO/KEGG enrichment analysis was conducted. Both PNS and PGS significantly reduced infarct volume, improved neurological function, and attenuated neuronal apoptosis following acute ischemic stroke injury. Spatial transcriptomic analysis identified both shared and distinct molecular responses, with PNS preferentially regulating actin cytoskeleton-related pathways, consistent with its traditional Chinese medicine (TCM) function of 'activating blood', whereas PGS mainly modulated mitochondrial energy metabolism, which is in line with its 'replenishing qi' property. These transcriptomic findings were further supported by Western blot analysis. Collectively, our findings provide molecular evidence that may help explain the pharmacological characteristics of PNS and PGS and offer new insights into the scientific basis of the TCM strategy of 'replenishing qi and activating blood' for ischemic stroke. PNS and PGS exhibit differential yet complementary effects in stroke therapy, consistent with their traditional medicinal roles. The spatially resolved transcriptomics approach provided novel insights into their mechanisms, underscoring the potential of Spatial-seq for TCM research.