


-
Biodiversity has attracted worldwide attention owing to the frequent reports of a positive influence on ecosystem functioning[1−3]. Until now, advances on this topic have been obtained mainly from studies on macroorganisms with low biodiversity (e.g., plants). Due to functional redundancy, increased competition intensity, or differences in activity levels, whether the positive biodiversity–ecosystem functioning (BEF) relationship still holds in soil microbial communities is not well understood[2]. This is a significant knowledge gap, considering that soil microbes represent the highest biodiversity in terrestrial ecosystems, with an estimated 102–106 bacterial phylotypes in 1 g of soil[4−7]. Therefore, understanding how the complex soil microbiome regulates ecological functions is of prime importance for ecosystem management[8−12].
Positive BEF patterns have often been proposed to result from the complementarity effect of facilitation or niche differentiation and a positive selection effect from the dominance of certain influential species[13−15]. However, exceptions have also been reported with non-significant or even negative BEF relationships, for example, in semi-arid wildflower or green algal communities[16,17]. The mechanisms underlying these patterns are usually explained by a negative selection effect driven by the uneven contribution of competitively dominant species[18] or allelopathic disturbances[19]. However, the underlying mechanisms are primarily based on macroorganisms. How this regulates the diversity and functions of microbial communities requires further investigation.
In the microbial world, there are usually some taxa that are highly connected to each other, defined as keystone taxa[20], which, individually or in a guild, can exert considerable influence on microbiome structure and functions[21]. Keystone taxa may arise based on several factors, such as complementary resource acquisition strategies, resource sharing, and niche partitioning[15,21]. However, how the complexity of the microbiome is mediated by keystone taxa that further affect BEF relationships remains unclear.
A positive BEF relationship seems tenable for soil microbial communities, and higher diversity may be conducive to better performance in controlled conditions[22]. For example, soil microbial species richness can positively predict organic matter mineralization and plant residue decomposition[23]. Higher species diversity promotes efficient microbial carbon use and enhances C storage[11,24]. Microbial diversity loss impairs soil N-cycling[25,26], whereas greater microbial diversity produces more proteases, proteolyzes organic N, and increases N availability[27]. However, these reported positive BEF patterns mainly occur in microbial communities with low diversity (< 10 species) and in controlled experiments[28,29]. However, whether the BEF relationship will demonstrate a different pattern in more diverse communities under natural soil conditions is still unclear[30].
In natural soils, the number of soil microbial species is much greater, the community is more complex than in synthetic microbial communities, and some microbial taxa may be functionally redundant[2,31]. Greater complexity can support more functions and stronger stability of microbial communities[32,33]; however, intense resource competition may also occur simultaneously among microbial taxa. Therefore, whether a positive BEF relationship still existed, particularly in functionally redundant communities with intense competition, requires further confirmation. Previous studies have reported positive BEF patterns under controlled conditions using culturable and functionally redundant soil microbial communities at low diversity levels. However, the species richness in natural soil microbial communities may be several orders of magnitude greater than that in controlled experiments. Such high species richness may cause strong resource competition, which may further lead to high dominance or reduce the influence of highly effective microbial taxa, such as keystone species[34]. If the dominant species do not contribute much to ecosystem functioning, or if the roles of mediators for keystone species disappear, a negative BEF might occur.
Besides the traditional positive-BEF view, the BEF relationship can level off or even become negative when species richness is very high. Because natural soil microbial communities can contain orders of magnitude more species than experimental assemblages and exhibit intense functional redundancy and competition, the direction of their BEF relationships remains unresolved. Therefore, instead of presuming a positive BEF, the shape of the BEF relationship for nitrogen-transforming microbial guilds in a seasonally flooded marsh was systematically examined. Four guilds of nitrogen (N)-transforming microbial communities were selected from natural soil conditions. These N-cycling microbes included nitrite (NO2−) oxidizing bacteria (NOB), two types of nitrite reducing bacteria (nirK- and nirS-carrying bacteria), and nitrite oxide (N2O) reducers. NOB governs nitrite oxidation, the last step of nitrification, which converts nitrite to nitrate (NO3−)[35]. The nirK-type or nirS-type microbes are responsible for nitrite reduction, which is the rate-limiting step in denitrification[36]. N2O is not only reduced by denitrifying bacteria, but can also be reduced by non-denitrifying microbes, so all these microbes were defined as N2O reducers. Soil samples were collected from distinct vegetation types along the beach of the Yangtze River to obtain a wide range of microbial species richness. This study determined the species richness of nitrite oxidizers, nirK-type and nirS-type denitrifiers, and N2O reducers, as well as their respective functional potentials (metageonomic marker gene abundance) and N-transformation rates (enzymatic activity). The findings will be helpful in giving a full understanding of the biodiversity-ecosystem functioning theory.
-
The study site was located to the west of the Yangtze River and Northeast of Dongting Lake, China, and possesses a typical subtropical, humid climate, with mean annual precipitation of 1,417 mm and mean annual temperature of 16.4–17.0 °C. A type of tidal soil has developed from alluvial parent material, with organic matter of 2.43 g·kg−1, total nitrogen of 1.26 g·kg−1, available nitrogen of 112 mg·kg−1, and a pH of 7.9. To create a large-scale species richness gradient for soil N-transforming microbial communities, six distinct vegetation types were selected: natural grasslands dominated by Cynodon dactylon (L.) Pers. (scutch grass), Viola verecunda A. Gray, Polygonum flaccidum Meisn. and Clinopodium gracile (Benth.) Kuntze (total vegetation cover < 10%); grassland dominated by Phragmites communis with total vegetation cover nearly 100%; poplar plantation of 1, 3 and 8 years of age; and poplar reforestation 3 years after cutting down an 8-year-old plantation. Five sites were chosen for each vegetation type, and a 10 m × 10 m plot was set up at each site. Thirteen soil cores were collected along a diagonal line in each plot, with one at the cross-point and three at each end of both lines (Supplementary Fig. S1). Soil cores from one plot were mixed into a composite sample; therefore, 30 mixed soil samples were collected from the six different vegetation types. The fresh soil samples were placed in boxes filled with ice, transported immediately to the laboratory, passed through a 2 mm mesh, and then stored at −20 °C until further analysis.
Assessing N-transforming microbial diversity
-
Soil genomic DNA was extracted from 0.5 g fresh soil samples using a FastDNA SPIN Kit (MP Biomedicals, Santa Ana, CA, USA) following the manufacturer's protocol. The extracted DNA was diluted to 10 ng·μL−1 with the aid of a NanoDrop ND-1000 spectrophotometer (NanoDrop Technologies). The denitrifying bacteria were amplified with different sets of primers; for nitrite reducers carrying nirK genes, the primers were 876 (5'-ATYGGCGGVCAYGGCGA-3') and 1,040 (5'-GCCTCGATCAGRTTRTGGTT-3')[37]; for those with nirS genes, the primers were Cd3aF (5'-GTSAACGTSAAGGARACSGG-3'), and R3cd (5'-GASTTCGGRTGSGTCTTGA-3')[38]. The N2O-reducing bacteria were amplified with the primers of nosZ2F (5'-CGCRACGGCAASAAGGTSMSSGT-3') and nosZ2R (5'-CAKRTGCAK SGCRTGGCAG AA-3')[39]. The nitrite-oxidizing bacteria were amplified with the primers of nxrB169f (5'-TACATGTGGTGGAACA-3') and nxrB638r (5'-CGGTTCTGGTCRATCA-3')[40].
The polymerase chain reaction (PCR) procedures for each group of N-transforming microbes are shown in the supplementary materials. Triplicate PCRs were conducted for each sample, and the three PCR products were pooled for high-throughput sequencing. After purification and quantification, 0.01 μg of PCR product from each sample was used for Illumina paired-end library preparation, cluster generation, and sequenced on the Miseq Illumina PE 300 platform. The sequencing services were provided by Allwegene Technologies (Beijing, China). High-throughput sequencing data were processed using QIIME 1.6.0[41]. DNA reads were assigned to samples according to their unique barcodes. The corresponding paired reads were merged if the overlap was 100% identical using FLASH (v 1.2.7,
http://ccb.jhu.edu/software/FLASH ). Quality filtering was done using QIIME with the default settings for Illumina (r = 3; p = 0.75 total read length; q = 3; n = 0), as recommended by Bokulich et al. Operational taxonomic units (OTUs) were defined with 97% sequence similarity using Uparse[42] after the removal of putative chimeras and singletons. The most abundant sequence was selected as representative of each OTU. The taxonomy of each OTU was assigned using RDP Classifier (version 2.2)[43] and trained on Greengene reference sequences[44]. High-throughput sequencing data were deposited in the China National GenBank (CNGB) with the accession number CNP0003112.Assessing N-transforming potential with metagenomics
-
DNA was fragmented to an average size of approximately 350 bp using a Covaris M220 (Gene Co. Ltd, China) for paired-end library construction. A paired-end library was prepared using a TruSeq DNA Sample Prep Kit (Illumina, San Diego, CA, USA). Adapters containing the full complement of the sequencing primer hybridization sites were ligated to the blunt-end fragments. Paired-end sequencing was performed on an Illumina HiSeq 4000 platform (Illumina Inc., San Diego, CA, USA) using the HiSeq 3000/4000 PE Cluster Kit and the HiSeq 3000/4000 SBS Kit according to the manufacturer's instructions.
Functional annotation of the metagenomic sequencing data included the following steps: (1) Gene assembly of short reads was performed using MEGAHIT 1.0.6. The quality of the generated contigs was then assessed using QUAST 5.0.2. (2) Gene prediction was performed using Prodigal 2.6.3, and redundant sequences were removed using CD-HIT 4.6. (3) Non-redundant sequences were mapped using Bowtie 1.1.2, and sam2counts 0.91 was used to convert mapping results to reference sequence counts, generating a gene table that could be used for functional annotation. Subsequently, all contig data were mapped against Kyoto Encyclopedia of Genes and Genomes (KEGG) pathways[45] to identify tentative metabolic pathways for a specific function. Genes related to nitrogen cycling were selected for potential N-transforming functions, including nitrite reduction potential with an abundance of nirK and nirS, N2O reduction potential with an abundance of nosZ, and nitrite oxidation potential with an abundance of nrxB. Metagenomic data were deposited in the China National GenBank (CNGB) under the accession number CNP000310.
Assessing N-transforming functions
-
Denitrifying enzymatic activity (DEA) was measured using the C2H2 inhibition method[46]. The methodological details were shown as follows: 10 g of fresh soil samples were placed into a 150 mL triangular flask and incubated with KNO3 (50 mg NO3− g−1 dry soil), glucose (0.5 mg C g−1 dry soil), and sodium glutamate (0.5 mg C g−1 dry soil). The mixtures were homogenized and incubated at 28 °C. The atmosphere at the head-space of each flask was vacuumed and replaced by He-C2H2 (90:10) gas mixture to provide an anaerobic condition for inhibiting N2O reductase activity. The rationale for this method is that C2H2 can inhibit N2O reduction; therefore, the rate of N2O production reflects the activity of denitrifying enzymes. DEA was expressed as μg N-N2O produced h−1 g−1 dry soil.
When measuring DEA, a pairwise experiment was conducted using the same procedure, except for the gas filled into each flask. Here, the atmosphere was replaced with helium gas (He; 100%) to create anaerobic conditions under which N2O could be reduced by N2O reducers. Therefore, the N2O reducing activity is reflected in the difference between the N2O production rates with C2H2 and without C2H2 addition. Nitrite-oxidizing activity was measured using an existing method that used the depletion rate of nitrite to reflect nitrite-oxidizing activity[47].
Co-occurrence network analysis
-
Co-occurrence network analysis was performed using an online molecular ecological network analysis (MENA) pipeline[48]. Following the method of Deng et al., each OTU table was first categorized into two groups based on the median value of species richness: low and high species richness, and then SIMPER analysis was conducted in Past version 3[49] to identify the key OTUs that contributed to the 90% difference between the species richness subgroups. This resulted in 435 of 2,714 OTUs for nirK-type nitrite reducers, 1,375 of 7,810 OTUs for nirS-type nitrite reducers, 530 of 4,163 OTUs for N2O reducers, and 529 of 1,990 OTUs for nitrite oxidizers. Networks were constructed based on the relative abundance of the identified OTUs in each N-transforming microbial community. Covariation was measured across all samples, and only OTUs detected in more than 50% of the samples were used for network construction. The optimal similarity threshold (St) was identified using random matrix theory (RMT) before network construction, with values of 0.81, 0.77, 0.71, and 0.69 for nirK-type nitrite reducers, nirS-type nitrite reducers, N2O reducers, and nitrite oxidizers, respectively. Module separation and modularity calculations were performed using greedy modularity optimization, and the within-module connectivity (Zi) and among-module connectivity (Pi) were calculated. Keystone OTUs were identified based on Zi and Pi values with a threshold of 2.50 and 0.62. The nodes with Zi > 2.50 and Pi > 0.62 were defined as network hubs; nodes with Zi > 2.50 and Pi ≤ 0.62 as module hubs; nodes with Zi ≤ 2.50 and Pi > 0.62 as connectors; and nodes with Zi ≤ 2.50 and Pi ≤ 0.62 as peripherals. Here, the network hub, module hub, and connector were defined as keystone OTUs.
Statistical analyses
-
Linear mixed effects models were used to decipher the relationships between species richness and functional potential, relative abundance of modules and functional potential, species richness and relative abundance of keystone species, and relative abundance of keystone species and functional potential for each type of N-transforming microbial community with vegetation type as a random variable. The optimal model was selected using the Akaike information criterion (AIC) value. These analyses were performed using 'lme4', 'lmerTest', and 'MuMIn' packages in R (2022). Random forest analysis was performed to explore the relative importance of the identified keystone species on the functional potential of each N-transforming microbial community. Random forest is a nonparametric and nonlinear statistical method that can produce accurate predictions by bootstrapping all decision trees[50]. The importance of each predictor was obtained based on the out-of-bag data and indicated by an increase in the mean squared error (LncMSE). These analyses were conducted using the randomForest package (R 4.0.2). Third, structural equation modeling (SEM) was used to decipher the causal relationships between species richness and functional potential in each N-transforming microbial community by incorporating the relative abundance of modules with possible functional impacts and keystone species identified by random forest analysis. Model fit was assessed using the maximum likelihood
$\chi^2 $ To test the assumption that negative associations among taxa were prevalent in more diverse communities, the dataset was first rearranged from low to high species richness, and then each dataset was categorized into two subgroups: low species richness (LSR) and high species richness (HSR), with the cut-off point of the median value of species richness. Spearman's correlation was then performed, and species pairs with strong correlations were selected, while non-significant correlations were discarded. Two indices were defined to reflect the biotic association based on the results of the Spearman correlation analysis: the occurrence of interaction and overall association intensity. The occurrence of interactions was calculated as the proportion (%) of negative or positive interspecific interactions, accounting for the total frequency of strong correlations. A higher occurrence of negative interactions suggested that negative interspecific interactions were more frequent. The overall interaction intensity was defined as the average sum of the correlation coefficients. As only strong positive or negative correlations were retained, a smaller overall interactive intensity would suggest a stronger negative interspecific interaction, as more negative coefficients counteracted the positive coefficients.
-
A total of 2,714, 7,810, 4,163, and 1,990 operational taxonomic units (OTUs; 97% sequence similarity) were defined for nirK- and nirS-nitrite reducers, N2O reducers, and nitrite oxidizers, respectively. Negative relationships were consistently found between species richness and the nitrite reduction potential for nirK- and nirS-nitrite reducers, denitrifying enzymatic activity for nirK- (but not nirS-) nitrite reducers, N2O reduction potential and reducing activity for N2O reducers, and nitrite oxidization potential and oxidizing activity for nrxB-type nitrite oxidizers (Fig. 1). The negative relationship between species richness and functional potential was independent of vegetation type for each type of N-transforming microbial community (Supplementary Table S1).
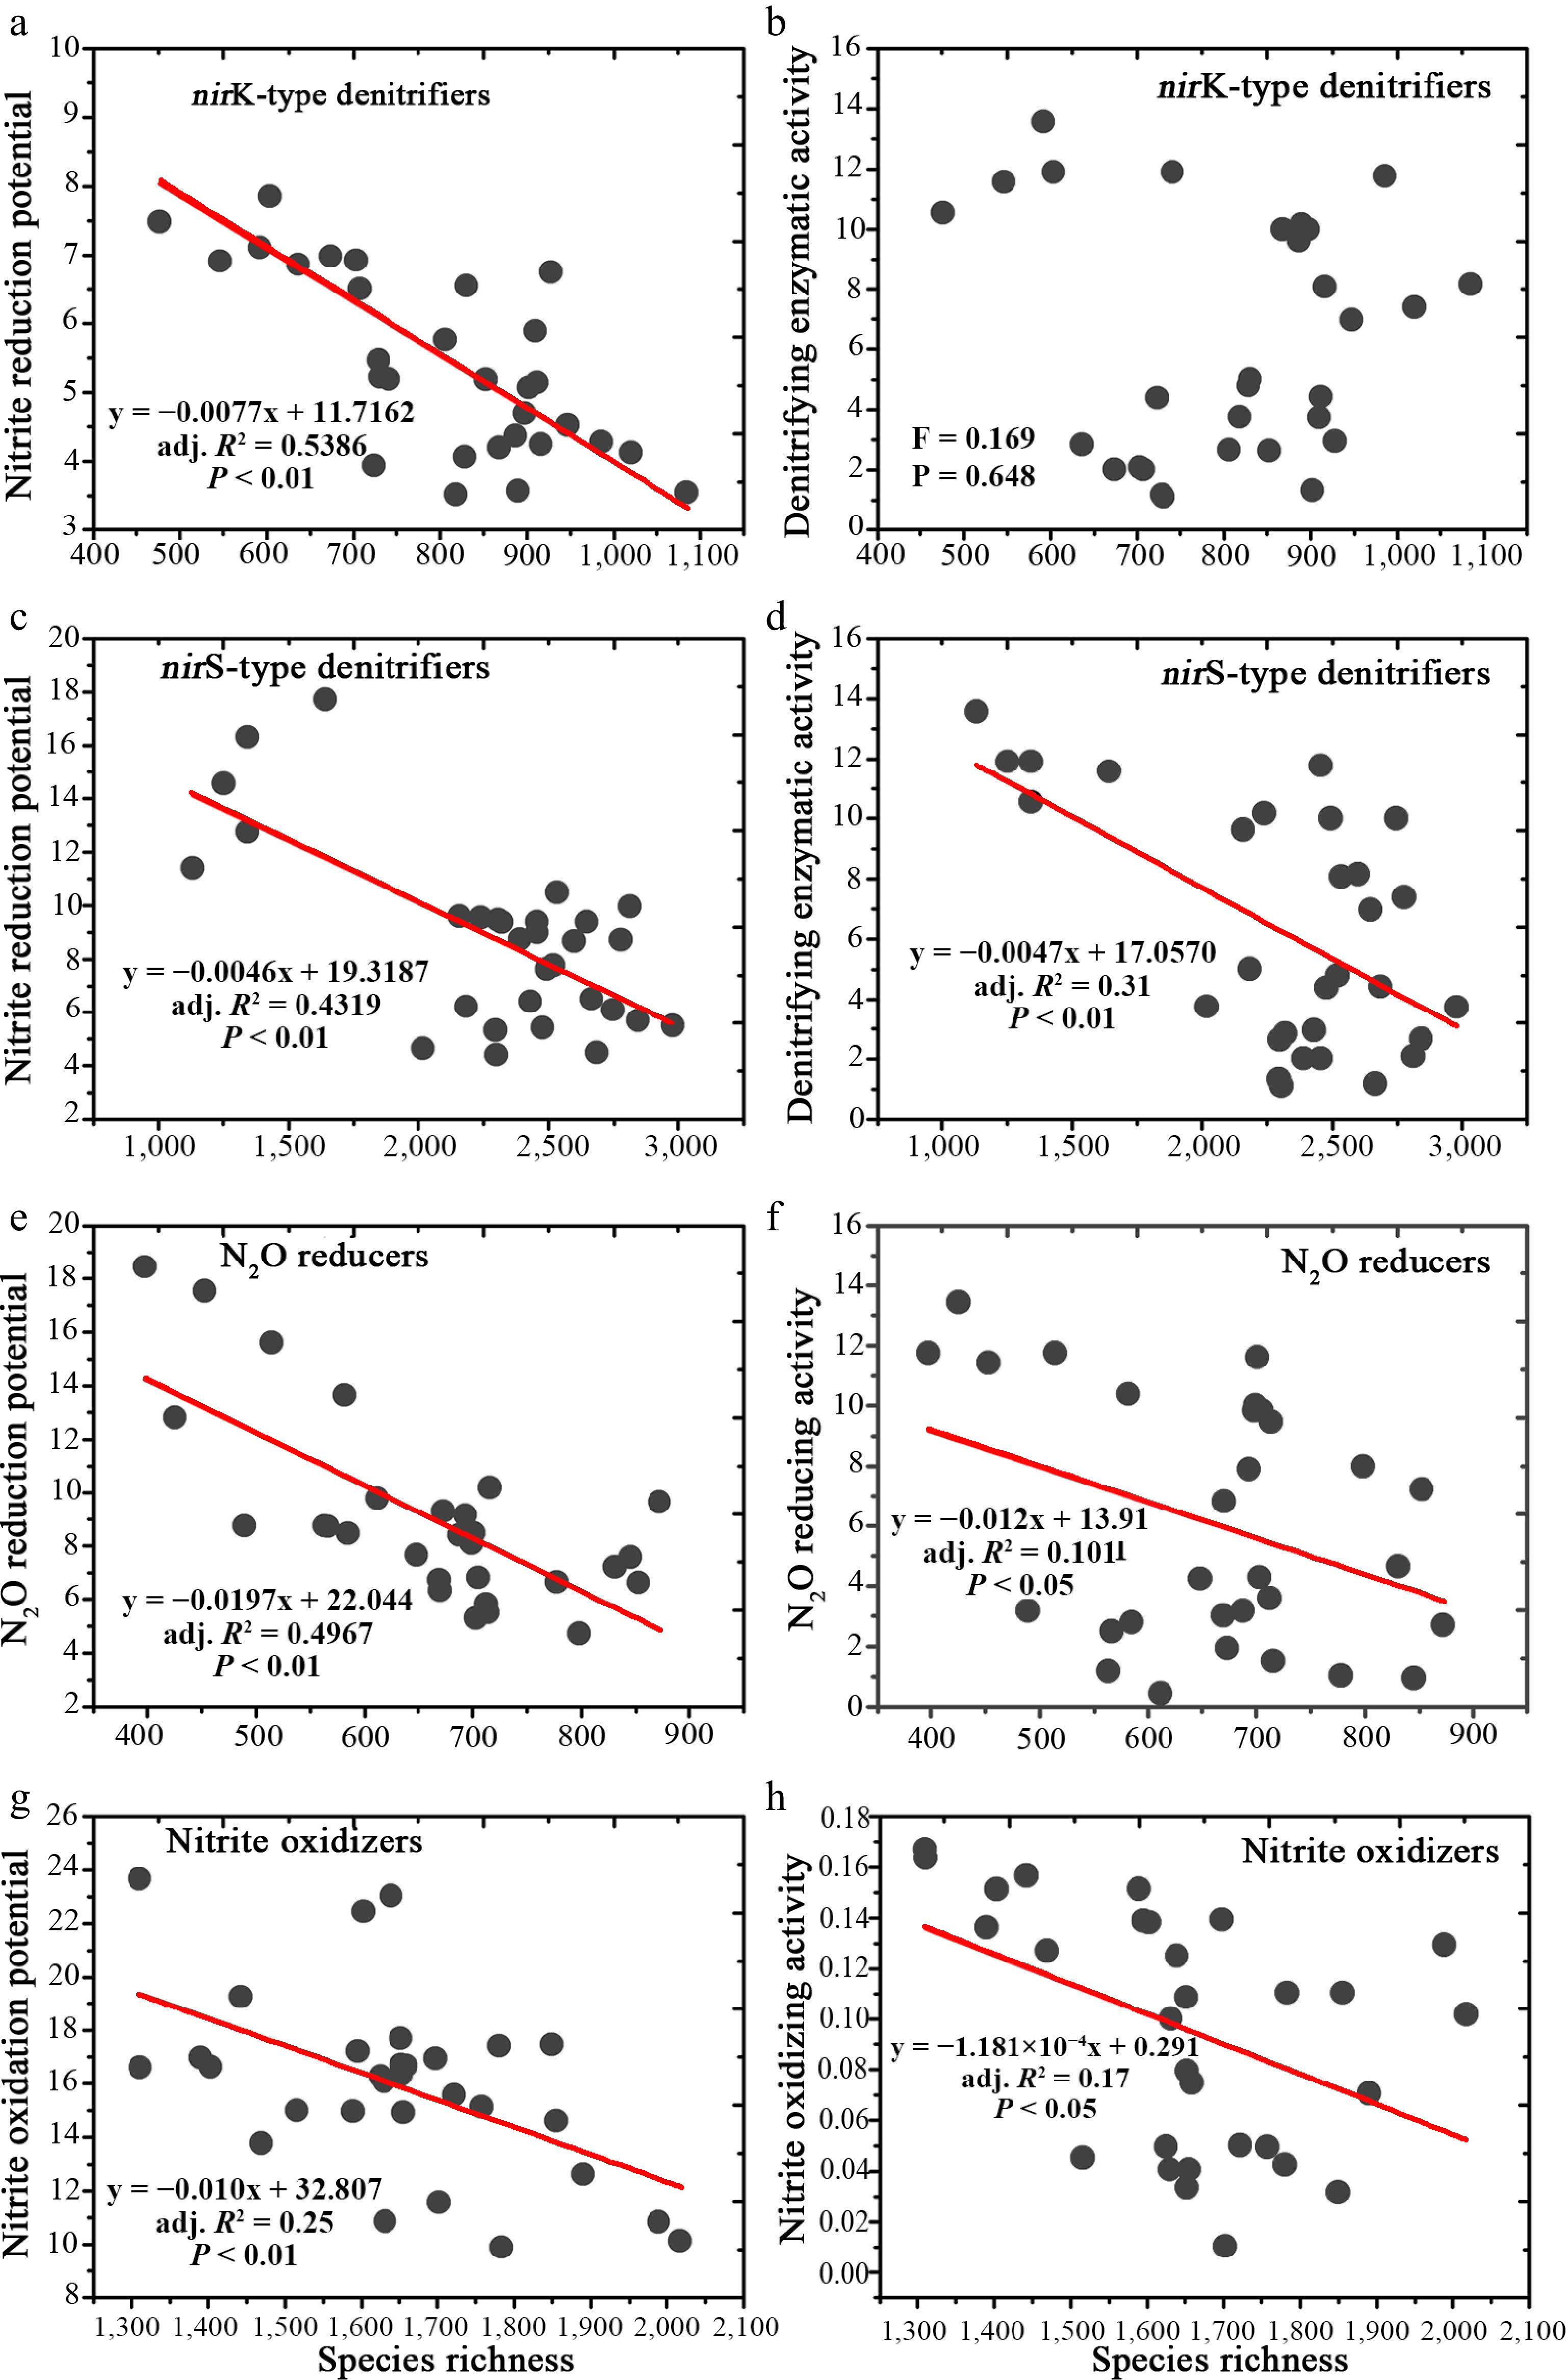
Figure 1.
Linear regressions showing the relationship between species richness and N-transforming capability.
(a) Negative relationship between nitrite reduction potential and species richness for nirK-type denitrifiers. (b) No relationship was shown between denitrifying enzymatic activity and species richness for nirK-type denitrifiers. (c), (d) Negative relationships were shown for nitrite reduction potential vs species richness, and denitrifying enzymatic activity vs species richness for nirS-type denitrifiers. (e) N2O-reducing potential. (f) N2O-reducting activity for N2O-reducing bacteria. (g), (h) Negative relationships for nitrite oxidizing potential vs species richness, and nitrite oxidizing activity vs species richness for nitrite oxidizing bacteria.Better growth but poorer functions for keystone taxa with increasing biodiversity
-
One assumption was that the selection for dominant species with poor functional performance could generate a negative BEF relationship (negative selection effect). To explore the underlying mechanisms of the observed negative BEF patterns, the negative selection assumption at the module and keystone species levels was tested using co-occurrence networks (Fig. 2). There were 15, 35, 11 and 13 modules for nirK (modularity: 0.682), nirS nitrate reduction (modularity: 0.608), N2O reduction (modularity: 0.508), and nitrite oxidizer communities (modularity: 0.446), respectively (Fig. 2).
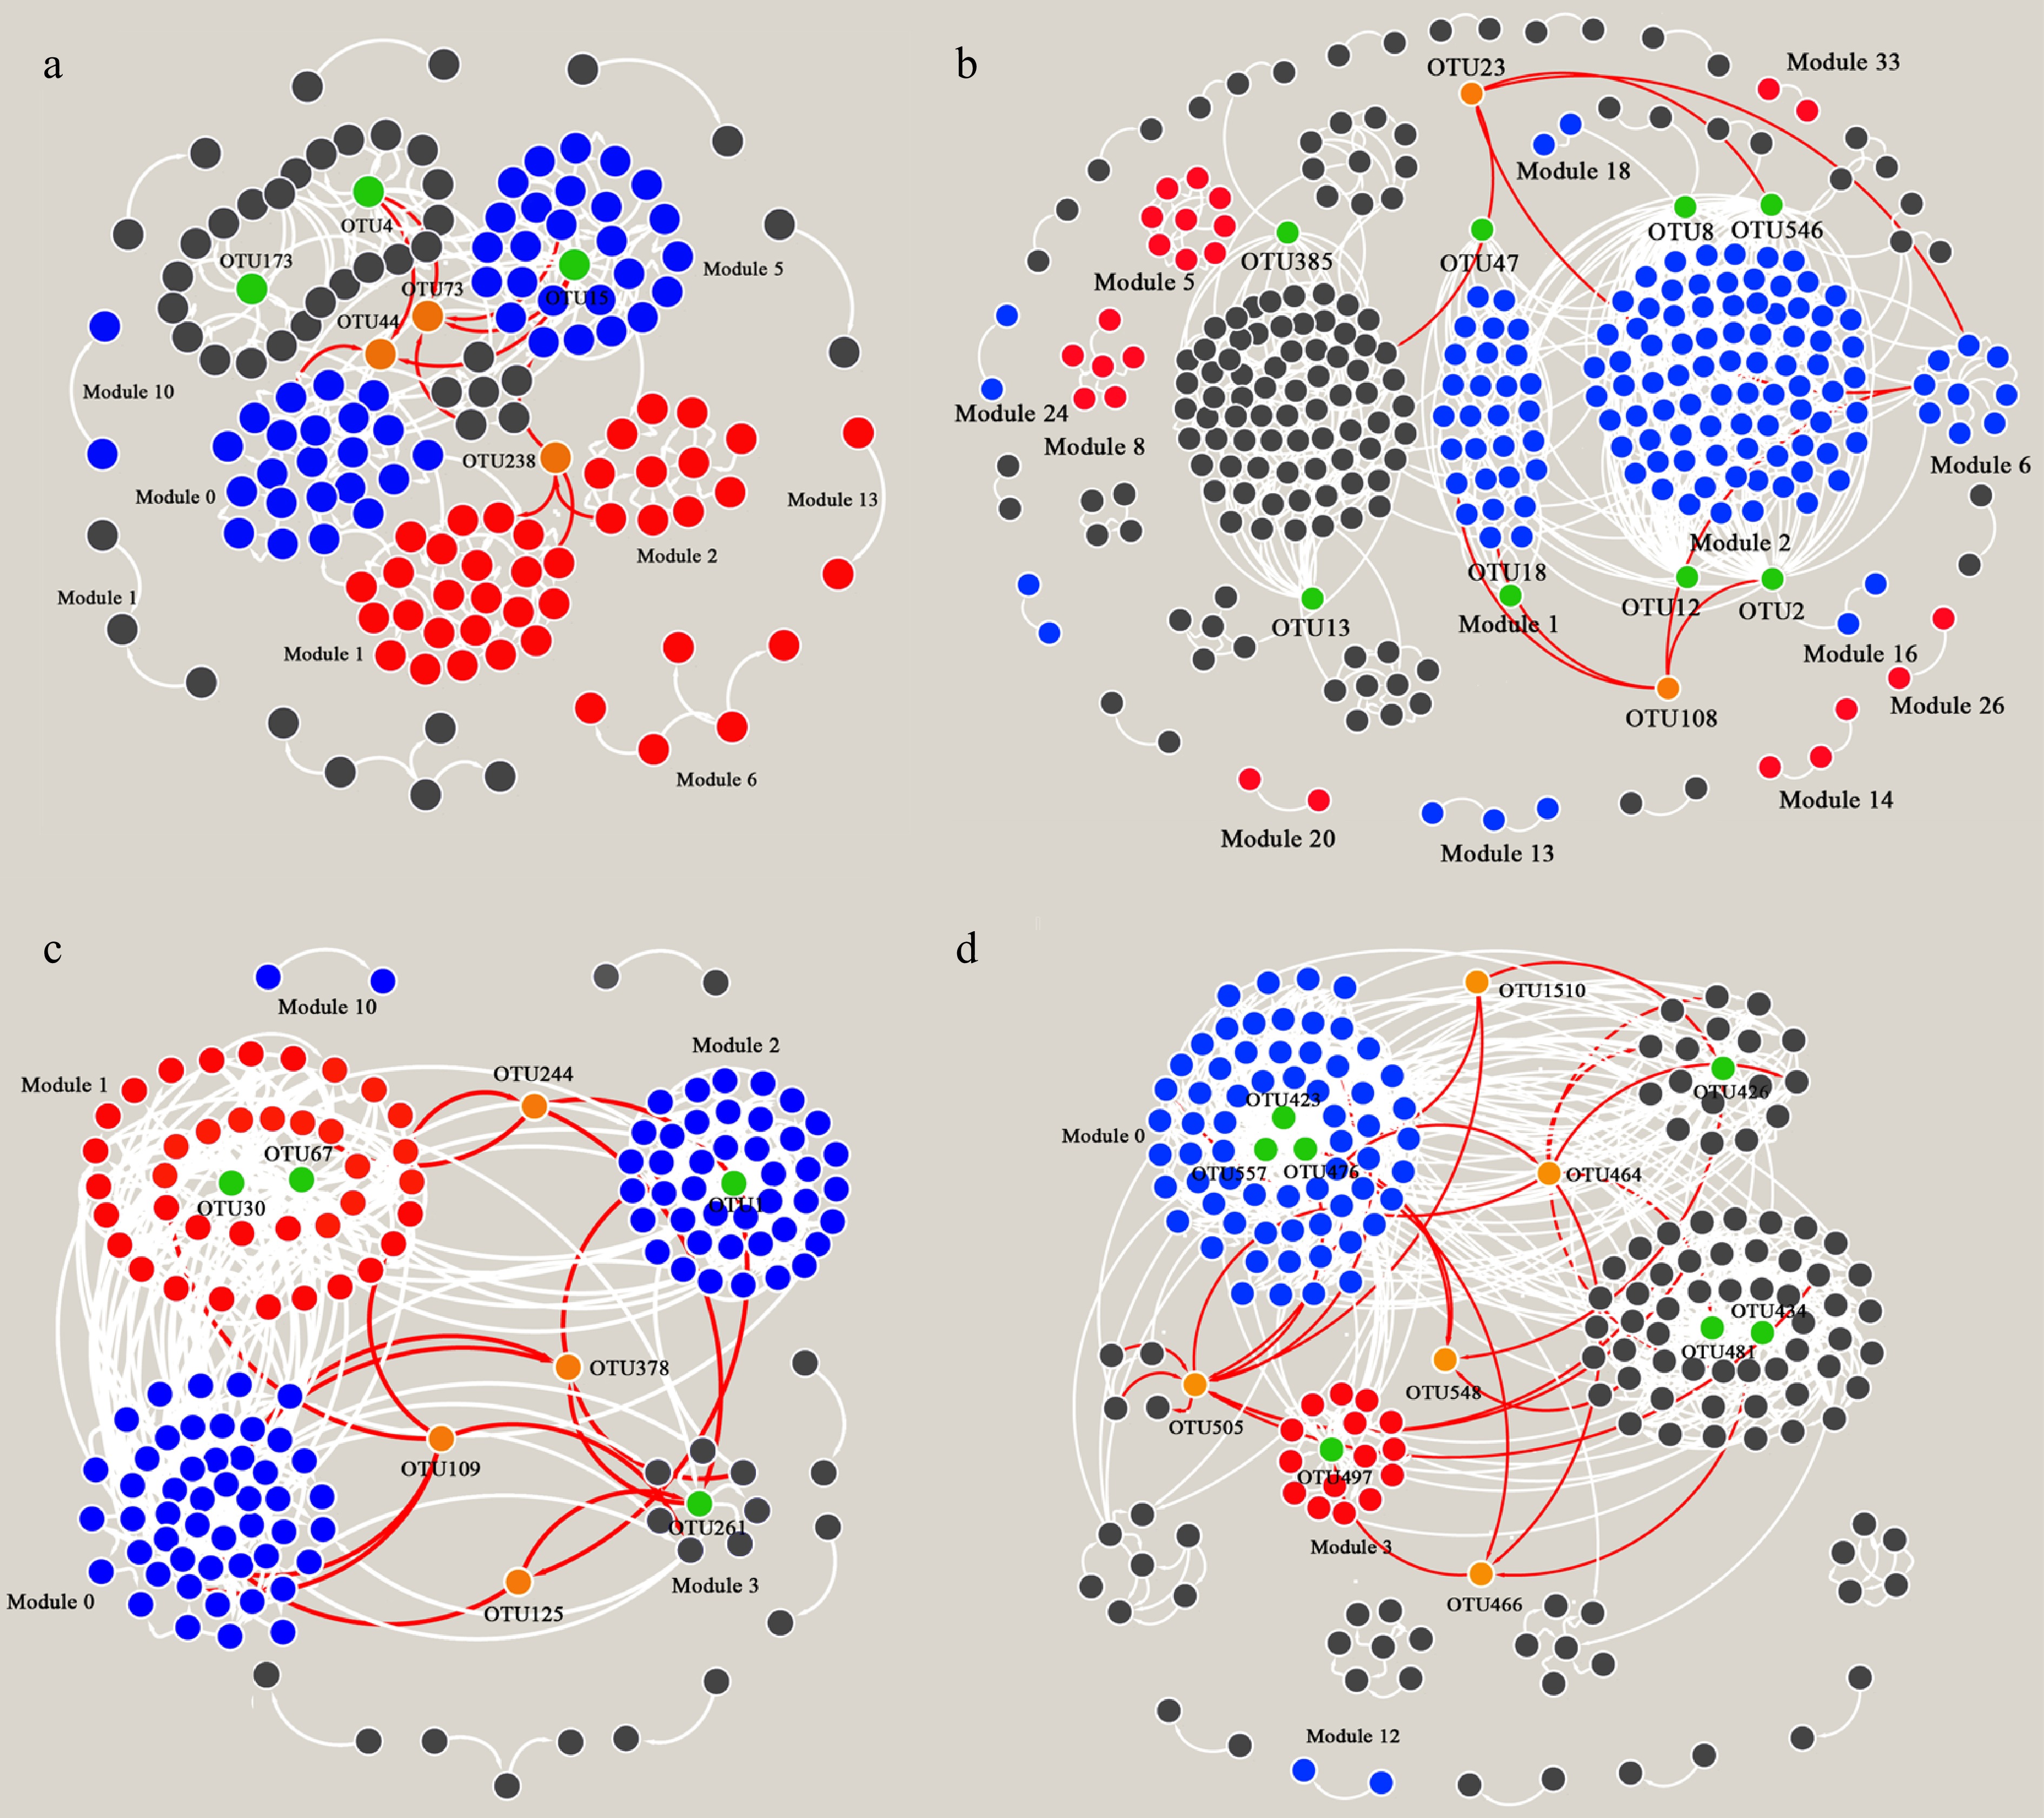
Figure 2.
Co-occurrence networks based on Pearson correlation for (a) nirK-type denitrifying bacteria, (b) nirS-type denitrifying bacteria, (c) N2O reducing bacteria, and (d) Oxidizing bacteria.
The red represents a strong positive correlation between the relative abundance of the module and corresponding N-transforming potential, blue for a significantly negative correlation, and dark gray for no correlation. The green points represent the module hub, and orange for the connectors.The relative abundance of the dominant module, defined as the sum of the relative abundances of all OTUs in the dominant module, was negatively correlated with the functional potential in all four N-transforming microbial communities Supplementary Fig. S2). In addition, three types of keystone OTUs were defined based on their topological properties: network hub, module hub, and connector, based on the within-module connectivity (Zi) and among-module connectivity (Pi) of the networks (Supplementary Fig. S3). Random forest analysis identified the most important keystone OTUs for functional performance in each nitrogen-transforming microbial community (Table 1, Supplementary Table S2).
Table 1. Keystone taxa with significant changes identified based on network analysis.
Keystone taxa Roles Regressions (SR vs RA) Regressions (RA vs function) Importance (p value) Taxonomy nirK-type nitrite reducers OTU15 Module hub y = 0.005x − 2.309, p < 0.01 y = −0.476x + 4.006, p < 0.01 19.15 (0.05) Pannonibacter phragmitetus OTU173 Module hub y = −7.026 * 10−5x + 0.069, p < 0.05 y = 0.004x − 0.010, p = 0.20 11.17 (0.13) Devosia sp. GSM-205 OTU44 Connector y = 0.001x − 0.249, p < 0.05 y = −0.080x + 0.684, p < 0.01 17.30 (0.09) Bacterium clone_B-MYnirK1 OTU238 Connector y = 2.000 * 10−4x − 0.145, p < 0.01 y = −0.028x + 0.192, p < 0.01 33.73 (0.01) Chelativorans sp. BNC1 nirS-type nitrite reducers OTU2 Module hub y = 3.000 * 10−4x + 0.689, p = 0.53 y = −0.219x + 3.204, p < 0.01 28.70 (0.01) Rubrivivax gelatinosus OTU8 Module hub y = 4.000 * 10−4x + 0.092, p = 0.43 y = −0.057x + 1.570, p = 0.42 22.95 (0.02) Rubrivivax gelatinosus OTU12 Module hub y = 0.001x + 0.413, p = 0.39 y = −0.234x + 3.647, p < 0.01 26.43 (0.01) Uncultured bacterium OTU47 Module hub y = 3.000 * 10−4x − 0.208, p = 0.05 y = −0.037x + 0.722, p < 0.05 18.81 (0.03) Azospira sp. NC3H-14 OTU385 Module hub y = 4.618 * 10−5x − 0.074, p = 0.11 y = −0.009x + 0.113, p < 0.05 11.34 (0.10) Rhodocyclales bacterium OTU546 Module hub y = 2.000 * 10−4x − 0.146, p < 0.05 y = −0.035 + 0.650, p < 0.05 24.07 (0.03) Bacterium NirSIsoEc.72 OTU23 Connector y = 5.000 * 10−4x − 0.596, p < 0.05 y = −0.106x + 1.429, p < 0.01 25.86 (0.01) Uncultured bacterium OTU108 Connector y = 3.306 * 10−5x − 0.031, p = 0.09 y = −0.011x + 0.141, p < 0.01 39.37 (0.01) Rubrivivax gelatinosus N2O reducers OTU1 Module hub y = 0.011x − 3.112, p < 0.05 y = −0.313x + 6.878, p = 0.07 30.39 (0.03) Uncultured bacterium OTU30 Module hub y = −0.005x + 3.926, p < 0.01 y = 0.245x − 1.766, p < 0.01 31.31 (0.01) Herbaspirillum sp. TSO26-2 OTU67 Module hub y = −0.001x + 1.058, p < 0.01 y = 0.078x − 0.531, p < 0.01 18.62 (0.07) Massilia sp. TSO8 OTU261 Module hub y = −0.001x + 0.407, p < 0.01 y = 0.029x − 0.204, p < 0.01 26.78 (0.02) Azoarcus sp. CIB OTU109 Connector y = 3.000 * 10−4x − 0.148, p = 0.07 y = −0.012x + 0.166, p = 0.06 7.10 (0.26) Thauera humireducens OTU125 Connector y = 0.001x − 0.739, p < 0.05 y = −0.052x + 0.711, p < 0.05 30.97 (0.01) Uncultured bacterium Nitrite oxidizers OTU423 Module hub y = 0.012x − 9.331, p = 0.51 y = −0.389x + 9.769, p < 0.05 12.29 (0.13) Nitrospira calida OTU434 Module hub y = 0.007x − 4.520, p = 0.15 y = −0.090 + 3.743, p = 0.45 23.13 (0.01) Nitrospira calida OTU481 Module hub y = 0.005x − 4.109, p = 0.06 y = 0.003x + 1.382, p = 0.97 9.66 (0.19) Nitrospira moscoviensis OTU497 Module hub y = −0.009x + 10.065, p < 0.01 y = 0.193x − 2.490, p < 0.01 24.62 (0.01) Nitrospira moscoviensis OTU557 Module hub y = 0.002x − 1.758, p = 0.07 y = -0.091x + 2.022, p < 0.01 25.96 (0.01) Nitrospira moscoviensis OTU505 Connector y = −0.005x + 5.474, p < 0.05 y = 0.041x − 0.288, p = 0.48 4.20 (0.37) Nitrospira bockiana Values in bold indicate significant differences at alpha =0.05 level. Linear regression analyses showed that the relative abundance of the most important keystone OTUs increased with species richness, but their corresponding functional potential decreased in all N-transforming microbial communities (Table 1). A positive relationship between species richness and relative abundance was shown for module 0, 5, and 10 in the nirK-type denitrifiers community, module 1, 2 and 13 in nirS-type denitrifiers, module 0 and 2 in N2O reducers, and module 0 in nitrite oxidizers. However, high species richness also showed negative impacts on the relative abundance of module 1, 2, 6 and 13 in nirK-type denitrifiers, module 5, 8 and 26 in nirS-type denitrifiers, module 1 in N2O reducers, and module 3 in nitrite oxidizers (Fig. 2a). OTU30 and OTU67, the hubs of module 1, showed a negative correlation with species richness, but a positive correlation with N2O reduction potential (Supplementary Figs S2 and S4). OTU261 was the hub of module 3, but this module was not correlated to species richness or N2O reduction potential (Fig. 2c).
Community complexity is decreased as biodiversity increases
-
Although it is difficult to demonstrate a direct consequence of resource competition among species on microbial community functions, an attempt was made to confirm the existence of intensifying competition in more diverse soil microbial communities by defining four indices: positive links per OTU, negative links per OTU, community complexity, and overall association intensity. The overall association intensity was defined as the sum of Pearson's correlation coefficients; a smaller value suggested stronger negative associations that counteracted positive associations. Each of the four datasets was re-categorized into low species richness (LSR) in the lower quarter and high species richness (HSR) in the upper quarter. For all N-transforming microbial communities, the LSR subgroup had higher positive links per OTU, larger community complexity, and stronger association intensity than the HSR subgroup; however, the negative links per OTU were not affected by species richness (Fig. 3).
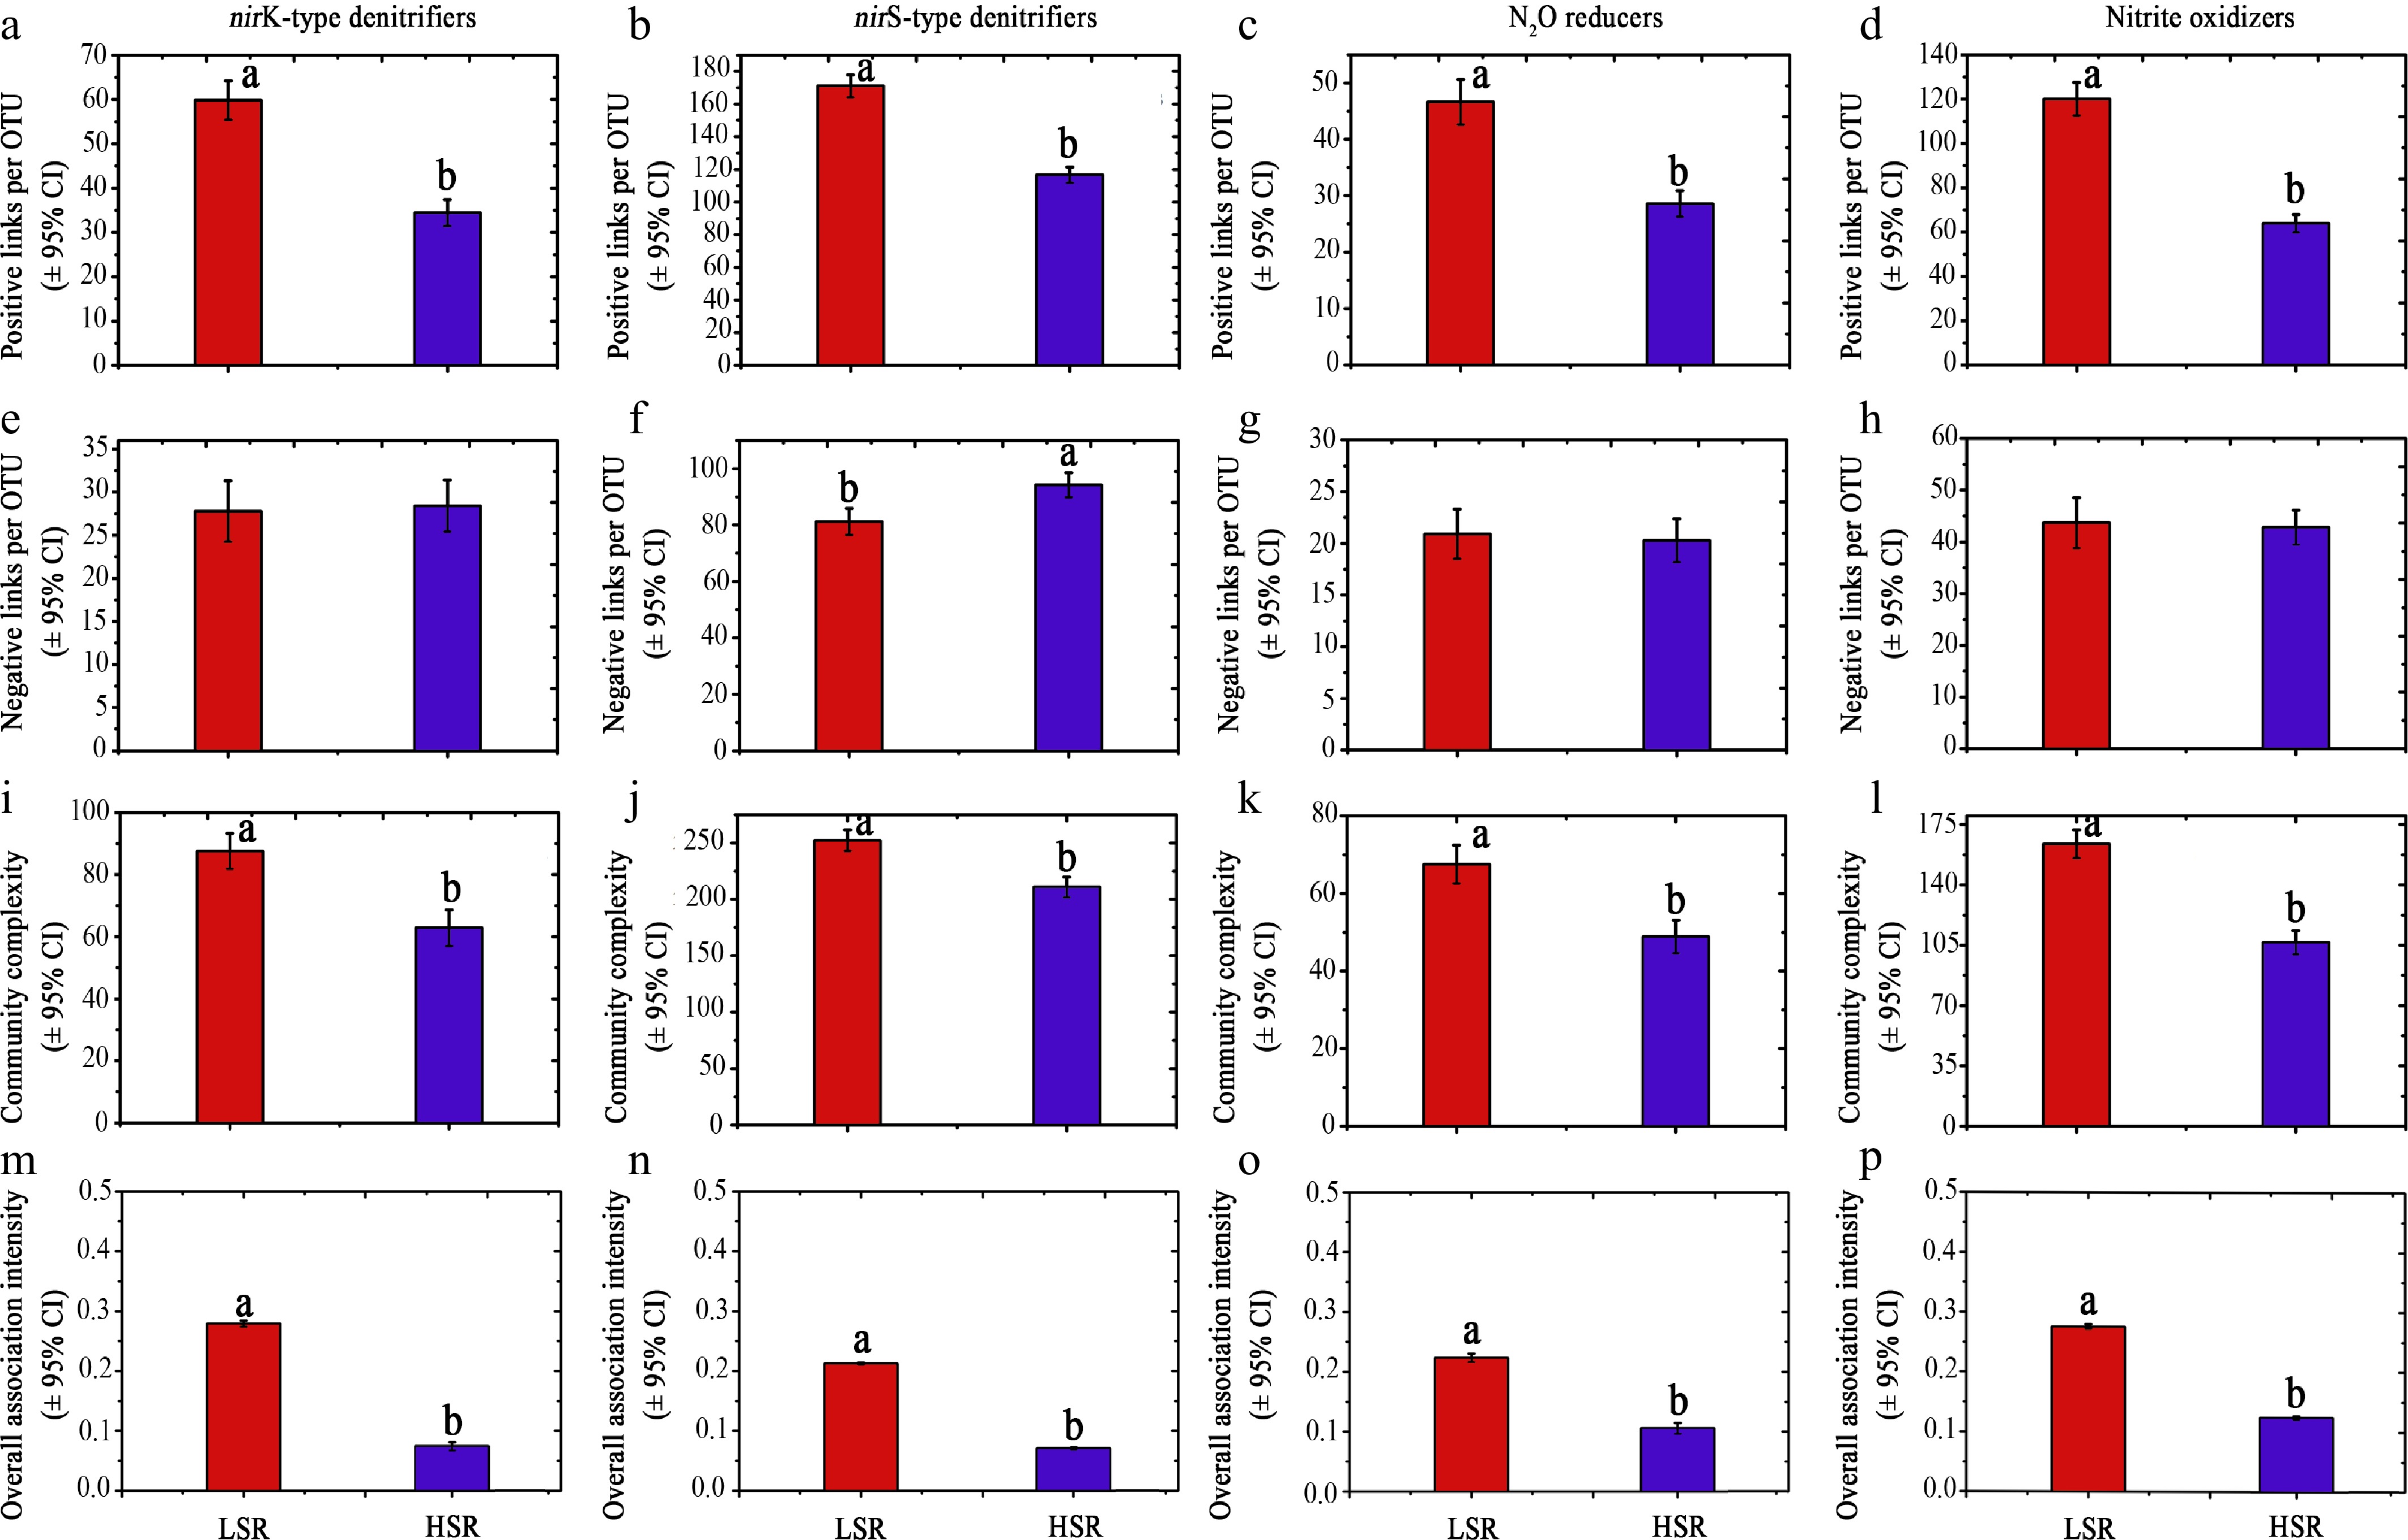
Figure 3.
The biotic associations and complexity for different N-transforming communities at low species richness (LSR) and high species richness (HSR).
(a)–(d) The number of strong positive links per operational taxonomic unit (out). (e)–(h) The number of strongly negative links per OTU. (i)–(l) Community complexity with the sum of the numbers for positive and negative links. (m)–(p) The overall association intensity, with the sum of coefficients for significant correlation. The smaller association intensity suggests a stronger negative association, which counteracts the intensity of the positive association. Data are presented as means ± 95% CI. Different letters suggest significance at the p < 0.05 level, which was judged from the overlap of 95% CI between LSR and HSR.Links of species richness to N-transforming capability
-
The SEM results showed that species richness strongly and indirectly affected the N-transforming capability irrespective of the identity of microbial communities, although direct but weak effects were observed for nirK nitritre reducers and nitrite oxidizers (Fig. 4). Species richness in nirK communities positively affected OTU15 (the hub of the poorly performing module 5), subsequently acting on the connector, OTU238, which transmitted the negative effect to module 1 and further influenced the nitrite reduction potential (Fig. 4a).
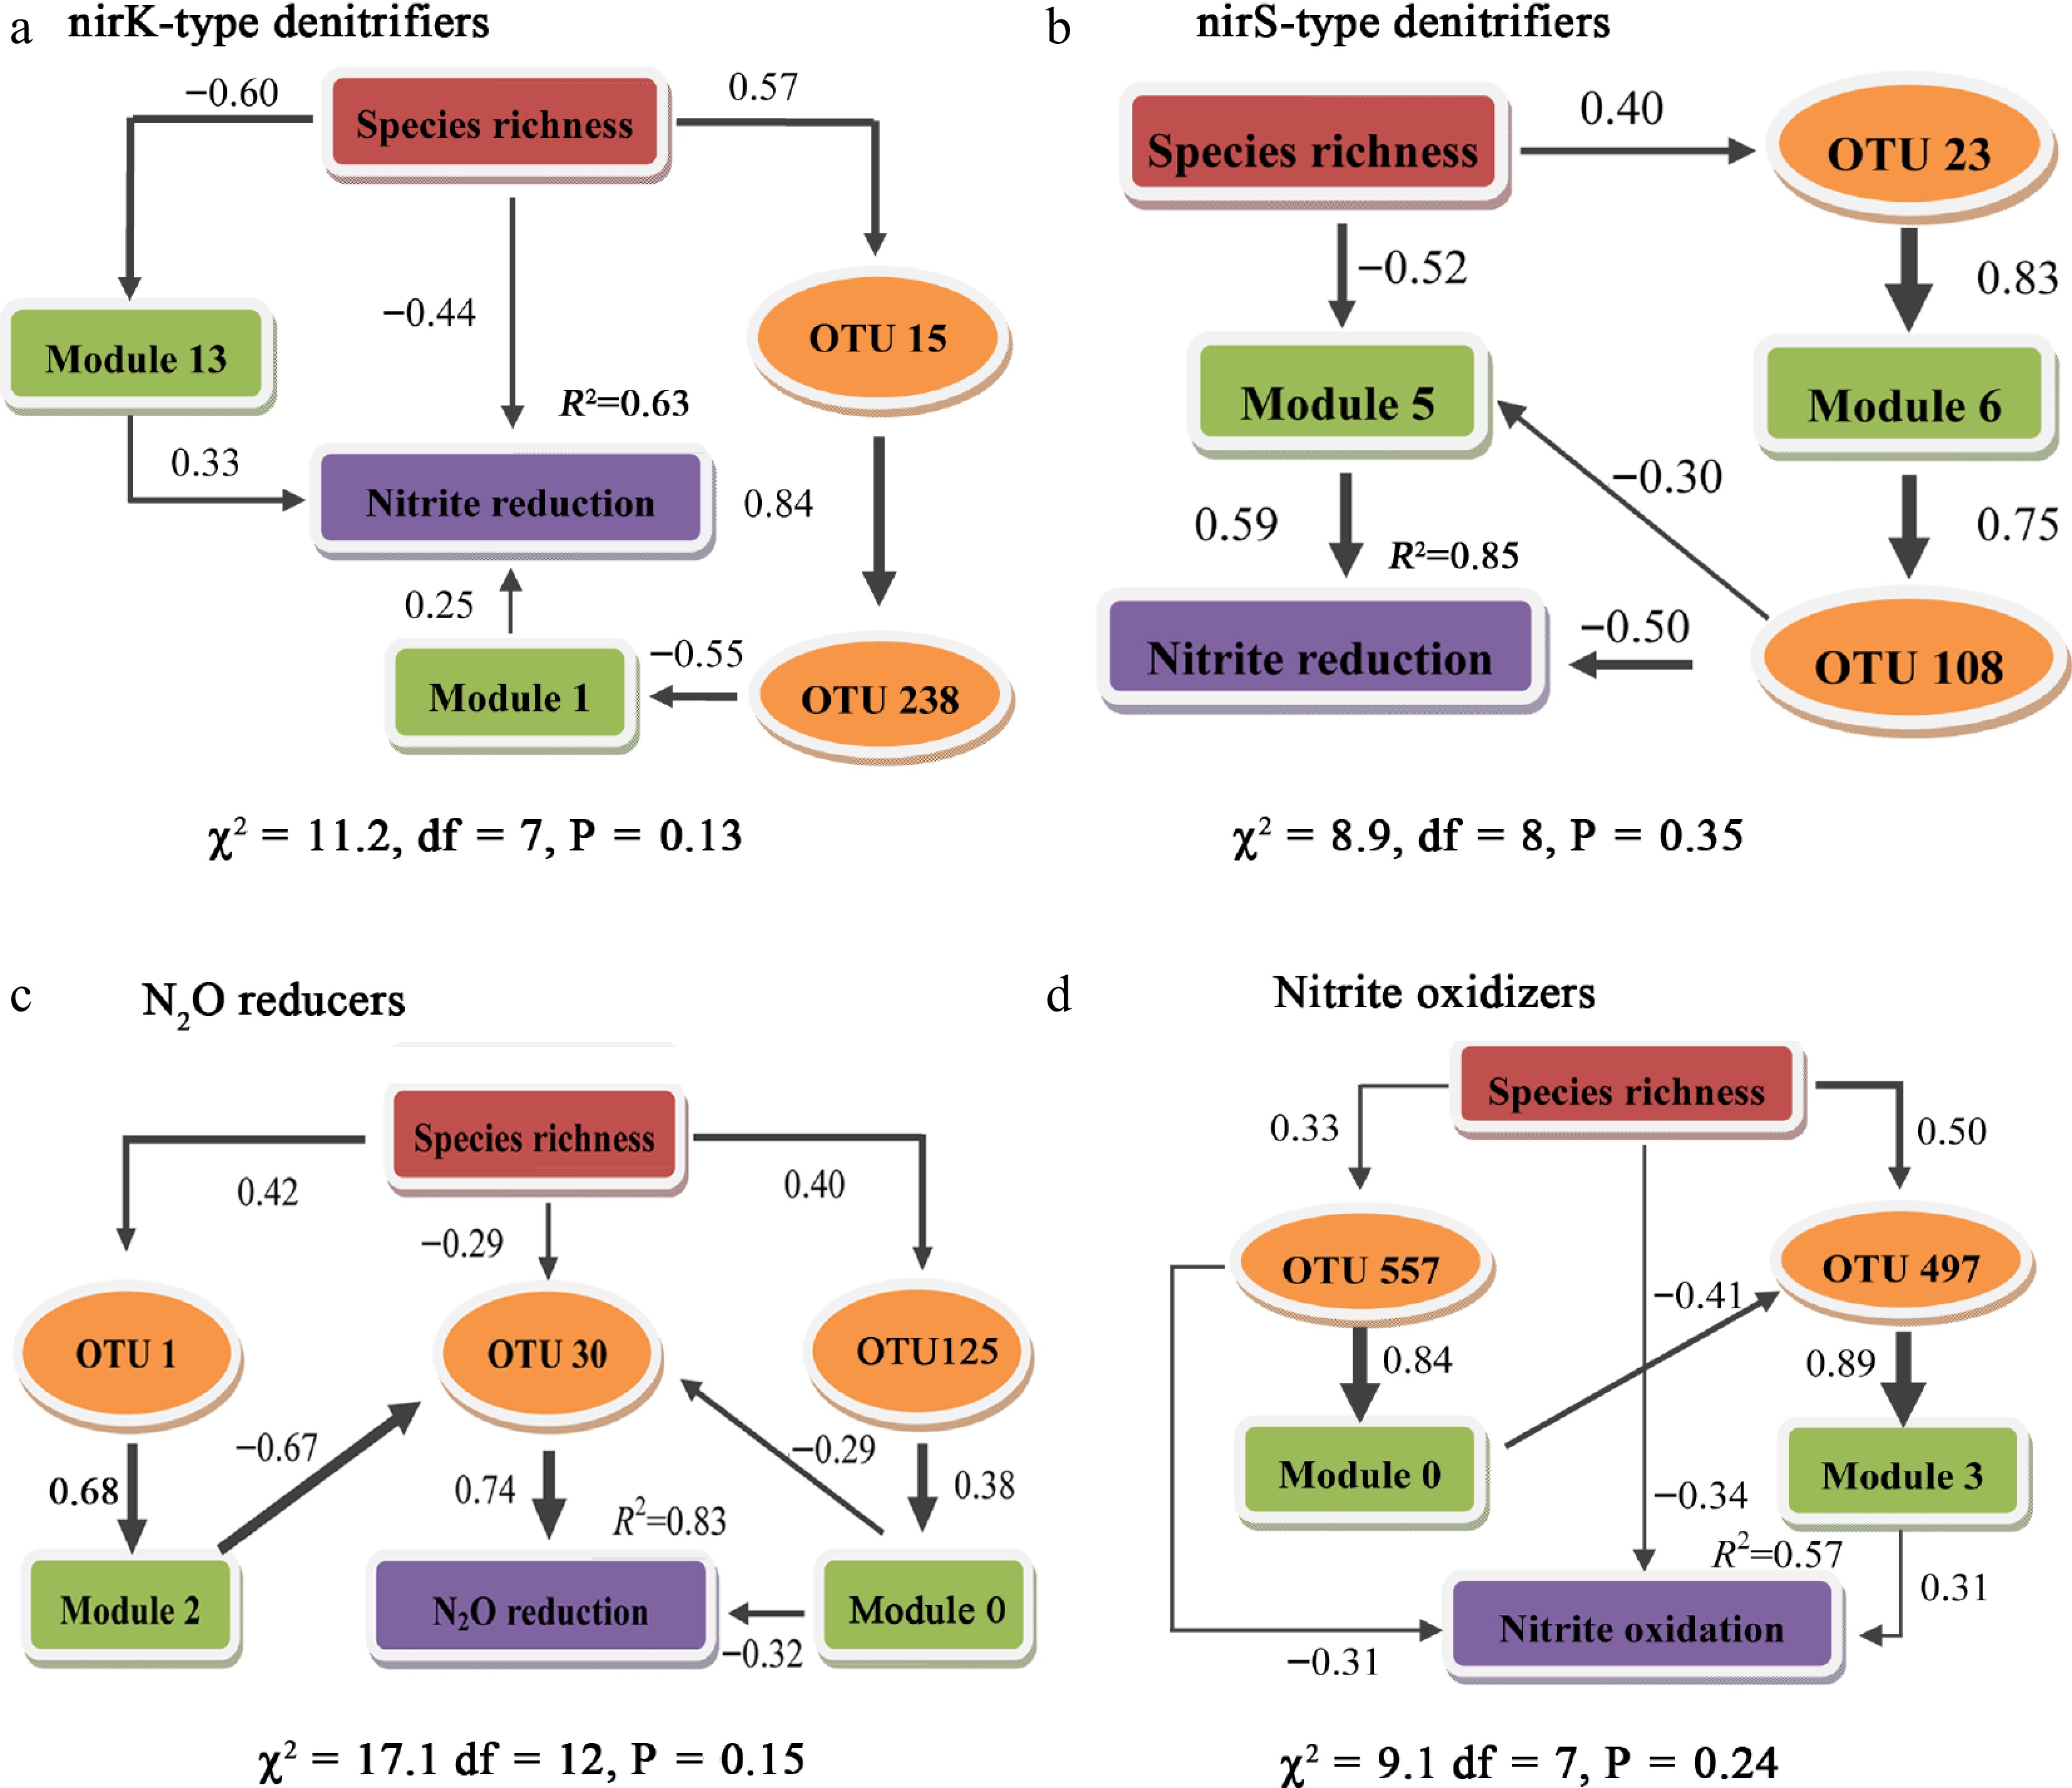
Figure 4.
Structural equation modeling to determine the direct and indirect effects using keystone species and dominant modules of species richness on N-transforming potential.
(a) nirK-type denitrifiers; OTU15 is the hub of module 5, OTU238 is the connector between module 5, 1, and 2. (b) nirS-type denitrifiers. (c) N2O reducers. (d) Nitrite oxidizers.Species richness in the nirS-type denitrifier community positively affected the connectors OTU23 and module 6, whose poor performance was then transmitted to OTU108, which exerted a direct negative effect on nitrite reduction potential (Fig. 4b). Species richness in the N2O reducer community positively affected module 2 by acting on OTU1 (module 2 hub) and then negatively affected OTU30, which subsequently exerted a direct, positive effect on the N2O reduction potential (Fig. 4c). Species richness in the nitrite oxidizers community negatively affected the nitrite oxidization potential by first acting on OTU557 (module 0 hub) and then on module 0 (poor performance), which subsequently exerted a negative effect on OTU497 (module 3 hub) and module 3 (good performance) (Fig. 4d). Therefore, high species richness decrease N transforming functions mainly through promoting keystone taxas with poor functional performance.
-
The positive effects of biodiversity on ecosystem functioning have been frequently reported and are widely discussed as a general rationale for biodiversity conservation[7,51,52]. However, the results reported in this study suggest that biodiversity can negatively affect ecosystem functioning in soil N-transforming microbial communities. The current findings can be explained by negative interspecific association and the negative selection effect in the focused N-transforming microbial communities.
This study observed fewer positive links but more negative links in the microbial networks at higher species richness levels, suggesting that the negative interspecific association may be increased, possibly induced by intensive resource competition. In this research system, soil microbes are functionally redundant[53], for example, each guild of microbes is in charge of one function of transforming N into different forms. In highly diverse N-transforming microbial communities, the available N in different forms may become a limited resource. As the richness of N-transforming microbial species increases, intensive competition may occur for N substrates. Competitive inhibition of the most productive species may consequently reduce their overall N transformation capability[54]. In addition, allelopathic competition may also be a possibility in explaining observed negative BEF relationships. For this point, this study does not provide direct evidence, but other studies can support that bacteria can produce bacteriocins to suppress the growth of others in communities with high species richness[55]. Soil N transformation involves a series of extracellular enzyme-driven processes. Secretion of extracellular enzymes is an energy-taxing process. If intense competition occurs in N-transforming communities with high species richness, more energy may be allocated to antagonistic interactions than to the growth and production of extracellular enzymes[56,57].
The current results suggest that a negative selection effect may also occur in more diverse nitrogen-transforming communities. For example, the relative abundance (reflecting biomass) of some keystone species or the dominant module increased with species richness; however, a negative relationship was observed between their relative abundance and functional potential, suggesting that they may have a poor functional contribution. These observations are consistent with the assumption that a negative selection effect occurs when a species' competitive ability is a poor predictor of their function[18,30]. They predicted that competition from other poorly-performing functional species would reduce the relative abundance of keystone species, and consequently, the overall community functioning as species diversity increased. However, the results showed the opposite pattern; species diversity had a positive effect on the relative abundance of keystone species or dominant modules, indicating that complementary effects may also occur for their growth (biomass production). This supports the idea that the direction of the BEF relationship is dependent on the identity of the ecosystem functions selected; a positive BEF relationship is more common for biomass production, but non-biomass functions may occur more easily with negative BEF relationships.
The causal relationship analyses showed that most of these keystone species did not produce direct functional impacts but operated in transmitting roles between modules in the microbial networks[58]. The positive effect of species diversity on keystone species was first transmitted to functionally poor-performing modules, which exerted negative effects on functionally well-performing modules and, hence, overall ecosystem function. This type of biotic interaction among keystone taxa has been proven to be stable and exceeds the effect of environmental variables in determining the microbial community; for example, bacterial taxa are more strongly related to other bacterial taxa than to habitat variables[59]. However, biotic interactions among keystone taxa are context-dependent. For example, environmental disturbances can, to some extent, decrease the explanatory power of keystone taxa in stabilizing microbial communities[60]. The underlying mechanism is that intercorrelated taxa could have similar or different niches; therefore, the positive or negative correlation might vary owing to simultaneous responses to environmental variation.
Considering that the findings (negative) were inconsistent with most BEF research (positive) as well as those of other researchers who argued that positive BEF relationships only occurred at low diversity levels[54], a conceptual model was proposed (Fig. 5) to reconcile the different directions of reported BEF relationships with positive, neutral, or negative effects. In this opinion, the form of the BEF relationship depends on the scale of the diversity. Four key points, a, b, c and d, were defined along the species richness gradient. Five types of BEF relationships covered the species richness range. Type I: ecosystem function increased exponentially or linearly with species richness when ≤ a. There are several examples that support this assumption, for example, methanotrophic species richness on methane oxidation, cellulolytic bacterial species richness on cellulose decomposition. The complementary effect may be dominant, whereas the positive selection effect may be minor at this diversity level with sufficient resources. Type II: ecosystem function increased asymptotically with species richness when > a, but ≤ b, which can be supported by species richness of arbuscular mycorrhizal fungi on plant production[61,62]. Within this diversity range, the positive selection effect may gradually intensify. Type III: when b < species richness ≤ c, ecosystem function showed no response as species richness increased. At this diversity level, the resource consumption may reach the maximum resource support capacity. Positive selection effects may co-occur with negative effects. Type IV: ecosystem function decreased asymptotically with species richness when c < species richness ≤ d. This assumption is supported by the decrease in the organic decomposition rate with increasing bacterial species richness. At this level of diversity, the resources are increasingly limited. Therefore, a negative selection effect may dominate. Resource scarcity becomes more severe as species richness increases. Resource competition may result in an exponentially or linearly decreasing relationship between species richness and ecosystem functions. This assumption is supported by the data on the diversity and function of N-transforming microbes here. The competitive effect may become dominant at this high diversity level (Fig. 5). Therefore, a positive BEF relationship may occur when species richness is < b (defined as a low diversity level), a neutral BEF relationship occurs when species richness is between b and c (median diversity level), and a negative BEF relationship may appear when species richness is > c (high diversity level).
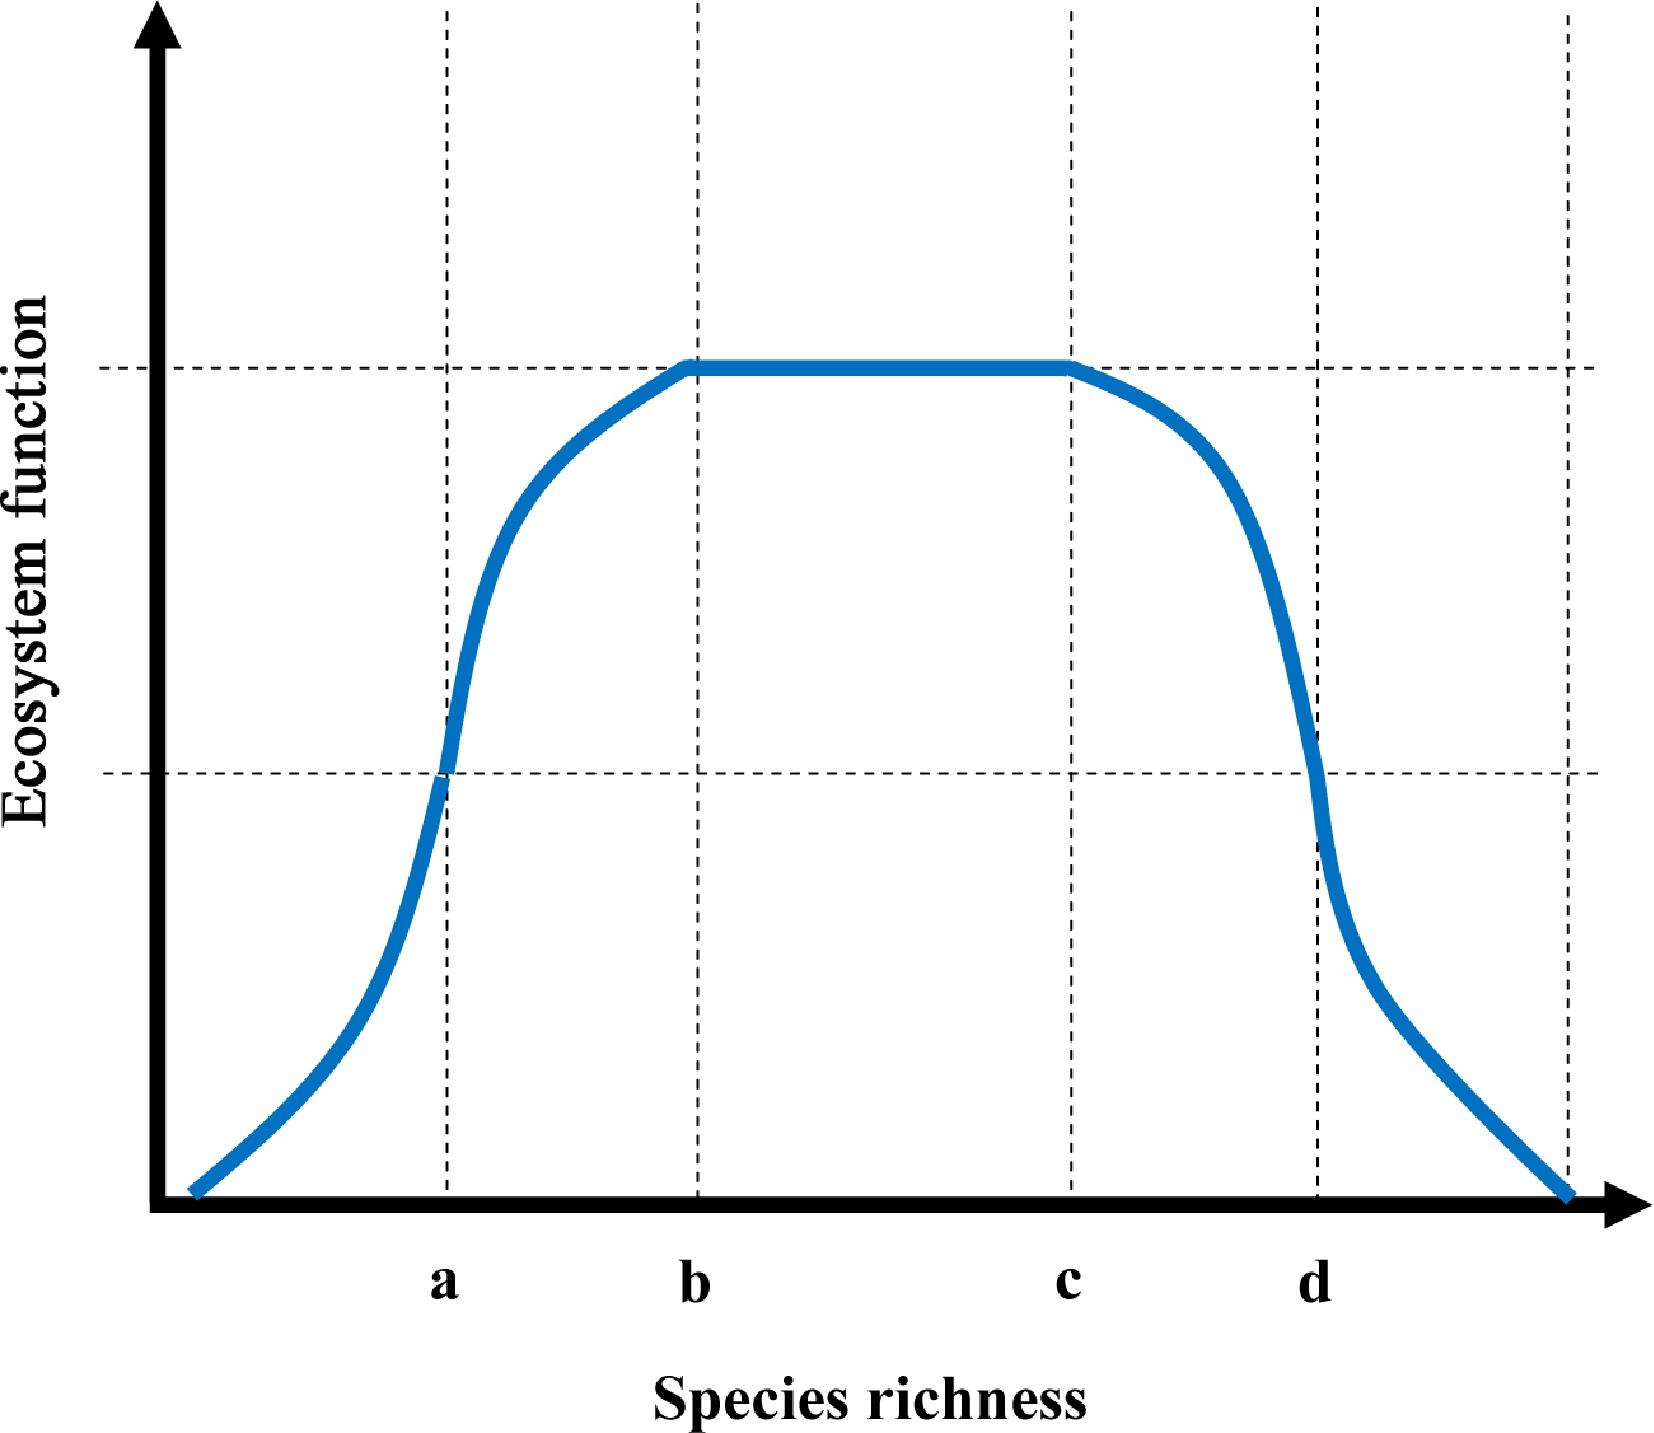
Figure 5.
A bell-shaped conceptual model for determining the relationship between species richness and ecosystem functioning.
Ecosystem functions refer to the functional performance, e.g., productivity, enzymatic activity, etc, which is responsible for certain steps of material cycling and energy flow mediated by biological communities. Here, a positive BEF relationship is hypothetical at low species richness (≤ b); a neutral BEF occurs at the median species richness level (> c, but ≤ d); and a negative BEF is hypothesized at high species richness (> d).Implications, limitations, and future directions
-
This study provides valuable insights into the biodiversity–ecosystem functioning (BEF) relationship in nitrogen-transforming microbial communities, which challenges the widely held assumption that higher microbial diversity invariably enhances ecosystem functioning. By demonstrating consistently negative BEF relationships for nitrogen-transforming guilds in a natural wetland, it is highlighted that (i) functional redundancy can be accompanied by intense inter-specific competition[53], (ii) the numerical dominance of keystone taxa may coincide with poor functional performance, and (iii) the shape of the BEF curve is likely context- and scale-dependent. These findings urge caution when using species richness as a proxy for service provision in soil-management policies[22], maximizing OTU counts will not necessarily maximize nitrogen-cycling rates. Finally, the bell-shaped BEF model proposed provides a testable framework for future studies that span low to hyper-diverse microbial systems and that couple metatranscriptomic or stable-isotope probing with community data to verify which detected taxa are genuinely active.
Several limitations should be acknowledged. Firstly, the suggestion that poor-performing dominant taxa represent a 'negative selection effect' (NSE) would be more convincing if supported by trait-level data (e.g., growth rate, enzyme activity, or gene expression). Current evidence is indirect and based solely on relative abundance and co-occurrence. Consequently, the inference remains indirect and should be regarded as a hypothesis to be tested with future quantitative proteomics or single-cell activity assays (e.g., BONCAT, NanoSIMS). Secondly, this study focused on gene abundance (e.g., nirK, nosZ) derived from metagenomic data, which reflects potential rather than realized functional activity. Transcriptional or enzymatic activity data would be needed to confirm whether detected taxa actively contribute to N-cycling processes under field conditions. Lastly, the study was conducted at a single spatial scale, potentially limiting the generalizability of the observed patterns across broader environmental gradients. Addressing these limitations in future studies—e.g., integrating multi-omics approaches, expanding spatial replication, and coupling genomic data with activity metrics—will refine the understanding of how microbial biodiversity shapes ecosystem functions across diverse environments.
-
Functional performance decreased with increasing species richness in functionally redundant N-transforming soil microbial communities. These observations are inconsistent with the widely accepted positive BEF relationships. Further analysis indicates that a negative selection effect and interspecific competition may concurrently generate negative BEF patterns. It was also found that the direction of BEF relationships may depend on the identity of the selected ecosystem. Positive BEF relationships have been reported mainly for biomass, reflecting productivity in plant communities with low diversity levels. However, the direction of the BEF relationship may shift when considering other ecosystem functions, such as nutrient transformation in this study, or in more diverse microbial communities. Therefore, it is proposed that the shape of the BEF relationship depends on the diversity gradient. Future studies should test these hypotheses by including different functional ecosystem processes under different diversity levels.
This work was supported by the Central Public-Interest Scientific Institution Basal Research Fund (Grant No. CAFYBB2019QB001), the National Key R&D Fund (Grant No. 2023YFF130440302), and the Natural Science Foundation of China (Grant No. 31870099).
-
The authors confirm their contributions to the paper as follows: conceptualization and experimental design: Yang H, Zhang Q, Liu S; data analysis and interpretation: Yang H, Liu E, Xie J, Zhang Q; data collection: Liu E, Xie J, Yang H, Zhang Q; manuscript drafting: Liu E, Xie J, Yang H. All authors reviewed the results and approved the final version of the manuscript.
-
The authors declare that they have no conflict of interest.
- Supplementary Table S1 Statistics of generalized linear mixed models including functional potential as dependent variable, species richness as fixed variable and vegetation type as random factor.
- Supplementary Table S2 Keystone taxa identified based on network analysis.
- Supplementary Fig. S1 Sampling site distribution along the Yangtze river (Zhang et al. 2022).
- Supplementary Fig. S2 The relative abundance of modules for nirK-type denitrifers.
- Supplementary Fig. S3 Distribution of OTUs based on their network roles. Nodes in the network are classified as peripherals, module hubs, network hubs or connectors depending on their role in the network.
- Supplementary Fig. S4 The relative abundance of modules for nirK-type denitrifers.
- Copyright: © 2025 by the author(s). Published by Maximum Academic Press on behalf of Yunnan Agricultural University. This article is an open access article distributed under Creative Commons Attribution License (CC BY 4.0), visit https://creativecommons.org/licenses/by/4.0/.
-
About this article
Cite this article
Liu E, Xie J, Banerjee S, Goberna M, Jiang L, et al. 2025. Negative relationships between microbial diversity and functional performance during soil nitrogen transformation in a seasonally flooded marshland. Agrobiodiversity 2(4): 89−98 doi: 10.48130/abd-0025-0012 

Negative relationships between microbial diversity and functional performance during soil nitrogen transformation in a seasonally flooded marshland
- Received: 30 June 2025
- Revised: 06 November 2025
- Accepted: 10 November 2025
- Published online: 22 December 2025
Abstract:
A positive biodiversity–ecosystem functioning (BEF) relationship is frequently reported for biotic communities with low diversity levels. However, whether this is also true for highly diverse soil microbial communities remains unclear. The study explored the BEF relationships between species richness and nitrogen (N)-transforming capability of nirK- and nirS-nitrite reducers, nitrous oxide reducers, and nitrite oxidizer communities in soils from five different vegetation types. The results consistently indicated negative BEF patterns in these N-transforming microbes. The relative abundance of keystone taxa from co-occurrence networks increased substantially with species richness but was negatively correlated with functional performance. Network complexity decreased in communities with high species richness. These findings suggest that negative selection and biotic competition may simultaneously generate negative BEF patterns. A conceptual model was also proposed in which the BEF relationship followed a quadratic curve that varied with the level of diversity. Microbial diversity is crucial for maintaining the balance of ecological systems because microorganisms play key roles in nutrient cycling and other essential biogeochemical processes. Recent studies have shown that increased diversity may not always lead to improved ecosystem function. The current study indicated that function decreased with species richness in soil N-transforming bacterial communities. Keystone taxa were positively correlated with species richness but negatively correlated with function. Community complexity decreased with increasing species richness. These findings suggest that both negative selection effects and biotic competition may simultaneously generate negative biodiversity–ecosystem functional relationships.
-
Key words:
- Biodiversity /
- Ecosystem functioning /
- Nitrogen cycling /
- Soil microbes /
- Keystone species /
- Complexity