


-
The worldwide generation of food waste by households, restaurants, markets, and food processing industries has become a significant environmental concern due to its large volume, pollution potential, and potential health risks to humans[1,2]. Anaerobic digestion (AD) is a biochemical conversion process occurring without oxygen that effectively treats and utilises food waste to produce biogas[3,4]. Conventional AD usually uses a single-phase digester, but this configuration often suffers from slow conversion rates, limited stability, and high sensitivity to changes in microbial populations and process conditions[5,6]. As a result, biogas produced in single-phase AD tends to have high CO2 content, lower energy density, and less favourable combustion properties, which reduces its value for heat and power generation[7−9]. To overcome these issues, the two-phase anaerobic digestion (TPAD) system was developed. TPAD separates the digestion into two sequential steps: the first producing hydrogen (H2), and the second producing methane (CH4). This division enables each phase to operate under conditions that support specific microbial communities, improving the yields of H2 and CH4 individually.
Earlier studies have primarily examined TPAD systems at the bench scale, assessing each phase separately[10,11]. However, these studies have generally involved short-term trials, and there is limited insight into how biochar performs in long-duration, semi-continuous systems[10,11]. For large-scale biogas production, semi-continuous processes are applied to maintain steady H2 and CH4 generation. In these setups, the first reactor is inoculated and fed with food waste to produce hydrogen. After fermentation, the liquid output from the first reactor is sent into the second reactor to be used as the substrate for methane production[7,12]. This sequential feeding strategy allows continuous recovery of both gases. To achieve higher gas yields, the organic loading rate (OLR) is increased in both reactors. Nonetheless, the maximum OLR attainable in semi-continuous TPAD remains significantly lower than in conventional AD. The performance of biochar in such systems, especially under elevated OLRs, remains underexplored. This limitation can lead to acid build-up and declining pH, conditions that inhibit microbial performance and reduce hydrogen and methane outputs[13]. Chemical buffers like NaHCO3, CaCO3, and lime mud are often added to counteract acidification, but these additives are costly and can negatively impact microbial ecosystems[14].
Biochar has emerged as a viable alternative additive for AD, demonstrating significant buffering capacity[15], cost-effectiveness[15], and serving as a sustainable carbon-based material[14,16]. This carbon-rich substance is produced by thermally treating biomass and is characterised by its stable structure, high porosity, and large surface area[2]. In small-scale TPAD experiments, biochar addition has been shown to significantly improve hydrogen and methane generation. The observed increases in gas output are linked to several factors: enhanced buffering of pH fluctuations[17,18], provision of surfaces for microbial attachment[7], stimulation of syntrophic interactions[19], and facilitation of interspecies electron transfer[20]. Our previous work examined biochar's role in boosting H2 and CH4 yields in 100 mL batch reactors[10,11]. Nevertheless, most of the research in this area has centred on bench-scale tests, with limited studies addressing semi-continuous production performance.
This study examines the influence of biochar supplementation on H2 and CH4 production in semi-continuous stirred tank TPAD reactors operated at varying OLRs. The work aims to clarify how biochar addition impacts gas yield, production kinetics, and microbial community dynamics during semi-continuous digestion. The findings are intended to support scaling up TPAD processes and integrating biochar use in food waste treatment applications.
-
White bread was utilised to mimic food wastewater in AD. Prior to being used as the substrate in the bioreactor, the bread was cut into approximately 1 mm pieces. The inoculum was obtained from sludge sourced at the Woodman Point Wastewater Treatment Plant in Western Australia. Pinewood biochar was generated by pyrolysis at 650 °C in an indirectly heated kiln, held for 20 min. The resulting material was milled in a stainless-steel ring grinder to achieve particles smaller than 25.9 µm, with a median diameter near 12 µm. The biochar was dried at 105 °C prior to use. Elemental composition (C, H, N, S), total solids (TS), and volatile solids (VS) of the biochar and bread were measured following ASTM D3176 standards and are summarised in Table 1. The Brunauer–Emmett–Teller (BET) specific surface area and pore volumes were determined using a Micrometrics TriStar II 3020 analyser after degassing samples under vacuum at 200 °C for 24 h. Table 1 also shows the proximate and ultimate analytical results.
Table 1. Characteristics of the food waste and biochar
Parameter Food waste Biochar 650 °C Carbon (%) 42.7 67.37 Nitrogen (%) 2.3 0.75 Hydrogen (%) 9.1 1.05 Sulphur (%) 0.3 0.1 C/N ratio 18.6 89.8 Total solids (%) 61.2 96.6 Volatile solids (%) 59.5 83.7 pH 4.9 8.47 Particle size distribution (µm) ND 3.5–25.9 BET surface area (m2/g) ND 265.34 Pore volume (cm3/g) 0.108 ND: not determined. TPAD experimentation
-
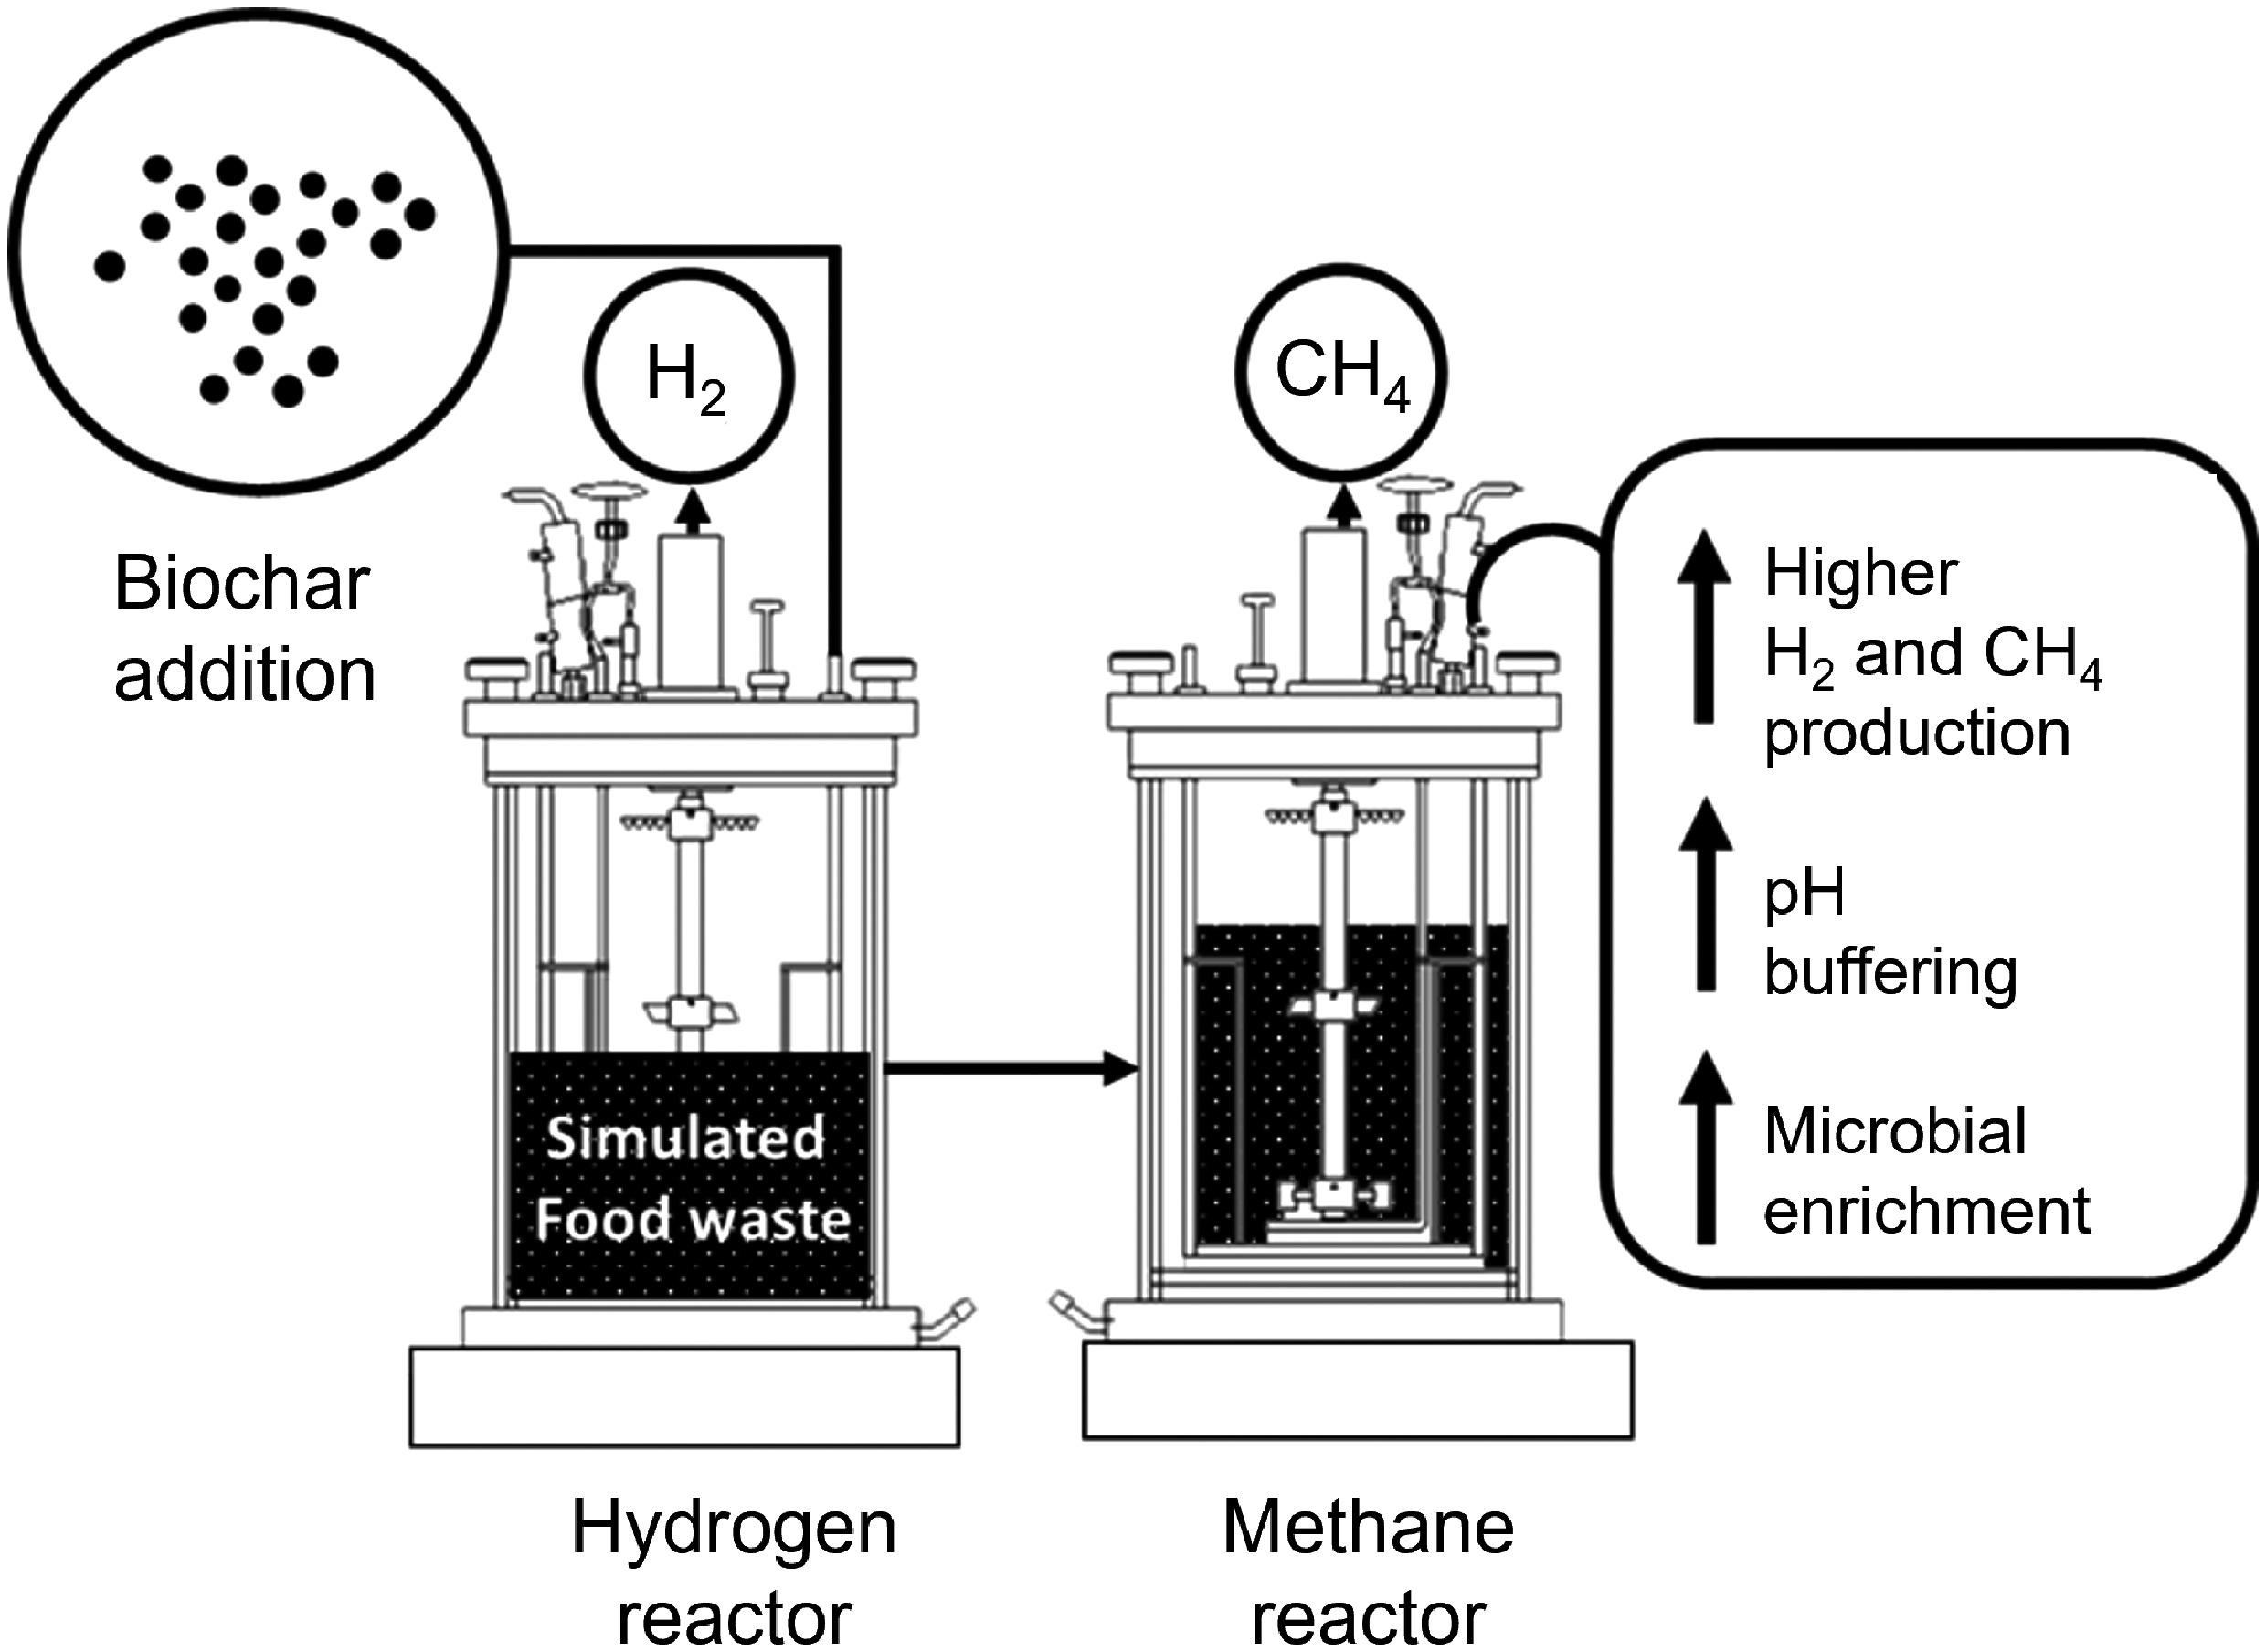
Two 5 L continuous stirred tank reactors (CSTRs) were used for the TPAD experiments: Reactor 1 (R1) for hydrogen production, and Reactor 2 (R2) for methane generation. The operating parameters, temperature, pH, and mixing followed the conditions described in earlier work[17]. The study included two experimental series: one without biochar addition, and the other with biochar supplementation. Figure 1 shows the schematic of the CSTR configuration. Reactor control was achieved using a Siemens programmable system equipped with sensors to monitor and adjust pH, temperature, dissolved oxygen (DO), and agitation speed. A mechanical defoaming blade was fitted to prevent foam build-up. All glass reactor chambers were sanitised with 70% ethanol before start-up to minimise microbial contamination. Each reactor's experiments were organised into seven stages. Initially, R1 and R2 were operated separately across stages I–V and then run semi-continuously during stages VI and VII. During the semi-continuous phase, effluent withdrawn from R1 in stage VI was used as feed for R2 in the same stage, with the process repeated in stage VII. Daily 15 mL samples were taken from each reactor to analyse VFAs and microbial populations. Sampling ports were purged with nitrogen gas to maintain anaerobic conditions and to check for leaks.
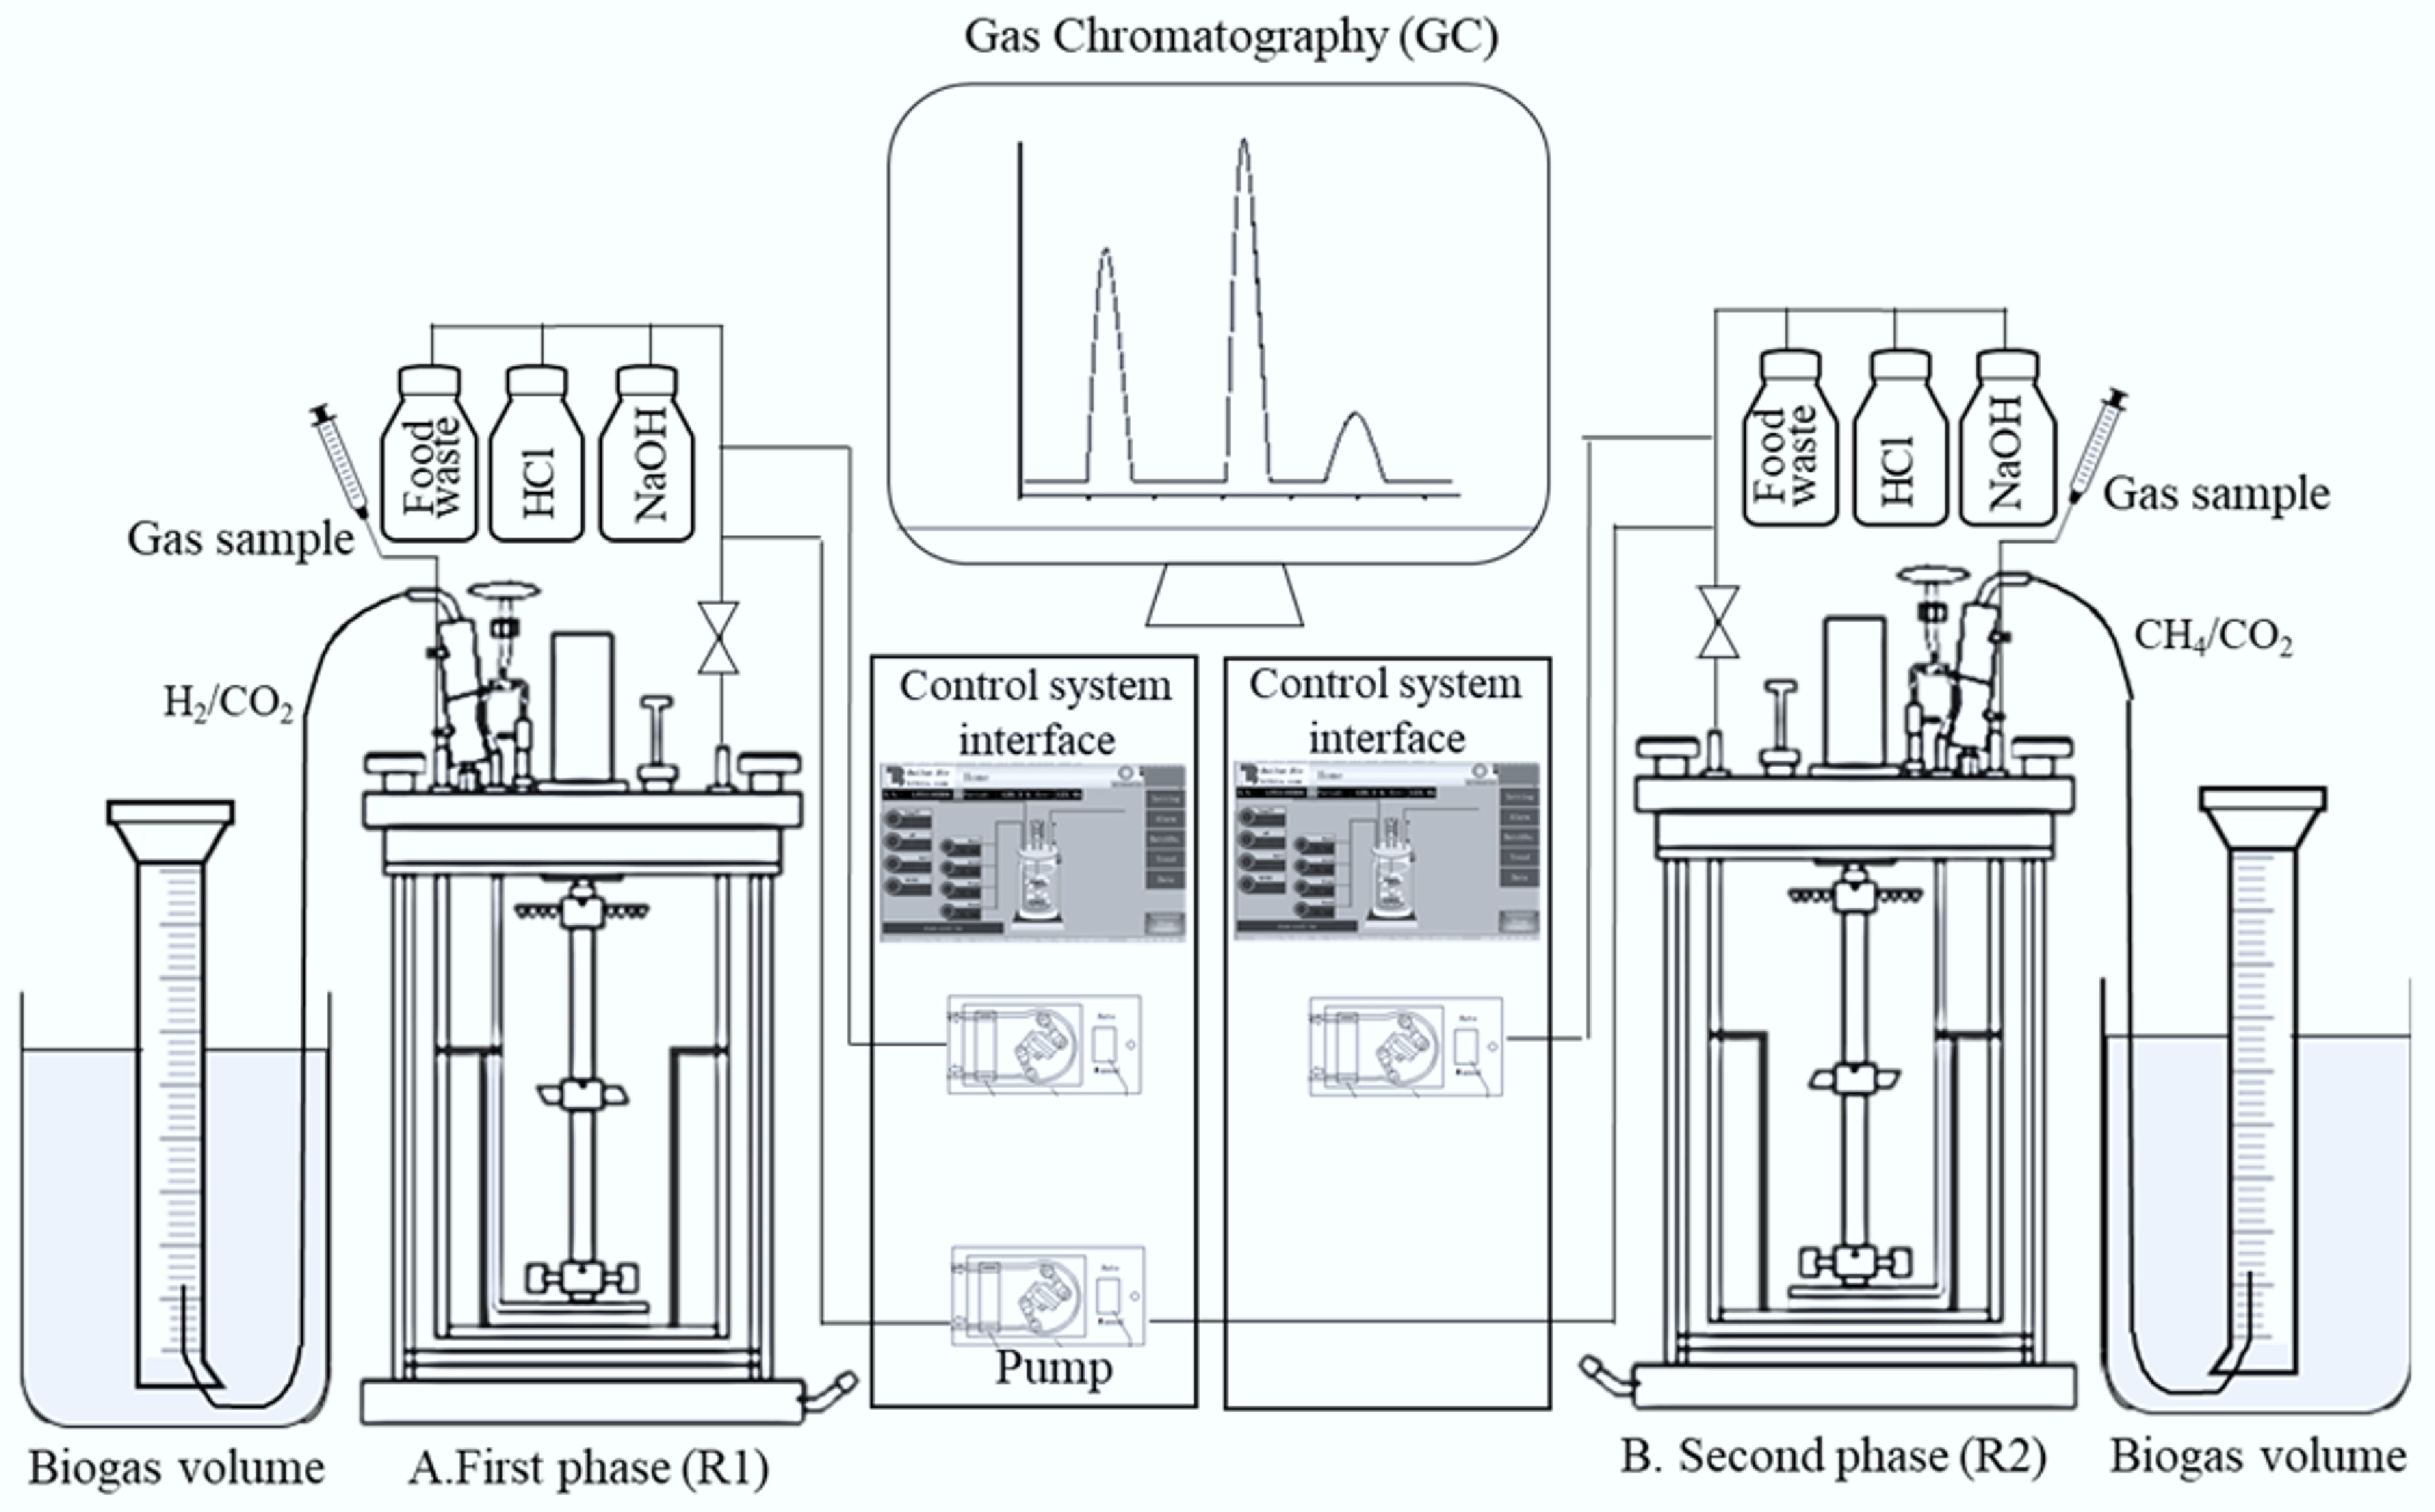
Figure 1.
Schematic representation of the TPAD system showing that A: R1 operated with or without biochar supplementation; B: R2 operated with or without biochar supplementation.
H2 production in R1 was carried out across seven stages, detailed in Table 2. The reactor was maintained at 37 °C, with temperature fluctuations recorded throughout. Mixing was kept constant at 20 rpm to ensure proper homogenization. The feed mixture consisted of 400 mL of sludge, 3 g of bread, and 1.6 L of water, yielding a total working volume of 2 L (40% of the vessel volume), leaving 60% headspace for gas collection. Before inoculation, the sludge was heat-treated at 95 °C for 30 min to eliminate residual methanogens. The starting pH was set to 6.4 by adding HCl or NaOH.
Table 2. Summary of experimental conditions
Reactor Stage OLR
(g VS/(L·d))HRT (d) Operation time (d) Biochar addition (g/L) R1 without biochar I 0.5 3 30 0 II 1 3 10 0 III 2 3 10 0 IV 3 3 10 0 V 4 3 10 0 VI 4 3 20 0 VII 6 3 10 0 R2 without biochar I 0.5 10 30 0 II 1 10 10 0 III 2 10 10 0 IV 3 10 10 0 V 4 10 10 0 VI 4 10 20 0 VII 6 10 10 0 R1 with biochar I 0.5 3 30 15 II 1 3 10 15 III 2 3 10 15 IV 3 3 10 15 V 4 3 10 15 VI 4 3 20 15 VII 6 3 10 15 R2 with biochar I 0.5 10 30 15 II 1 10 10 15 III 2 10 10 15 IV 3 10 10 15 V 4 10 10 15 VI 4 10 20 15 VII 6 10 10 15 In Stage I, the OLR was fixed at 0.5 g VS/(L·d) over 30 d. Every 12 h, 334 mL of reactor effluent (corresponding to a hydraulic retention time of 3 d) was withdrawn and mixed back with fresh feed to facilitate microbial acclimation. From Stages II through V, the OLR was gradually raised from 1.0 to 4.0 g VS/(L·d) in 10-d intervals. During these stages, 334 mL was extracted and replaced every 12 h to control VFA build-up. Each feed also included 20 mL of 1 M NaOH to maintain pH stability. Semi-continuous operation at OLRs of 4.0 and 6.0 g VS/(L·d) was performed in Stages VI (20 d) and VII (10 d), respectively. The 6.0 OLR level was selected in reference to earlier research findings[13]. Throughout the semi-continuous runs, the withdrawn effluent was transferred to R2, and the same volume was replenished with new feed.
Methane generation in R2 was carried out in parallel with hydrogen production in R1. Reactor 2 was kept at a stable temperature of 32 °C with stirring maintained at 20 rpm. The starting pH was adjusted to 7.8 by adding either HCl or NaOH. Hydraulic retention times (HRTs) for each methane production stage were determined based on preliminary trials. In Stage I, an OLR of 0.5 g VS/(L·d) was applied for 30 d by combining 600 mL of unheated sludge, 15 g of bread, and 2.4 L of water to achieve a 3 L working volume (60% of reactor volume). Compared to R1, R2 operated with lower OLRs and extended HRTs because methanogens typically grow more slowly than hydrogen-producing microbes[21]. During Stage I, 300 mL of reactor effluent was removed daily, mixed with fresh feed, and supplemented with 30 mL of 1 M NaOH to maintain pH. For Stages II through V, the OLR was gradually increased from 1.0 to 4.0 g VS/(L·d), with each stage lasting 10 d. From Stage II to VII, 300 mL of effluent was withdrawn and discarded every day (corresponding to an HRT of 10 d) to prevent the accumulation of volatile fatty acids. After completing Stages I–V, the reactors transitioned to semi-continuous operation: 20 d at 4.0 g VS/(L·d) (Stage VI) and 10 d at 6.0 g VS/(L·d) (Stage VII). In these phases, R2 was fed with effluent from R1 at 5-d HRT intervals. The longer HRT in methane production was necessary because of the slow proliferation rate of methanogenic archaea.
Analytical methods
-
Volumetric biogas output during both TPAD phases was monitored daily using a water displacement technique[10], which calculates gas volume from displaced water. Each day, gas samples were drawn using 10 mL glass syringes and analysed with an Agilent 7980 gas chromatograph (GC, Shanghai, China). The GC setup included a front thermal conductivity detector (TCD) (heater at 200 °C, reference flow: 7 mL/min, makeup flow: 3 mL/min), a back TCD (heater at 250 °C, reference flow: 10 mL/min, makeup flow: 5 mL/min), and a flame ionization detector (FID) (heater at 200 °C, hydrogen flow: 30 mL/min, air flow: 350 mL/min, makeup flow: 35.5 mL/min). H2 and CH4 production rates were calculated by multiplying the total biogas volume by their respective concentrations. Additionally, 1.5 mL liquid samples were collected daily to quantify VFAs and assess microbial profiles. The VFA analysis targeted nine organic acids: acetic, propionic, butyric, valeric, isobutyric, isovaleric, isocaproic, hexanoic, and heptanoic acids. Their proportions were determined by gas chromatography using an Agilent 7980 instrument fitted with a DG-WAX column (30 m × 250 mm × 0.25 mm) and FID (heater at 250 °C, hydrogen flow: 35 mL/min, air flow: 350 mL/min, makeup flow: 4 mL/min, total run time: 13 min)[7].
To better understand how microbial populations changed during semi-continuous TPAD, the genera and relative abundances of microbes in each reactor were assessed. For this purpose, 1 mL liquid samples were taken on the first and last days of each experimental run and stored at –20 °C until analysis. DNA extraction and microbial diversity profiling were performed by the Australian Genome Research Facility (AGRF). The diversity analysis was based on amplifying the V3–V4 regions of the 16S rRNA gene by PCR. PCR utilised primer pairs (341F) 5'-CCTAYGGGRBGCASCAG-3' and (806R) 5'-GGACTACNNGGGTATCTAAT-3'. Taxonomic identification was achieved via high-throughput sequencing on an Illumina MiSeq platform (San Diego, CA, USA). Sequences were clustered into operational taxonomic units (OTUs) using a 97% similarity threshold, and taxonomy was assigned in Quantitative Insight Into Microbial Ecology (QIIME) with the Greengenes database[22].
-
Figure 2 shows the hydrogen production rates for reactors with and without biochar during semi-continuous operation. Methane was not detected in the initial TPAD stage in R1, confirming that sludge heating and temperature control were effective. Although gas generation began on day 1, H2 levels were initially very low. Hydrogen production started on day 2 of Stage I, with RH increasing before levelling off over time in all setups. In Stage II, H2 output continued to rise as the OLR increased from 0.5 to 1 g VS/(L·d) and the HRT was shortened from 3 to 2 d. Across Stages III to V, both H2 concentration and production further improved with OLR gradually raised from 2.0 to 4.0 g VS/(L·d). Notably, biochar-amended reactors consistently had higher RH compared to controls. For example, in Stage I, the average RH with biochar reached 92.3 mL/d, 87.9% above the control, and the biogas contained 30.3% hydrogen (Table 3). By Stage V, biochar reactors maintained an RH 45.7% greater (1,092.1 mL/d) than controls (749.6 mL/d). During Stage VI semi-continuous operation, biochar reactors averaged 1,252.8 mL/d hydrogen, approximately 45% higher than controls (863.7 mL/d). When OLR rose from 4.0 to 6.0 g VS/(L·d) in Stage VII, the control's RH declined markedly, reaching only 730.1 mL/d by day 100. In contrast, biochar reactors maintained steady H2 production without decline in Stage VII.
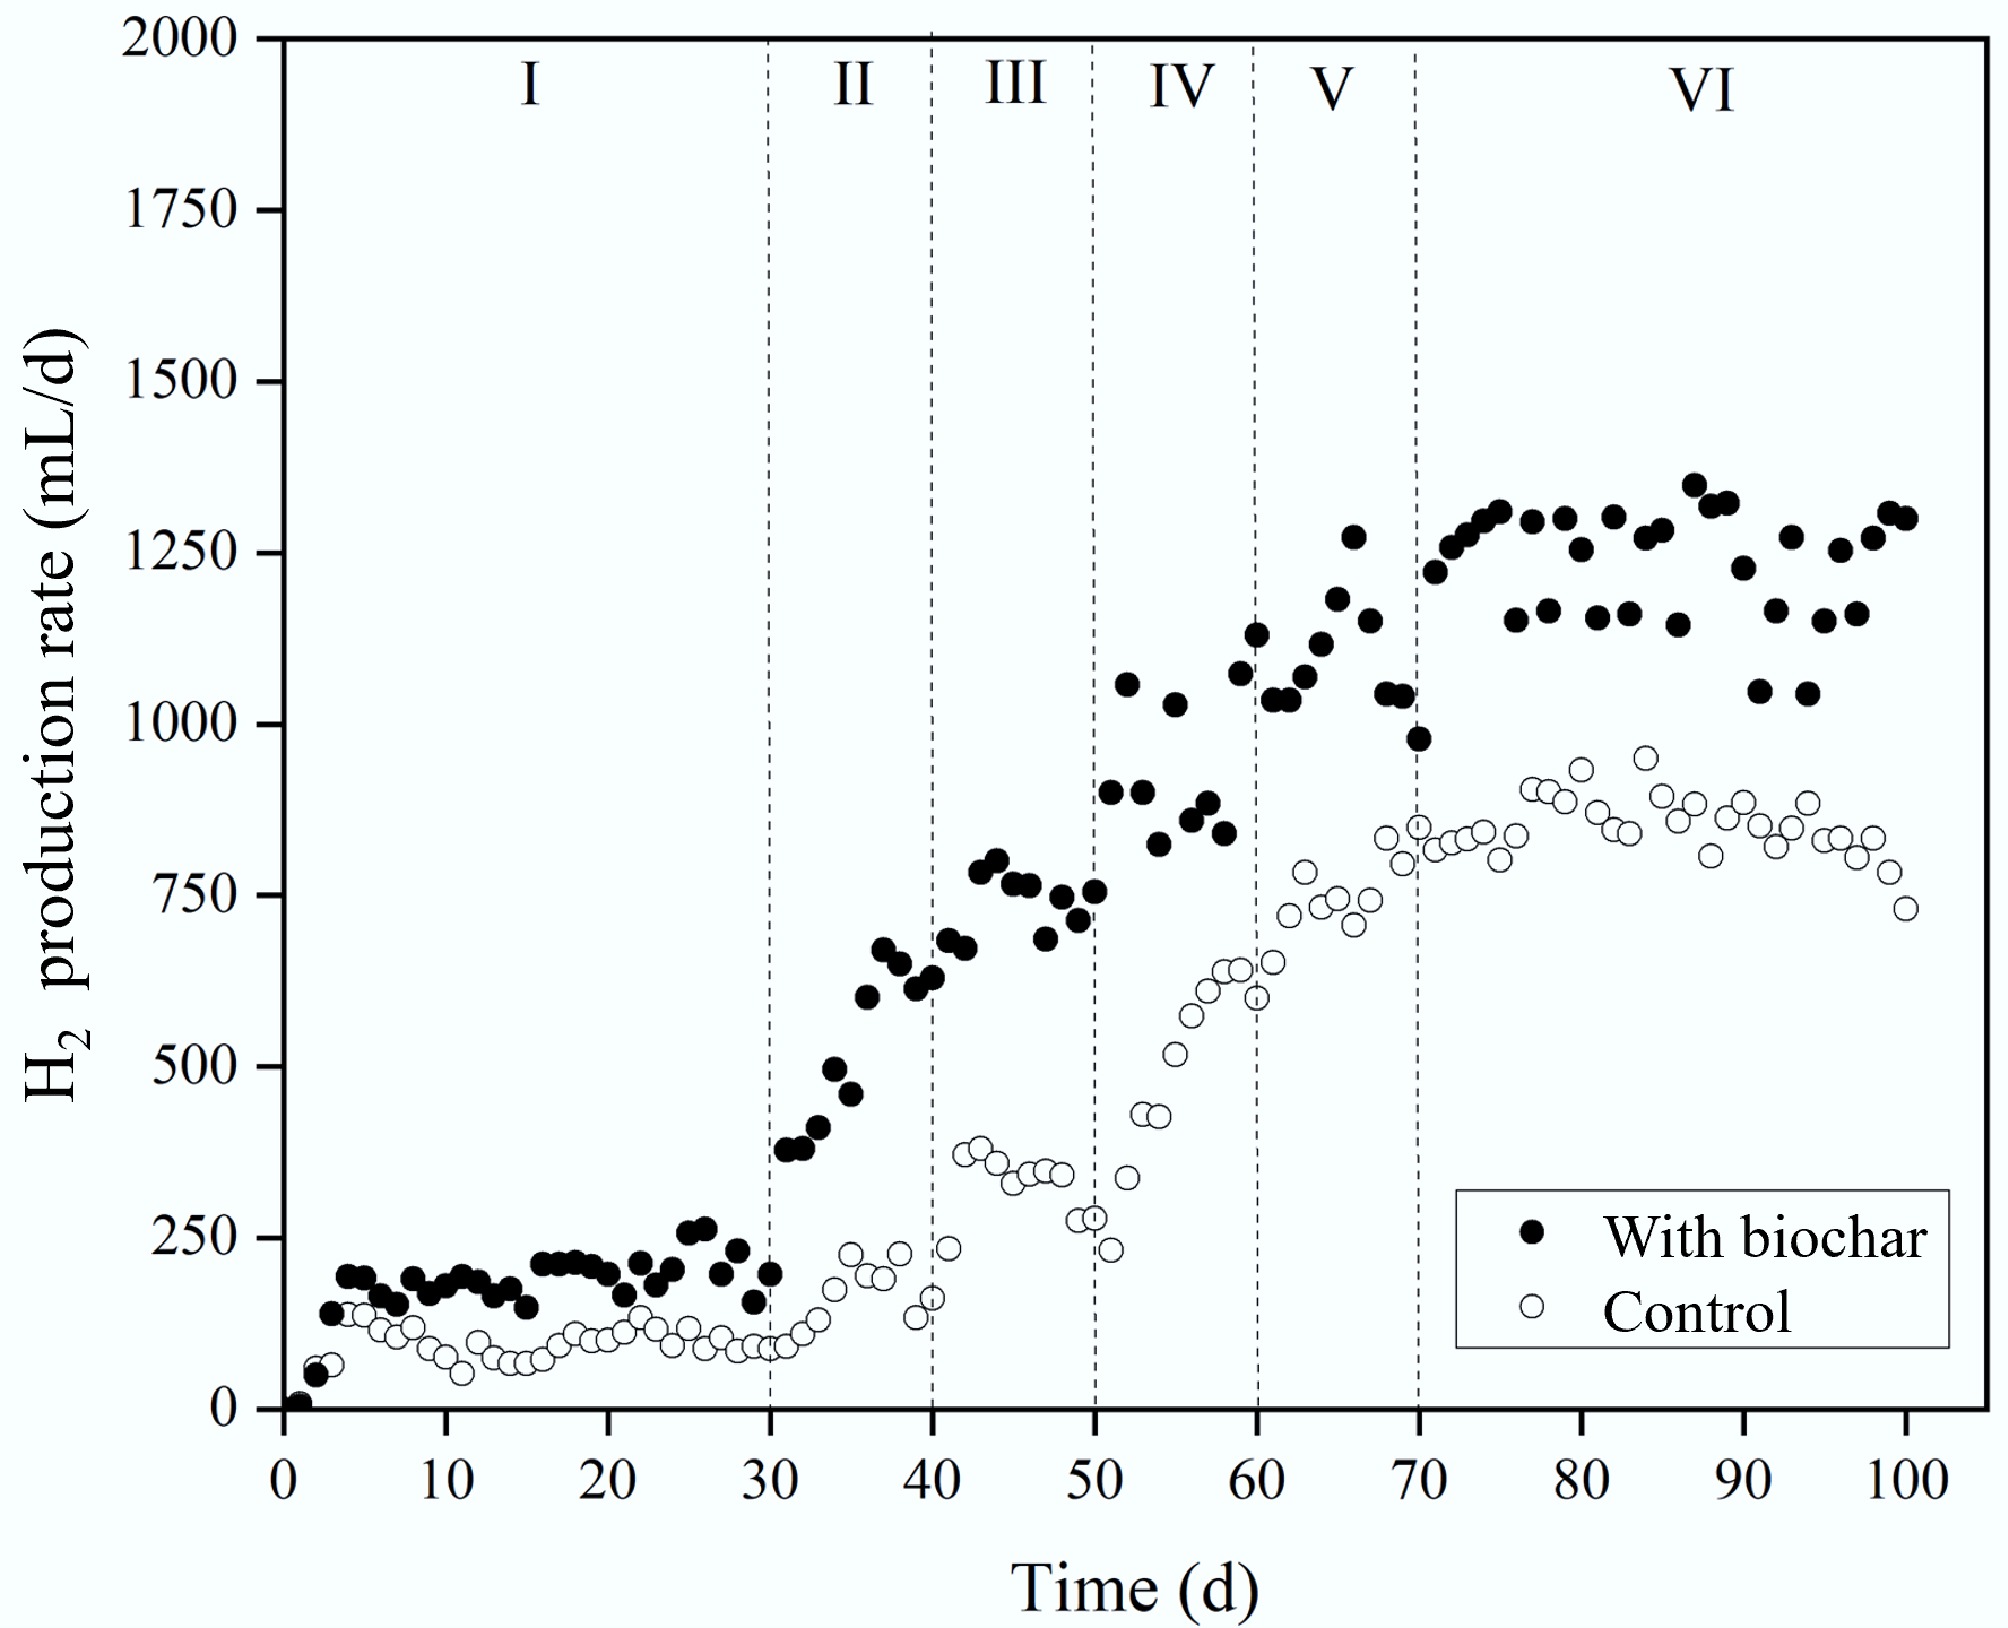
Figure 2.
Effect of biochar addition on H2 production rate.
Table 3. Performance of reactor during H2 and CH4 production
Reactor Stage Gas composition Biogas production rate (L·d) YH (mL/g VS) YM (mL/g VS) pH H2 (%) CH4 (%) CO2 (%) R1 without biochar I 30.26 0.63 69.15 302 92.74 0 4.9 ± 0.1 II 33.61 0.37 66.01 480 81.71 0 5.0 ± 0.3 III 43.76 0 56.23 682 81.40 0 5.1 ± 0.1 IV 47.82 0 51.96 1,116 82.59 0 5.1 ± 0.1 V 49.38 0 50.61 1,488 93.72 0 5.0 ± 0.3 VI 50.44 0 49.55 1,647 107.82 0 5.1 ± 0.2 VII 41.47 0 51.53 1,510 90.96 0 4.8 ± 0.3 R2 without biochar I 14.04 37.71 48.24 147 0 99.97 6.2 ± 0.1 II 0 64.77 35.22 353 0 140.20 6.7 ± 0.2 III 0 74.14 25.86 564 0 152.96 6.8 ± 0.3 IV 0 73.26 26.73 1,062 0 172.71 6.7 ± 0.1 V 0 72.62 27.38 1,736 0 212.69 6.8 ± 0.3 VI 0 74.41 25.58 1,801 0 227.63 6.8 ± 0.1 VII 0 62.13 28.87 1,621 199.71 6.2 ± 0.4 R1 with biochar I 37.37 0.35 61.31 467 138.36 0 5.4 ± 0.1 II 45.17 0 54.82 1158 146.25 0 5.5 ± 0.2 III 50.71 0 49.28 1,462 164.24 0 5.5 ± 0.3 IV 50.14 0 49.85 1,890 168.24 0 5.5 ± 0.1 V 51.58 0 48.41 2,115 176.51 0 5.6 ± 0.1 VI 53.15 0 46.84 2,320 189.73 0 5.6 ± 0.2 VII 52.42 0 47.58 2,329 183.59 0 5.4 ± 0.3 R2 with biochar I 14.51 39.66 47.44 648 0 199.13 6.8 ± 0.1 II 0 74.04 25.96 1,104 0 224.27 7.1 ± 0.2 III 0 76.36 23.63 1,654 0 312.48 7.2 ± 0.1 IV 0 77.63 22.36 1,867 0 315.16 7.3 ± 0.1 V 0 80.24 19.75 2,215 0 394.54 7.3 ± 0.2 VI 0 81.21 17.24 2,383 0 407.17 7.4 ± 0.2 VII 0 80.65 19.35 2,361 0 374.24 7.3 ± 0.2 The reduction in RH observed in controls, especially during Stage VII, suggests the pH was shifting away from the optimal 5.5–6.5 range. Figure 3 displays pH trends in the first TPAD phase. Initially, all reactors were adjusted to pH 6.4 to favour hydrogen-producing bacteria. During Stage I, pH decreased in all reactors as bacterial metabolism generated VFAs. However, the pH in controls dropped more sharply to 4.9 compared to 5.2 in biochar-treated reactors. Between Stages II and V, the control pH stabilised near 5.0, while biochar reactors maintained a higher average of 5.5, indicating that biochar buffered pH more effectively and kept conditions closer to the optimal range[23]. Rising OLRs did not significantly impact pH trends. No notable pH differences were detected between Stage VI semi-continuous operation and the earlier stages. In Stage VII, while biochar reactors held steady at pH 5.5, the controls dropped further to 4.5, diverging from the favourable pH for hydrogen bacteria (5.5–6.5). The steady pH in biochar treatments underscores its buffering role[24], likely due to surface functional groups (carboxyl, hydroxyl) and ash content rich in elements (Fe, Ca, K, Mg, Na, Al) that contribute to alkalinity[10,16].
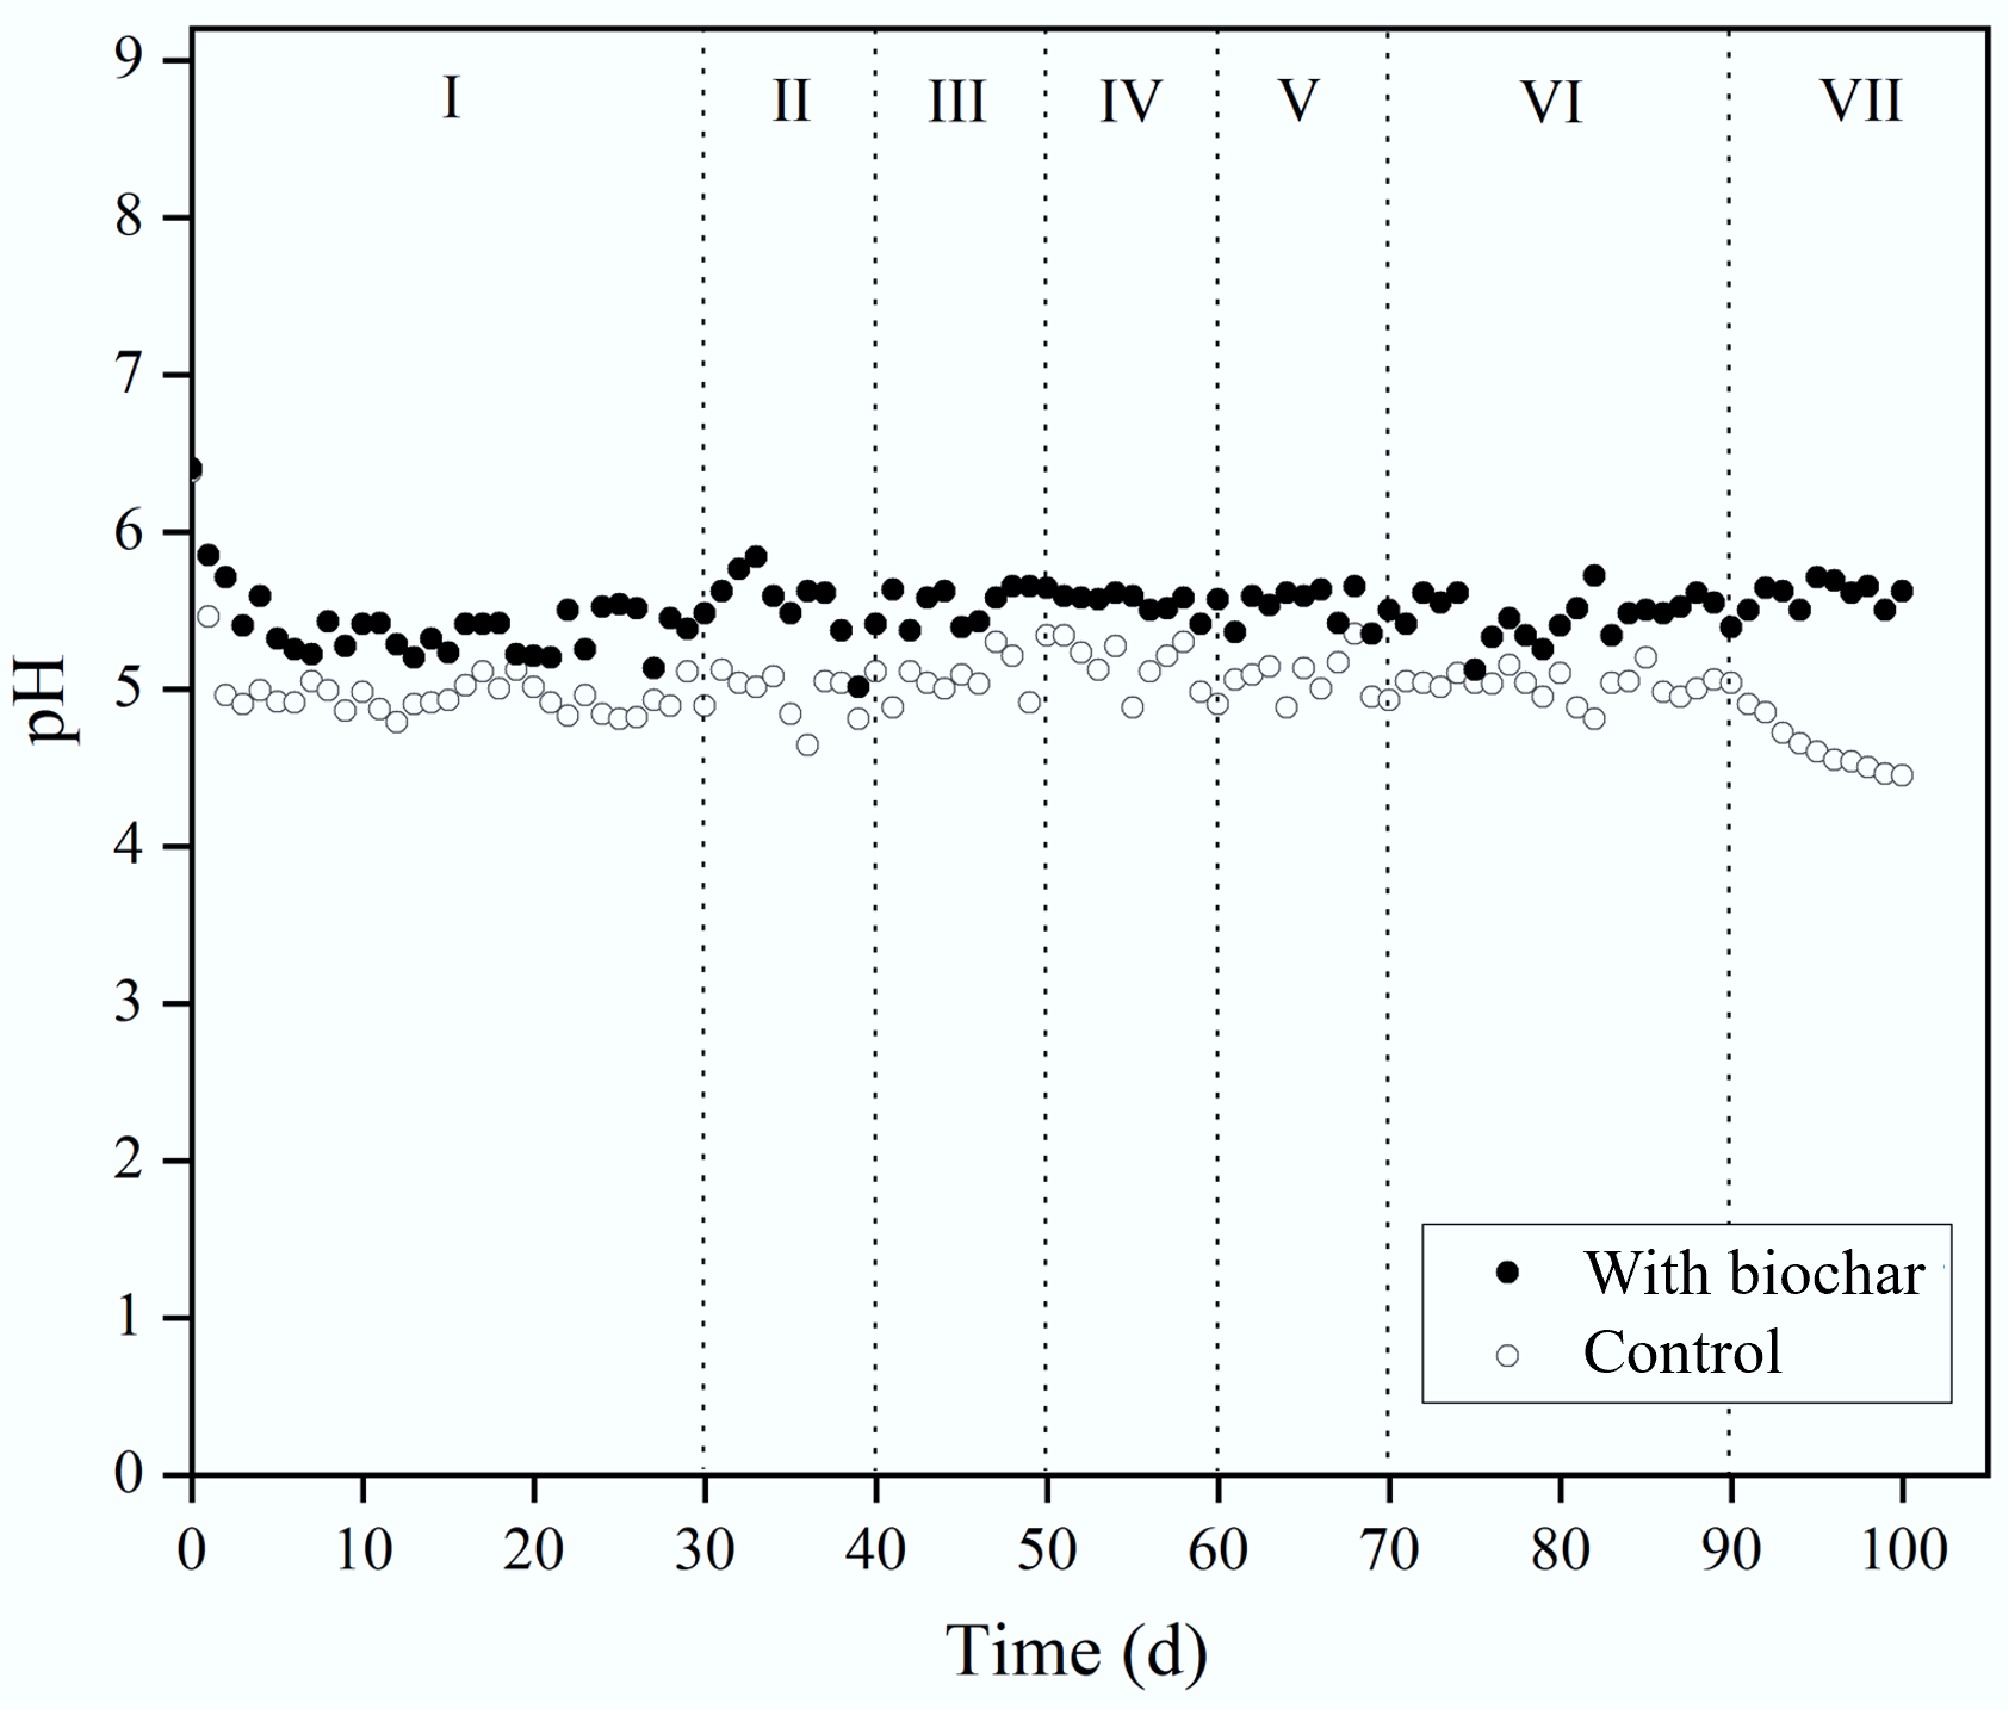
Figure 3.
Effect of biochar addition on pH during H2 production.
The pH decline observed can be attributed to VFA accumulation during the experiments. Figure 4 presents VFA profiles across all stages. In Stage I, low amounts of acetic, butyric, and propionic acids were detected. In Stage II, VFA levels rose when OLR increased from 0.5 to 1.0 g VS/(L·d) and HRT decreased from 3 to 2 d. Acetic and butyric acids dominated, with propionic acid in lower quantities. Stages III to V saw further rises in these acids as OLRs increased. During Stage VI, the acetic-to-butyric acid ratio surpassed 1.0, indicating acetate fermentation as the main H2 pathway[22]. Notably, acetic and butyric acid production was higher in biochar-treated reactors, suggesting biochar promoted substrate breakdown into VFAs. According to Zhang et al., biochar can enhance metabolism by providing surfaces for biofilm formation and improving hydrogen transfer[25]. In Stage VII, both treatments showed higher VFA levels due to OLR increasing from 4 to 6 g VS/(L·d), but the control reactor had the highest VFA accumulation. Increases in acetic, butyric, and propionic acids in controls reached 16%, 19%, and 98%, respectively, accompanied by a drop in pH to 4.5 and a decline in H2 production by approximately 15% compared to Stage VI (from 863.7 to 730.1 mL/d). In contrast, biochar reactors showed smaller increases of 9%, 7%, and 7%, with pH maintained at 5.4 and hydrogen production remaining stable (from 1,252.8 to 1,250.2 mL/d). These quantitative comparisons confirm that biochar not only moderates VFA accumulation but also buffers against acidification and performance inhibition at high OLRs. This mitigation likely arose from biochar supplying trace minerals to support bacterial metabolism and offering surfaces that promoted VFA degradation[7].
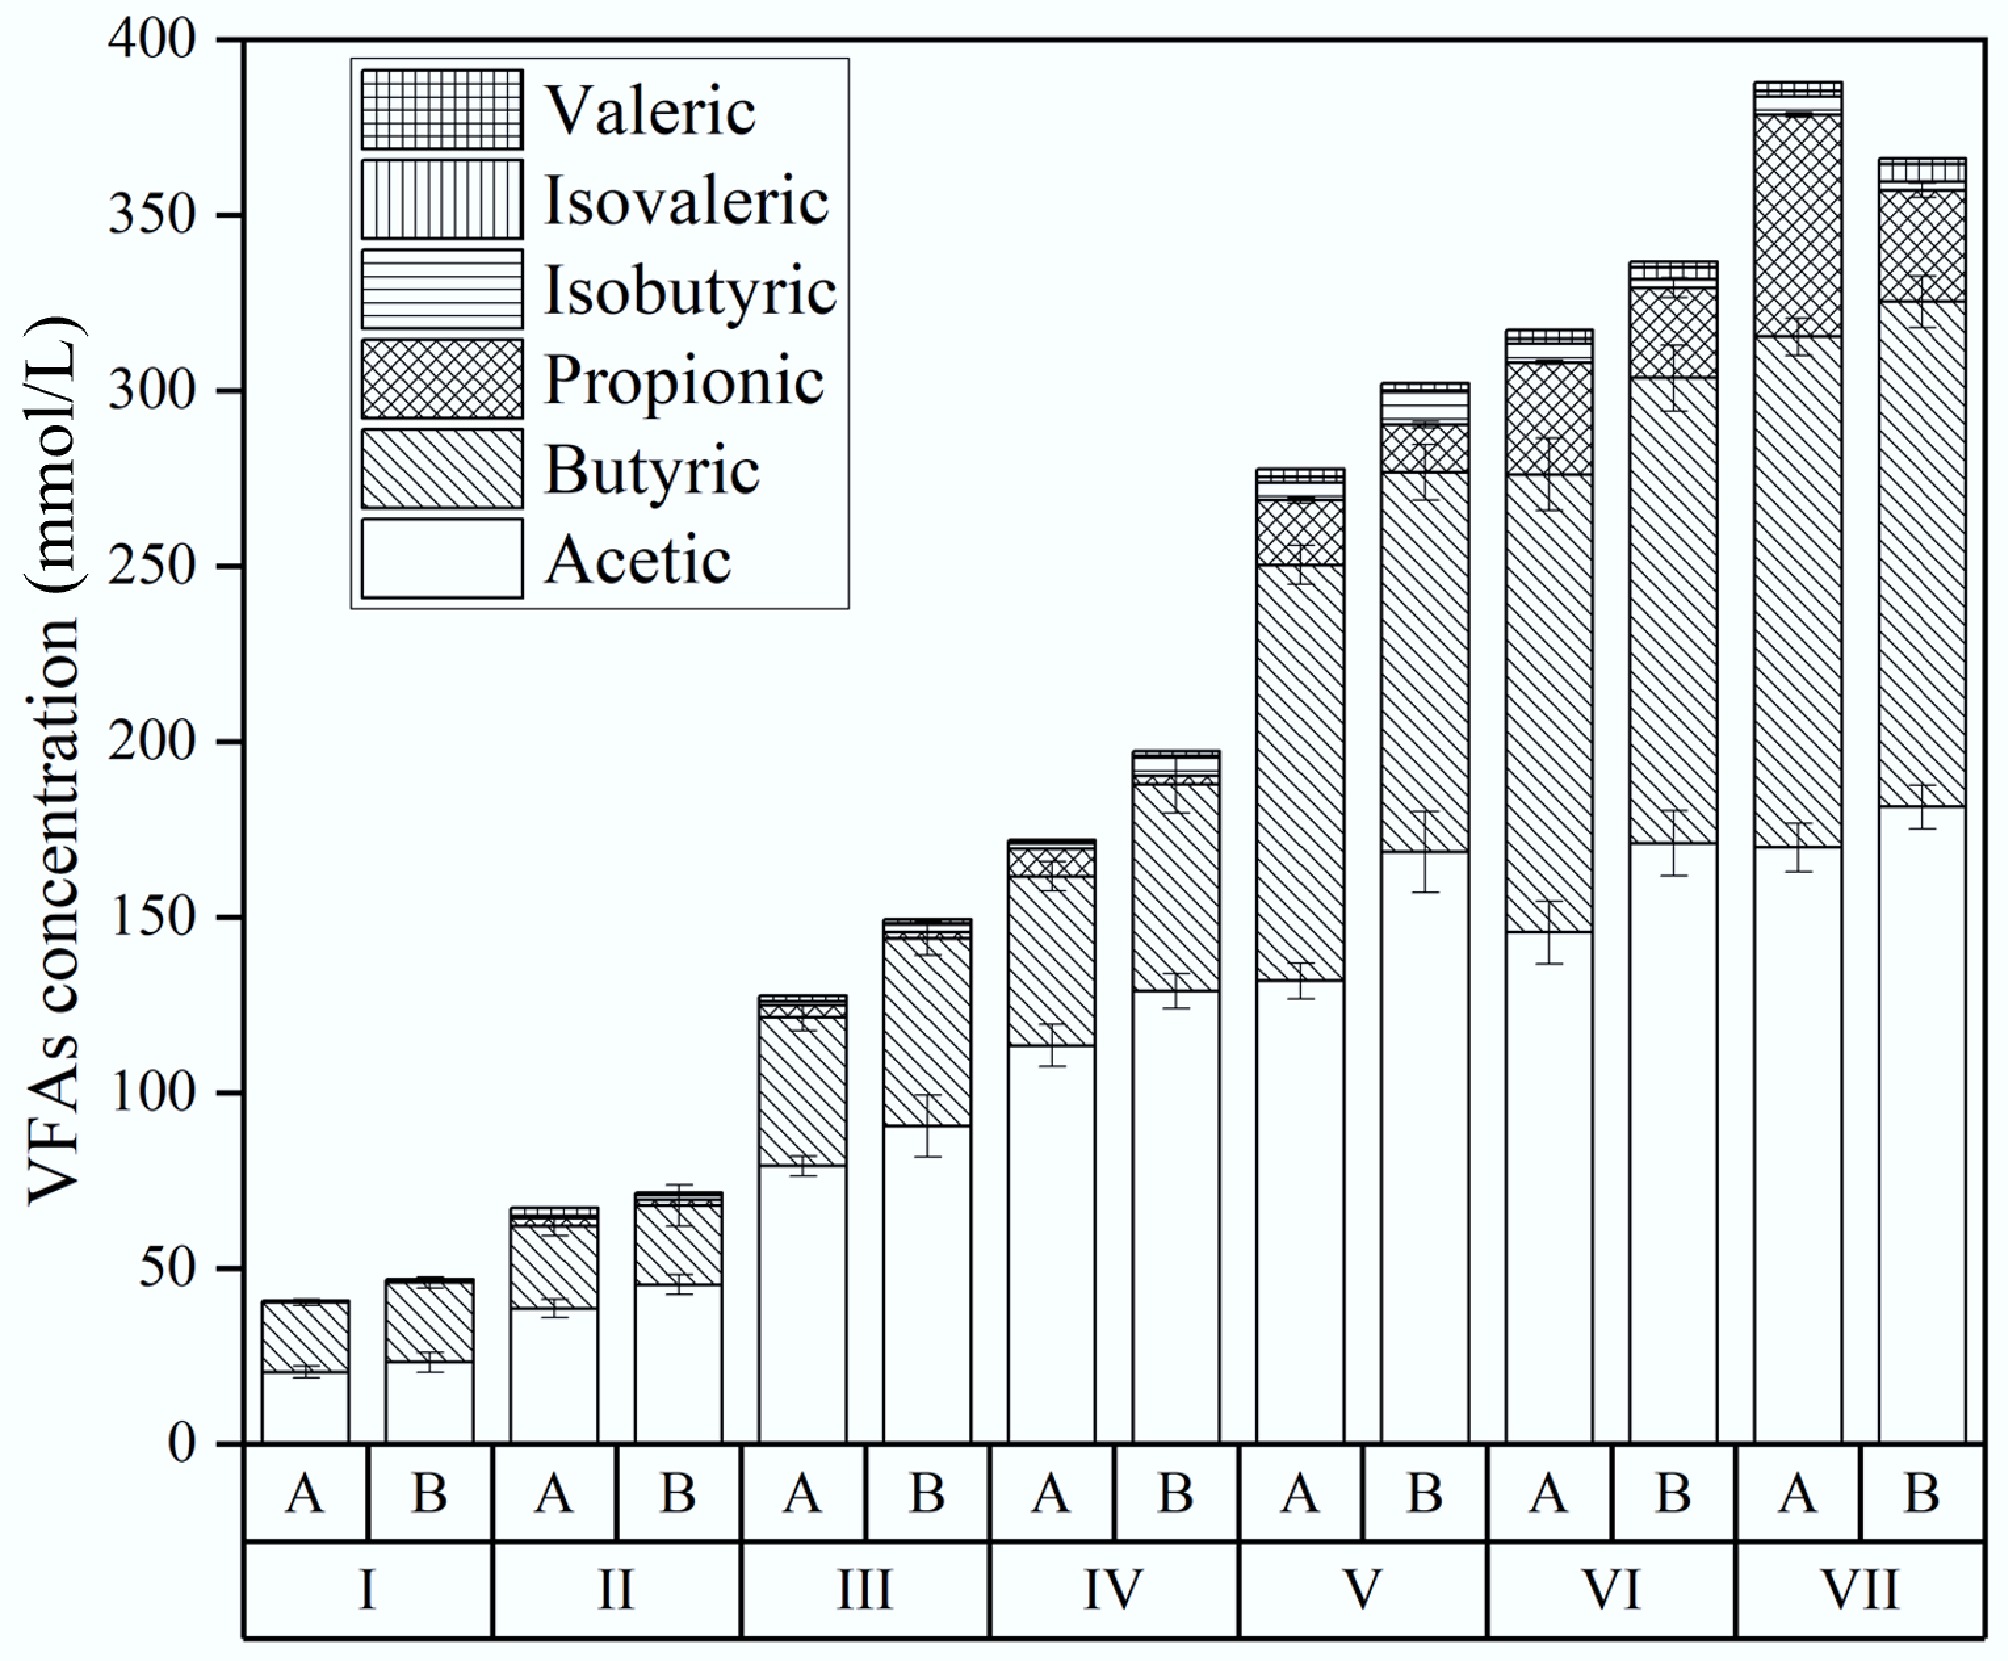
Figure 4.
Effect of biochar addition on VFA during H2 production. A is the reactor without biochar, and B is the reactor with biochar addition.
The effects of biochar on the performance of the second phase (R2)
-
Figure 5 shows CH4 production rates (RM) for reactors with and without biochar. Similar to the R1 results, RM increased initially before stabilising during Stage I. About 14% hydrogen was detected during early hydrolysis of food waste, but it disappeared in later stages as CH4 generation by methanogens became dominant. In Stage II, CH4 output rose with higher OLR (0.5 to 1.0 g VS/[L/d]) and shorter HRT (from 10 to 5 d). This increasing trend with OLR (up to 4.0) persisted in Stages III–V. CH4 appeared earlier in biochar treatments (day 5) than in controls (day 10), and RM stayed consistently higher with biochar across all stages. During Stage I, the control reactors averaged 75.9 mL/d and 37.7% CH4 (Table 3). In contrast, biochar reactors reached 308.0 mL/d and 39.7% CH4. By Stage V, biochar reactors showed RM 43.6% greater (1,837.5 mL/d) than controls (1,280.0 mL/d). In Stage VI, RM rose further to 1,908.4 mL/d with biochar, a 51.7% increase over the control (1,365.8 mL/d). Biochar also boosted CH4 content by 7.8% (from 74.4% to 82.2%). When OLR rose from 4.0 to 6.0 g VS/(L·d) in Stage VII, controls dropped from 1,365.8 to 1,198.3 mL/d in 10 d and further to 1,095.9 mL/d by day 100, mirroring the CH4 decline caused by VFA buildup and microbial inhibition. Conversely, biochar reactors maintained a steady RM near 1,905.2 mL/d throughout. These results confirm, as reported previously[11], that biochar can improve CH4 production by creating favourable conditions for methanogenic archaea.
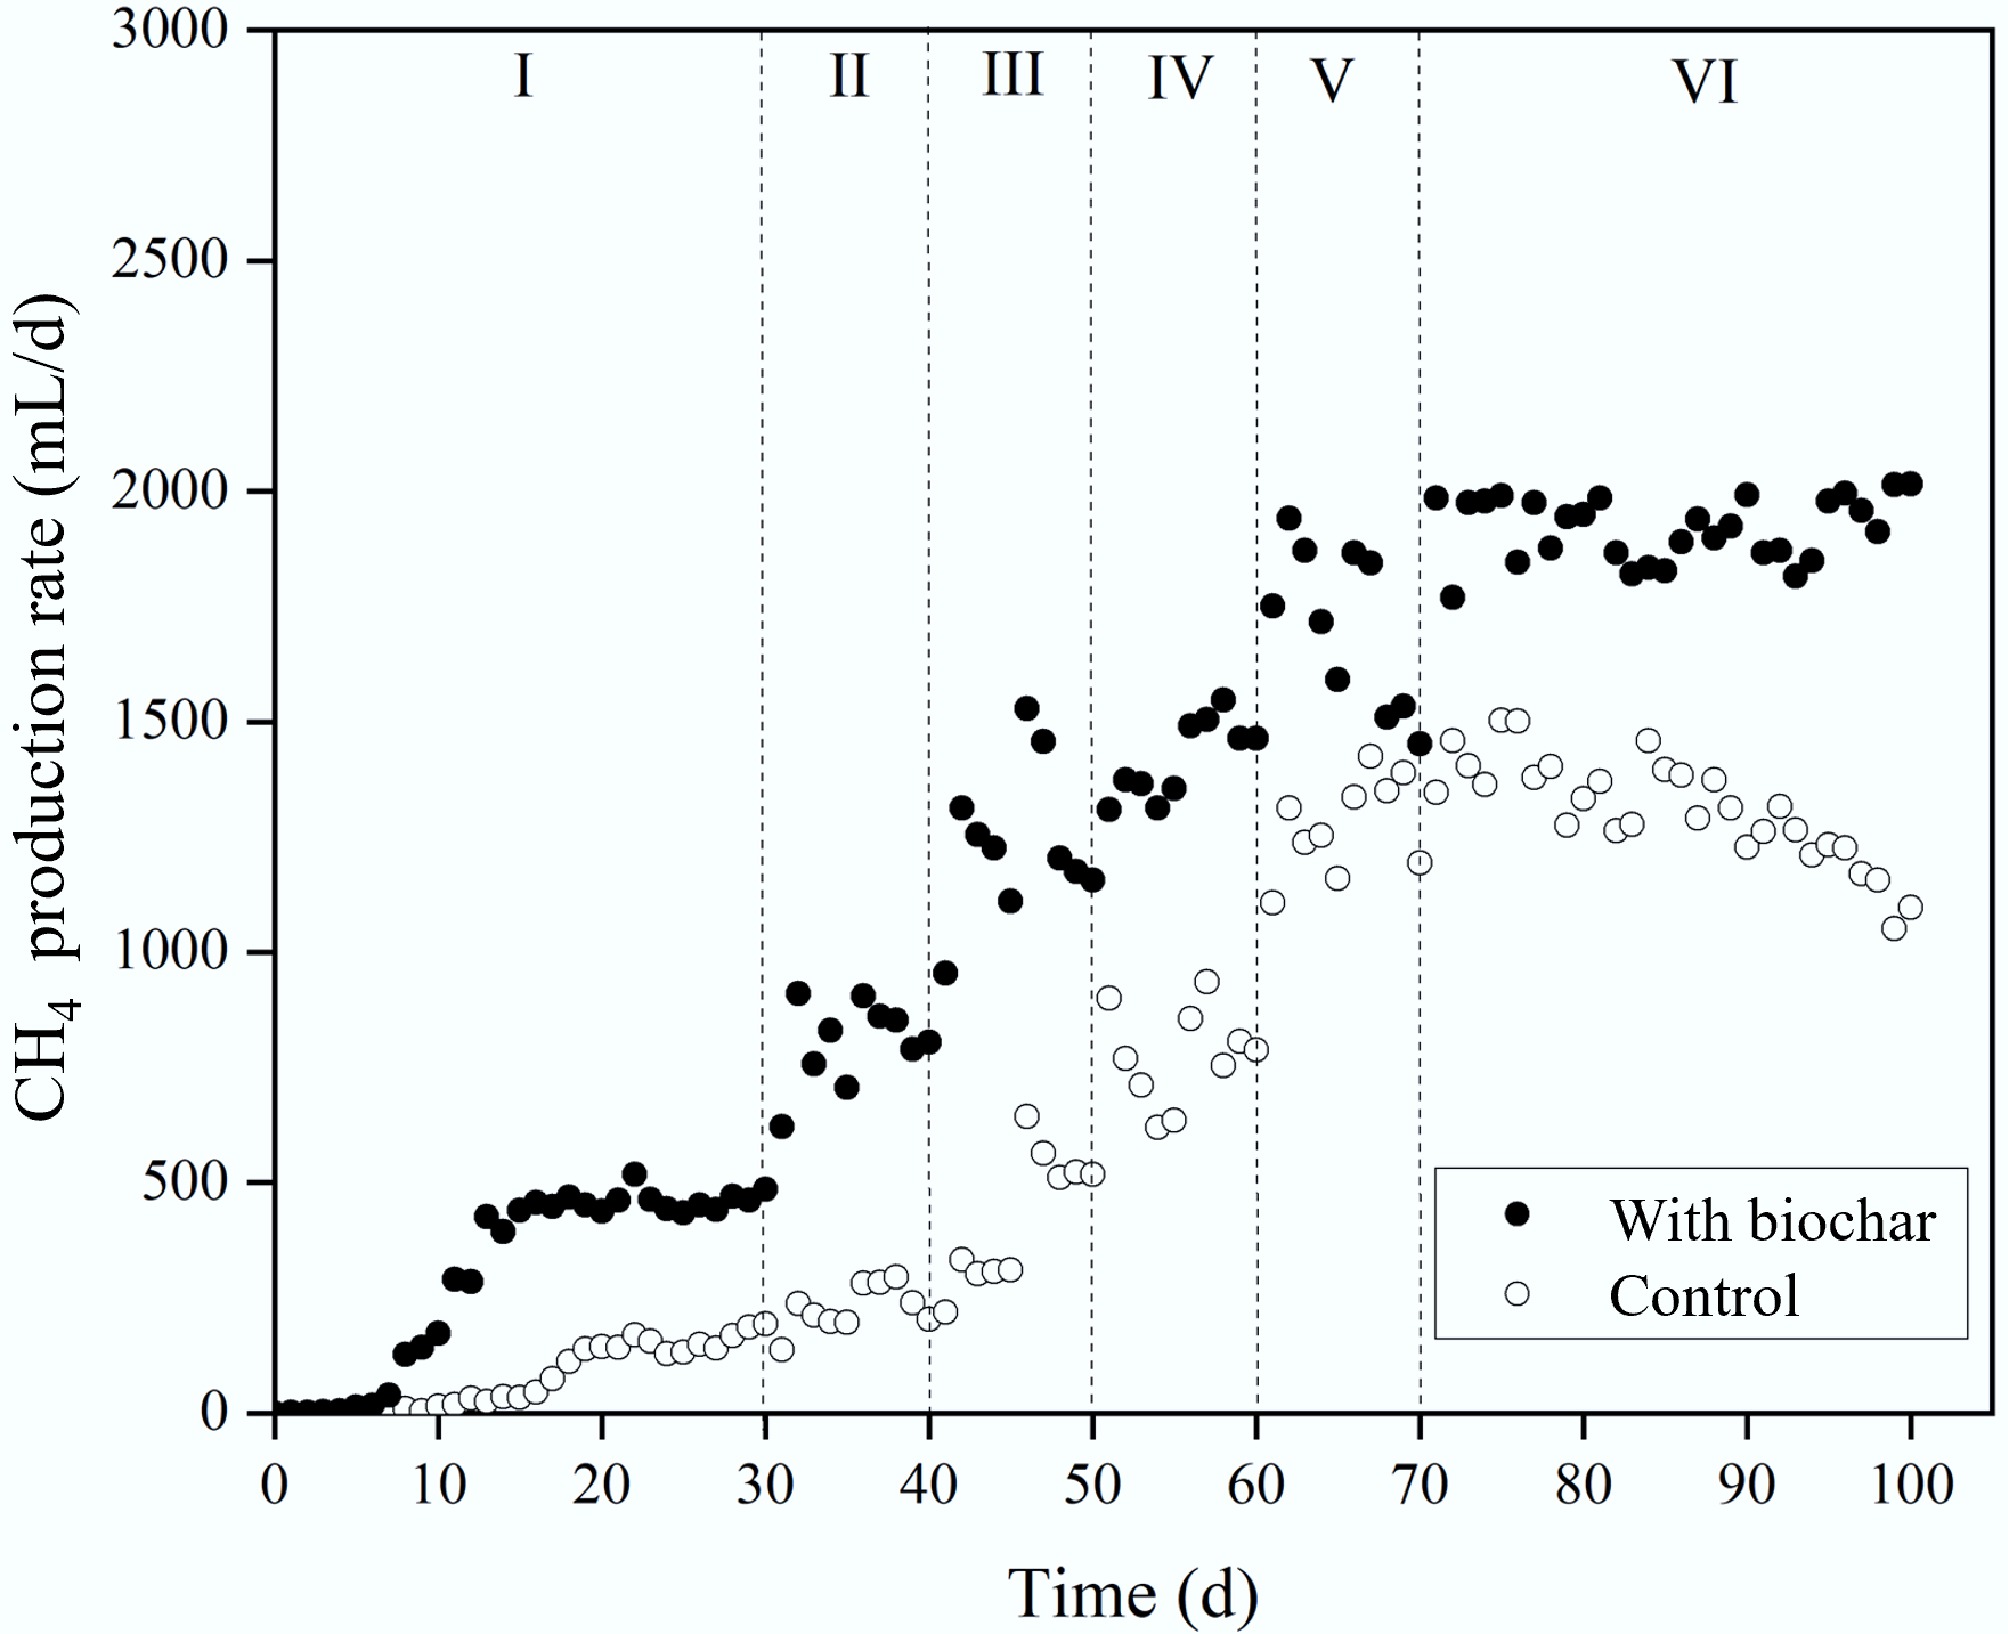
Figure 5.
Effect of biochar addition on CH4 production rate.
Maintaining optimal pH is crucial, and biochar played a buffering role. Figure 6 displays pH patterns during methane production. To support methanogen growth, the reactors were initially adjusted to pH 7.8. In Stage I, all reactors showed a sharp pH drop, then a gradual recovery. Stages II–VI maintained a more stable pH overall, but biochar reactors consistently showed higher pH values and faster recovery. Specifically, in Stage I, control pH fell to 6.2, while biochar reactors stayed at 6.8. In Stages II–V, the control pH stabilised around 6.7, and biochar reactors averaged 7.2. This buffering likely helped maintain conditions near optimal for methanogens. OLR increases in these stages did not significantly shift pH. Transitioning to continuous operation (Stage VI) caused no notable pH change. In Stage VII, controls dropped to 5.7, whereas biochar treatments held steady at 7.3. As seen in R1, biochar's buffering effect during semi-continuous TPAD is attributed to its richness in inorganic salts and metallic oxides[23,24].
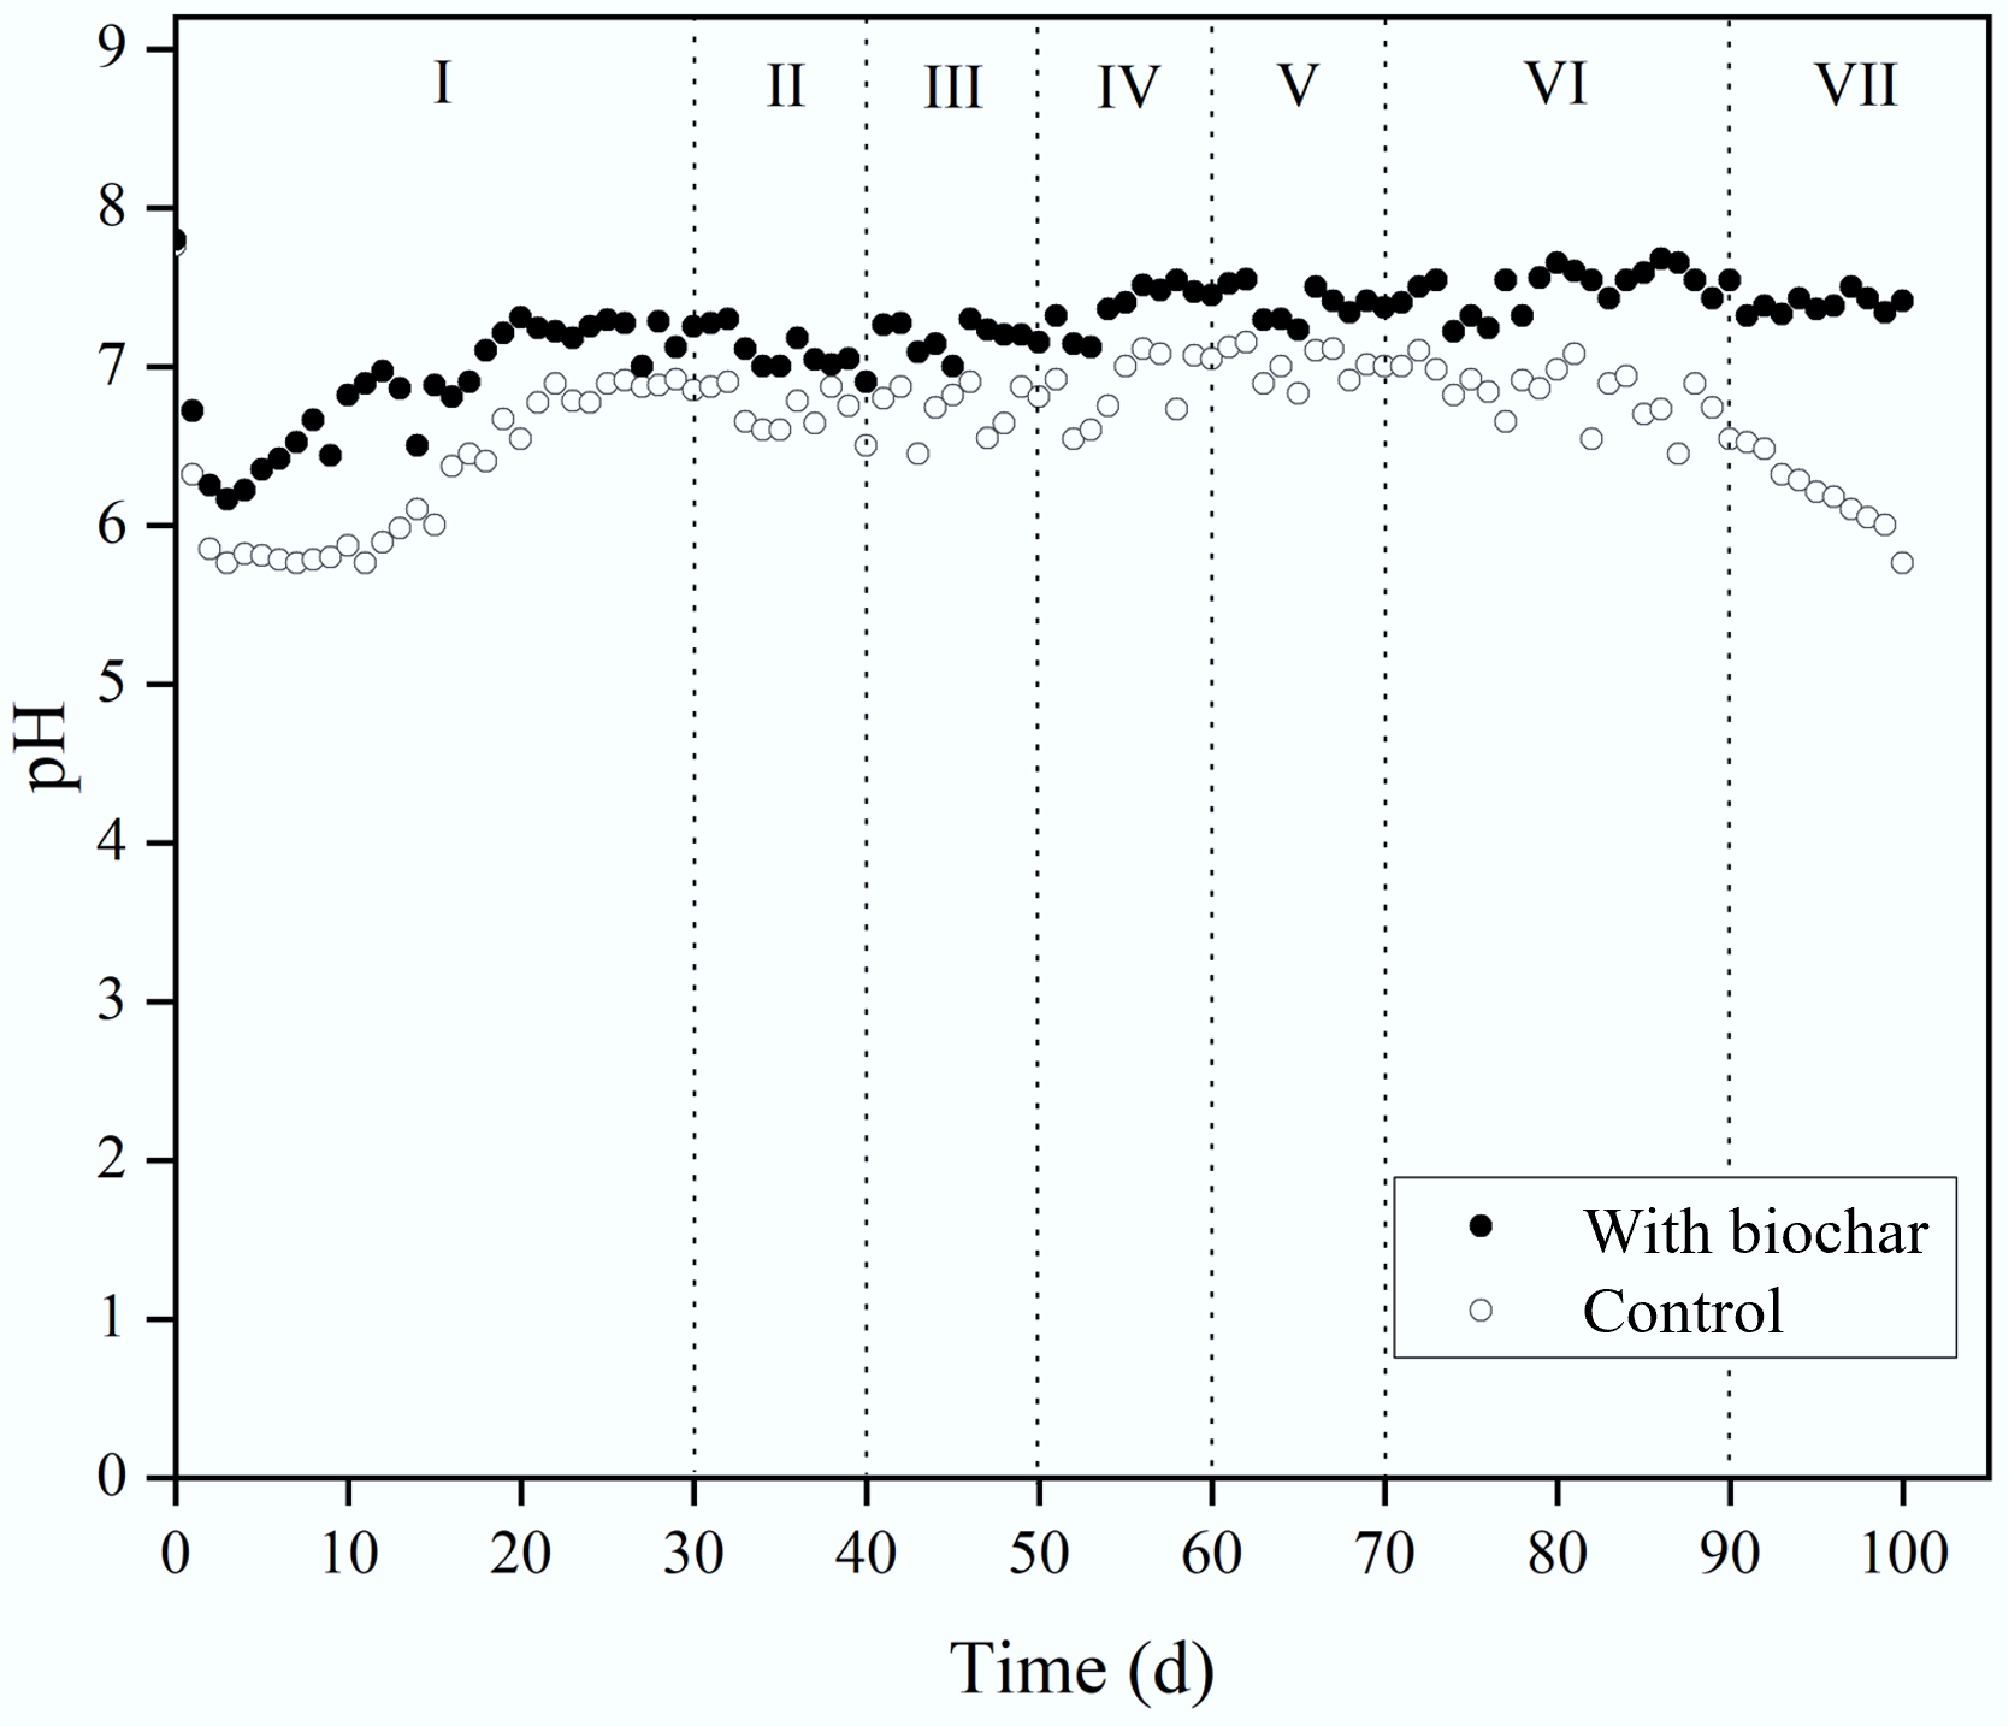
Figure 6.
Effect of biochar addition on pH during CH4 production.
The rise in acidity during the second TPAD phase resulted mainly from VFA accumulation. Figure 7 shows VFA profiles during CH4 production. Across all stages, VFA levels were consistently higher in controls than in biochar treatments. In Stage I, all reactors produced low amounts of acetic, butyric, and propionic acids. In Stage II, VFA concentrations rose with higher OLR (0.5–1.0 g VS/[L/d]) and lower HRT (10 to 5 d). Like in R1, acetic and butyric acids dominated, with less propionic acid. Stages III–V saw further increases as OLR rose. Biochar reactors maintained lower VFA levels, suggesting improved fermentation and more effective VFA-to-methane conversion by methanogens. During Stage VI, propionic acid accumulated less in biochar reactors. Adding biochar likely boosted acetogen activity (converting propionic to acetic acid) and acetoclastic methanogen activity (turning acetate into methane)[26]. In Stage VII, control reactors showed large increases in acetic, butyric, and propionic acids (14%, 18%, 58% respectively), which corresponded with a pH drop to 5.7 and a 12% decline in CH4 production rate (from 1,365.8 to 1,198.3 mL/d). In contrast, biochar reactors had only minor increases in these acids (7%, 6%, and 5%, respectively), while maintaining a stable pH of 7.3 and constant CH4 output near 1,905.2 mL/d. These trends suggest that biochar's role may aid VFA breakdown during digestion by buffering the pH and enhancing interspecies electron transfer between syntrophic bacteria and methanogens[20,27,28].
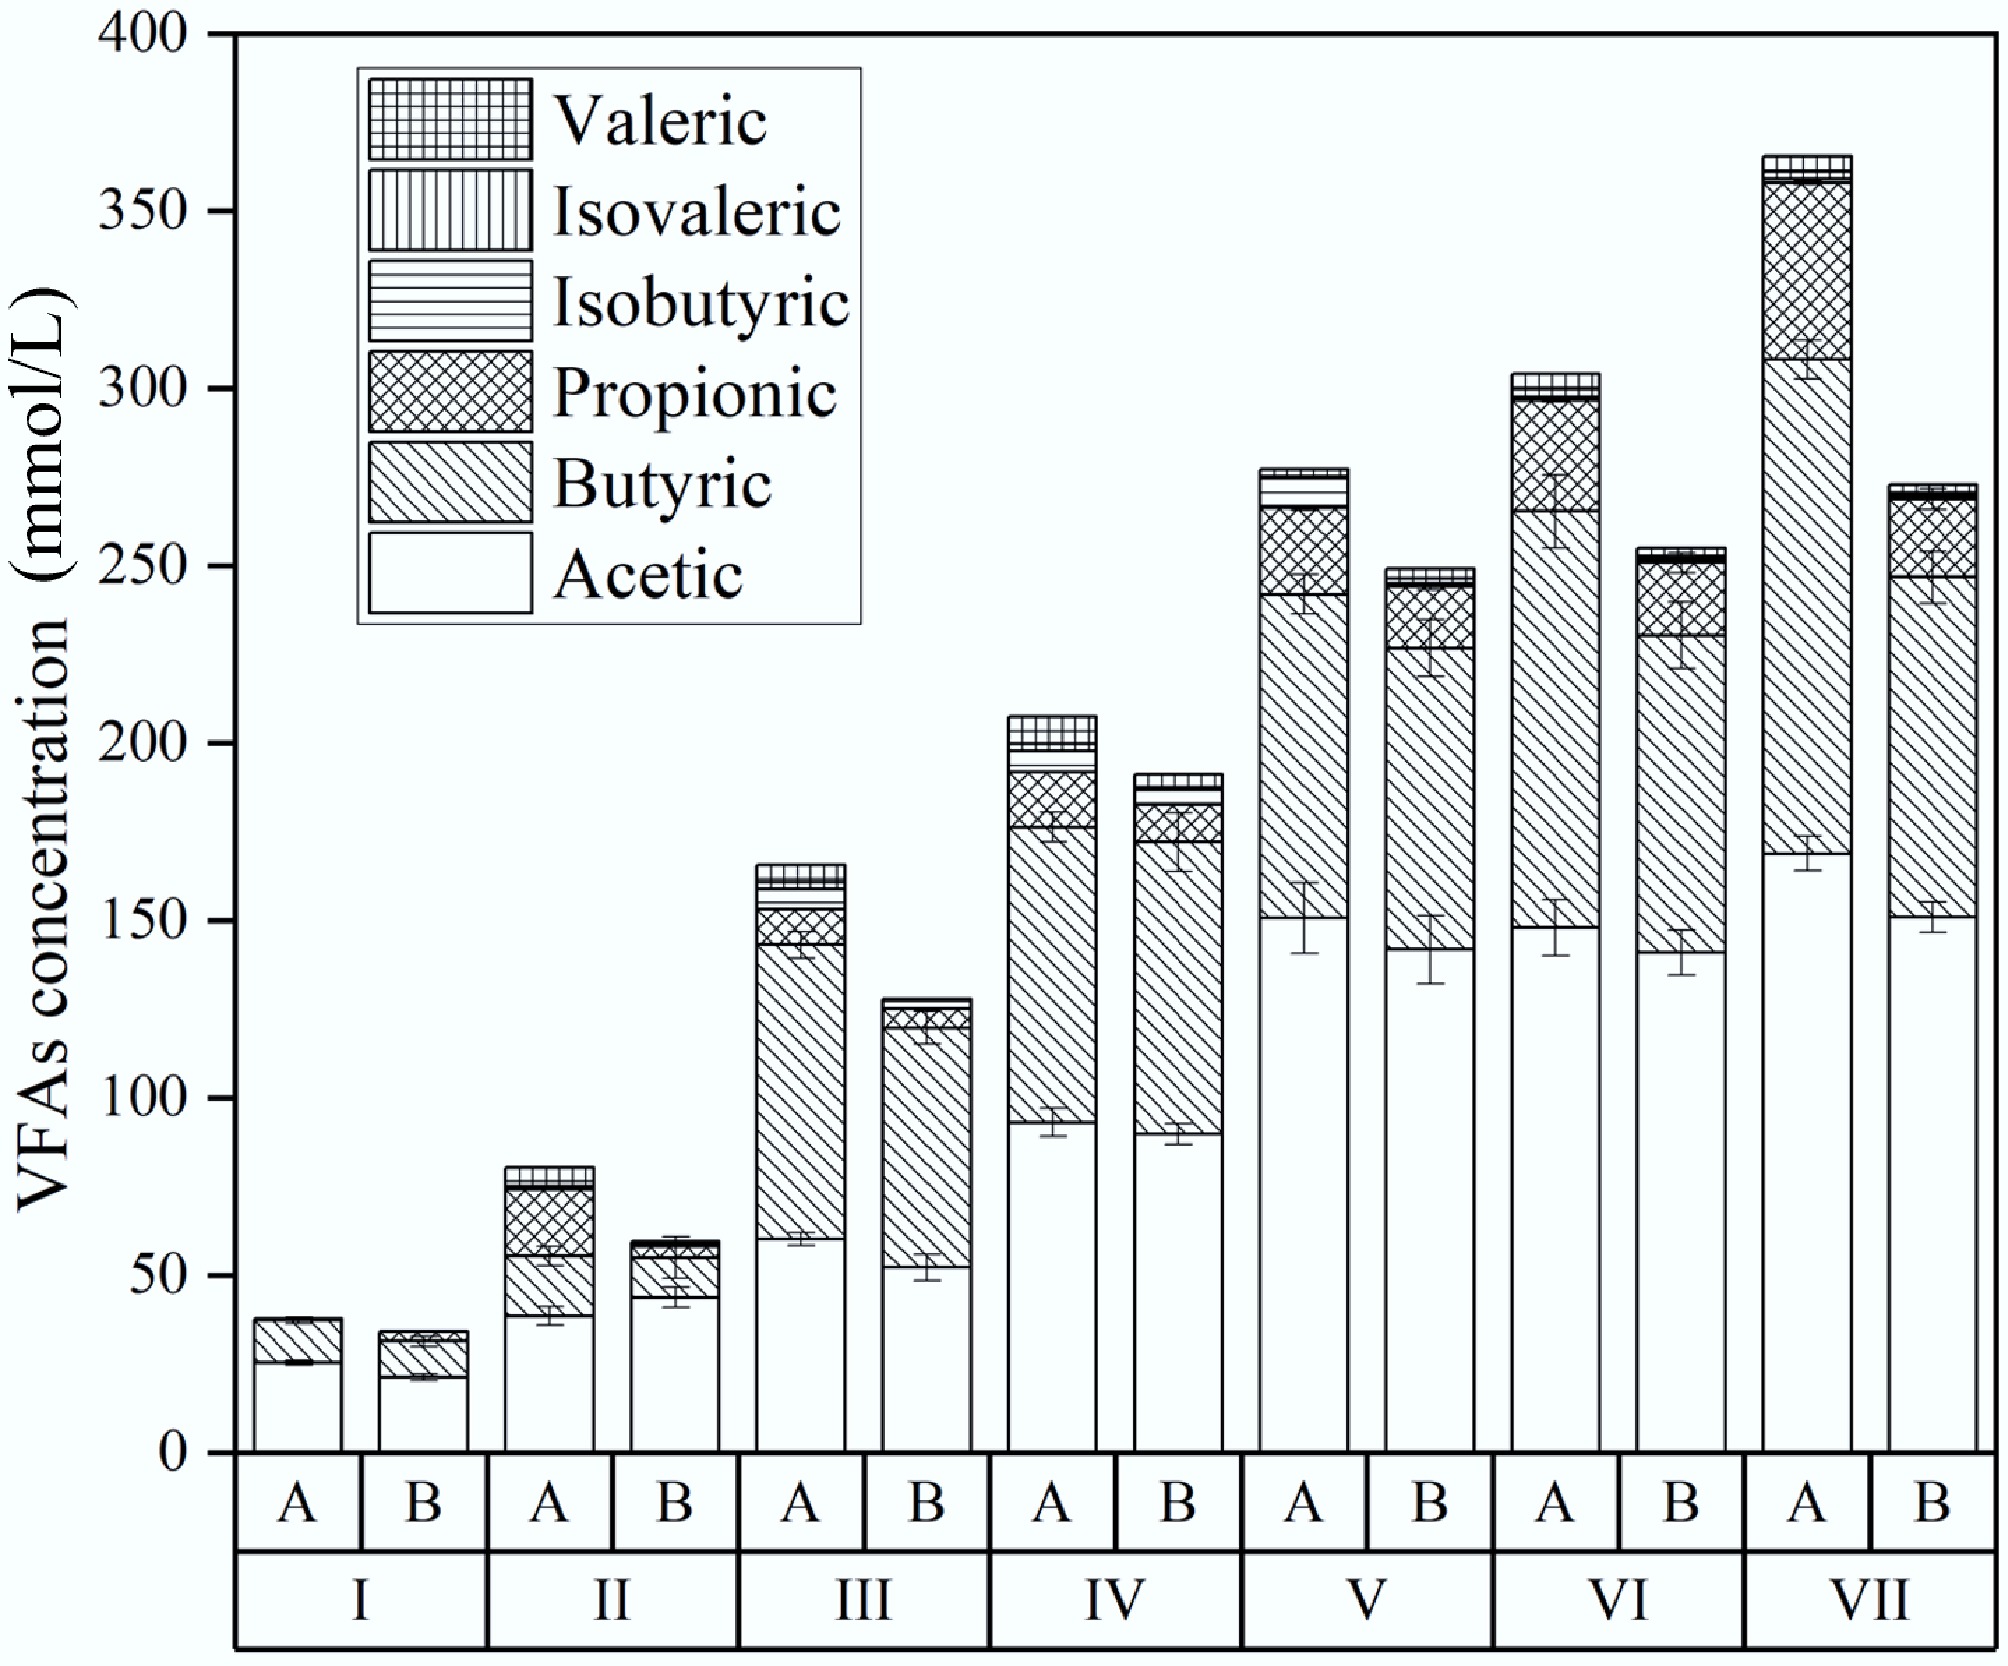
Figure 7.
Effect of biochar addition on VFA during CH4 production. A is the reactor without biochar, and B is the reactor with biochar addition.
Microbial distribution
-
Figure 8 shows the microbial community distribution during the first TPAD phase (H2 production) in reactors with and without biochar. At the experiment's start, Carnobacteriaceae (34.4%), Enterococcaceae (21.6%), Clostridiaceae (13.7%), and Pseudomonadaceae (10%) were the most abundant bacterial families. Of these, Clostridiaceae and Enterococcaceae are anaerobes mainly contributing to H2 generation[29,30]. Importantly, Clostridiaceae are key degraders of food residues into acetic and butyric acids[31,32]. By Stage VI, Clostridiaceae abundance in controls had increased to 54.2%. In contrast, biochar reactors saw nearly double this rise, reaching 92.6%, highlighting biochar's strong positive effect on Clostridiaceae growth. This higher proportion was linked to better VFA breakdown and enhanced hydrogen output, consistent with earlier bench-scale findings[10].
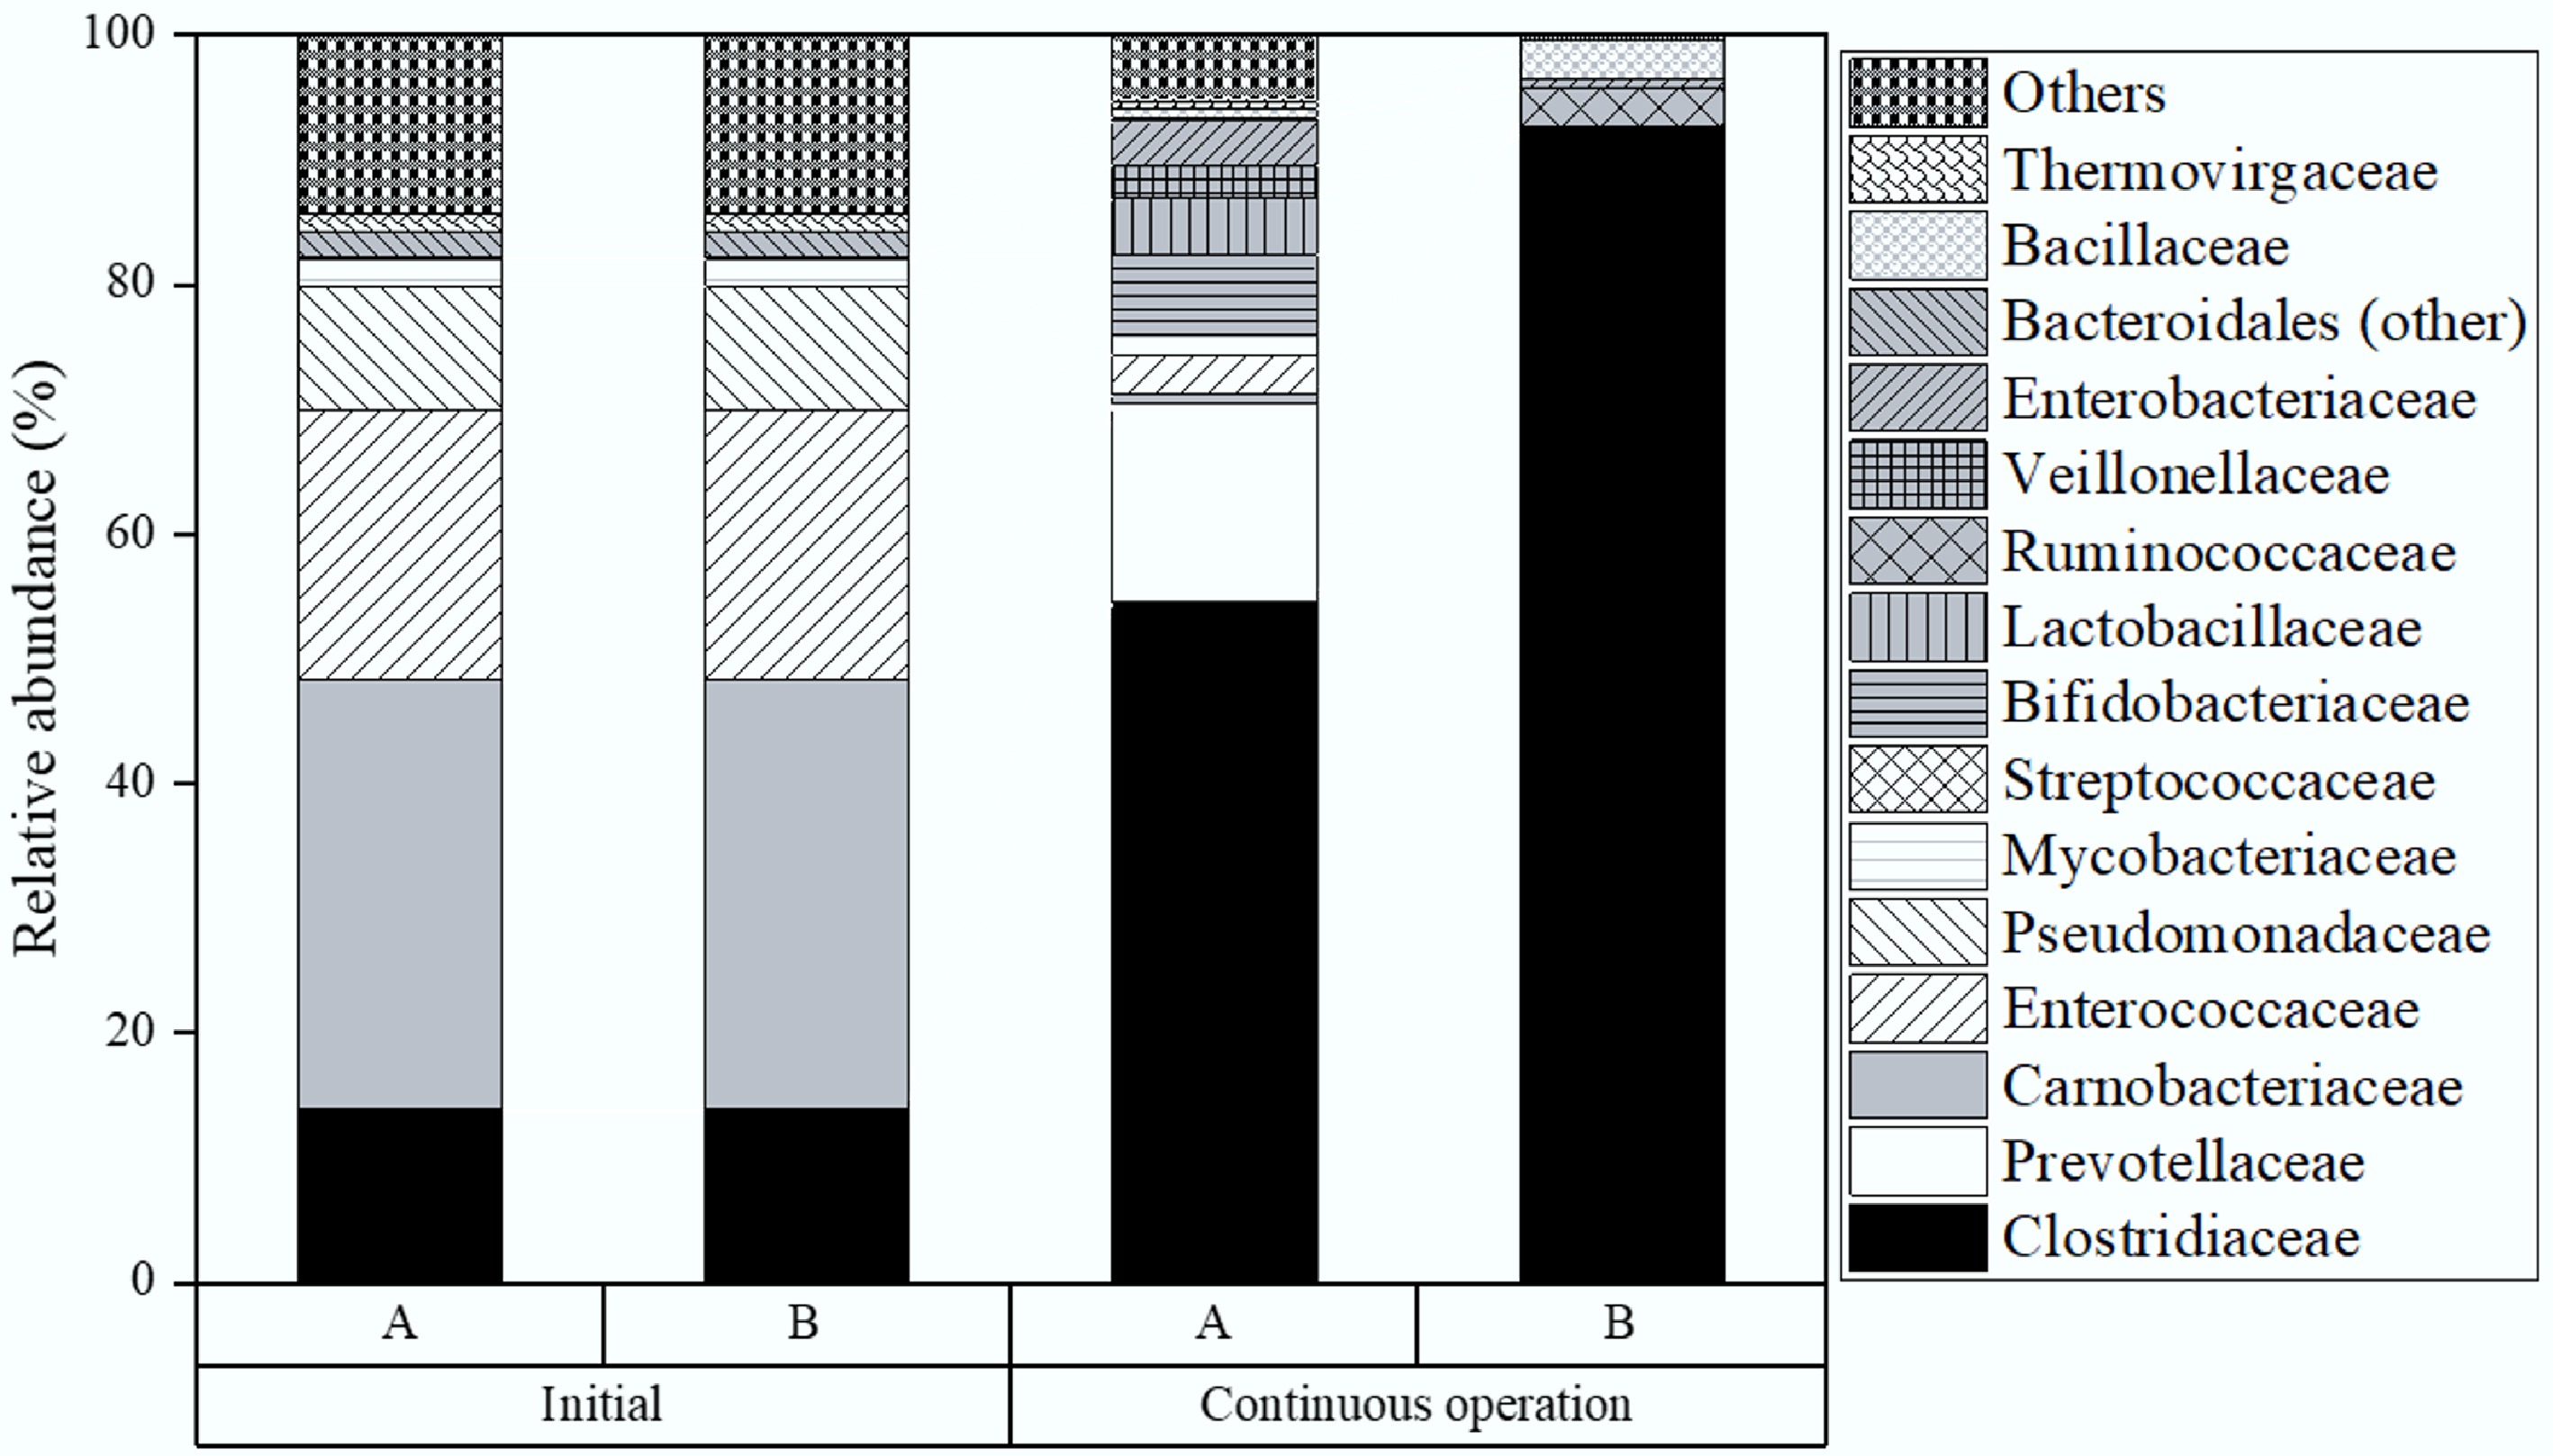
Figure 8.
Microbial distribution in the first phase of TPAD, A with, and B without biochar addition during semi-continuous operation.
During CH4 production, both bacteria and archaea play roles in the process. Figure 9a presents bacterial family distributions (above 1% abundance) at the start and on day 90 (Stage VI) of CH4 production. Initially, the leading bacterial families included Pseudomonadaceae (19.5%), Lachnospiraceae (16.6%), Clostridiaceae (14.2%), Carnobacteriaceae (11.1%), and Peptostreptococcaceae (10.5%), all common in sludge and relevant to CH4 generation. Pseudomonadaceae, Lachnospiraceae, and Carnobacteriaceae participate mainly in hydrolysis and acidogenesis, converting organic matter into acetic and butyric acids[33−35]. While Clostridiaceae do not directly produce CH4, they are important acetogens, enabling syntrophic acetate oxidation and hydrogenotrophic methanogenesis, both vital for CH4 formation[32]. By day 90, Clostridiaceae in the control had grown to 18.8%, a 4.6% rise from the start. As expected, biochar addition promoted Clostridiaceae growth further, reaching 58.2% abundance by day 90. This higher presence of Clostridiaceae contributed to more efficient VFA degradation and increased CH4 production.
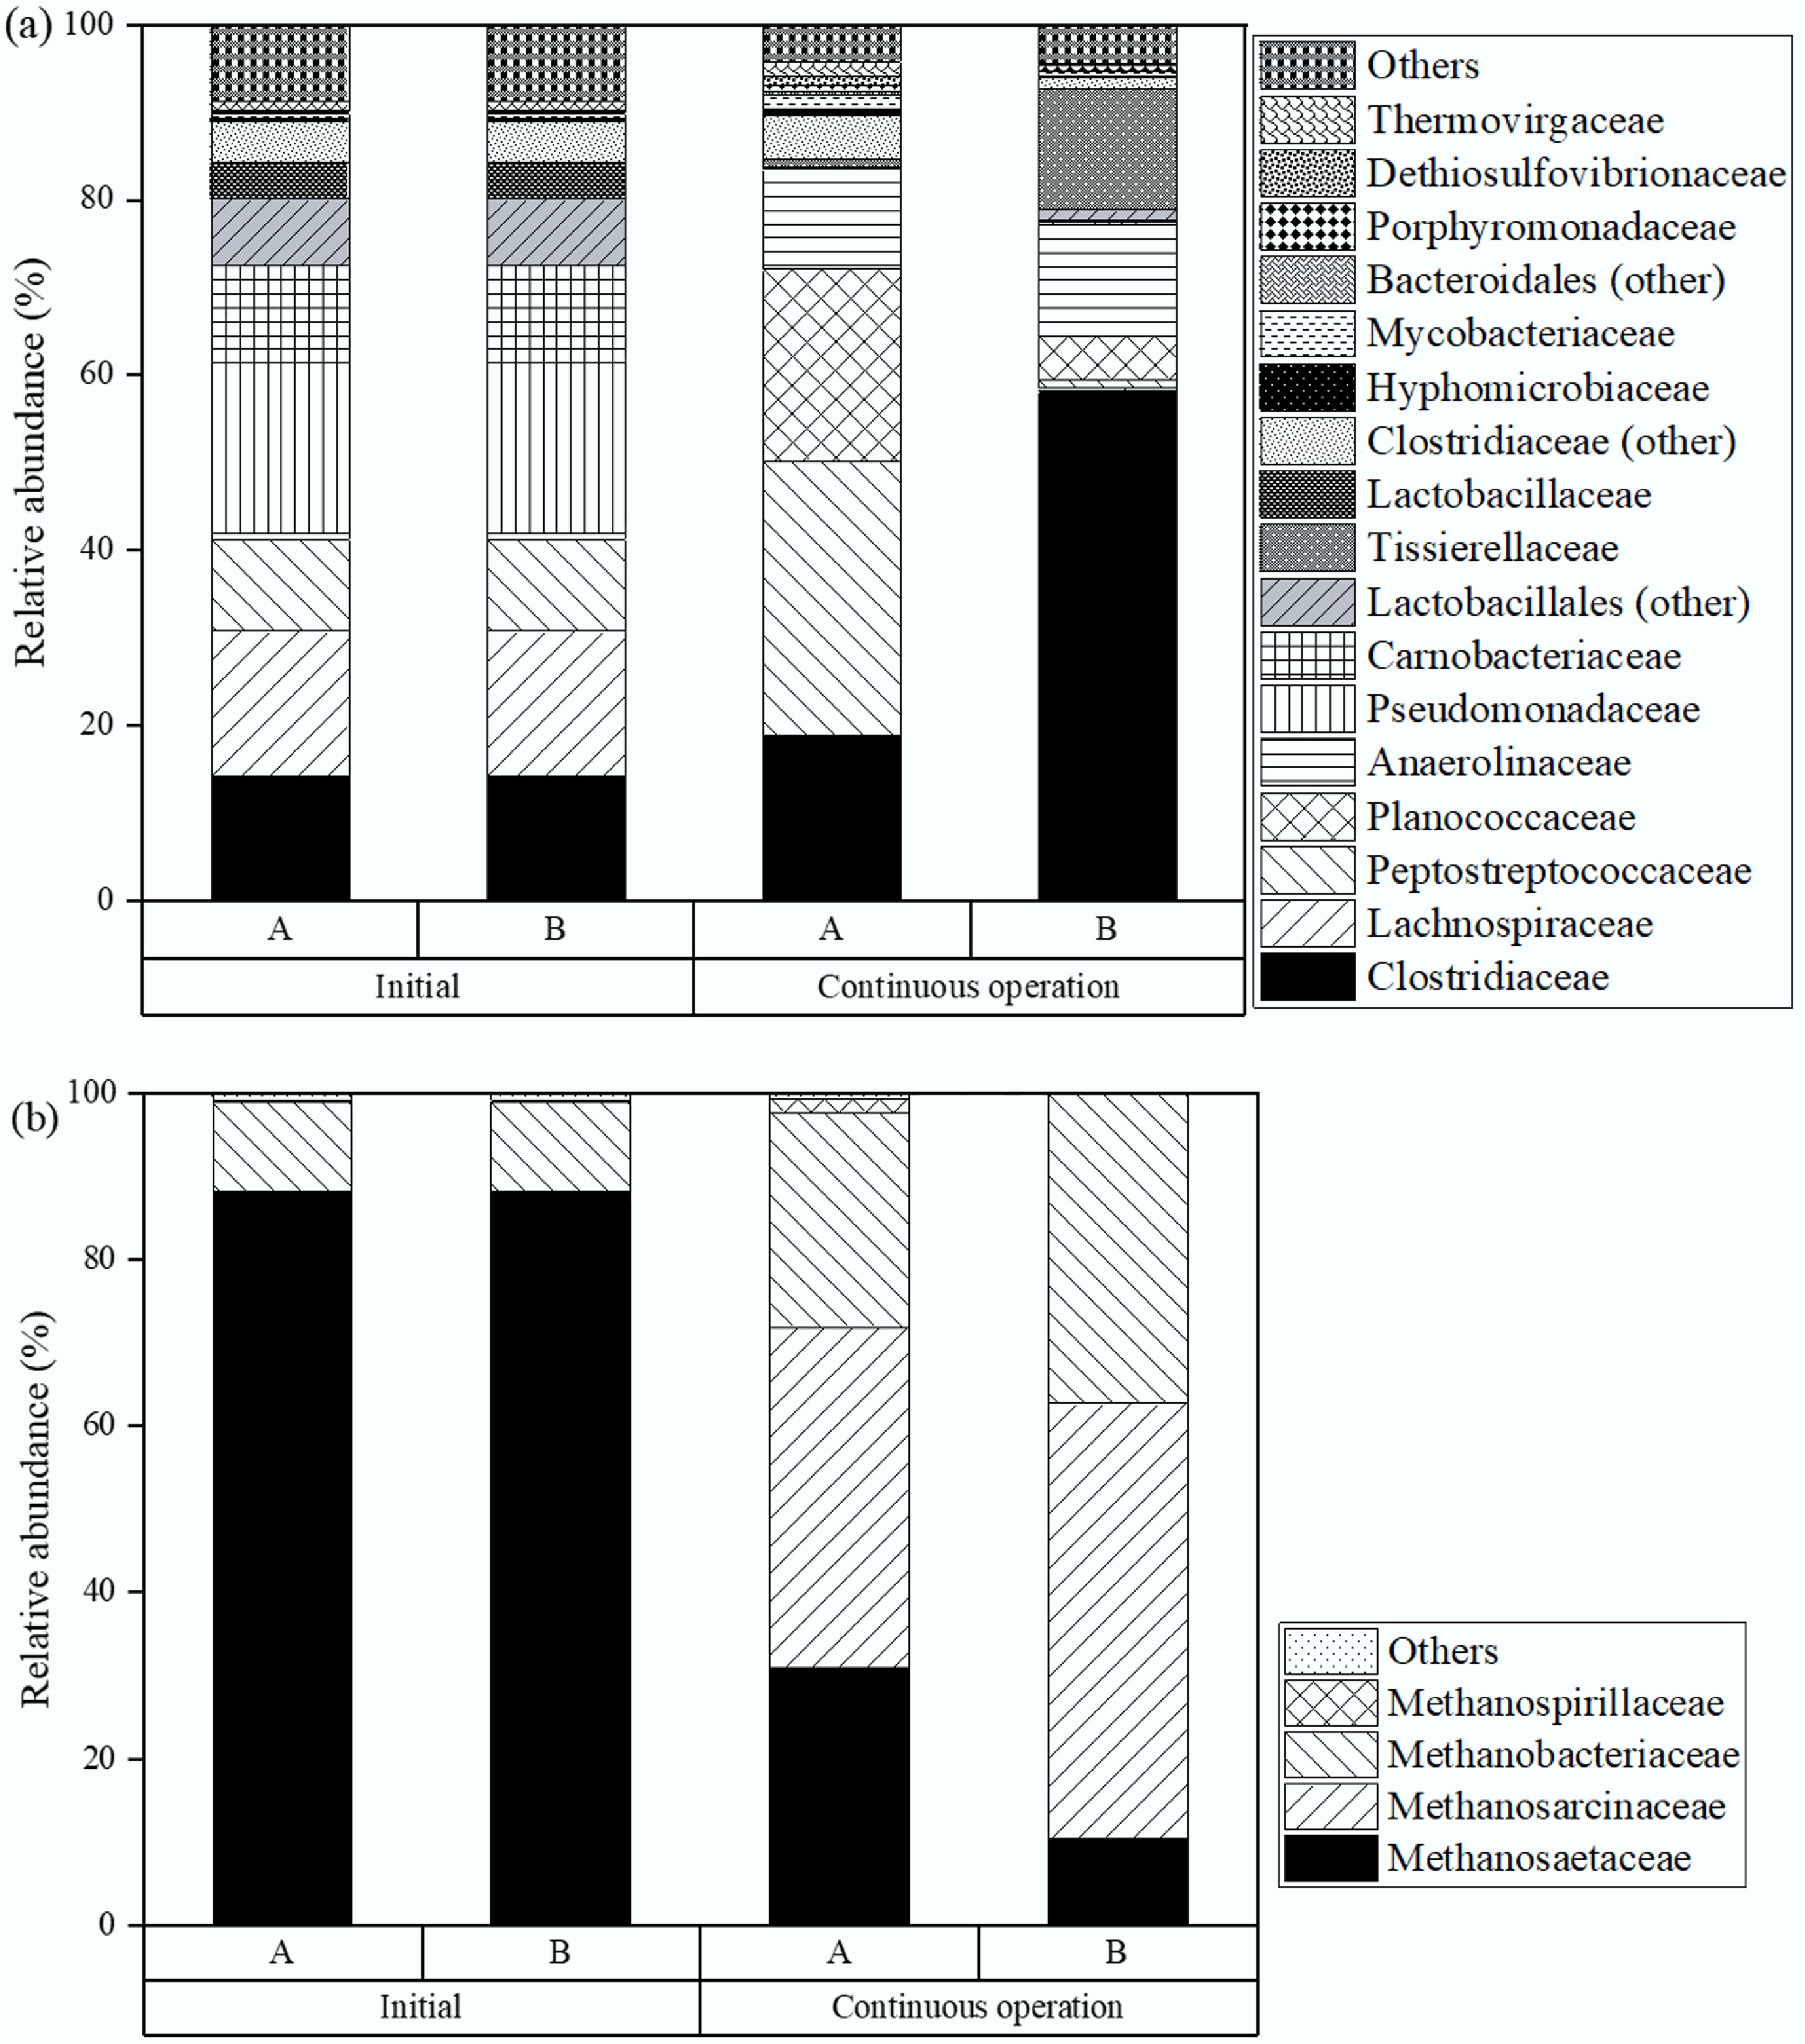
Figure 9.
Microbial distribution at the family level in the second phase of TPAD with (a), and without (b) biochar addition during semi-continuous operation.
Figure 9b displays the relative abundance of archaeal families. In TPAD, acetogenesis products (acetate, H2, and CO2) are converted to CH4 by acetoclastic and hydrogenotrophic pathways. Acetoclastic methanogens, like Methanosaetaceae and Methanosarcinaceae, use acetate for CH4 production, while hydrogenotrophic methanogens, including Methanosarcinaceae and Methanobacteriaceae, convert H2 and CO2 into CH4. Initially, dominant archaea in all reactors included Methanosaetaceae (87.2%), Methanobacteriaceae (10.7%), Methanosarcinaceae (1.5%), and Methanospirillaceae (0.3%). Over time, Methanosarcinaceae and Methanobacteriaceae increased significantly in controls, up by 39.4% (to 40.9%) and 15.1% (to 25.8%), respectively. Biochar further enhanced their growth, reaching 50.8% and 26.5% abundance by day 90, highlighting its stimulating effect[32]. Biochar likely supports Methanosarcinaceae growth by facilitating hydrogenotrophic methanogenesis and promoting syntrophic acetate oxidation in cooperation with Clostridiaceae[36]. It also encourages Methanobacteriaceae activity in H2 utilisation[32]. During semi-continuous operation, biochar acted as an effective support for methanogens, especially Methanosarcinaceae and Methanobacteriaceae. Interestingly, the dominant methanogens here differed from prior bench-scale experiments with the same inoculum, where Methanosaetaceae prevailed[11]. This difference may result from the specific methanogenesis pathways in the earlier study, where acetate was the main substrate and hydrogenotrophic methanogenesis was limited because H2 had been removed before CH4 production.
In comparison to our earlier batch-scale experiments using the same inoculum and biochar source[11,12], this study demonstrated sustained hydrogen and methane production over a prolonged 100-d semi-continuous operation. Notably, biochar supplementation-maintained process stability even at a high organic loading rate of 6.0 g VS/(L·d), a threshold that previously led to system failure in batch-mode trials. Microbial community analysis further revealed a pronounced enrichment of Clostridiaceae and Methanosarcinaceae under semi-continuous conditions, suggesting that extended biochar exposure fosters the development of a more robust syntrophic network. This enhanced methane production can be attributed not only to improved pH buffering and microbial enrichment but also to specific mechanisms linked to syntrophic metabolism and direct interspecies electron transfer (DIET). Biochar acts as a conductive matrix, facilitating electron exchange between syntrophic bacteria (Clostridiaceae) and methanogenic archaea (Methanosarcinaceae and Methanobacteriaceae), thereby accelerating key steps such as acetate oxidation and hydrogenotrophic methanogenesis. These effects arise from biochar's electrical conductivity, redox-active surface functional groups (e.g., quinones, phenolics), and embedded metallic elements like Fe and Mn, which collectively promote microbial cooperation and metabolic resilience[20,28]. Altogether, these findings extend the applicability of our previous research and provide valuable insights for upscaling TPAD systems with biochar-enhanced stability and performance.
-
This research demonstrated that biochar effectively improved H2 and CH4 production during semi-continuous operation of laboratory-scale TPAD with mesophilic microbial consortia. Biochar supplementation consistently enhanced H2 and CH4 outputs across all tested organic loading rates (OLRs), outperforming the control setups in both gas yield and daily production. The observed trends corroborate previous findings from the batch-scale system. Importantly, under elevated OLR conditions (6.0 g VS/[L/d]), biochar addition maintained stable H2 and CH4 generation by buffering pH shifts and supporting microbial activity. Microbial analysis showed that biochar increased the relative abundance of Clostridiaceae in the H2-producing reactor and promoted the growth of Methanosarcinaceae and Methanobacteriaceae in the CH4-producing reactor. Therefore, using biochar in semi-continuous TPAD could make it possible to apply higher organic loadings comparable to conventional AD without compromising process stability or biogas performance.
-
The authors confirm their contribution to the paper as follows: Y Sugiarto and D Zhang were responsible for the study conception and design. Data collection was carried out by Y Sugiarto, NMS Sunyoto, and HY Setyawan. The analysis and interpretation of results were performed by Y Sugiarto, NMS Sunyoto, HY Setyawan, and D Zhang. The draft manuscript was prepared by Y Sugiarto and NMS Sunyoto. All authors reviewed the results and approved the final version of the manuscript.
-
The datasets generated during and/or analyzed during the current study are not publicly available due to limitations in data sharing agreements and institutional policies, but are available from the corresponding author, upon reasonable request.
-
This research received partial financial support from the Australian Research Council through the ARC Linkage Projects scheme (ARC LP100200137), the ARC Discovery Projects scheme (DP210103766 and DP220100116), and the Future Energy Export CRC (FEnEX CRC Project # 21.RP2.0059). Y Sugiarto expresses gratitude to the Directorate of Research and Community Service at Universitas Brawijaya, the EQUITY Program (Project No. 4559/2023), and the Woodman Point Wastewater Treatment Plant for supplying wastewater sludge.
-
The authors declare that they have no conflict of interest.
-
Two-phase anaerobic digestion of food waste to produce H2 and CH4 is demonstrated.
Biochar addition enhances both H2 and CH4 production.
Biochar addition improves Clostridiaceae activity in the H2 reactor.
Biochar promotes Methanosarcinaceae and Methanobacteriaceae activity in CH4 reactors.
Biochar buffers pH and allows digestion to operate at high organic loading rates.
-
Full list of author information is available at the end of the article.
- Copyright: © 2025 by the author(s). Published by Maximum Academic Press, Fayetteville, GA. This article is an open access article distributed under Creative Commons Attribution License (CC BY 4.0), visit https://creativecommons.org/licenses/by/4.0/.
-
About this article
Cite this article
Sugiarto Y, Sunyoto NMS, Setyawan HY, Zhang D. 2025. Enhancing H2 and CH4 production with biochar addition in two-phase anaerobic digestion of food waste. Energy & Environment Nexus 1: e010 doi: 10.48130/een-0025-0010 

Enhancing H2 and CH4 production with biochar addition in two-phase anaerobic digestion of food waste
- Received: 04 July 2025
- Revised: 29 July 2025
- Accepted: 05 September 2025
- Published online: 21 October 2025
Abstract: This study conducted experimental research to investigate how biochar contributes to increasing hydrogen (H2) and methane (CH4) production in two-phase anaerobic digestion (TPAD) systems treating simulated food waste. The experimental setup involved two 5 L continuous stirred tank reactors arranged in series, each dosed with roughly 15 g/L biochar over a 100-d period, operating under organic loading rates (OLRs) ranging from 0.5 to 6.0 g VS/(L·d). Daily measurements were conducted to determine the H2 and CH4 production rate (RH and RM). Volatile fatty acid (VFA) profiles were monitored daily. Samples of the liquid reactors were collected periodically to examine the composition of microbial communities. Biochar supplementation at all OLR levels resulted in higher RH and RM values. This positive effect was attributed to the ability of biochar to buffer pH and promote the growth of Clostridiaceae within the hydrogen reactor, as well as Methanosarcinaceae and Methanobacteriaceae populations in the methane reactor. Furthermore, the presence of biochar allowed the mesophilic digestion process to operate effectively at an OLR of 6.0 g VS/(L·d), whereas without biochar, stable operation was limited to 4.0 g VS/(L·d).