


-
With the acceleration of global industrialization and urbanization, ground-level ozone (O3) pollution has emerged as an environmental challenge confronting numerous developed and developing nations[1,2]. Since the mid-1990s, tropospheric O3 concentrations in mid-latitude regions of the Northern Hemisphere have increased at a rate of 2%−7% (1−4 ppb) per decade[3]. While various mitigation measures implemented worldwide have successfully reduced O3 precursor emissions, leading to observable O3 concentration declines in North America, Northern Europe, and Southeastern China[4], 74% of global cities still exhibit an annual growth rate of 0.6% in summer maximum daily 8-h average (MD8) O3 concentrations. This trend is particularly pronounced in East Asia, where rapid economic development, high population density, and substantial anthropogenic emissions continue to drive severe O3 pollution[5]. In China, O3 pollution primarily affects eastern regions, with especially high concentrations observed in the North China Plain and Yangtze River Delta[6]. Recent observational data and model simulations show that regional MD8 O3 concentrations in the 2020s range from 48.4 to 57.3 ppb across China, with projections suggesting further increases[7].
Elevated O3 concentrations exert pronounced phytotoxic effects on diverse plant species, e.g. leaf senescence in grass species[8,9]. Effects of O3 on crops and woody plants have been well documented[10−13], while limited studies on turfgrass reveal differential O3 sensitivities among different species and cultivars in the same species[14,15]. Understanding these responses is crucial for selecting resistant plants and improving the turfgrass quality in ozone-polluted areas.
Ozone enters plant tissues via stomata, triggering a series of physiological and biochemical responses. In recent years, systematic progress has been made in understanding mechanisms underlying plants' response to O3 stress. Regarding visible injury, researchers have established standardized assessment frameworks for O3-induced injury, including typical characteristics of leaf visible injury (such as brown spots, chlorosis, and senescence)[16,17]. At the level of photosynthetic physiology, numerous studies have confirmed that O3 stress significantly affects the structure and function of photosynthetic apparatus, e.g., damaging the photosystem II (PSII) reaction center, inhibiting electron transfer chain activity, destroying chloroplast structure, reducing Rubisco enzyme activity, ultimately leading to a decline in photosynthetic efficiency[18,19]. In terms of oxidative stress, O3 stress induces a burst effect of reactive oxygen species (ROS). The underlying mechanisms involve the initiation of membrane lipid peroxidation, generating toxic metabolites such as malondialdehyde (MDA)[20], increasing cell membrane permeability, and activation of complex antioxidant defense networks, e.g. superoxide dismutase (SOD), catalase (CAT), and peroxidase (POD) in maintaining redox balance[21,22]. The cumulative effects of these physiological damages ultimately manifest as inhibited plant growth and reduced biomass. Under persistent stress conditions, this can culminate in plant mortality[23,24]. A multifaceted approach using multivariate statistical methods—including correlation analysis, membership function analysis, principal component analysis (PCA), cluster analysis, and grey relational analysis—is widely regarded as effective for cultivar tolerance assessment[25]. Among these, the method based on comprehensive evaluation values (D-value) is considered a more reliable[25−28]. This preference arises from its incorporation of the interrelationships among various physiological parameters and consideration of their relative significance.
Kentucky bluegrass (Poa pratensis L.), a perennial cool-season turfgrass species native to Europe and northern Asia, is now widely distributed throughout humid, cold regions of the northern temperate zone. It is valued for its adaptability, fine texture, and extended growth cycle[29,30]. Previous studies on the stress tolerance of Kentucky bluegrass primarily focuses on responses to moisture, temperature, salinity-alkalinity, and metal stress[31−34]. Its responses to O3 stress and the underlying mechanisms remain unclear[31−34]. Therefore, further investigation is needed to elucidate differences in O3 tolerance among cultivars and their underlying physiological response mechanisms. Therefore, this study had three objectives: firstly, to observe phenotypic changes and visible injury in different cultivars under O3 stress; secondly, to analyze differences in key physiological responses to O3 stress among cultivars; and thirdly, to establish an O3 tolerance evaluation system and assess the tolerance of cultivars. The findings provide a scientific basis for selecting and managing turfgrass in high-O3 areas.
-
Six Kentucky bluegrass cultivars were provided by Beijing Zhengdao Seed Industry Co., Ltd. and Beijing Hemuqing Technology Co., Ltd. (Beijing, China), respectively (Table 1). The seeds (0.1 g·pot−1) were sown evenly in polyethylene plastic pots (14 cm × 14 cm × 17 cm), with 12 pots for each cultivar. The substrate in the pots was peat soil mixed with vermiculite (3:1, V:V). After all seedlings have germinated, thin them out to ensure the same plant density in each pot (36 seedlings·pot−1). Seedlings were irrigated daily with tap water to ensure optimal soil moisture.
Table 1. Kentucky bluegrass cultivars and their sources.
Scientific name Abbreviation Origin Supplier Harvest year Poa pratensis L. 'Arcadia' Ar USA Beijing Zhengdao Seed Industry Co., Ltd. 2022 Poa pratensis L. 'Symphony' Sy USA Beijing Hemuqing Technology Co., Ltd. 2022 Poa pratensis L. 'Green wave' Gr USA Beijing Hemuqing Technology Co., Ltd. 2022 Poa pratensis L. 'Baron' Ba USA Beijing Zhengdao Seed Industry Co., Ltd. 2022 Poa pratensis L. 'Fargo' Fa USA Beijing Zhengdao Seed Industry Co., Ltd. 2022 Poa pratensis L. 'Action' Ac USA Beijing Zhengdao Seed Industry Co., Ltd. 2022 Ozone fumigation and experimental treatment
-
The O3 fumigation unit consisted of four equally sized octagonal open-top chambers (OTCs), with a diameter of 4 m and a height of 3 m. The OTCs were located at the Tea Research Institute of the Chinese Academy of Agricultural Sciences (30°18' N, 120°09' E).
Referring to the monitoring data of O3 pollution levels in developed areas of northern China[35], in this study, two O3 concentration levels were set up, i.e., a control group (NF, unfiltered ambient air) and an O3 treatment group (EO3, unfiltered ambient air + 80 ppb O3). Before fumigation, the 12 pots from each cultivar of Kentucky bluegrass were randomly divided into four groups (three pots in each group), and placed in four OTCs for a week for acclimation. Two of the OTCs served as the control group, and the other two OTCs served as the O3 treatment group. Ozone was generated by an O3 generator (CFG-20, Sankang, China), mixed with air, and injected into two OTCs in the EO3 group. The O3 concentration was monitored with an O3 analyzer (Model 49i, Thermo Fisher Scientific, USA), and O3 flow was regulated by a mass flowmeter (CS200, Sevenstar, China) to achieve the target concentration. To minimize the impact of environmental factors, such as the OTC position on the experimental results, the pots within the control group and the treatment group were rotated within their respective group every two days. Fumigation treatment was conducted daily from 09:00 to 17:00 for 10 d. During the treatment period, the daily average O3 concentration, light intensity, relative air humidity, and air temperature in the OTCs were shown in Supplementary Fig. S1. The accumulated O3 over a threshold of 40 ppb (AOT40) for daytime hourly O3 concentrations was 0 and 5.09 ± 0.02 ppm·h under NF and EO3 conditions, respectively. After the treatment, fresh leaf tissues were collected and snap-frozen in liquid nitrogen and then stored at −80 °C for the subsequent determination of physiological indices.
Leaf appearance quality and visible injury
-
All plants were growing healthily before treatment. Visible injury and turfgrass quality were observed and assessed after treatment. Five pots from each treatment group and ten mature leaves per pot were randomly selected for observation. The proportion of leaf visible injury was assessed using ImageJ 1.54[36]. In addition, the National Turfgrass Evaluation Program (NTEP) with a 9-point scale was used to assess turfgrass color, coverage, and uniformity[37]. A score of 1 indicates complete turf necrosis, while a score of 9 corresponds to optimal turf conditions with upright blades, deep green color, high coverage, and good uniformity.
Relative increase of plant height and biomass accumulation
-
To determine the relative increase of plant height (RIH), three pots were randomly selected from each of the control and treatment groups. The initial height (H1) of the plants was measured before the stress treatment, and the height (H2) of the same plants was measured at the end of the stress treatment. RIH = (H2 − H1)/H1 × 100%.
After the O3 treatment, the leaves and roots of the Kentucky bluegrass are separated and cleaned with water, and then dried in an 80 °C oven until constant weight. Subsequently, the dry weight of roots and leaves was measured separately to calculate total plant biomass and root/shoot ratio (RSR).
Gas exchange and chlorophyll (Chl) a fluorescence
-
Leaf gas exchange and Chl a fluorescence parameters were measured using a portable Li-6400 photosynthesis system equipped with a fluorescence leaf chamber (Li-Cor Inc., Lincoln, NE, USA). The measurements were conducted between 9:00 and 11:00 a.m. During the measurement process, the photosynthetically active radiation (PAR) was set at 1,500 µmol·m−2·s−1, the CO2 concentration was set at 400 µmol·mol−1, the flow value was adjusted to 500 µmol·s−1, and the leaf temperature was 25 °C. The determination of Chl fluorescence parameters began by dark-adapting leaves with tin foil for 30 min. Initial fluorescence (Fo) and maximum fluorescence (Fm) were measured using sufficiently low modulated irradiation (< 0.1 μmol·m−2·s−1) and a 0.8 s saturating pulse (> 8,000 μmol·m−2·s−1), respectively. The maximum photochemical efficiency (Fv/Fm) was then calculated. After 2 min of dark-adapted state, actinic light (400 μmol·m−2·s−1) was turned on. After the stabilization of steady-state fluorescence (Fs) within 5 min, Fm' and Fo' under actinic light were measured. The non-photochemical quenching coefficient (NPQ), photochemical quenching coefficient (qP), and photosynthetic electron transfer rate (ETR) were calculated simultaneously. For each cultivar, three pots were selected in each treatment group, and three leaves at the same leaf position were measured in each pot.
Chl content and antioxidant enzyme activities
-
Chl content was determined using Lichtenthaler's method, with certain modifications[38]. Fresh leaf samples (0.1 g) were placed in a test tube containing 5 ml of acetone (80%, v/v) at 4 °C for 48 h in the dark, with intermittent shaking three or four times until the leaves turned white.
To determine the activities of superoxide dismutase (SOD), peroxidase (POD), and catalase (CAT), 0.2 g of frozen leaves was ground with 3 mL of phosphate buffer (pH 7.8) on ice. Subsequently, the mixture was centrifuged at 4,000 r·min−1 at 4 °C for 20 min. The supernatant was used for enzyme activity assays. SOD activity was measured by assessing the inhibition of NBT photochemical reduction at 560 nm[39]. One unit (U) of SOD activity was defined as the amount of enzyme that inhibits NBT photoreduction by 50%. POD activity was measured by determining the guaiacol oxidation rate induced by H2O2 at 470 nm, and the enzyme activity U is defined as an increase of 0.01 in absorbance at 470 nm within 1 min[40]. CAT activity was measured based on the decrease in absorbance at 240 nm as H2O2 was consumed, and the enzyme activity U is calculated based on a reduction of 0.1 within 1 min[41].
Malondialdehyde (MDA) content was measured by the thiobarbituric acid (TBA) colorimetric method[42].
Ozone tolerance evaluation
-
The comprehensive assessment of tolerance according to the method of Guo et al.[28]. All measured indicators were subjected to PCA, and the membership function value U(xi) was calculated based on the PCA results.
$ {\rm U}(x_{i}) =\dfrac{{X}_{i}-{X}_{min}}{{X}_{max}-{X}_{min}} ,\;\; i=1, 2, 3,..., n $ (1) The weight of each comprehensive indicator (Wi) was calculated using the following formula:
$ W_{i} =\dfrac{{P}_{i}}{\sum {P}_{i}} ,\;\; i=1, 2, 3, ..., n $ (2) D-value is the evaluation value of comprehensive O3 tolerance, the higher the D is, the higher the comprehensive O3 tolerance of the cultivar. The calculation formula of the D-value is as follows:
$ D =\sum [\mathrm{U}\left({x}_{i}\right)\times {W}_{i}] ,\;\; i=1, 2, 3, ..., n $ (3) Data analysis
-
Data analysis and graphing were performed using SPSS 26.0 (SPSS Inc., Chicago, USA) and GraphPad Prism 9 (GraphPad Software, USA). All data were represented as means ± standard deviation (SD). Origin 2024 (OriginLab Corporation, Northampton, USA) was used for Pearson's correlation analysis among physiological parameters and PCA. The relative change rate of physiological parameters between treatment and control was calculated as (Meantreatment − Meancontrol)/Meancontrol × 100%.
-
Compared to the control group, all six cultivars suffered visible injury due to O3 stress (Fig. 1a). Among these cultivars, Ar and Sy exhibited minimal leaf damage, with only slight yellowing of a few leaves. Cultivars Gr and Ba showed slight growth inhibition, with some leaves yellowing and wilting. The growth of Fa and Ac was significantly affected, with substantially increased rates of leaf withering. Cultivar Ac exhibited the highest proportion of visible leaf injury (57.08%, Table 2).
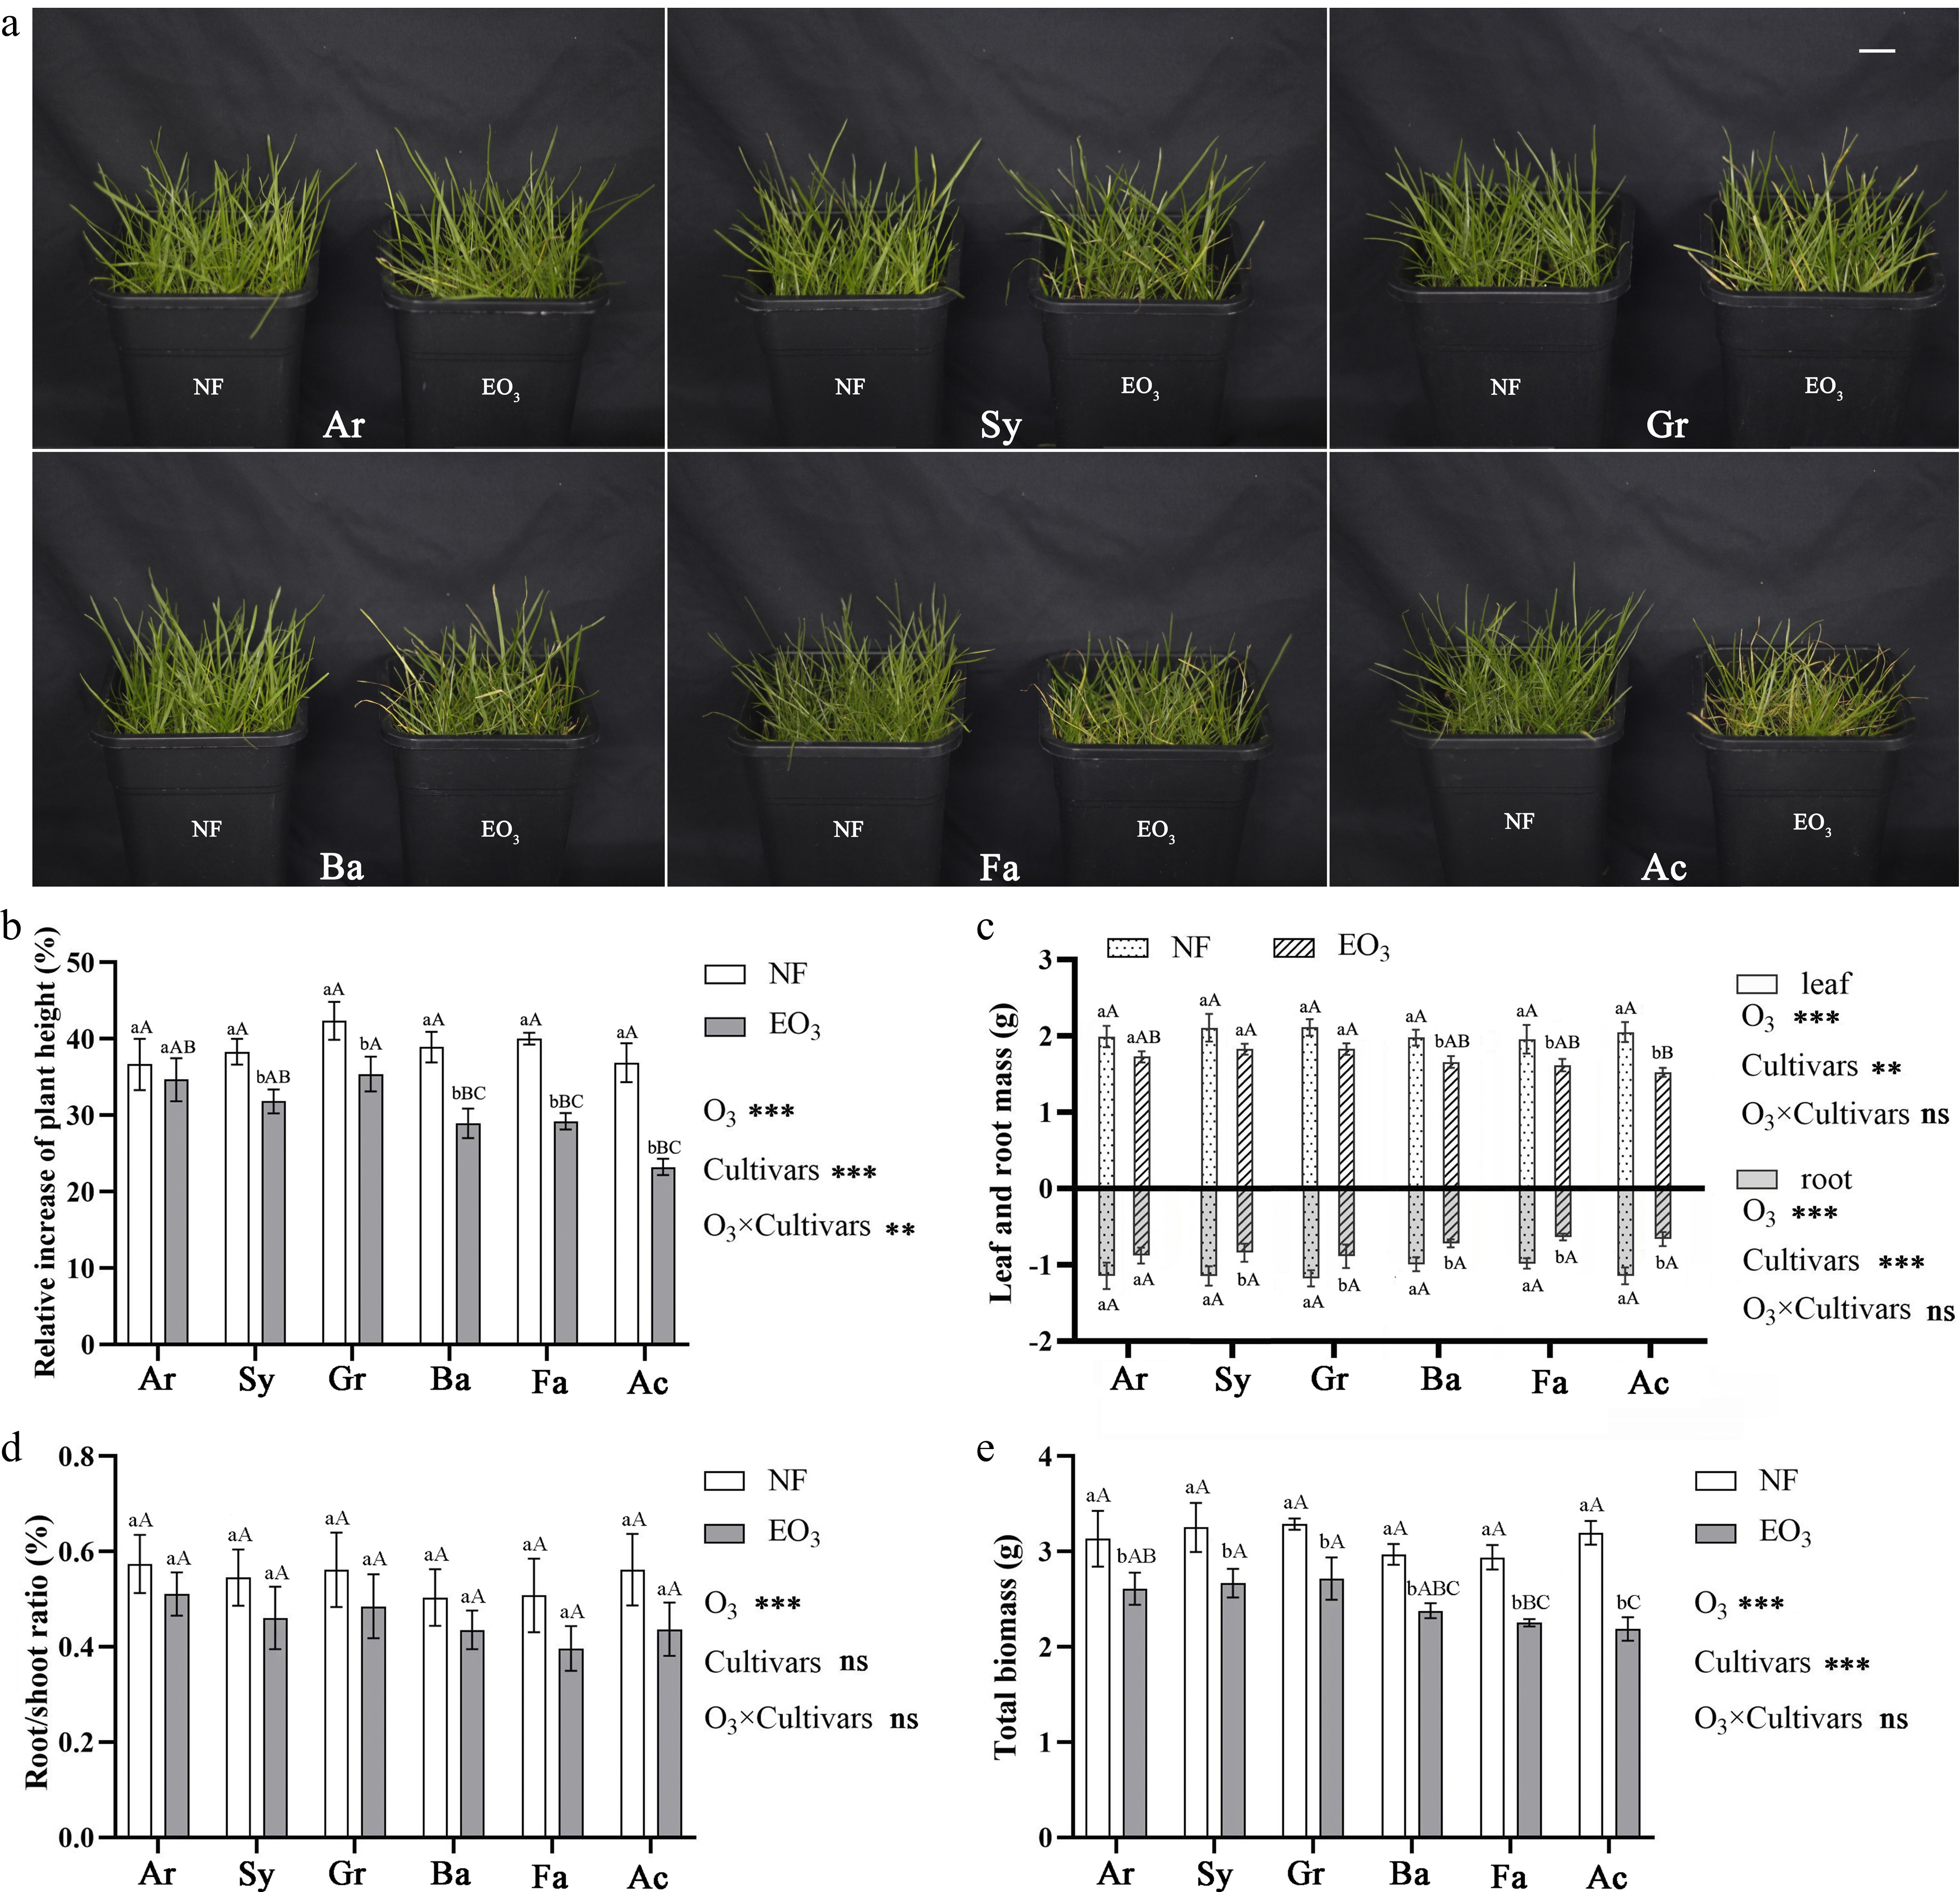
Figure 1.
Growth status of Kentucky bluegrass different cultivars under (a) ozone stress, and (b) effects of ozone stress on the relative increase of plant height, (c) leaf mass and root mass, (d) root/shoot ratio, and (e) total biomass of Kentucky bluegrass cultivars. The scale in (a) is 2 cm. * represents the significance of two-way ANOVA: * p < 0.05, ** p < 0.01, *** p < 0.001, ns: no significant difference (Tukey test). Different lowercase letters and capital letters indicate significant difference between different treatment groups of the same cultivar, or differences among cultivars under the same treatment (p < 0.05). NF, non-filtered ambient air, as a control; EO3, non-filtered ambient air + 80 ppb O3. The name of cultivars are shown in Table 1.
Table 2. Leaf visible injury and quality score of six Kentucky bluegrass cultivars.
Cultivar Visible injury (%) Density Color Texture Uniformity Score Ar 23.09 ± 1.92 e 8 7 8 8 7.75 Sy 27.12 ± 1.59 de 7 7 7 8 7.25 Gr 31.30 ± 2.15 cd 6 6 7 8 6.75 Ba 33.45 ± 2.56 c 7 6 6 7 6.50 Fa 50.62 ± 2.72 b 5 5 4 5 4.75 Ac 57.08 ± 2.84 a 3 4 3 4 3.50 Different letters in the same column indicate significant differences (p < 0.05, Tukey test). Ozone stress inhibited RIH in Kentucky bluegrass, and the relative decreases were significantly different in different cultivars. In cultivars Sy, Gr, Ba, Fa, and Ac, RIH was reduced by 16.91%, 16.44%, 25.60%, 27.01%, and 36.98%, respectively, compared to the control group, while cultivar Ar showed no change (Fig. 1b). Biomass analysis revealed O3-induced reductions in the leaf dry weight, root dry weight, and total biomass of all cultivars compared to the control. The RIH remained statistically unchanged among treatments.
Effects of ozone stress on photosynthetic characteristics of different Kentucky bluegrass cultivars
-
Ozone stress and cultivar both have significant effects on the gas exchange parameters (Pn, gs, Ci, Tr) and Chl fluorescence parameters (Fv/Fm, qP, ETR, NPQ) of Kentucky bluegrass, and the response differences among cultivars were significant (Fig. 2).
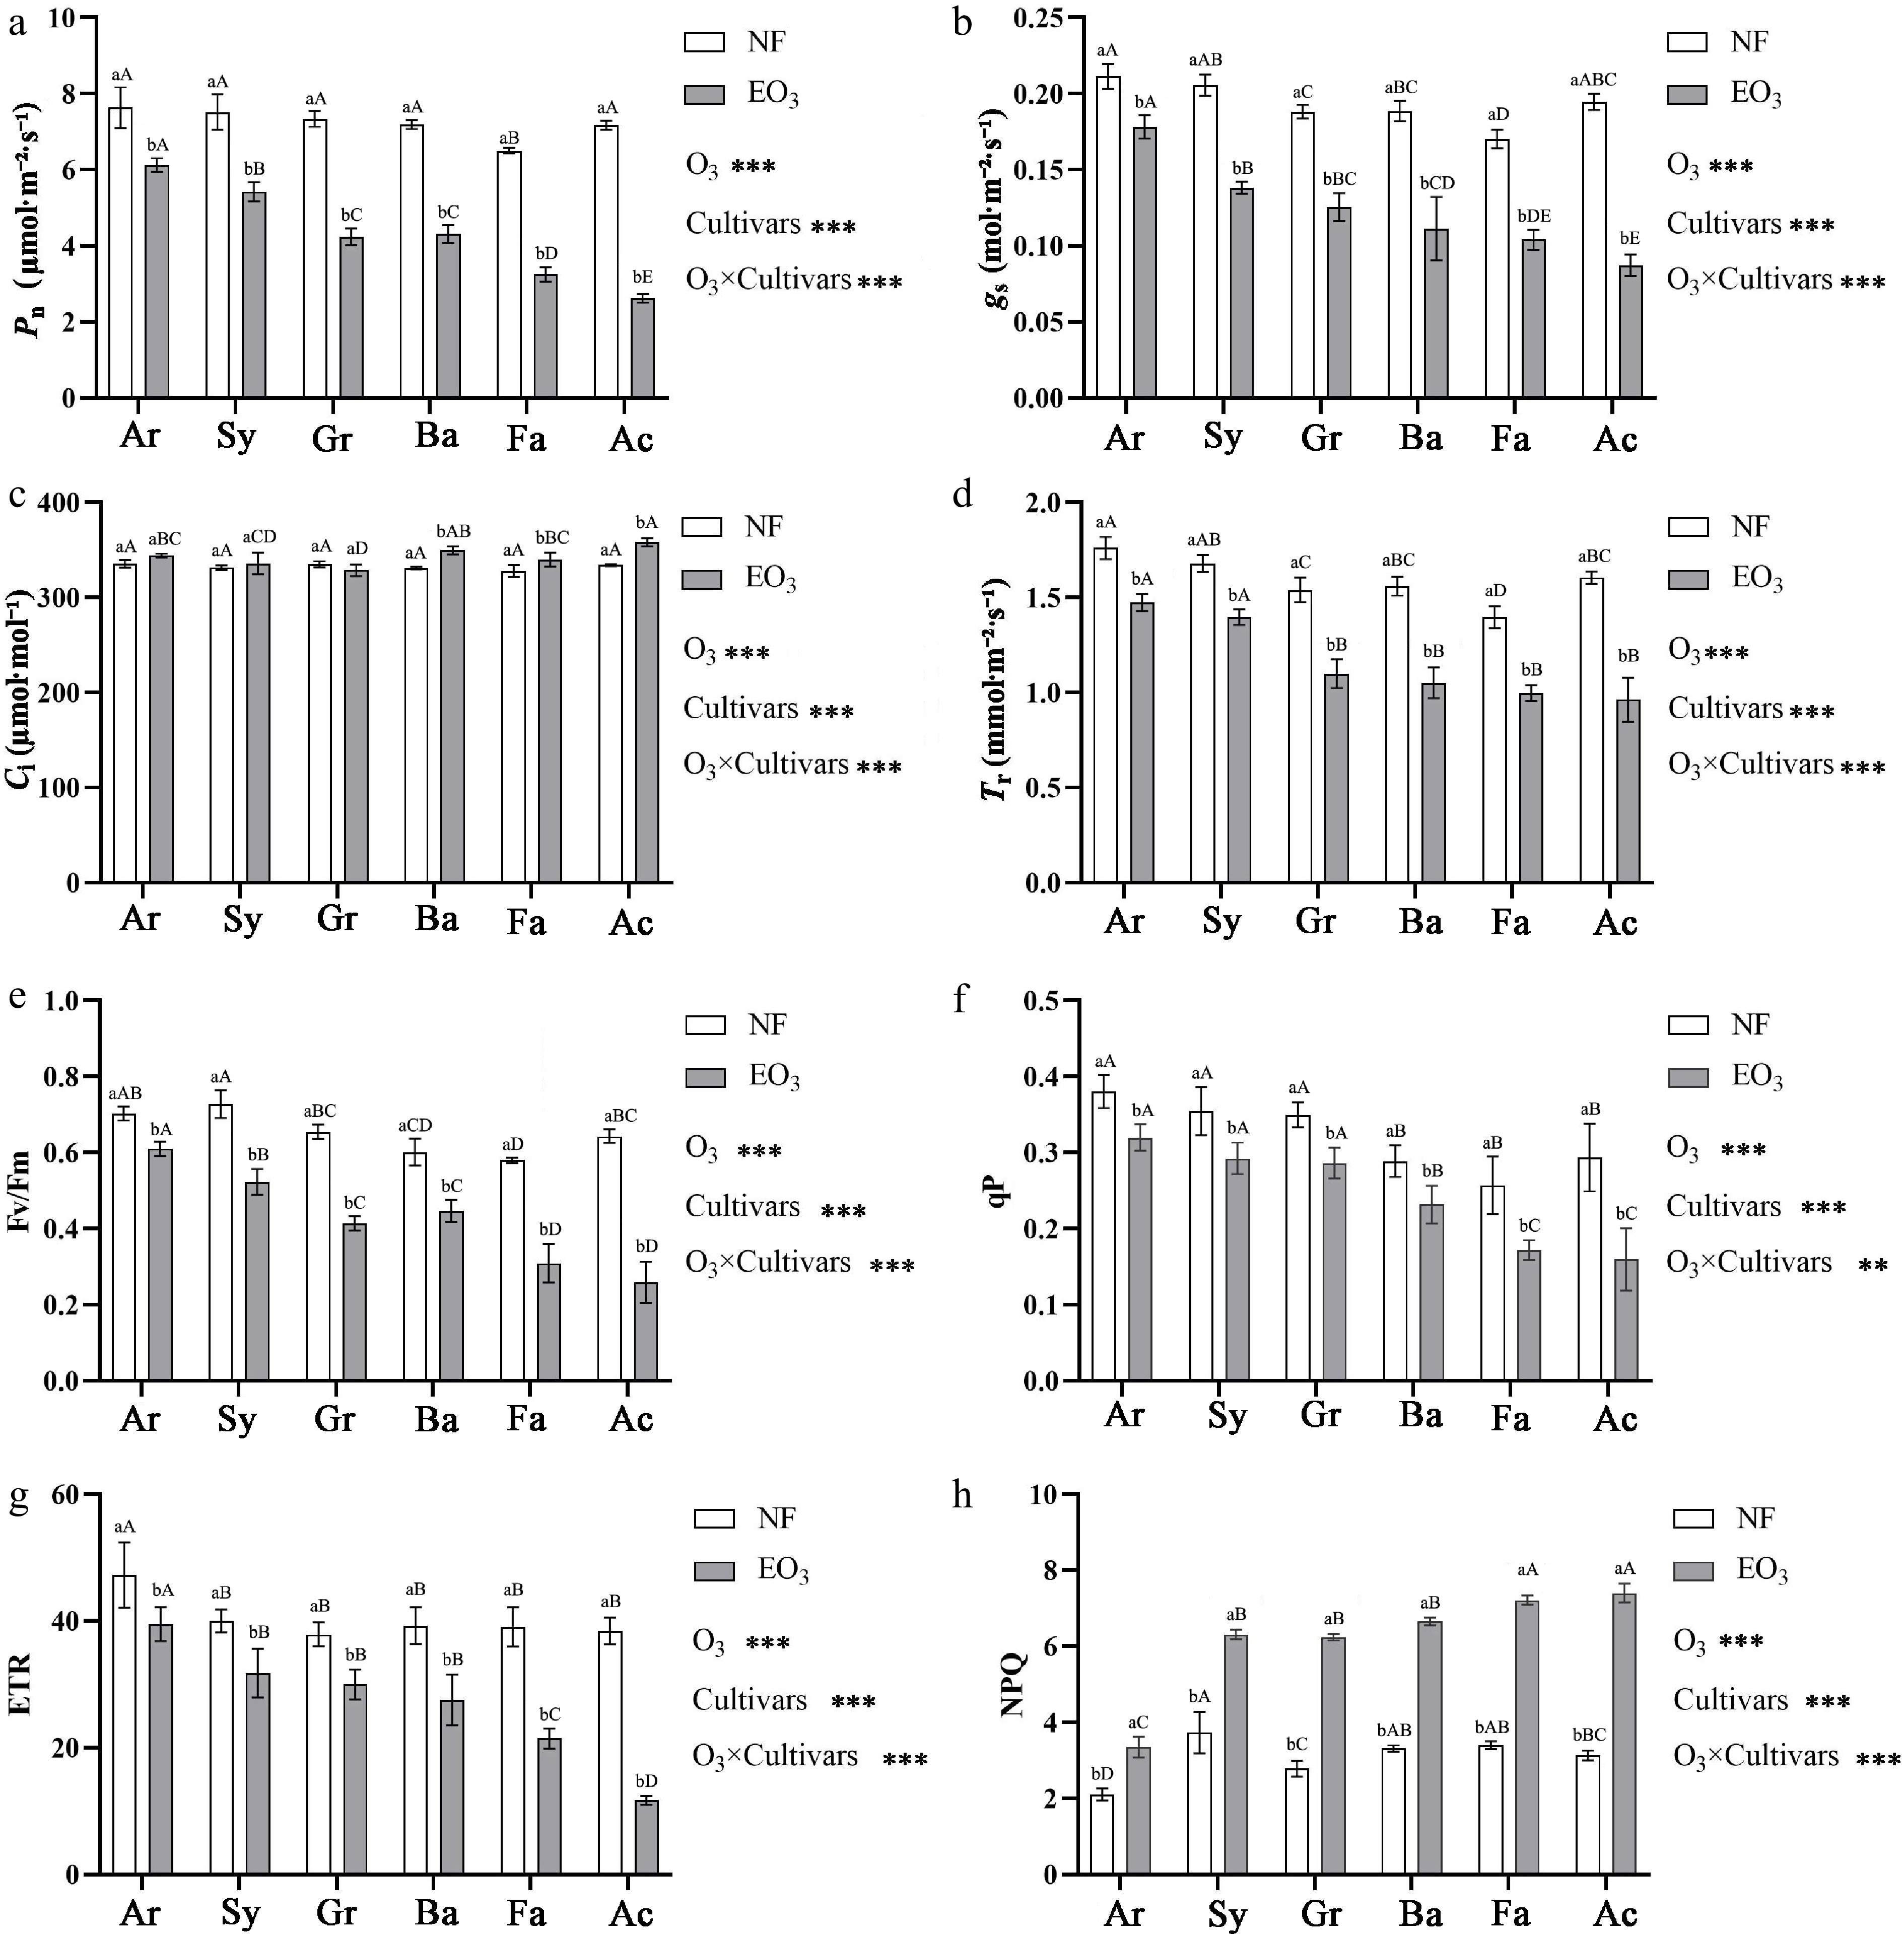
Figure 2.
Effects of ozone stress on the net photosynthetic rate (Pn, a), stomatal conductance (gs, b), intercellular CO2 concentration (Ci, c), transpiration rate (Tr, d), and chlorophyll fluorescence parameters (Fv/Fm, e; qP, f; ETR, g; NPQ, h) of Kentucky bluegrass cultivars. Notes for statistical analysis, abbreviations, and cultivar names are provided in Table 1 and Fig. 1.
All six cultivars exhibited reductions in Pn, gs, and Tr compared to the control group, there were differences in the cultivars' responses to O3 stress: Pn decreased by 19.79%, 27.78%, 42.32%, 40.03%, 50.06%, and 63.50% for Ar, Sy, Gr, Ba, Fa, and Ac, respectively. Similarly, gs decreased by 15.70%, 32.77%, 33.30%, 41.02%, 38.92%, and 55.16%, respectively, while Tr decreased by 16.25%, 16.78%, 28.58%, 32.56%, 28.54%, and 40.10%, respectively. However, the Ci showed a different trend: there were no changes in cultivars Ar, Sy, and Gr, while they increased by 5.22%, 4.74%, and 7.42% in cultivars Ba, Fa, and Ac, respectively (Fig. 2a−d).
Chl fluorescence parameters showed that Fv/Fm, qP, and ETR decreased under O3 stress. Specifically, the Fv/Fm of cultivars Ar, Sy, Gr, Ba, Fa, and Ac decreased by 13.17%, 28.07%, 36.76%, 25.69%, 46.78%, and 59.78%, respectively. The qP of six cultivars decreased by 15.86%, 17.61%, 18.05%, 19.83%, 33.08%, and 45.60%, respectively. The ETR of six cultivars decreased by 16.35%, 20.57%, 20.90%, 29.91%, 45.08%, and 69.60%, respectively. However, NPQ demonstrated a significant increase across all cultivars, with the NPQ of six cultivars reaching 1.59, 1.69, 2.24, 2.01, 2.12, and 2.36 times that of the control group, respectively (Fig. 2e−h).
Effects of ozone stress on Chl levels in different Kentucky bluegrass cultivars
-
Ozone stress reduced the content of Chl a, Chl b, and Chl T in Kentucky bluegrass, and there were differences in the response of different cultivars to O3 stress (Fig. 3). For Chl a content, cultivar Ar showed no change, while cultivars Sy, Gr, Ba, Fa, and Ac decreased by 7.68%, 11.07%, 9.54%, 11.16%, and 18.76%, respectively, compared to the control group. For Chl b content, reductions were restricted to Fa (13.82%) and Ac (20.47%). For Chl T content, the reduction rates for the six cultivars were 5.64% (Ar), 7.02% (Sy), 10.75% (Gr), 9.84% (Ba), 11.79% (Fa), and 19.14% (Ac). Notably, while O3 stress decreased both Chl a and Chl b content across different cultivars, the Chl a/b ratio exhibited no significant changes among them.
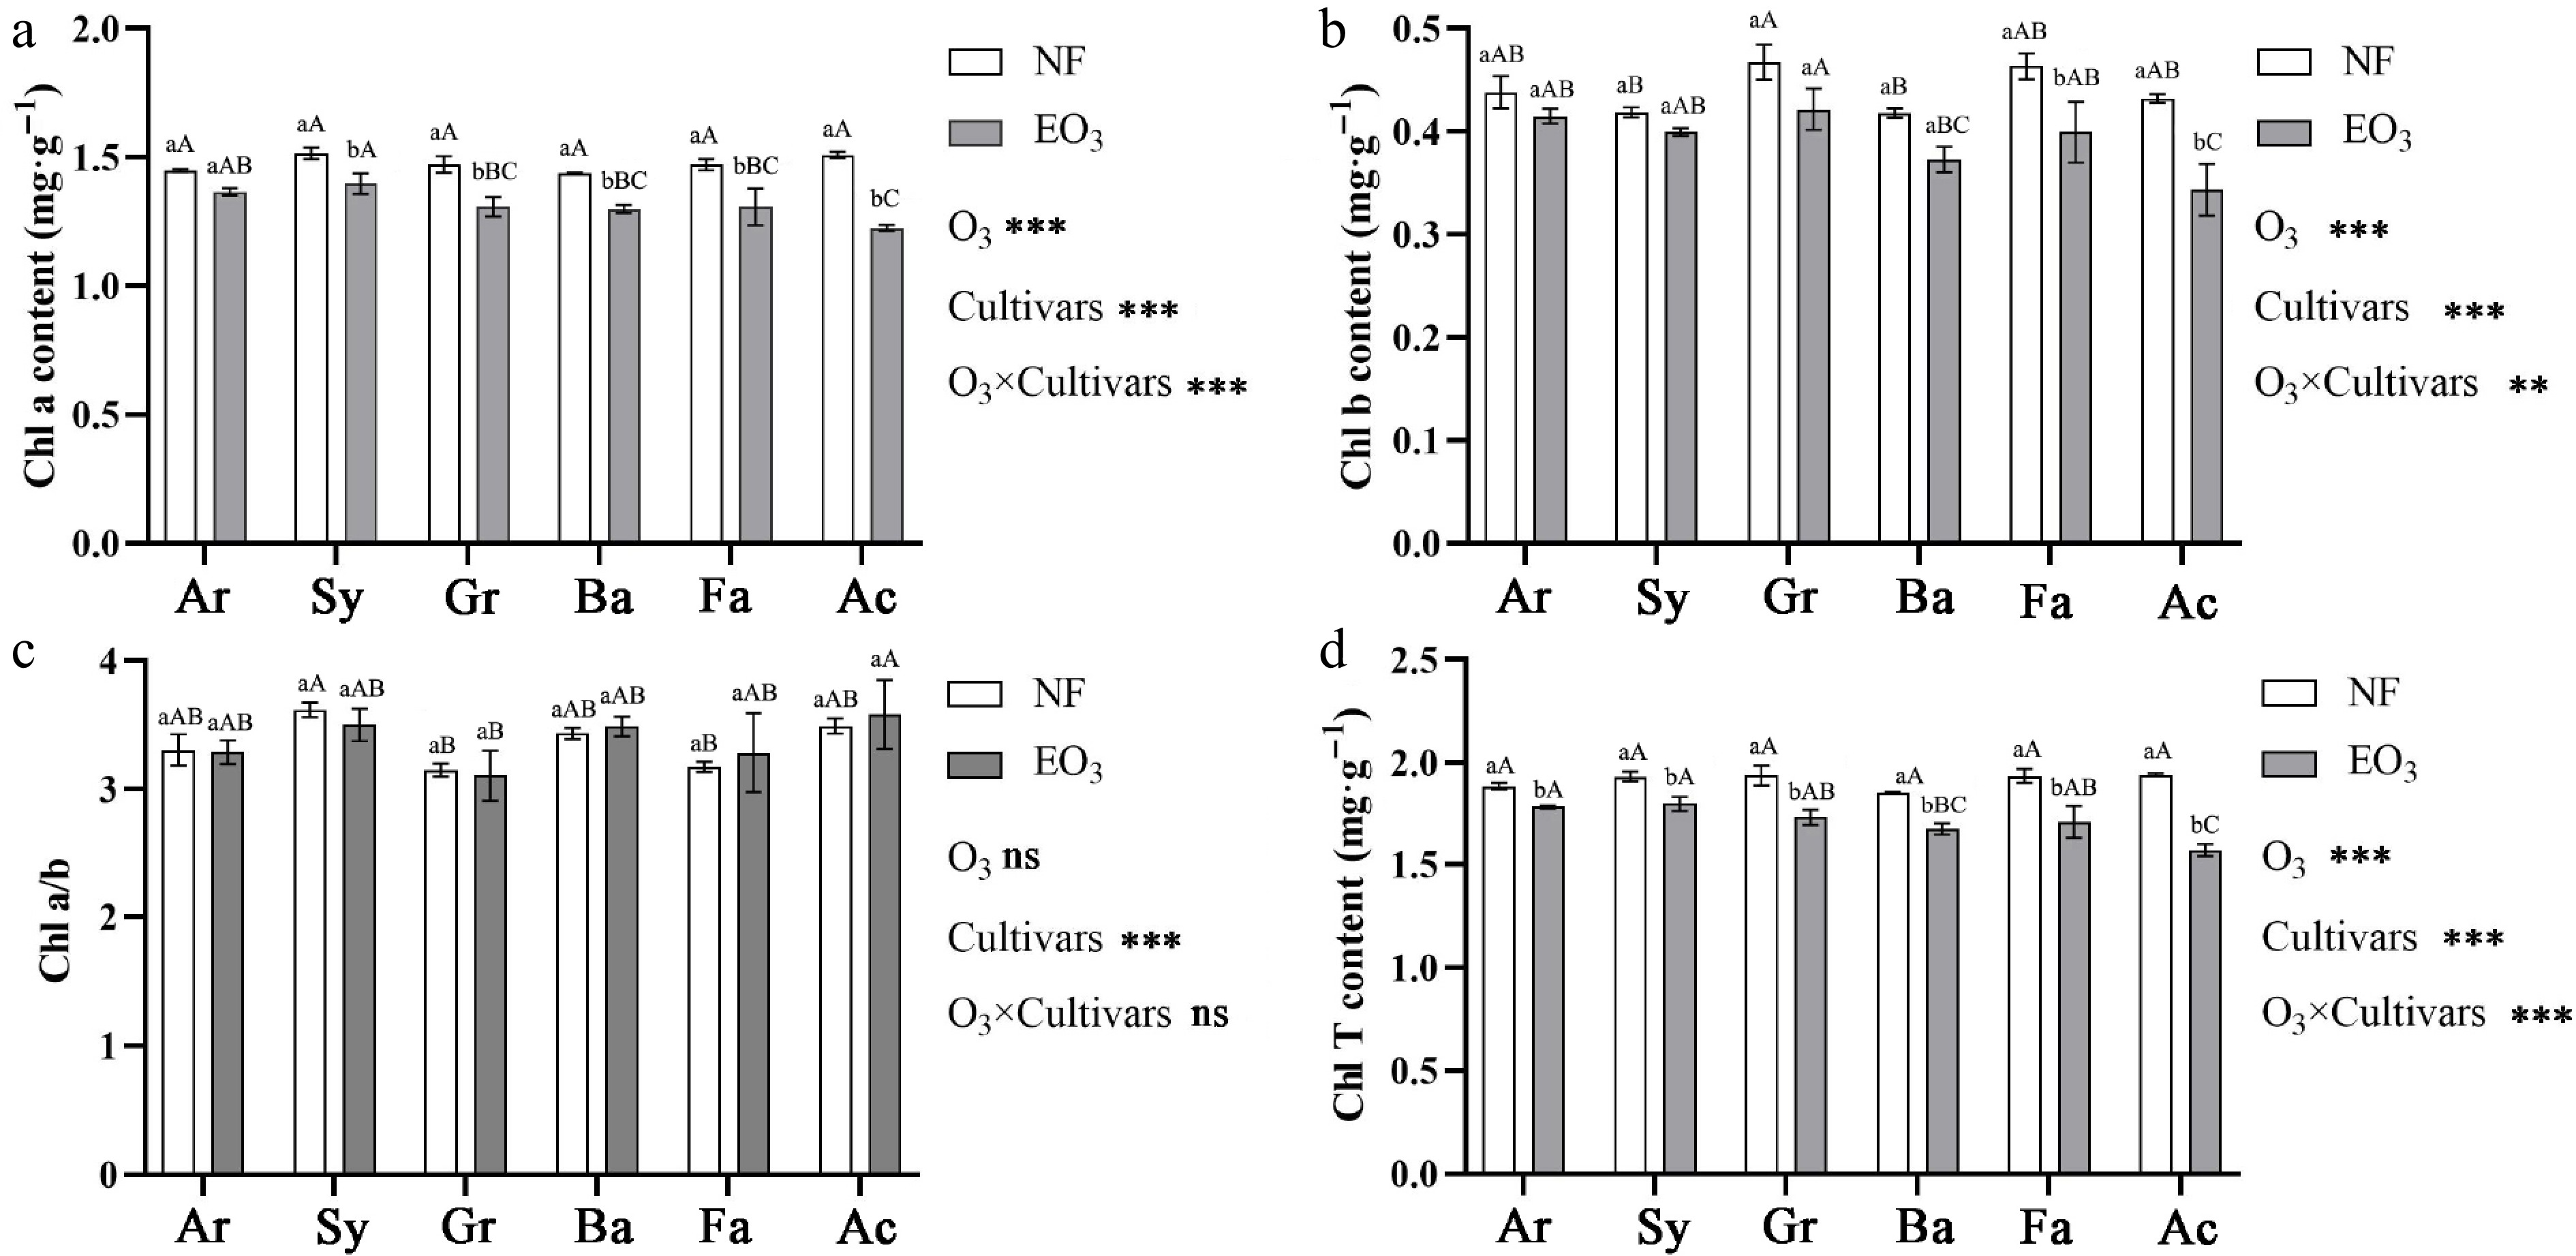
Figure 3.
Effects of ozone stress on (a) chlorophyll a (Chl a), (b) chlorophyll b (Chl b), (c) chlorophyll a/chlorophyll b (Chl a/b), and (d) total chlorophyll (Chl T) content of Kentucky bluegrass cultivars. Notes for statistical analysis, abbreviations, and cultivar names are provided in Table 1 and Fig. 1.
Effects of ozone stress on MDA content and antioxidant enzyme activities in different Kentucky bluegrass cultivars
-
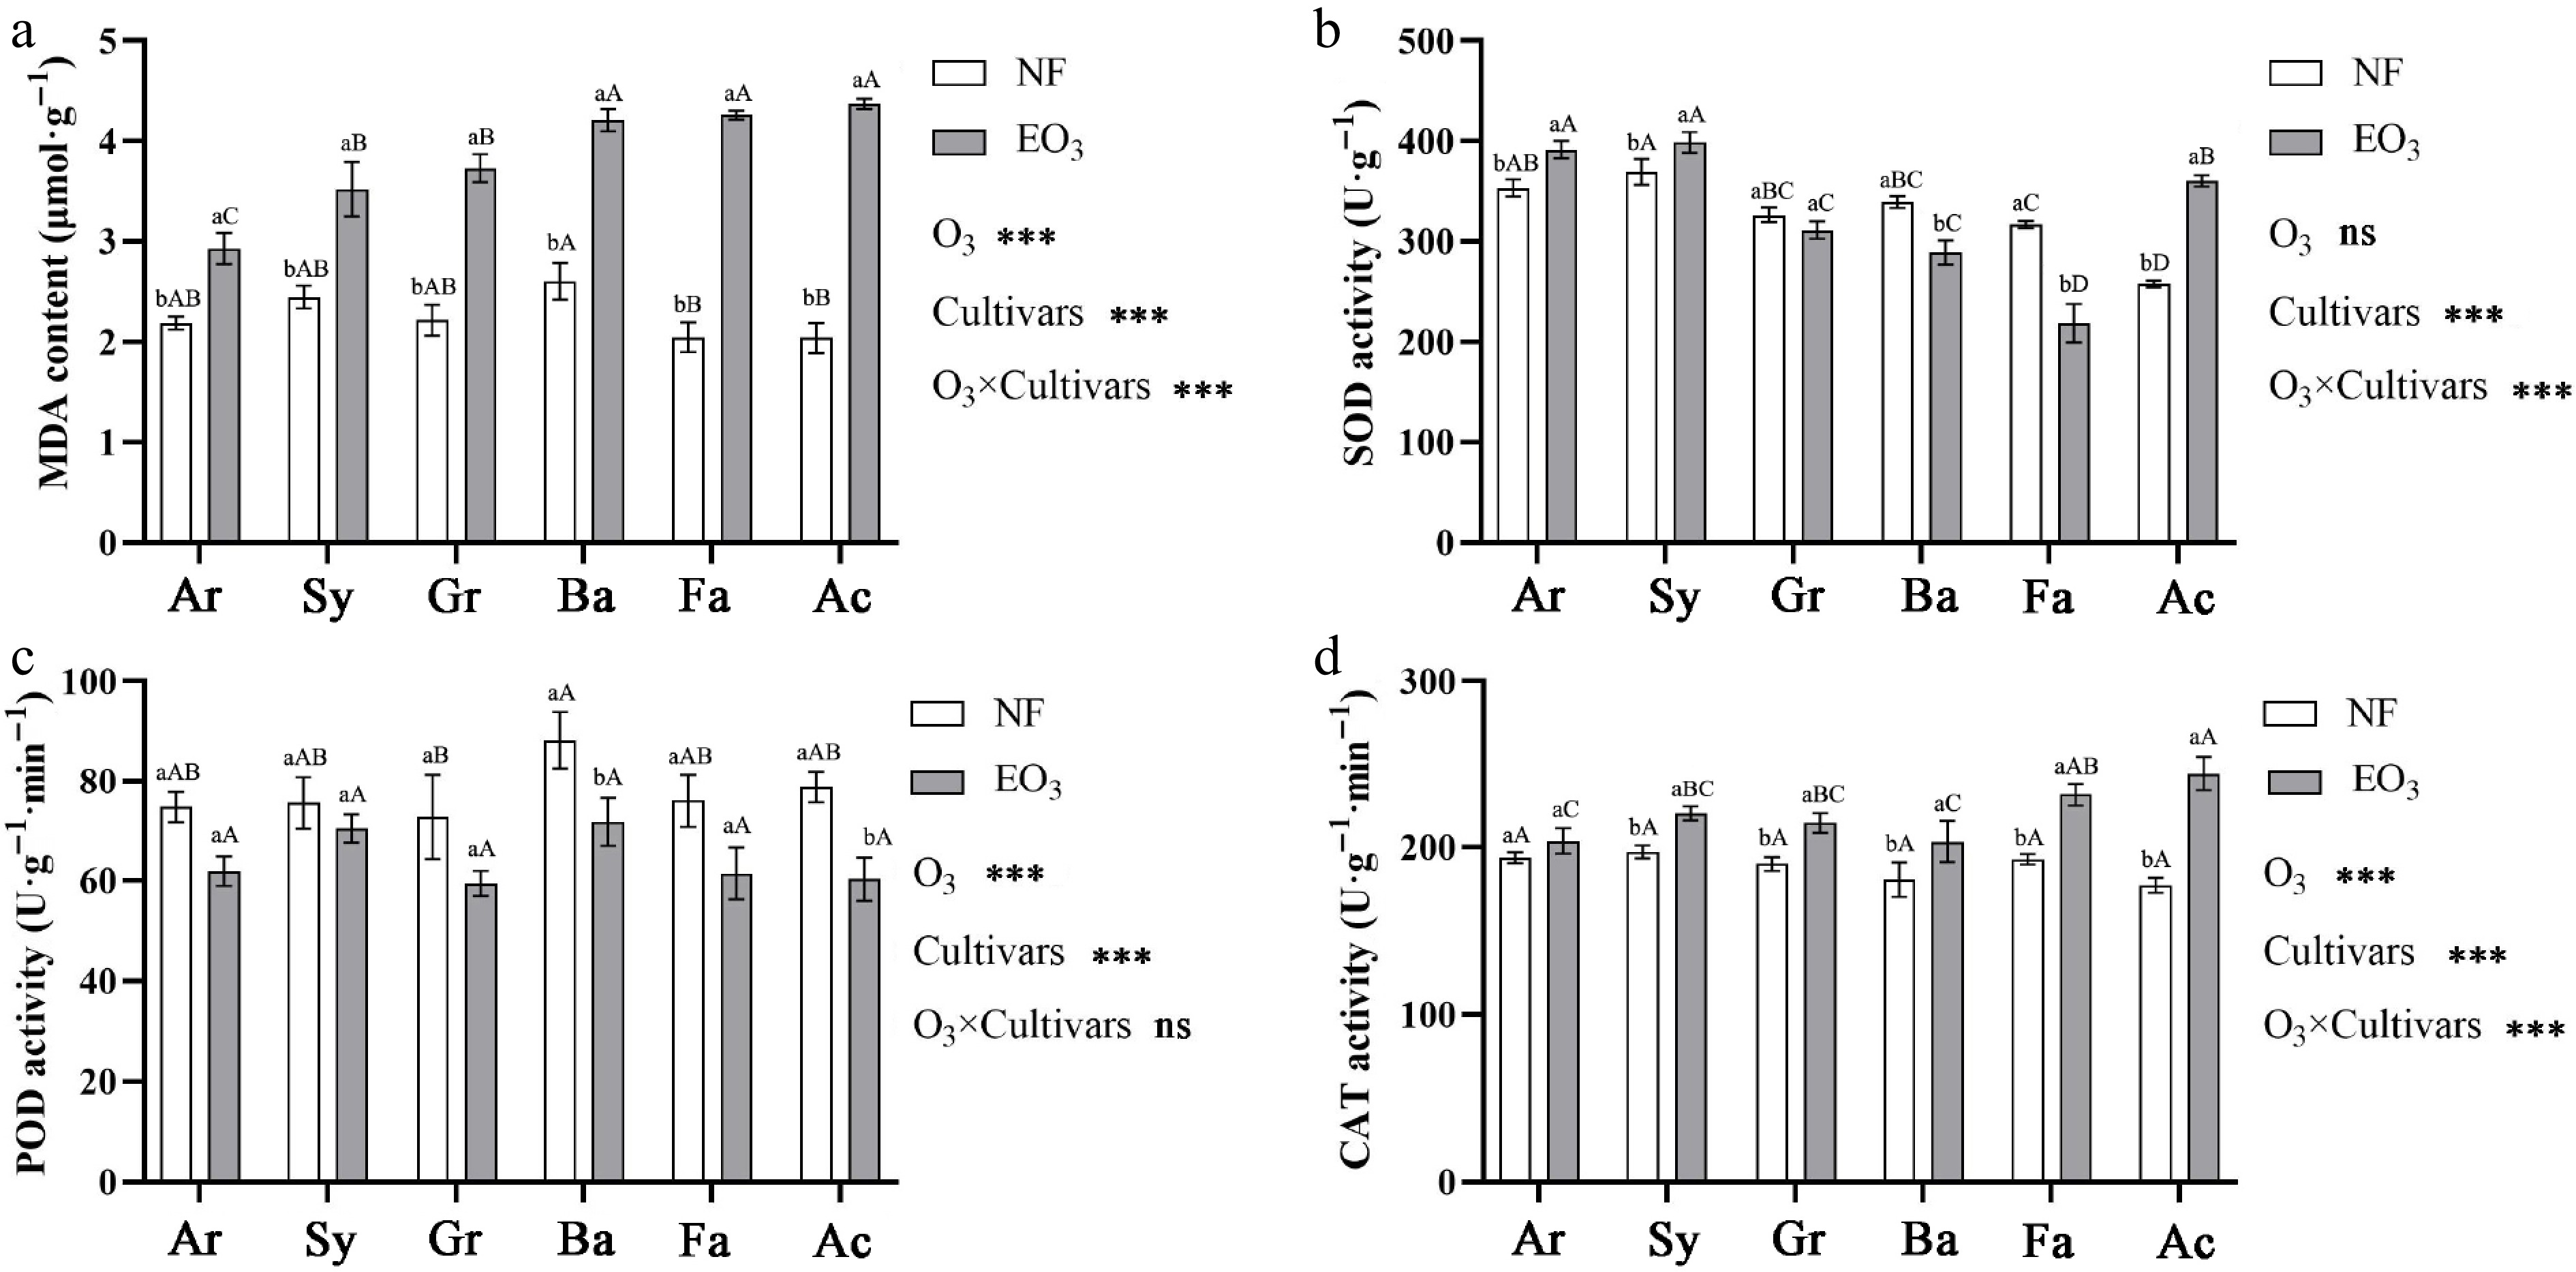
Under O3 stress, increases in MDA content were observed in Kentucky bluegrass cultivars, with cultivar-specific responses showing 1.34, 1.44, 1.68, 1.62, 2.08, and 2.07 times increases in Ar, Sy, Gr, Ba, Fa, and Ac, respectively, compared to the control (Fig. 4a). Antioxidant enzyme activities showed different response patterns, with SOD activity showing significant cultivar × O3 interaction effects. Cultivars Ar, Sy, and Ac exhibited increased activity, while Ba and Fa showed decreased activity (Fig. 4b). POD activity was inhibited by O3 in cultivars Ba and Ac (Fig. 4c). However, CAT activity exhibited a significant O3 × cultivar interaction, with Sy, Gr, Ba, Fa, and Ac showing increased activity. Notably, Ac demonstrated the most substantial increase, reaching 1.38 times to CAT activity of the control group (Fig. 4d).
Comprehensive evaluation of ozone tolerance in different Kentucky bluegrass cultivars
Correlation analysis
-
Among the 19 indicators, a relatively obvious correlation was observed between photosynthetic and growth indicators (Fig. 5). Specifically, Pn, Tr, gs, Fv/Fm, qP, ETR, Chl b, Chl a, Chl T, RIH, biomass, and RSR were positively correlated. Ci and NPQ were negatively correlated with Pn, Tr, ETR, Chl b, Chl a, Chl T, RIH, and total biomass, but positively correlated with MDA and CAT. MDA and CAT were negatively correlated with some fluorescence parameters, photosynthetic pigments, and growth indicators. SOD showed no relation with other indicators, while POD correlated well with certain photosynthetic and growth indicators. Overall, the indicators exhibited varying degrees of correlation, resulting in data redundancy and potentially undermining accurate assessment of O3 tolerance. Principal component analysis (PCA) in the following will be introduced to reduce the data dimensionality and construct a comprehensive evaluation system based on the weight coefficients of each indicator.
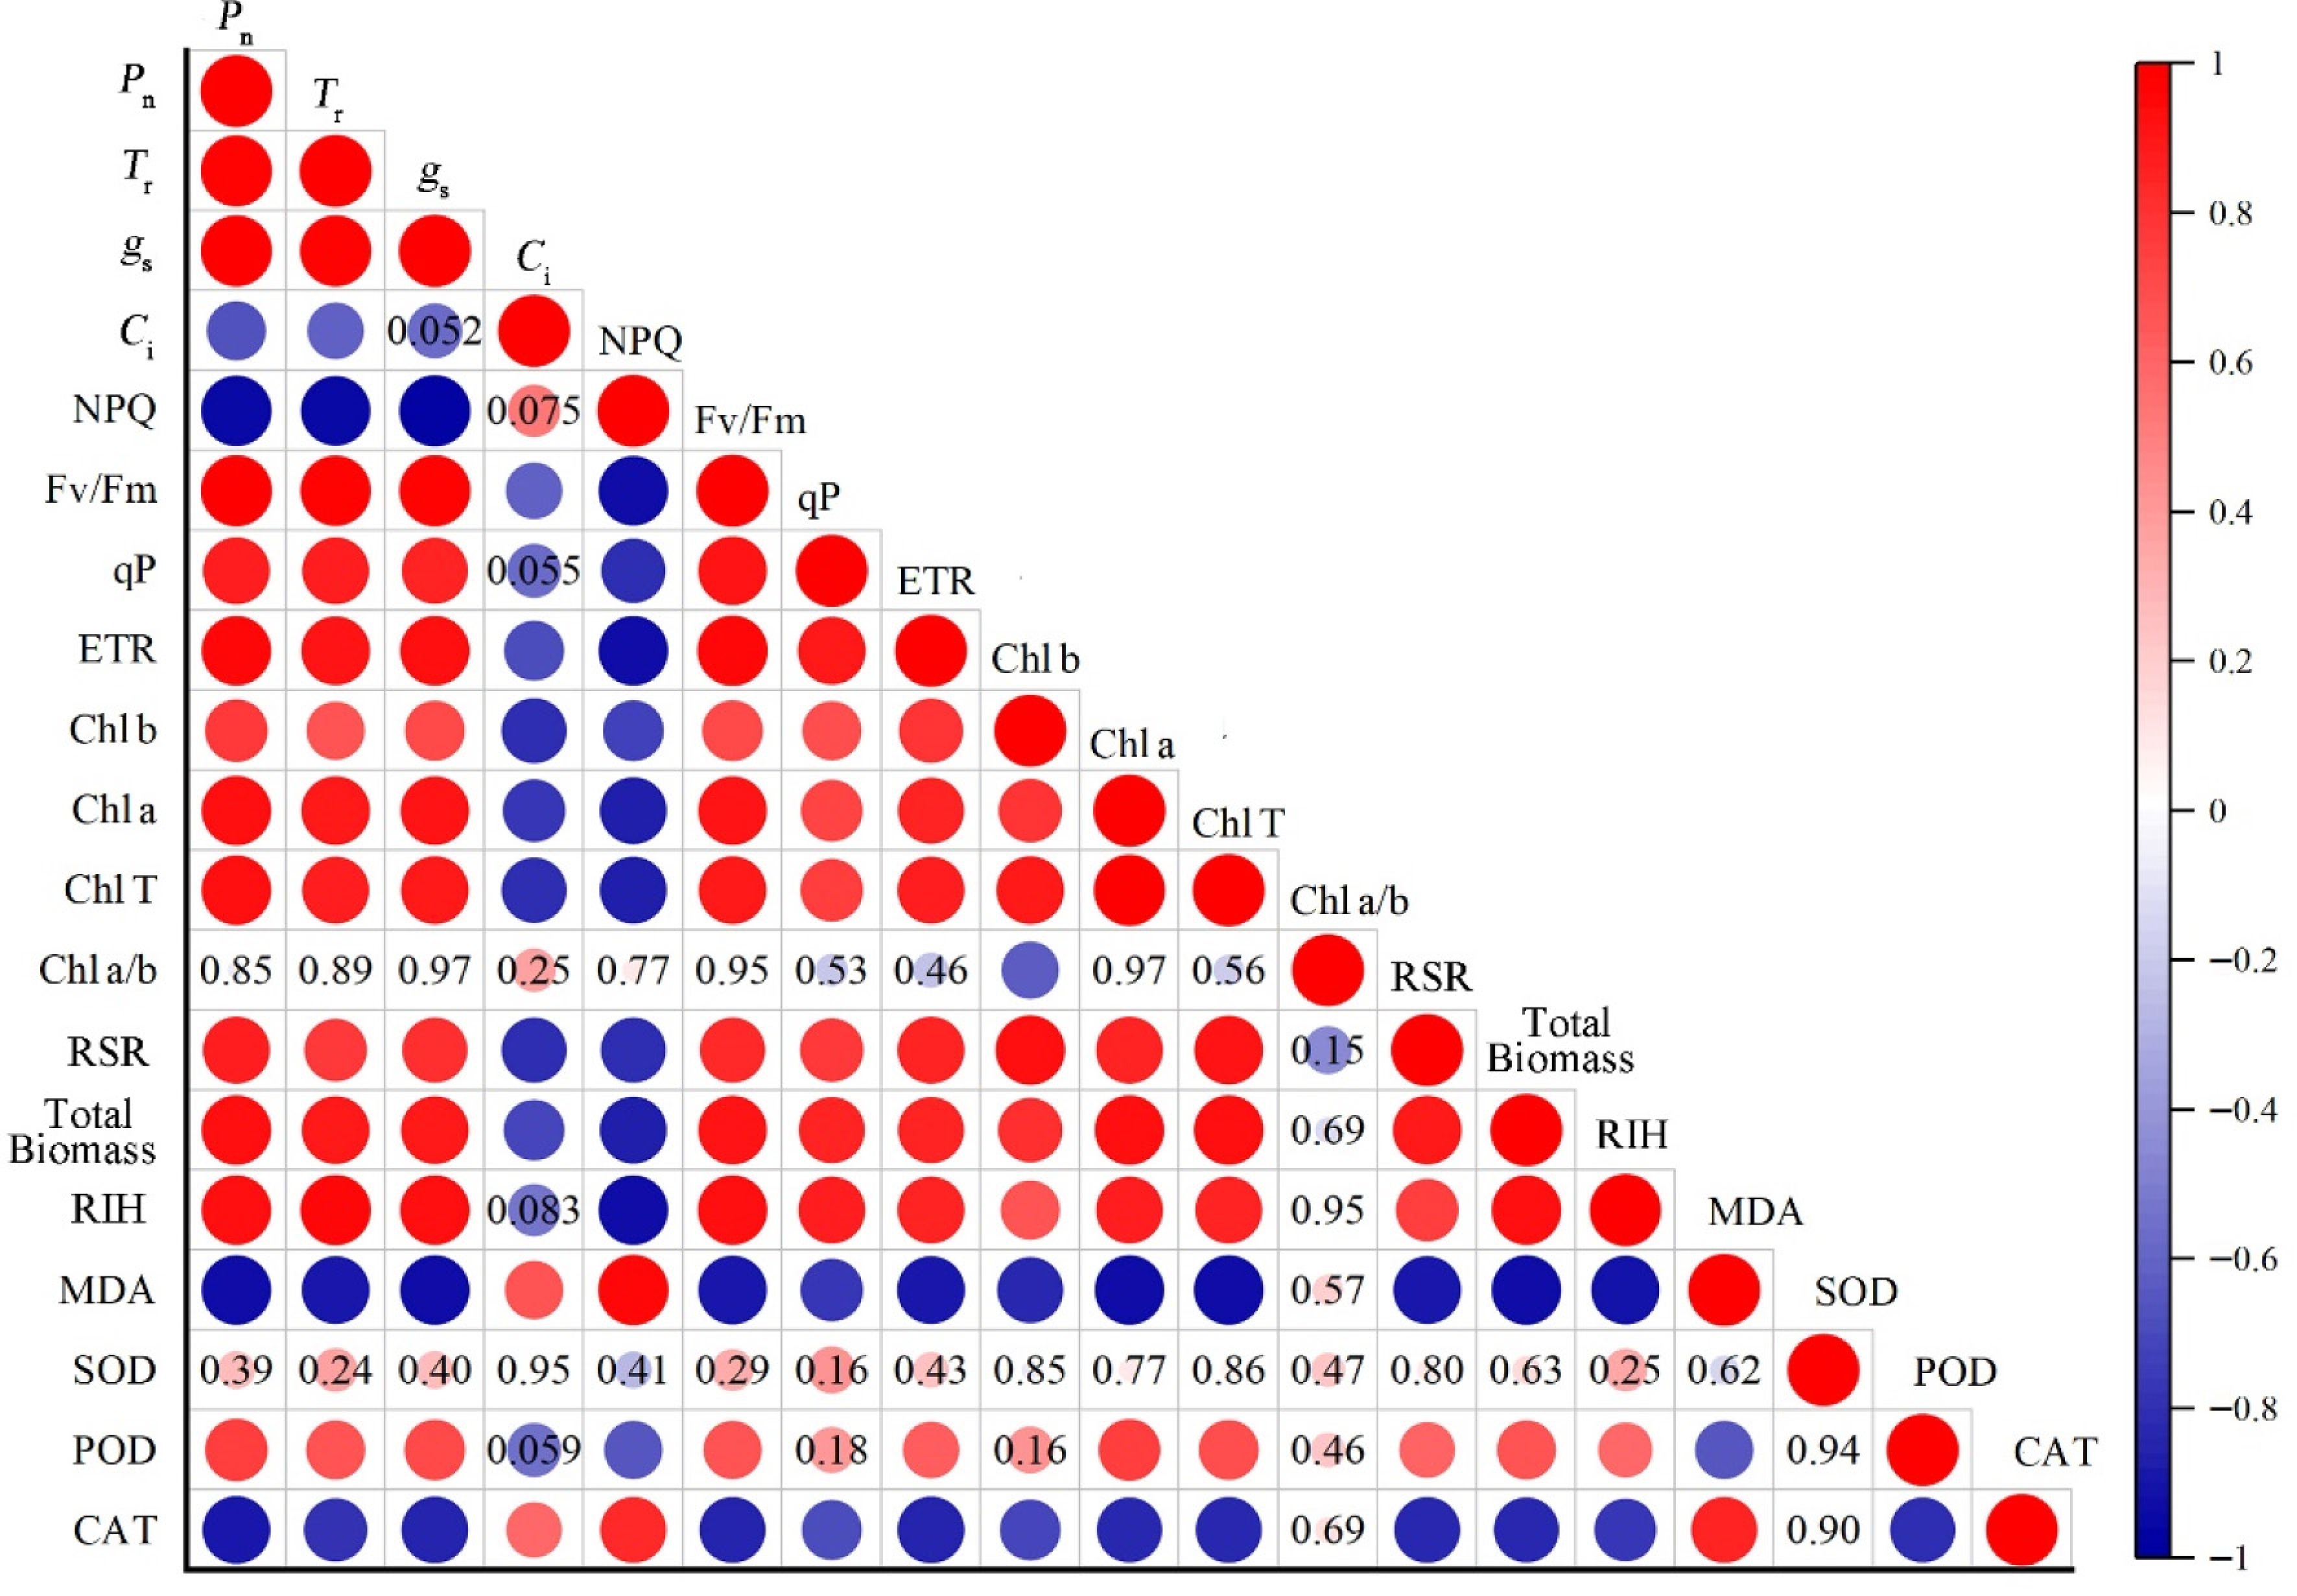
Figure 5.
Pearson's correlation analysis of growth and physiological indexes of Kentucky bluegrass. Pn: net photosynthetic rate; Tr: transpiration rate; gs: stomatal conductance; Ci: intercellular CO2 concentration; NPQ: non-photochemical quenching; Fv/Fm: maximum photochemical efficiency; qP: photochemical quenching; ETR: electron transport rate; Chl b: chlorophyll b; Chl a: chlorophyll a; Chl T: total chlorophyll; Chl a/b: chlorophyll a/b; RSR: root/shoot ratio; RIH: relative increase of plant height; MDA: malondialdehyde; SOD: superoxide dismutase; POD: peroxidase; CAT: catalase. The significance level is p < 0.05. The color scale represents the degree of correlation and the colored circles marked with numbers indicate non-significant correlations.
Principal component analysis
-
The PCA was conducted on 19 physiological and biochemical indicators, with principal components extracted according to the criterion of eigenvalues > 1. Three principal components (PCs) were ultimately retained. The contribution rates of these PCs were 73.31%, 9.70%, and 6.47%, respectively, with a cumulative contribution rate of 89.47% (Supplementary Table S1), meeting analytical requirements. Most of the PC 1 were positive indicators, and the loading weights of total biomass, Chl a, Chl T, Pn, Tr, gs, and Fv/Fm were the highest. While MDA and NPQ were higher among the negative indicators. These results prove that PC 1 mainly reflects the impact of O3 stress on the photosynthetic system. PC 2 had many positive indicators, and the loading weight of Chl a/b was more prominent, while the highest negative indicator was Chl b, indicating that PC 2 mainly reflects the relationship between Chl and O3 stress (Supplementary Table S1; Fig. 6a). Compared to the control group, the greater dispersion observed in the O3-treated group indicated significant cultivar-specific differences, suggesting differential tolerance to O3 among the cultivars (Fig. 6b).
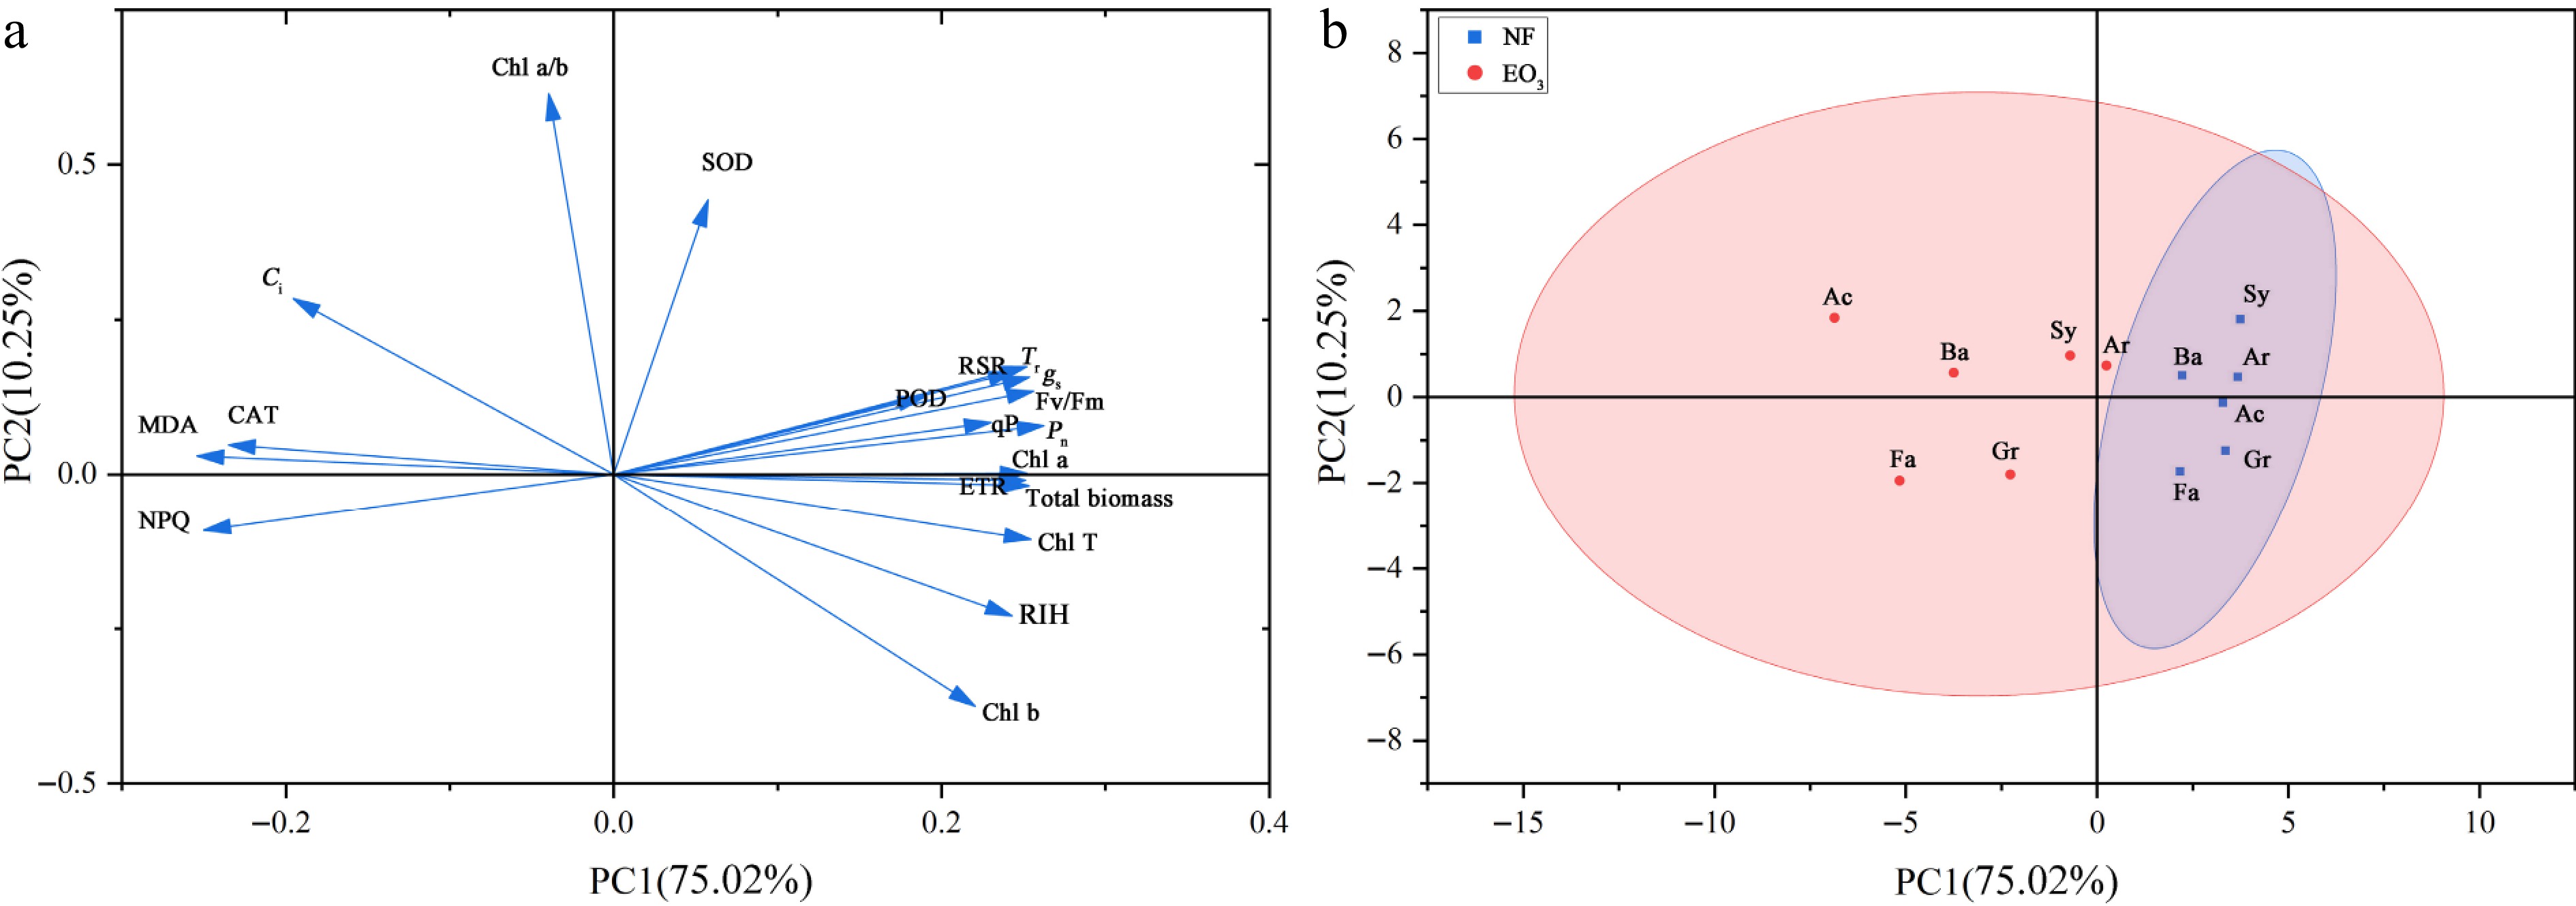
Figure 6.
Principal component analysis of the measured parameters. (a) Loading plot. (b) Score plot. Pn: net photosynthetic rate; Tr: transpiration rate; gs: stomatal conductance; Ci: intercellular CO2 concentration; NPQ: non-photochemical quenching; Fv/Fm: maximum photochemical efficiency; qP: photochemical quenching; ETR: electron transport rate; Chl b: chlorophyll b; Chl a: chlorophyll a; Chl T: total chlorophyll; Chl a/b: chlorophyll a/b; RSR: root/shoot ratio; RIH: relative increase of plant height; MDA: malondialdehyde; SOD: superoxide dismutase; POD: peroxidase; CAT: catalase. NF, non-filtered ambient air, as a control; EO3, non-filtered ambient air + 80 ppb O3. The name of cultivars are provided in Table 1.
Evaluation of ozone tolerance
-
According to Eq. (1), the membership function values of six cultivars composite indicators were calculated (Table 3). The weight values of the three principal components were 0.82, 0.11, and 0.07, respectively, based on their contribution rates. After calculation, the D value (comprehensive evaluation value of O3 tolerance) of six Kentucky bluegrass cultivars were as follows: Ar (0.97), Sy (0.81), Gr (0.59), Ba (0.36), Fa (0.15), Ac (0.11), suggesting cultivar Ar exhibited the highest tolerance, whereas Ac showed the weakest tolerance among the tested cultivars.
Table 3. Value of comprehensive indicator X (i), value of membership function U (i), comprehensive evaluation value D, and ranking of different cultivars of Kentucky bluegrass.
Cultivar X (1) X (2) X (3) U (1) U (2) U (3) D Rank Ar 1.11 0.95 2.47 1.00 0.78 1.00 0.97 1 Sy 0.68 1.99 0.37 0.80 1.00 0.54 0.81 2 Gr 0.32 −2.39 1.75 0.64 0.05 0.84 0.59 3 Ba −0.33 0.76 −2.08 0.34 0.73 0.00 0.36 4 Fa −0.71 −2.64 −1.07 0.17 0.00 0.22 0.15 5 Ac −1.07 1.33 −1.44 0.00 0.86 0.14 0.11 6 -
In the evaluation system of plant O3 tolerance, the selection of appropriate physiological and biochemical indicators is crucial, as these indicators can systematically reflect the response mechanisms and adaptive strategies of plants to O3 stress[43−45]. In this study, a series of indicators were selected from multiple dimensions, including growth characteristics (RIH, total biomass, and RSR), photosynthetic physiological parameters (Pn, gs, Tr, Ci, and Chl), Chl fluorescence parameters (Fv/Fm, ETR, qP, and NPQ), and oxidative stress markers (MDA and antioxidant enzymes), ensuring the scientific rigor and comprehensiveness of the results. Given the limitations of single-indicator evaluation, this study employed PCA to screen representative indicators—total biomass, Chl a, Chl T, Pn, Tr, gs, Fv/Fm, and MDA—from an initial set of 19 to evaluate O3 tolerance in Kentucky bluegrass. Comprehensive analysis using the membership function method revealed that cultivar Ar exhibits high O3 tolerance, while cultivar Ac shows low tolerance, providing valuable resources for future research on resistance mechanisms and molecular breeding.
In the present study, six Kentucky bluegrass cultivars showed various degrees of chlorosis and yellowing under O3 stress. Among them, cultivars Ar and Sy were less affected by O3, while the degree of leaf wilting of cultivars Fa and Ac increased significantly. Moreover, the Chl content of all cultivars was significantly reduced. The percentage of leaf visible injury induced by O3 stress showed a significant correlation with reduced Chl content. These coordinated responses probably reflect that the leaf phenotypic change was at least partly caused by ROS-induced chloroplast structural damage or the degradation of Chl[44].
Gas exchange parameters are a crucial foundation for analyzing the impact of O3 stress on plant photosynthetic performance. Many previous studies have confirmed that O3 stress can inhibit plant photosynthetic capacity through stomatal or non-stomatal factors[45,46]. The results of this study show that Pn, gs, and Tr of all cultivars decreased significantly, while the change patterns of Ci showed obvious differences: some cultivars showed a decrease in Ci, consistent with typical stomatal limitation characteristics; others showed an increase in Ci, indicating that there may be non-stomatal limitation factors such as reduced Rubisco activity and chloroplast structural damage[18,47]. This difference suggests that the response of different cultivars to O3 stress may involve different physiological regulation mechanisms. Chl fluorescence parameters further reveal the response characteristics of PSII to O3 stress[48]. It has been found that O3 treatment can lead to a significant decrease in Fv/Fm in Pak choi, indicating that obvious photoinhibition occurred in its leaves, accompanied by an increase in excess light energy[42]. In this study, both Fv/Fm and ETR of Kentucky bluegrass significantly decreased, confirming that O3 stress led to photoinhibition in plant leaves and hindered photosynthetic electron transfer, thus affecting Pn. Meanwhile, the synchronous decrease in qP further indicated that the activity of PSII reaction centers decreased under O3 stress. Combined with the reduced Chl content, it shows that O3 stress directly affects the absorption and transfer efficiency of light energy by leaves, ultimately leading to a decrease in plant light energy utilization efficiency. It is known that the enhancement of NPQ is an important photoprotective strategy for plants to cope with environmental stress. The increase of NPQ can represent an intrinsic protection mechanism of the photosynthetic system and the dissipation of excess light energy by PSII[49]. It has been found that there was a significant increase in NPQ in oat (Avena sativa) under high O3 stress, suggesting that plants may alleviate photoinhibition by activating this energy dissipation pathway[50]. In the present study, the NPQ increased significantly in all cultivars, with a higher relative increase in cultivars that were more sensitive to O3. Therefore, we speculate that sensitive cultivars need to enhance thermal dissipation to alleviate photo-oxidative damage under O3 stress due to their lower light energy utilization efficiency.
Oxidative stress indicators can directly reflect the degree of O3-induced oxidative damage and the plant's antioxidant defense capacity. The content of MDA, a metabolic product of membrane lipid peroxidation, indicates greater cell membrane damage. Studies have shown that when plants are exposed to a high concentration of O3 environment, the enhancement of lipid peroxidation level reveals a significant decline in cell membrane stability[14]. In this study, in sensitive Kentucky bluegrass cultivars, O3 exposure induced increase of MDA content, confirming the destructive impact of O3 on cell membranes. Changes in SOD, POD, and CAT activities reflect the plant's ability to scavenge ROS. Studies have shown that under O3 stress, the activities of SOD, POD, and CAT in sensitive rice cultivars all show a trend of first increasing and then decreasing, while the changes in tolerant cultivars are not obvious, suggesting differential responses of different cultivars to O3 stress[22]. Superoxide dismutase (SOD) serves as a crucial enzyme in the plant antioxidant system, initiating the detoxification of ROS by dismutating O2·− to H2O2. CAT and POD then complete the process by converting H2O2 into H2O and O2[51,52]. In this study, POD and CAT activities in cultivar Ar remained relatively stable. In contrast, other cultivars exhibited a significant increase in CAT activity to counteract H2O2 accumulation. However, POD activity—functioning as a secondary scavenging system—decreased markedly in cultivars Ba and Ac. This suggests that the O3-induced ROS burst may have exceeded the antioxidant capacity of these cultivars. Although CAT activity was elevated, it proved insufficient to offset ROS accumulation. Different cultivars employ distinct antioxidant defense strategies. O3-tolerant cultivars maintain redox homeostasis more effectively, while sensitive cultivars exhibit greater disruption of their antioxidant enzyme systems under O3 stress. Although sensitive cultivars compensate by upregulating CAT activity to detoxify ROS, this response has inherent limitations. Sustained high-level O3 exposure overwhelms the antioxidant system in sensitive cultivars, triggering ROS accumulation, membrane lipid peroxidation, and ultimately cellular homeostasis collapse. Similarly, in rice cultivars, continuous O3 stress significantly weakened the antioxidant defense ability of the sensitive cultivar[22].
-
In summary, this study comprehensively analyzed the effects of ozone (O3) stress on growth, physiological, and biochemical parameters in six Kentucky bluegrass cultivars. Our results demonstrate that O3 stress severely inhibited photosynthetic function and induced pronounced membrane lipid peroxidation, evidenced by significantly elevated MDA content. Antioxidant enzyme activities (SOD, CAT, and POD) also exhibited significant stress-responsive alterations. Critically, cultivars displayed markedly divergent physiological responses to O3 exposure. Tolerant cultivars could alleviate oxidative damage effectively, therefore can maintain relatively stable physiological processes. Through integrated principal component analysis (PCA) and membership function assessment, cultivars Ar and Ac were identified as the most tolerant and sensitive to O3, respectively. This research provides a basis for elucidating O3-response mechanisms in Kentucky bluegrass, breeding stress-tolerant germplasm and guiding cultivar selection in ozone-polluted regions.
We gratefully acknowledge financial support from National Natural Science Foundation of China (Grant Nos 32171687 and 32211530421), Zhejiang Provincial Natural Science Foundation of China (Grant No. LQN25C170004), and the Personnel Startup Project of the Scientific Research and Development Foundation of Zhejiang A&F University (Grant Nos 2021FR041 and 2023LFR039).
-
The authors confirm their contributions to the paper as follows: study design: Wuyun T, Zhang L; methodology: Wuyun T; investigation: Lv X, Kan J; data curation, and writing original draft: Lv X; writing review & editing: Wuyun T, Mao Y; Yu S, Zhang L; funding acquisition: Yu S, Zhang L; supervision: Zhang L. All authors reviewed the results and approved the final version of the manuscript.
-
All data generated or analyzed during this study are included in this published article and its supplementary information files.
-
The authors declare that they have no conflict of interest.
-
# Authors contributed equally: Xue Lv, Tana Wuyun
- Supplementary Table S1 Principal component analysis of indicators.
- Supplementary Fig. S1 (a) Daily average ozone concentration, (b) temperature, (c) relative humidity, and (d) photosynthetically active radiation (PAR) for 8 h (09:00 to 17:00) in OTCs under different treatments during the experiment. NF represents the non-filtered ambient air, and EO3 represents ambient air adding 80 ppb ozone.
- Copyright: © 2025 by the author(s). Published by Maximum Academic Press, Fayetteville, GA. This article is an open access article distributed under Creative Commons Attribution License (CC BY 4.0), visit https://creativecommons.org/licenses/by/4.0/.
-
About this article
Cite this article
Lv X, Wuyun T, Kan J, Mao Y, Yu S, et al. 2025. Comprehensive assessment of ozone tolerance in six Kentucky bluegrass cultivars: insights from growth and physiological responses. Grass Research 5: e025 doi: 10.48130/grares-0025-0022 

Comprehensive assessment of ozone tolerance in six Kentucky bluegrass cultivars: insights from growth and physiological responses
- Received: 30 June 2025
- Revised: 31 July 2025
- Accepted: 06 August 2025
- Published online: 10 October 2025
Abstract: Rising near-surface ozone (O3) concentrations, driven by urbanization and industrialization, pose a threat to plant growth. As essential components of urban ecosystems, turfgrasses face significant risks due to O3 pollution. This study investigated the physiological responses of six Kentucky bluegrass (Poa pratensis L.) cultivars to O3 stress and assessed their relative tolerance. Plants were exposed to two treatments in open-top chambers: non-filtered ambient air (NF, control) and elevated O3 (EO3, NF + 80 ppb O3). Leaf phenotypic changes and physiological indicators were evaluated. Principal component analysis (PCA) and membership functions were applied for comprehensive tolerance assessment. Results showed that O3 stress significantly inhibited growth: the cultivar 'Arcadia' maintained a better growth status, while 'Action' displayed pronounced sensitivity with yellow-brown spots and chlorosis. O3 stress also inhibited the photosynthetic capacity of all cultivars with a significant decrease in chlorophyll content (a reduction range of 5.64%−19.14%), and induced oxidative damage, as demonstrated by a 1.34- to 2.08-fold increase in malondialdehyde content. Superoxide dismutase activity responses were cultivar-dependent, catalase activity generally increased, while peroxidase activity decreased. Tolerant cultivars had relatively lower levels of physiological impairment under O3 stress, and alleviated oxidative damage more effectively. The PCA and membership function analysis ranked 'Arcadia' as the most O3-tolerant cultivar, followed by 'Symphony', 'Green Wave', 'Baron', and 'Fargo', with 'Action' being the most sensitive. The findings will provide theoretical support for breeding ozone-resistant Kentucky bluegrass cultivars and guide the cultivar selection for lawn establishment in ozone-polluted areas.
-
Key words:
- Ozone pollution /
- Photosynthesis /
- Poa pratensis L. /
- Membership function analysis