


-
Chrysanthemum (Chrysanthemum × morifolium Ramat.) is a highly esteemed ornamental plant, occupying a pivotal position in global floral traditions and the horticultural industry[1]. Ranking second globally in the cut-flower trade after roses, it combines exceptional aesthetic value with medicinal and culinary applications, underpinning its significant economic importance[2,3]. Floral, foliar, and plant architectural traits are critical ornamental characteristics of chrysanthemum[4−7]. The capitulum, a key ornamental structure, comprises two distinct floret types: ray florets and disc florets. Ray florets exhibit a wide color spectrum, including red, orange, yellow, pink, green, etc., whereas disc florets are primarily yellow or green[8]. Ray florets are further classified into flat valve, tube valve, spoon valve, etc., petal morphologies. The interplay of color and structural diversity between these floret types drives the extensive cultivar variation in chrysanthemum[9]. Flower color, a major focus in ornamental plant research, is mainly determined by anthocyanins, carotenoids, and chlorophyll, with chromatic diversity arising from differential proportions of these pigments[10]. The CIELAB color space (defined by the Commission Internationale d'Eclairage, CIE, in 1976) provides a robust framework for quantifying flower color through three-dimensional coordinates: L* value (brightness), a* value (red-green axis), and b* value (yellow-blue axis), facilitating standardized analyses for breeding, cultivar identification, and color genetics[11]. During the prolonged vegetative growth phase of the plant life cycle, plant architecture, and foliage traits emerge as critical ornamental features[12]. Leaf morphological characteristics such as leaf shape, leaf margin, leaf base, and leaf veins exhibit substantial diversity, and serve as taxonomic markers for chrysanthemum identification[13]. Consequently, vegetative traits remain a focal point in chrysanthemum breeding programs[14].
Modern chrysanthemum cultivars exhibit complex genetic backgrounds due to prolonged domestication, artificial hybridization, and polyploidization[15]. The inheritance mechanisms underlying their phenotypic traits are intricate and multifaceted, necessitating in-depth research to advance both theoretical and practical applications in chrysanthemum breeding. Phenotypic traits in plants are typically quantitative traits governed by a combination of major genes and polygenes, with their complex genetic architecture analyzed through the mixed major gene plus polygene inheritance model. This approach integrates genetic models and effects to comprehensively interpret such complexity[16,17]. Over recent decades, this method has proven highly effective in studying traits of crops[18,19], and horticultural plants[20,21]. Compared to traditional quantitative genetics, the major gene with polygene inheritance analysis provides a more holistic framework, simultaneously accounting for the effects of major and minor polygenes, thereby enabling accurate elucidation of genetic mechanisms and estimation of inheritance parameters.
As a globally significant ornamental plant, introducing chrysanthemum cultivars with diverse ornamental attributes is critical for maintaining competitiveness in the floriculture industry[22]. A critical challenge in chrysanthemum breeding is the genetic bottleneck, caused by a narrow genetic background and high similarity among commercial cultivars. The solution lies in introducing wild resources to incorporate novel genes for creating new germplasm. Despite advancements in molecular marker technologies and sequencing accelerating modern breeding approaches, traditional crossbreeding remains the most direct and effective method for creating novel germplasm and cultivars[23]. Ajania pacifica, a coastal wild species in the genus Ajania, exhibits unique floral morphology characterized by exclusive disc florets and densely pubescent, silver-toned leaf margin. However, its small capitula and limited flower color restrict ornamental appeal. Previous efforts by researchers involved recurrent hybridization between cultivated chrysanthemum, and the wild species Chrysanthemum yantaiense[24], resulting in ground-cover chrysanthemum germplasm with compact growth, dense flowering, rich color variations, and enhanced stress tolerance[25]. These lines exhibit complementary traits with A. pacifica, offering potential for trait pyramiding via distant hybridization to develop superior chrysanthemum cultivars[26]. However, the cross-compatibility between these species and the genetic variation in ornamental traits of hybrid progenies remain largely unexplored.
Therefore, this study established genetic populations through hybridization between A. pacifica, its F1 progeny, and ground-cover chrysanthemum. The cross-compatibility across different hybrid combinations and the main ornamental traits in the progeny were investigated. Using correlation analysis and major gene with polygene inheritance analysis, the genetic effects and parameters of chrysanthemum phenotypic traits were preliminarily dissected. This study achieved the integration of traits from A. pacifica and elite ground-cover chrysanthemums through intergeneric hybridization, successfully developing a population exhibiting rich variation in flower type and color, along with silver-toned leaf margins. This effort not only expands the gene pool of ground-cover chrysanthemums, but also reveals the genetic mechanisms underlying phenotypic traits, providing important theoretical support for the development of new chrysanthemum varieties and the improvement of phenotypic traits.
-
Nine hybrid combinations were designed using A. pacifica and its F1 progeny 'LP18' (A. pacifica [♀] × C. morifolium 'Jinguangwanzhang' [♂]), and 'GHJ10' (A. pacifica [♀] × C. morifolium 'Xiangfei' [♂]) as female parent, with C. morifolium 'Jinglinliuyan' ('JLLY'), C. morifolium 'Jinseqionglu' ('JSQL'), and C. morifolium 'Maoxiangyu' ('MXY') as male parent (Fig. 1). All experimental materials were sourced from the Chrysanthemum Germplasm Resource Repository of Beijing Forestry University (Beijing, China). Cultivation, hybridization, and sampling were conducted at the Jinan Academy of Landscape and Forestry Sciences, Shandong, China.
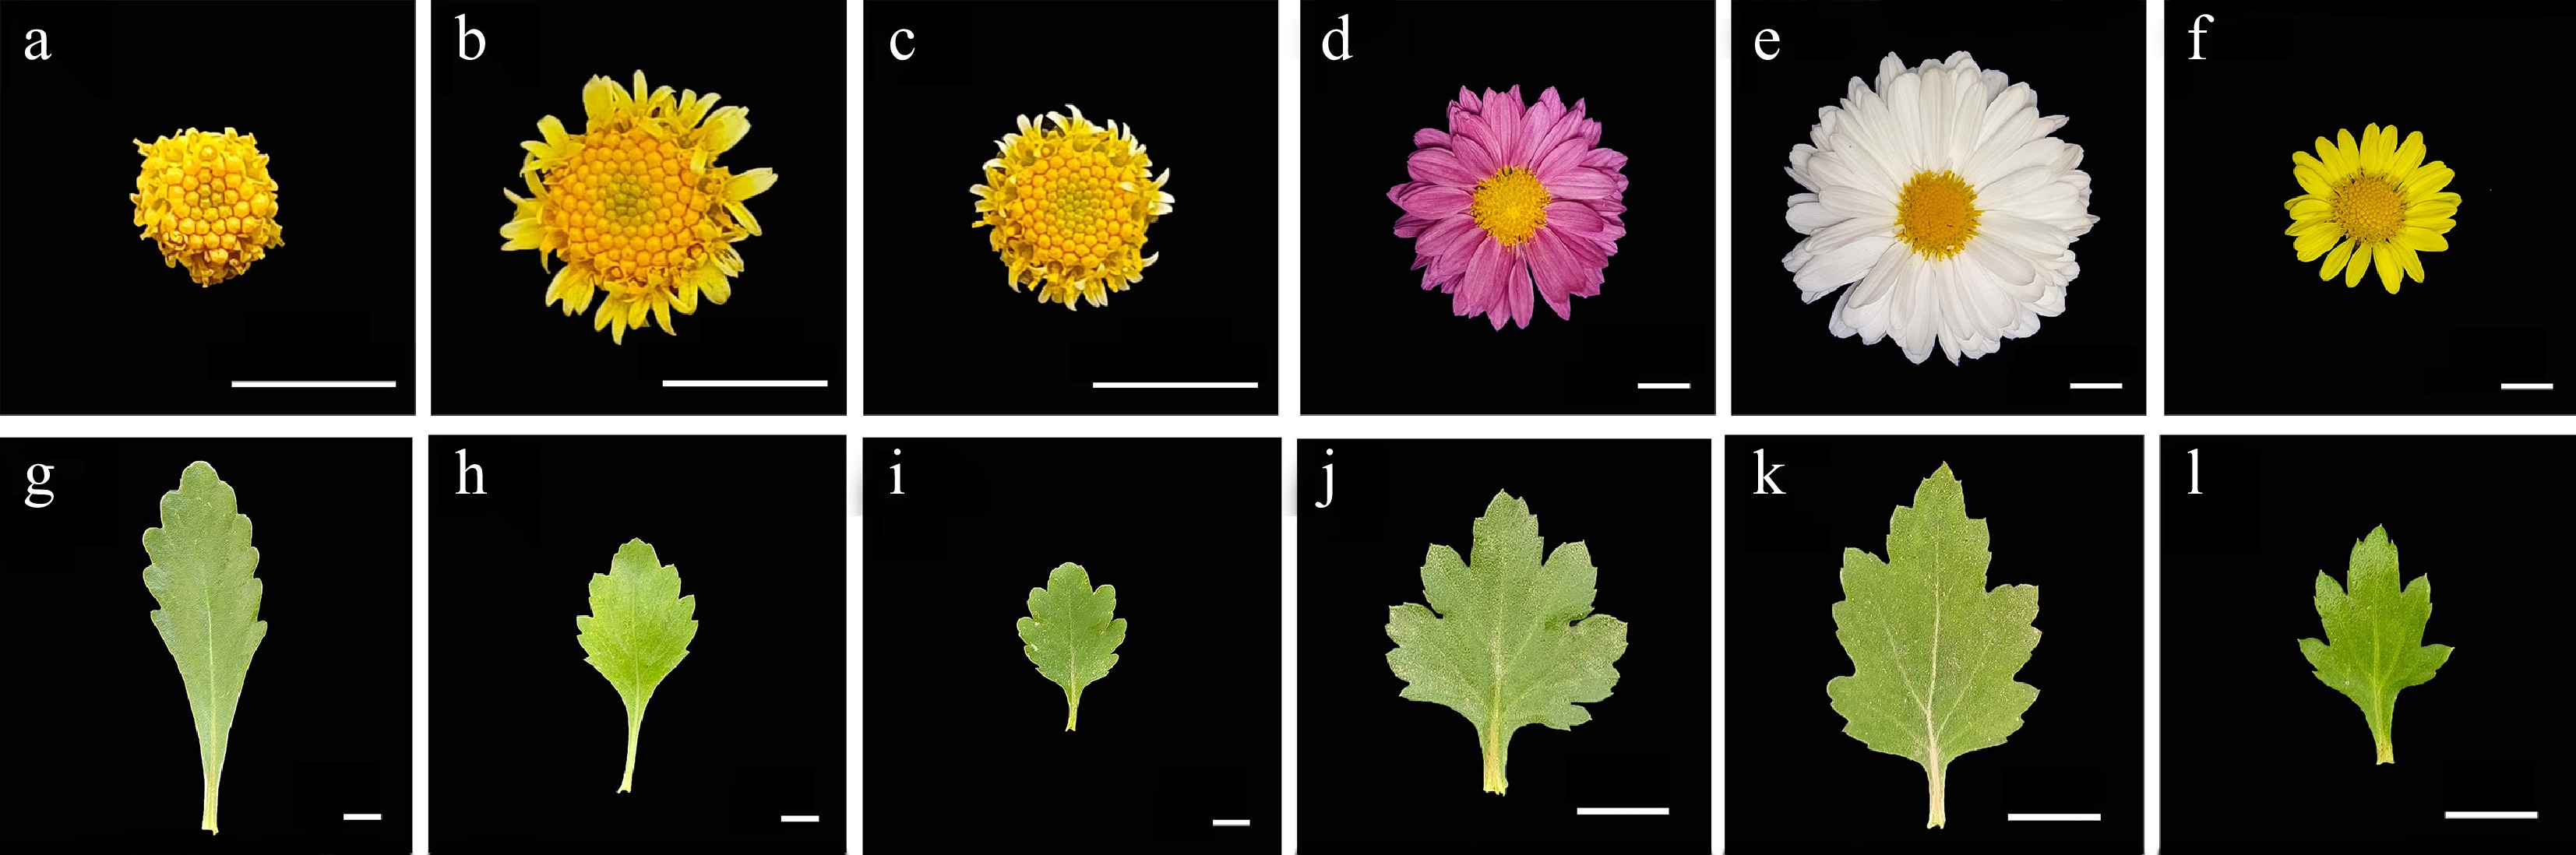
Figure 1.
Phenotype of capitula and leaves of hybrid parents. (a)–(f) and (g)–(l) represent the capitulum and leaf of A. pacifica, A. pacifica F1 'LP18', A. pacifica F1 'GHJ10', C. morifolium 'Jinglinliuyan', C. morifolium 'Jinseqionglu', and C. morifolium 'Maoxiangyu', respectively. Bar = 1 cm.
Construction of hybrid populations
-
Hybrid populations were constructed using artificial cross-pollination. Preliminary experiments indicated that A. pacifica, 'LP18' and 'GHJ10' had self-incompatibility (Supplementary Table S1). Therefore, in this experiment, the non-emasculation pollination method was adopted for hybridization. Parental plants were bagged with pollination bags before flowering, to prevent pollen contamination and insect-mediated pollination. Upon partial expansion of maternal ray florets, and prior to anther dehiscence of disc florets, ray florets were excised without damaging the stigmas. Pollination was conducted when stigmas exhibited a Y-shaped morphology, repeated every 2–3 d for three cycles. Pollinated flowers were immediately rebagged and labeled with hybrid combination identifiers and pollination dates.
Seeds matured approximately 40–60 d post-pollination, as indicated by withered pedicels. Harvested seeds were cleaned of impurities and shriveled specimens, then stored in dry, light-protected conditions. The seeds were sown in a substrate composed of peat and vermiculite. Trays were saturated with water, covered with plastic film to maintain humidity, and incubated at 25 °C in a climate-controlled chamber. Germination status was recorded after two weeks. Seed set (%), and germination rate (%) were calculated as follows:
$ \rm Seed\; set\;({\text{%}})=\dfrac{Number\;of\;developed\;seeds}{Total\;number\;of\;florets}\times 100{\text{%}} $ $ \rm Germination\;rate\;({\text{%}})=\dfrac{Number\;of\;germinated\;seeds}{Number\;of\;viable\;seeds}\times 100{\text{%}} $ Phenotypic trait measurement
-
Key phenotypic traits of 2 main hybrid populations (Cross I: 'LP18' × 'JLLY', including 300 lines; Cross II: 'LP18' × 'MXY', including 154 lines) under field conditions, including plant height (PH), plant crown (PC), leaf length (LL), leaf width (LW), leaf petiole length (LPL), and silver-toned leaf margin (SLM) were recorded. Moreover, based on the flowering-period screening criterion, late-flowering lines (those flowering post-November 1) were eliminated. For Cross I and Cross II, 217 and 91 flowering lines were retained, respectively. Plant height and plant crown were determined by measurements from individual plant systems. Floral traits were assessed with four replicates per plant. Leaf traits were measured with three replicates per plant. Image J (Version 1.5.4) software was employed to measure flower diameter (FD), disc flower diameter (DFD), ray floret length (RFL), ray floret width (RFW), disc floret length (DFL), leaf length (LL), leaf width (LW), leaf petiole length (LPL), and the number of ray florets (NRF) was counted, with mean values calculated. And all these traits were measured according to previously described methods[4,6,12,13].
Flower color was quantified using a portable spectrophotometer (NF555, Japanese portable electrochromic spectrophotometer). The color of the ray florets was measured under the condition of Illuminant C/2°. Multiple ray florets from the outer whorl of a capitulum were placed side-by-side (due to their individual width being smaller than the instrument's aperture) with their adaxial surface facing up on clean white paper. The measurement was taken by positioning the instrument's aperture at the central region of these outer ray florets, representing the color of the capitulum. Color parameters were expressed using the CIELAB color space: L* value (brightness), a* value (red-green hue), and b* value (yellow-blue hue). Hybrid populations were categorized into yellow, white, pink, orange, and red color groups[27].
The silver-white leaf margin pubescence was scored using a grading system, which categorized the characteristic into three primary grades: 5 points: a clearly visible silver-white margin on the adaxial leaf surface with dense pubescence on the abaxial side; 3 points: a faint silver-white margin on the adaxial surface with some pubescence on the abaxial side; 1 point: no silver-white margin on the adaxial surface and no pubescence on the abaxial side; with 2/4 points representing intermediate values between these adjacent grades. The average value was calculated from three replicates.
Phenotypic trait analysis
-
Phenotypic trait analysis was performed using Microsoft Excel 2010 and SPSS 21.0 software to evaluate plant height (PH), plant crown (PC), flower diameter (FD), disc flower diameter (DFD), disc flower diameter/flower diameter (DFD/FD), ray floret length (RFL), ray floret width (RFW), number of ray florets (NRF), disc floret length (DFL), leaf length (LL), leaf width (LW), leaf petiole length (LPL), silver-toned leaf margin (SLM), and flower color parameters. Statistical descriptors included range, mean, standard deviation (SD), coefficient of variation (CV/%), skewness, and kurtosis. The coefficient of variation (variation of coefficients, CV/%) was calculated as the ratio of standard deviation (SD) to the mean value of each trait in hybrid progeny (Fm): CV (%) = (SD/Fm) × 100. Skewness and kurtosis were derived using the SKEW and KURT functions, respectively. Semi-violin diagrams and correlation coefficient matrices were generated with Origin 21.0 to visualize the frequency distribution of traits and inter-trait correlations within the hybrid populations.
Heterosis analysis
-
Heterosis analysis was conducted on phenotypic data, where heterosis (Hm) was calculated as the difference between the mean value of hybrid progeny traits (Fm) and the mid-parent heterosis (Hm) (Hm = Fm − MPV). The ratio of mid-parent heterosis (RHm/%) was expressed as the percentage of mid-parent heterosis relative to the mid-parent value (MPV) (RHm = Hm/MPV × 100%). Significance testing for mid-parent heterosis in the population was performed using a one-sample t-test comparing the mean value of individual plant target traits with the mid-parent value.
Mixed inheritance analysis
-
Major gene with polygene inheritance analysis was performed on phenotypic data from the Pseudo-F2 Population following the method of Gai[28]. Due to minimal variation in the silver-toned leaf margin (SLM), only the remaining 15 traits were analyzed[29]. Maximum likelihood values (MLV) and Akaike information criterion (AIC) were calculated for 16 genetic models. The candidate model was selected based on the minimum AIC criterion, followed by goodness-of-fit tests, including uniformity tests (U12,U22,U32), Smirnov test (nW2), and Kolmogorov test (Dn). Genetic parameters such as variance of the optimal model, additive effect, dominance effect, and heritability of major gene were estimated using least squares regression. Computations were executed using the R-language SEA 2.0 package[30]. As the population size of Cross I was twice that of Cross II, the optimal genetic model for each trait was determined primarily based on results from Cross I[29]. The formula was defined as:
$ \mathit{h} ^{ \mathrm{2}}_{ \mathrm{mg}} = \mathit{\sigma } ^{ \mathrm{2}}_{ \mathrm{mg}} \mathrm{/} \mathit{\sigma } ^{ \mathrm{2}}_{ \mathrm{p}} $ where, σ2mg denotes the variance of major gene, h2mg represents the heritability of major gene, and σ2p indicates phenotypic variance.
-
The compatibility of hybrid combinations was evaluated through seed setting rate and germination rate. Results demonstrated that direct hybridization between A. pacifica and ground-cover chrysanthemum ('JLLY' and MXY') yielded low seed setting rates and germination rate (Table 1), indicating the presence of hybrid barriers between A. pacifica and ground-cover chrysanthemum. In contrast, the hybrid progeny of 'LP18' crossed with cultivated chrysanthemum exhibited superior seed setting rates and germination rate compared to direct crosses involving A. pacifica and ground-cover chrysanthemum, reflecting the cross compatibility has been enhanced to a certain extent. However, the maternal parent 'GHJ10' showed a lower seed setting rate, suggesting partial hybrid incompatibility, though seed germination vigor remained favorable. Due to the influence of distant hybridization barriers, some hybrid combinations exhibited significantly low survival rates in their progeny lines. Based on a comprehensive evaluation of survival rate and ornamental traits in the hybrid offspring, the 'LP18' × 'JLLY' (Hybrid Combination I), and 'LP18' × 'MXY' (Hybrid Combination II) populations were ultimately selected as subjects for subsequent research (Fig. 2, Supplementary Fig. S1).
Table 1. Seed setting and germination rate of different hybrid combinations.
Female Male Hybrid capitula No. Seed
No.Seed
set (%)Germination
rate (%)Survival No. Ajania pacifica 'JSQL' 303 400 2.36 6 0 'MXY' 231 633 4.89 20 10 'JLLY' 259 922 6.36 29 55 'LP18' 'JSQL' 116 1,696 16.8 30 51 'MXY' 124 3,057 28.34 38 154 'JLLY' 170 3,823 25.55 33 300 'GHJ10' 'JSQL' 95 315 2.96 56 30 'MXY' 91 286 2.81 44 36 'JLLY' 112 327 2.61 52 18 Total − 1,501 11,459 − − 654 'LP18', A. pacifica F1 'LP18'. 'GHJ10', A. pacifica F1 'GHJ10'. 'JLLY', C. morifolium 'Jinglinliuyan'. 'JSQL', C. morifolium 'Jinseqionglu'. 'MXY', C. morifolium 'Maoxiangyu'. 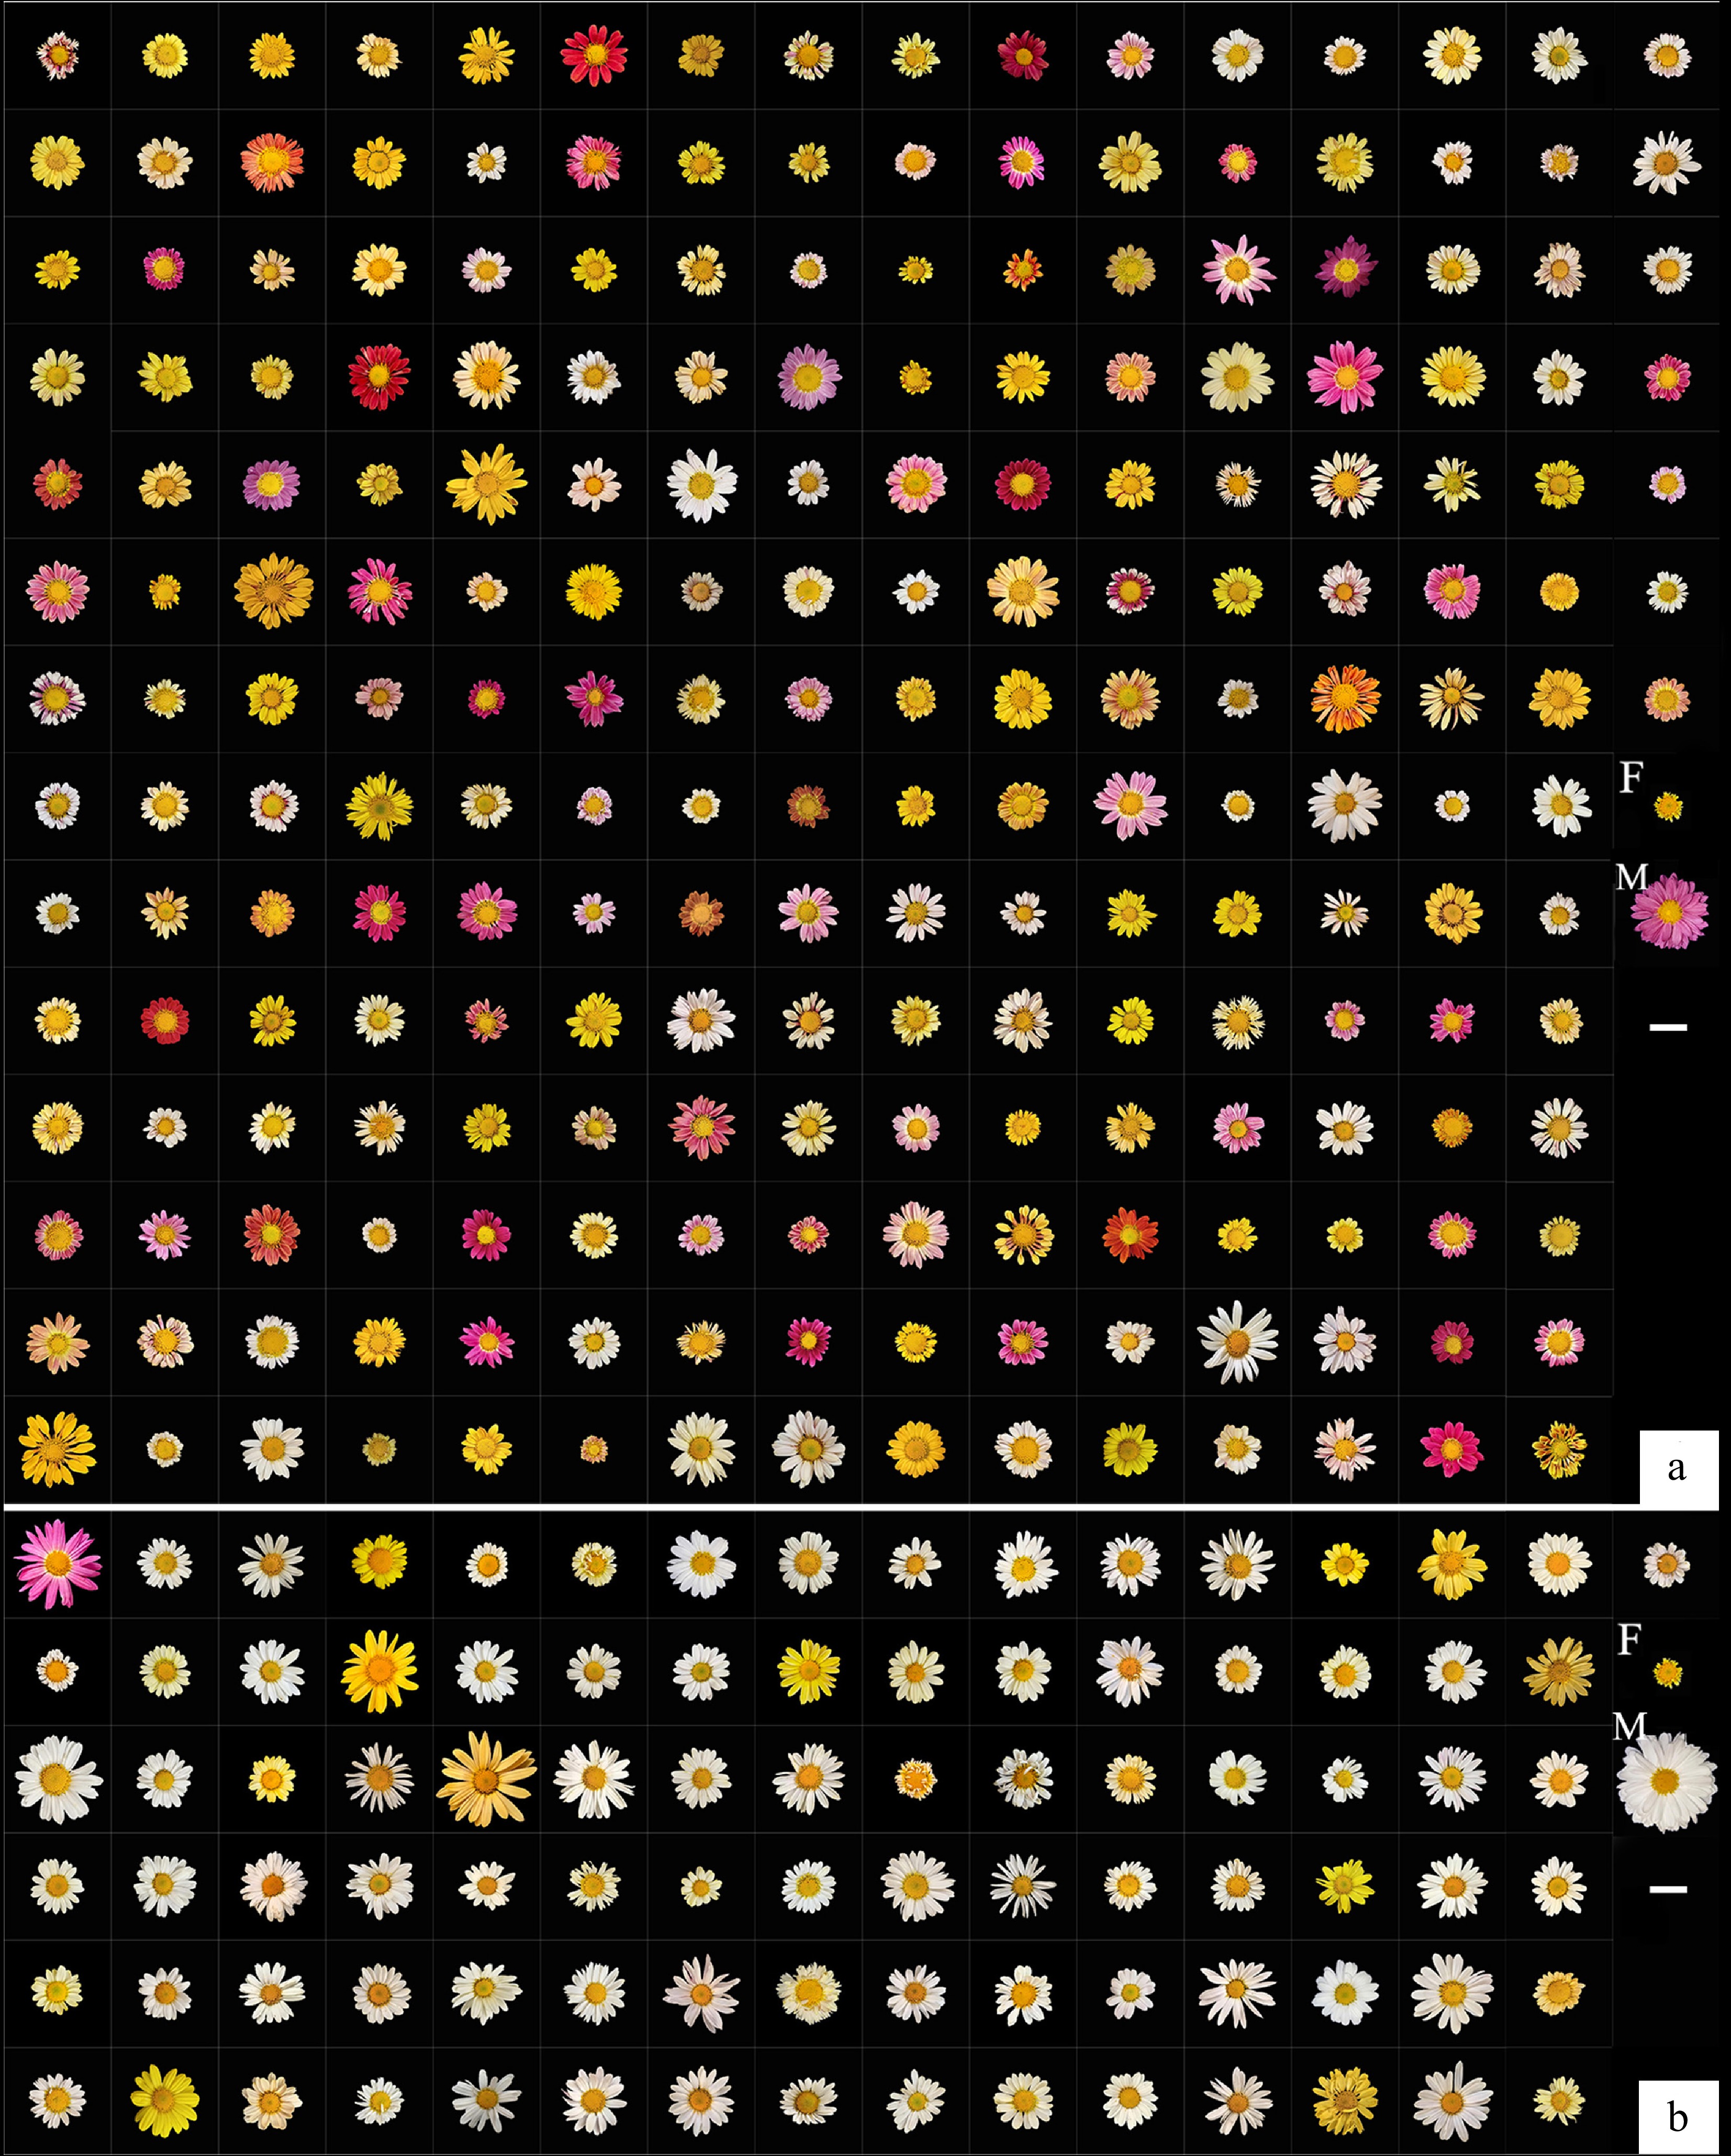
Figure 2.
Capitula phenotype of two Cross populations. (a) The capitula phenotype of Cross I. The letters F and M represent hybrid female parent A. pacifica F1'LP18' and male parent 'Jinglinliuyan' ('JLLY') respectively. (b) The capitula phenotype of Cross II. The letters F and M represent hybrid female parent A. pacifica F1'LP18' and male parent 'Maoxiangyu' ('MXY'). Bar = 2 cm.
Phenotypic traits analysis of hybrid populations
-
The hybrid populations developed in this study exhibited varying degrees of segregation in plant height, plant crown, and floral and foliar traits (Table 2, Supplementary Table S2), with the silver-white leaf margin trait from A. pacifica being successfully transmitted to the progeny lines, thereby providing a valuable genetic resource for subsequent research. Due to insufficient progeny numbers from other hybrid groups for genetic trait analysis, this study focused on phenotypic characterization and statistical analysis of 300 progeny from 'LP18' × 'JLLY' (Cross I) and 154 progeny from 'LP18' × 'MXY' (Cross II) (the traits of the flowers included 217 and 91 respectively). Results revealed extensive variation in phenotypic traits across both hybrid progenies. Coefficients of variation for PH, PC, RFL, a*, and b* values exceeded 20%, with the highest variability observed in a* and b* values (90.36%–271.87%) (Table 2). Additionally, the degree of variation differed between the two combinations: plant architecture and floral traits exhibited greater variability in Cross I compared to Cross II, LL, LW, LPL, and the a* value showed lower variability in Cross I. Continuous distributions with multimodal patterns were observed across all traits based on skewness, kurtosis, and semi-violin diagrams, aligning with quantitative trait characteristics and suggesting concurrent regulation by major genes and polygenes (Fig. 3).
Table 2. Descriptive statistics of phenotypic traits in two cross populations.
Trait Cross Extremum Average SD CV/% Skewness Kurtosis PH/cm I 11.00–75.00 33.88 11.39 33.62 0.67 0.35 II 13.00–66.00 32.84 9.82 29.90 0.55 0.56 PC/cm I 21.50–154.00 73.33 18.42 25.12 0.41 1.17 II 32.00–111.00 61.37 12.37 20.15 0.42 1.26 FD/cm I 1.78–5.13 3.16 0.63 20.07 0.36 −0.14 II 2.44–5.83 3.70 0.67 18.13 0.55 0.28 DFD/cm I 0.79–1.60 1.19 0.14 12.15 0.17 −0.12 II 0.92–1.52 1.21 0.12 9.80 −0.01 −0.11 DFD/FD I 0.26–0.60 0.39 0.07 17.53 0.69 0.03 II 0.22–0.50 0.34 0.05 15.94 0.77 0.68 RFL/cm I 0.73–2.32 1.39 0.32 23.13 0.34 −0.16 II 1.00–2.86 1.67 0.38 22.42 0.61 0.22 RFW/cm I 0.22–1.04 0.44 0.09 20.17 1.42 8.18 II 0.32–0.68 0.49 0.08 16.12 0.32 −0.42 NRF/No. I 11.25~34.25 20.78 3.79 18.23 0.62 1.99 II 15.25–35.25 22.25 2.89 13.01 1.67 5.06 DFL/cm I 0.30–0.54 0.40 0.04 11.23 0.61 0.69 II 0.31–0.56 0.39 0.04 10.09 1.03 2.88 LL/cm I 3.83–10.35 6.81 1.14 16.78 −0.05 0.08 II 3.91–10.04 6.77 1.31 19.37 0.08 −0.37 LW/cm I 1.99–5.61 3.88 0.70 17.96 −0.06 0.02 II 2.27–5.76 3.71 0.75 20.23 0.44 −0.42 LPL/cm I 0.93–4.11 2.29 0.46 19.99 0.35 1.04 II 1.10–4.18 2.04 0.51 24.75 0.8 1.77 SLM I 1–5 2.23 0.88 2.86 0.90 0.43 II 1–5 2.10 0.80 2.76 1.20 1.76 L* I 29.18–95.50 70.70 13.63 19.28 −0.97 0.56 II 47.98–95.18 87.63 6.38 7.28 −3.06 16.22 a* I −11.97–53.36 7.79 11.31 145.23 1.48 2.13 II −5.74–31.13 −1.52 4.12 271.87 5.69 44.09 b* I −8.44–91.31 27.32 26.51 97.05 0.81 −0.48 II −9.80–89.52 22.02 19.90 90.36 1.76 2.65 Note: The significance test of mid-parent heterosis in population was the result of t-test of single sample mean of target traits and mid-parent value per plant. 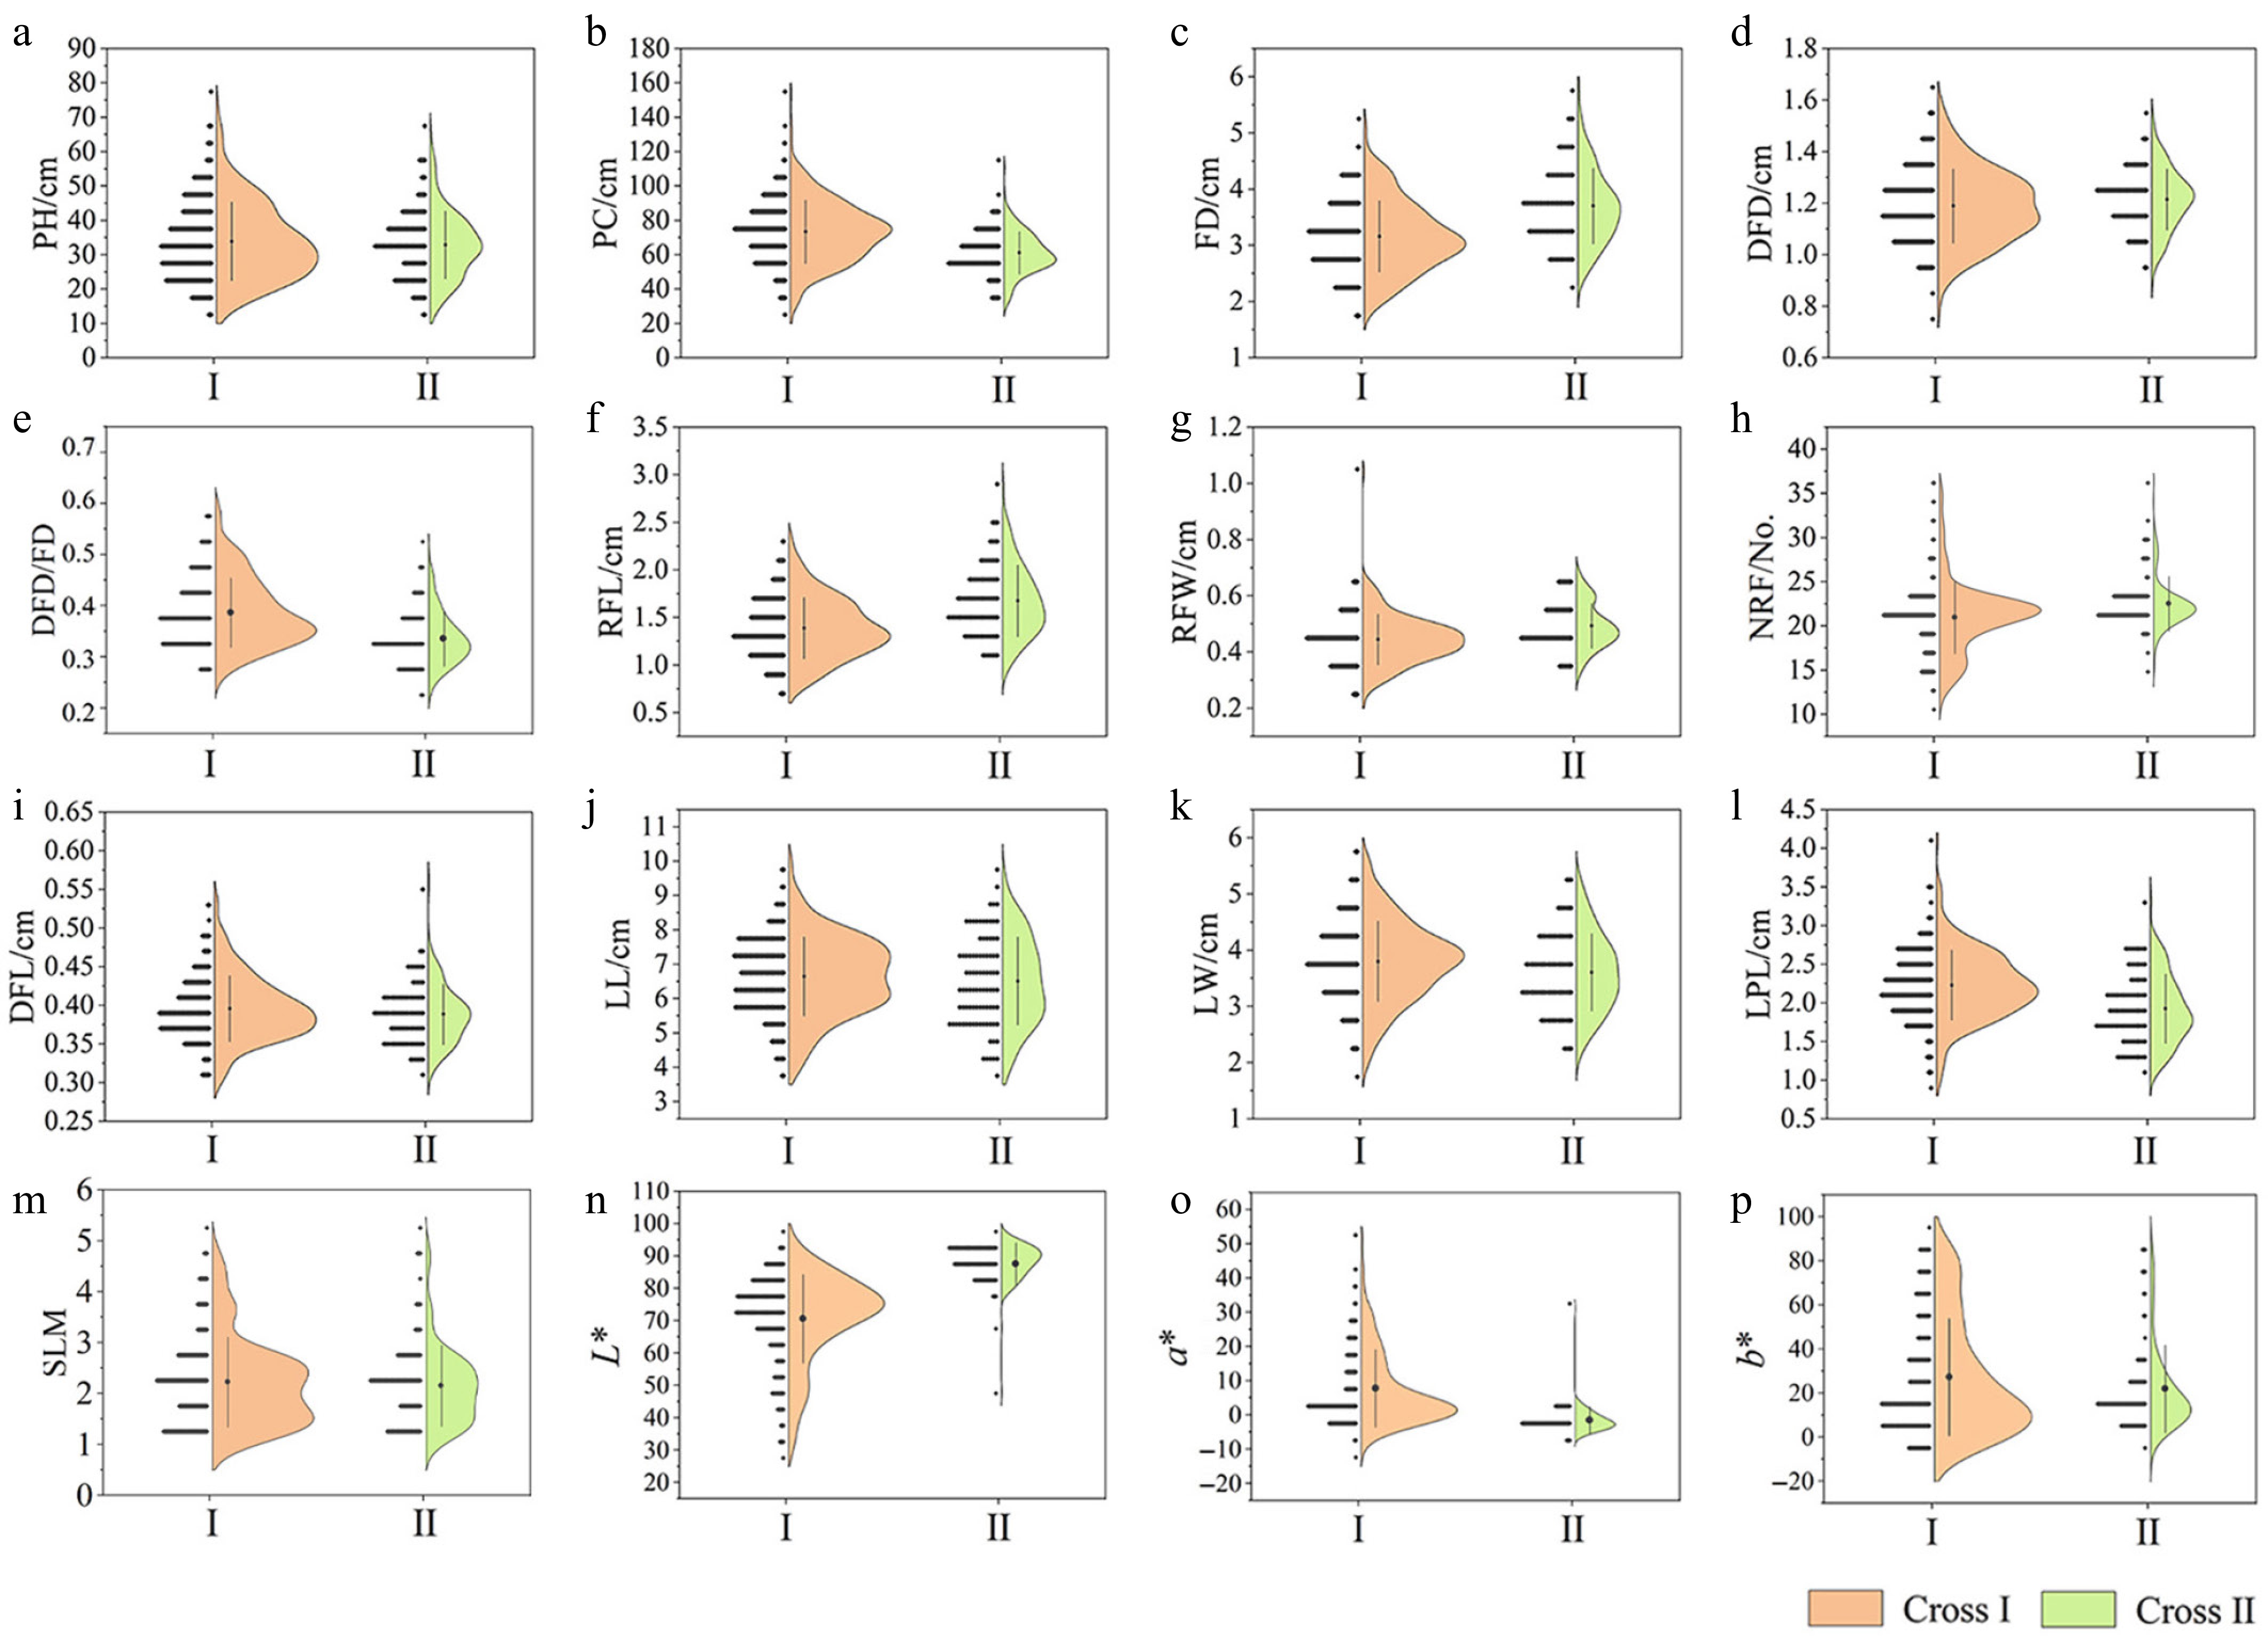
Figure 3.
Semi-violin diagrams of different phenotypic traits in two cross populations. (a) Plant height (PH). (b) Plant crown (PC). (c) Flower diameter (FD). (d) Disc flower diameter (DFD). (e) Disc flower diameter/flower diameter (DFD/FD). (f) Ray floret length (RFL). (g) Ray floret width (RFW). (h) Number of ray florets (NRF). (i) Disc floret length (DFL). (j) Leaf length (LL). (k) Leaf width (LW). (l) Leaf petiole length (LPL). (m) Silver-toned leaf margin (SLM). (n) L* value. (o) a* value. (p) b* value.
Correlation analysis of different phenotypic traits in two cross populations
-
Pearson correlation analysis of phenotypic traits in both hybrid combinations revealed significant correlations among most traits. Cross I exhibited a higher number of significant correlations between traits compared to Cross II. However, strong correlations between PH and PC were observed in both combinations (0.53, 0.60). Floral traits also demonstrated intercorrelations, with the highest correlation coefficients between FD and RFL (0.94, 0.94). In contrast, DFD/FD exhibited a highly significant negative correlation with FD, RFL, and RFW, and showed varying degrees of negative correlation with the leaf traits as well. Additionally, leaf traits showed highly significant positive pairwise correlations (Fig. 4). Among color parameters, a highly significant negative correlation was identified between L* and a* values (−0.83, −0.76), while significant or highly significant negative correlations existed between a* and b* values. This suggests that brighter colors tended to exhibit stronger green components, whereas darker hues likely shifted toward red, with increased red/blue components typically accompanied by reduced yellow components. Furthermore, integrating data from both hybrid combinations (hybrid combinations) revealed significant correlations between vegetative and reproductive traits. Floral traits—including FD, DFD, and RFL—showed stronger correlations with leaf traits than with plant architecture traits. These findings imply that targeted selection for floral traits could enable comprehensive improvement of leaf morphology and plant architecture, thereby enhancing overall ornamental quality.
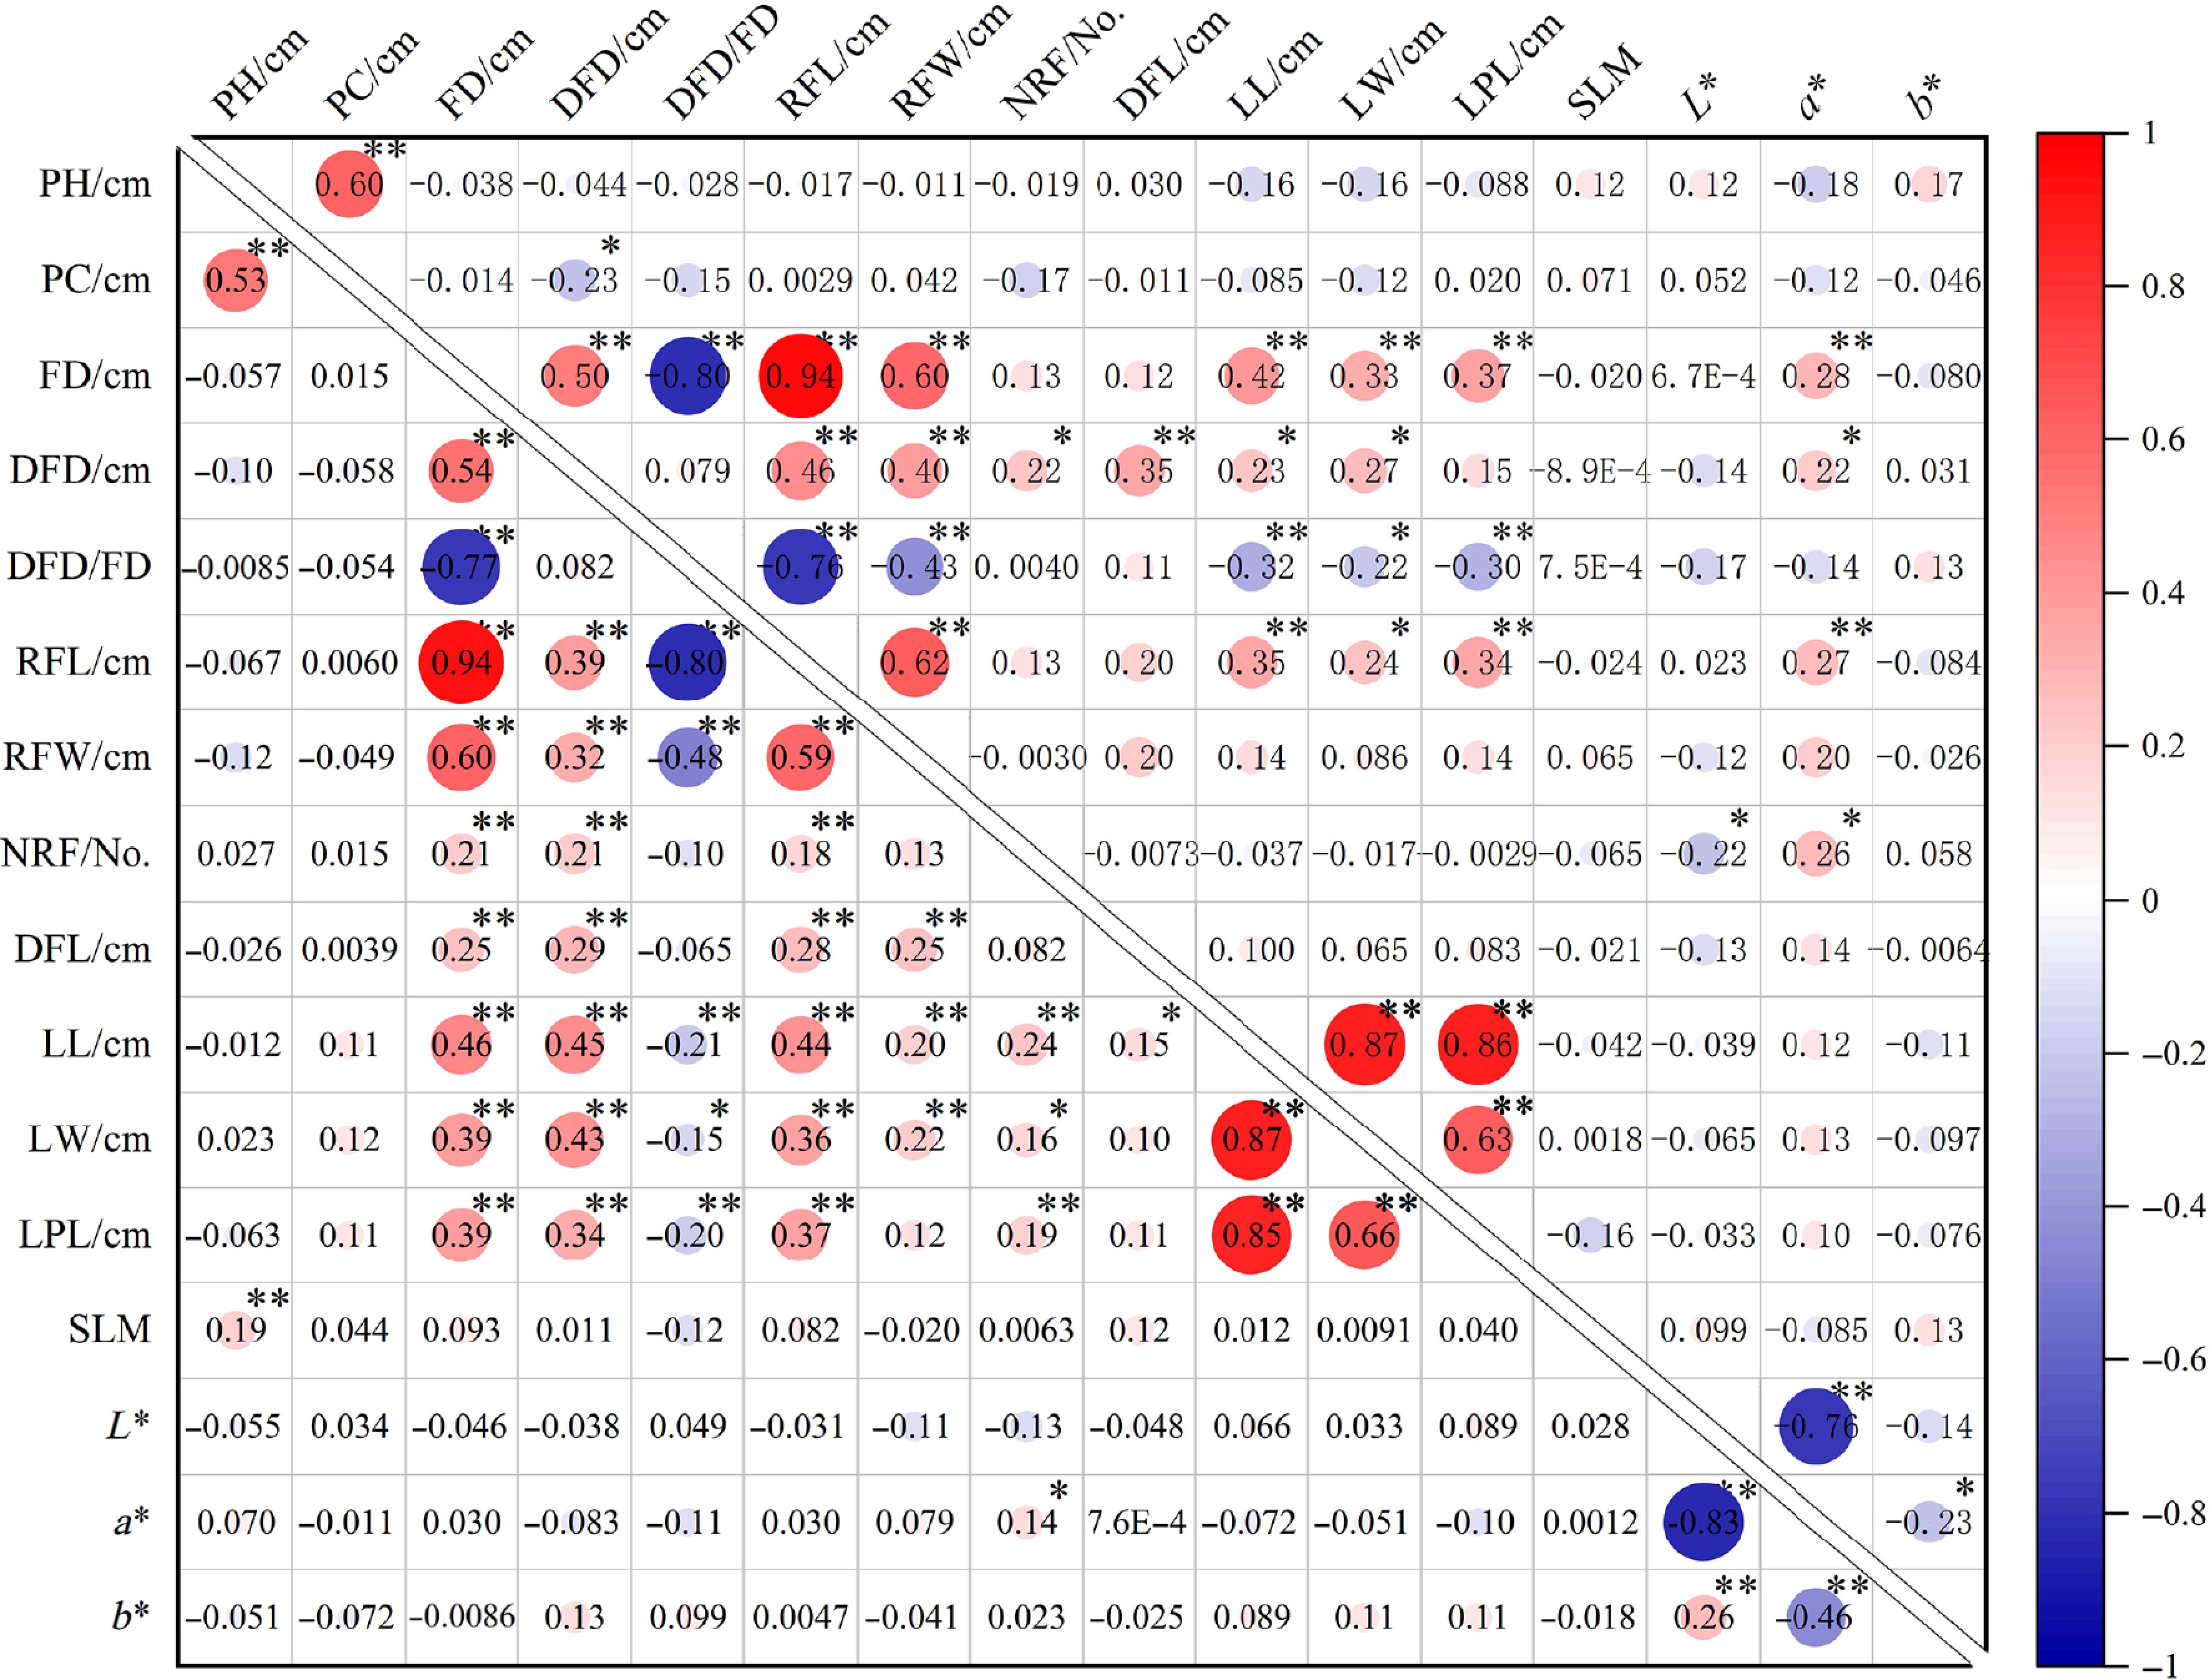
Figure 4.
Pearson correlation of phenotypic traits in two cross populations. The lower-left and upper-right triangle represent the correlations of different phenotypic traits of Cross I and Cross II respectively. PH, Plant height; PC, Plant crown; FD, Flower diameter; DFD, Disc flower diameter; DFD/FD, Disc flower diameter/Flower diameter; RFL, Ray floret length; RFW, Ray floret width; NRF, Number of ray florets; DFL, Disc floret length; LL, Leaf length; LW, Leaf width; LPL, Leaf petiole length, Silver-toned leaf margin (SLM). * and ** indicate significant difference at p ≤ 0.05 and p ≤ 0.01 level, respectively.
Genetic analysis of phenotypic traits
-
To investigate heterosis in the genetic populations, an analysis of quantitative traits was conducted for Cross I and II, combined with genetic diversity analysis. Results indicated that mid-parent dominance (MPV) reached significant or highly significant levels for all traits except RFL, SLM, a*, and b* values, with both transgressive dominance and hybrid depression coexisting (Table 3). Positive mid-parent dominance values were observed for RFL, RFW, LL, LW, LPL, and L* value, with leaf traits exhibiting higher mid-parent dominance values than floral traits. Furthermore, analysis of transgressive segregation revealed that LL and LW exhibited strong heterosis, with 59.74% to 81.33% of individuals showing transgressive performance. Conversely, negative mid-parent dominance values were detected for PH, PC, DFD/FD, NRF, DFL, SLM, and a* value. At the same time, the proportion of individuals with low PH, PC and DFL is quite large (31.00%–94.16%), indicating hybrid depression in progeny. Notably, FD, DFD, and b* value displayed divergent mid-parent dominance (positive or negative) between the two hybrid combinations, likely influenced by parental effects. Furthermore, Cross I produced progeny with a higher proportion of transgressive individuals, demonstrating more pronounced heterosis. The presence of transgressive individuals for most traits across the population indicates that transgressive segregation is a widespread phenomenon in the hybrid progeny.
Table 3. Heterosis expression of phenotypic traits.
Traits Cross MPV Average Hm RHm (%) Comparison between hybrids and parents Less than low parent (%) Between parent (%) Greater than high parent (%) PH (cm) I 44.00 33.88 −10.12** −22.99 31.00 66.33 2.67 II 45.50 32.84 −12.66** −27.83 40.91 58.44 0.65 PC (cm) I 96.25 73.33 −22.92** −23.81 90.67 0.33 9.00 II 88.50 61.37 −27.13** −30.66 94.16 5.19 0.65 FD (cm) I 3.07 3.16 0.09* 2.90 0.46 98.62 0.92 II 3.94 3.70 −0.24** −6.12 0 100 0 DFD (cm) I 1.16 1.19 0.03** 2.50 21.66 41.94 36.41 II 1.24 1.21 −0.03* −2.05 14.29 81.32 4.40 RFL (cm) I 1.36 1.39 0.03 2.02 0.46 94.93 4.61 II 1.60 1.67 0.07 4.66 0 96.70 3.30 DFD/FD I 0.49 0.39 −0.10** −20.35 0.92 99.08 0 II 0.46 0.34 −0.13** −27.14 0 100 0 RFW (cm) I 0.38 0.44 0.06** 17.05 0.46 86.18 13.36 II 0.46 0.49 0.03** 7.14 0 100 0 NRF (No.) I 34.00 20.78 −13.22** −38.88 0.46 99.54 0 II 50.88 22.25 −28.63** −56.26 0 100 0 DFL (cm) I 0.44 0.40 −0.04** −9.09 67.00 25.63 7.37 II 0.44 0.39 −0.05** −11.70 83.52 13.19 3.30 LL (cm) I 5.49 6.81 1.33** 24.20 3.00 35.67 61.33 II 5.59 6.77 1.18** 21.21 5.19 35.06 59.74 LW (cm) I 3.19 3.88 0.69** 21.67 12.67 6.00 81.33 II 3.12 3.71 0.60** 19.15 16.88 14.29 68.83 LPL (cm) I 1.76 2.29 0.54** 30.57 0.67 58.00 41.33 II 1.62 2.04 0.43** 26.48 0 74.68 25.32 SLM I 2.39 2.23 −0.16** −0.07 0 93.67 6.33 II 2.16 2.10 −0.06 −0.06 0 96.10 3.90 L* I 61.53 70.70 14.90** 14.90 6.91 62.21 30.88 II 85.59 87.63 2.38* 2.38 2.20 84.62 13.19 a* I 13.85 7.79 −43.75 −43.75 9.68 84.33 5.99 II −2.41 −1.52 −36.93 −36.93 30.77 32.97 36.26 b* I 22.00 27.32 24.18 24.18 1.38 98.16 0.46 II 29.20 22.02 −24.59** −24.59 10.99 78.02 10.99 * and ** indicate significant difference at p ≤ 0.05 and p ≤ 0.01 level, respectively. Optimal genetic models and heritability estimation for phenotypic traits
-
The major gene plus polygene mixed inheritance model was applied to analyze mean phenotypic data of progeny traits in the two hybrid combinations. By comparing computational outcomes across models, optimal genetic models for different phenotypic traits were determined (Supplementary Tables S3, S4). Results demonstrated that PH, FD, RFL, NRF, LL, LW, L*, a*, and b* values conformed to the 2MG-AD model, controlled by two pairs of additive-dominant major genes. PC, DFD/FD, DFL, and LPL aligned with the 2MG-EA model, governed by two pairs of equally additive major genes. DFD followed the 0MG model with no major gene involvement, while RFW fit the 2MG-A model, regulated by two pairs of additive major genes (Table 4).
Table 4. Estimation of genetic parameters for different traits under optimal model.
Traits Model Cross m da db ha hb da/ha db/hb σ2 mg h2mg/% PH (cm) 2MG-AD I 37.6459 11.9162 2.5405 −1.0435 −6.6822 −11.42 −0.38 0 0 II 33.6567 9.4599 7.1814 −0.9279 −1.3410 −10.19 −5.36 22.83 23.68 PC (cm) 2MG-EA I 73.1994 11.0174 − − − − − 0 0 II 61.1299 8.0447 − − − − − 0 0 FD (cm) 2MG-AD I 3.1875 0.6412 0.4411 0.0453 −0.0826 14.15 −5.34 0.39 95.88 II 3.6572 0.6926 0.3476 0.0139 0.0836 49.83 4.16 0 0 DFD (cm) 0MG I − − − − − − − − − II − − − − − − − − − DFD/FD 2MG-EA I 0.3880 0.0437 − − − − − 0 27.02 II 0.3357 0.028 − − − − − 0 0 RFL (cm) 2MG-AD I 1.4172 0.3632 0.2216 −0.0414 −0.0315 −8.77 −7.03 0.07 68.44 II 1.6745 0.4181 0.1838 −0.0532 0.0500 −7.86 3.68 0.01 8.23 RFW (cm) 2MG-A I 0.4424 0.0280 0.0650 − − − − 0 0 II 0.5025 0.0178 0.0721 − − − − 0.01 99.69 DFL (cm) 2MG-EA I 0.3960 0.0172 − − − − − 0 0 II 0.3880 0.0185 − − − − − 0 0 NRF (No.) 2MG-AD I 11.4472 9.7741 0.3067 8.0251 0.8146 1.22 0.38 81.061 99.9724 II 22.9855 1.298 0.7072 −2.1376 0.6686 −0.61 −1.06 0 0 LL (cm) 2MG-AD I 6.3416 1.0545 0.9652 0.5661 0.1666 1.86 5.79 0.17 12.69 II 6.5193 1.1675 0.3403 0.6869 −0.1444 1.70 −2.36 1.71 99.71 LW (cm) 2MG-AD I 3.7777 0.6838 0.5884 0.2123 −0.0258 3.22 −22.81 0.42 83.95 II 4.1181 0.7839 0.1719 −0.3606 −0.4636 −2.17 −0.37 0.47 83.89 LPL (cm) 2MG-EA I 2.2714 0.1939 − − − − − 0.21 99.28 II 2.0410 0.3613 − − − − − 0 0 L* 2MG-AD I 66.3118 14.8735 6.9872 7.6392 0.9652 1.95 7.24 168.84 90.83 II 85.7019 5.1061 3.4066 3.1586 0.6905 1.62 4.93 40.48 99.58 a* 2MG-AD I 12.2388 11.1961 3.0678 −6.9861 −1.1399 −1.60 −2.69 0 0 II −0.4909 2.9810 1.5503 −1.0423 −0.5503 −2.86 −2.82 0 0 b* 2MG-AD I 36.4601 32.5026 8.4552 −15.6254 −1.1452 −2.08 −7.38 661.77 94.13 II 28.8595 18.7166 1.1393 −13.7883 1.9313 −1.36 0.59 0 0 Note: m: Population mean value; da: Additive effect of the first major gene; db: Additive effect of the second major genes; ha: Dominant effect of the first major gene; hb: Dominant effect of the second major gene; σ2mg: Major-gene variance; h2mg: Major-gene heritability/%; −: The value is absent. The heritability of major genes for LW and L* value reached 83% and 90% in the two hybrid combinations, respectively, indicating high heritability with low environmental influence, enabling early-generation selection. In contrast, PH, FD, DFD/FD, RFL, RFW, NRF, LL, LPL, and b* value exhibited substantial variability in major gene heritability, suggesting greater environmental sensitivity. Analysis of the additive-dominance effect ratios for two major gene pairs revealed that most traits were predominantly governed by additive effects, with the first pair of major genes exhibiting stronger positive contributions. Specifically, PH, PC, DFD/FD, RFW, NRF, L*, a*, and b* values demonstrated higher additive effects in Cross I than in Cross II, whereas FD, RFL, DFL, LL, LW, and LPL showed lower additive effects in Cross I (Table 4). These findings provide a basis for efficient parental selection based on breeding objectives, thereby enhancing breeding efficiency.
Flower color distribution in hybrid populations
-
Given that flower color is one of the most critical ornamental traits in horticultural plants, we further analyzed the color spectra of the two hybrid populations. Results revealed significant segregation in flower color, with novel orange, red, and white hues emerging that were absent in the parental lines (Supplementary Tables S5). In Cross I (parents: yellow and pink), the yellow series predominated, followed by pink and white series, while orange and red series were less frequent. Cross II (parents: yellow and white) exhibited a dominant white series, accounting for 70.33% of progeny. Using L*, a*, and b* values measured by an NF555 chroma meter[27], hybrid populations were classified into distinct color series. The color parameters exhibited distinct distribution patterns: white and yellow flowers displayed higher L* value, lower a* value, and concentrated distributions of both L* and a* values; orange and red flowers showed lower L* value, higher a* value with clustered distributions, and lower b* value; pink flowers occupied intermediate ranges for L* and a* values, with lower and tightly distributed b* value (Fig. 5).
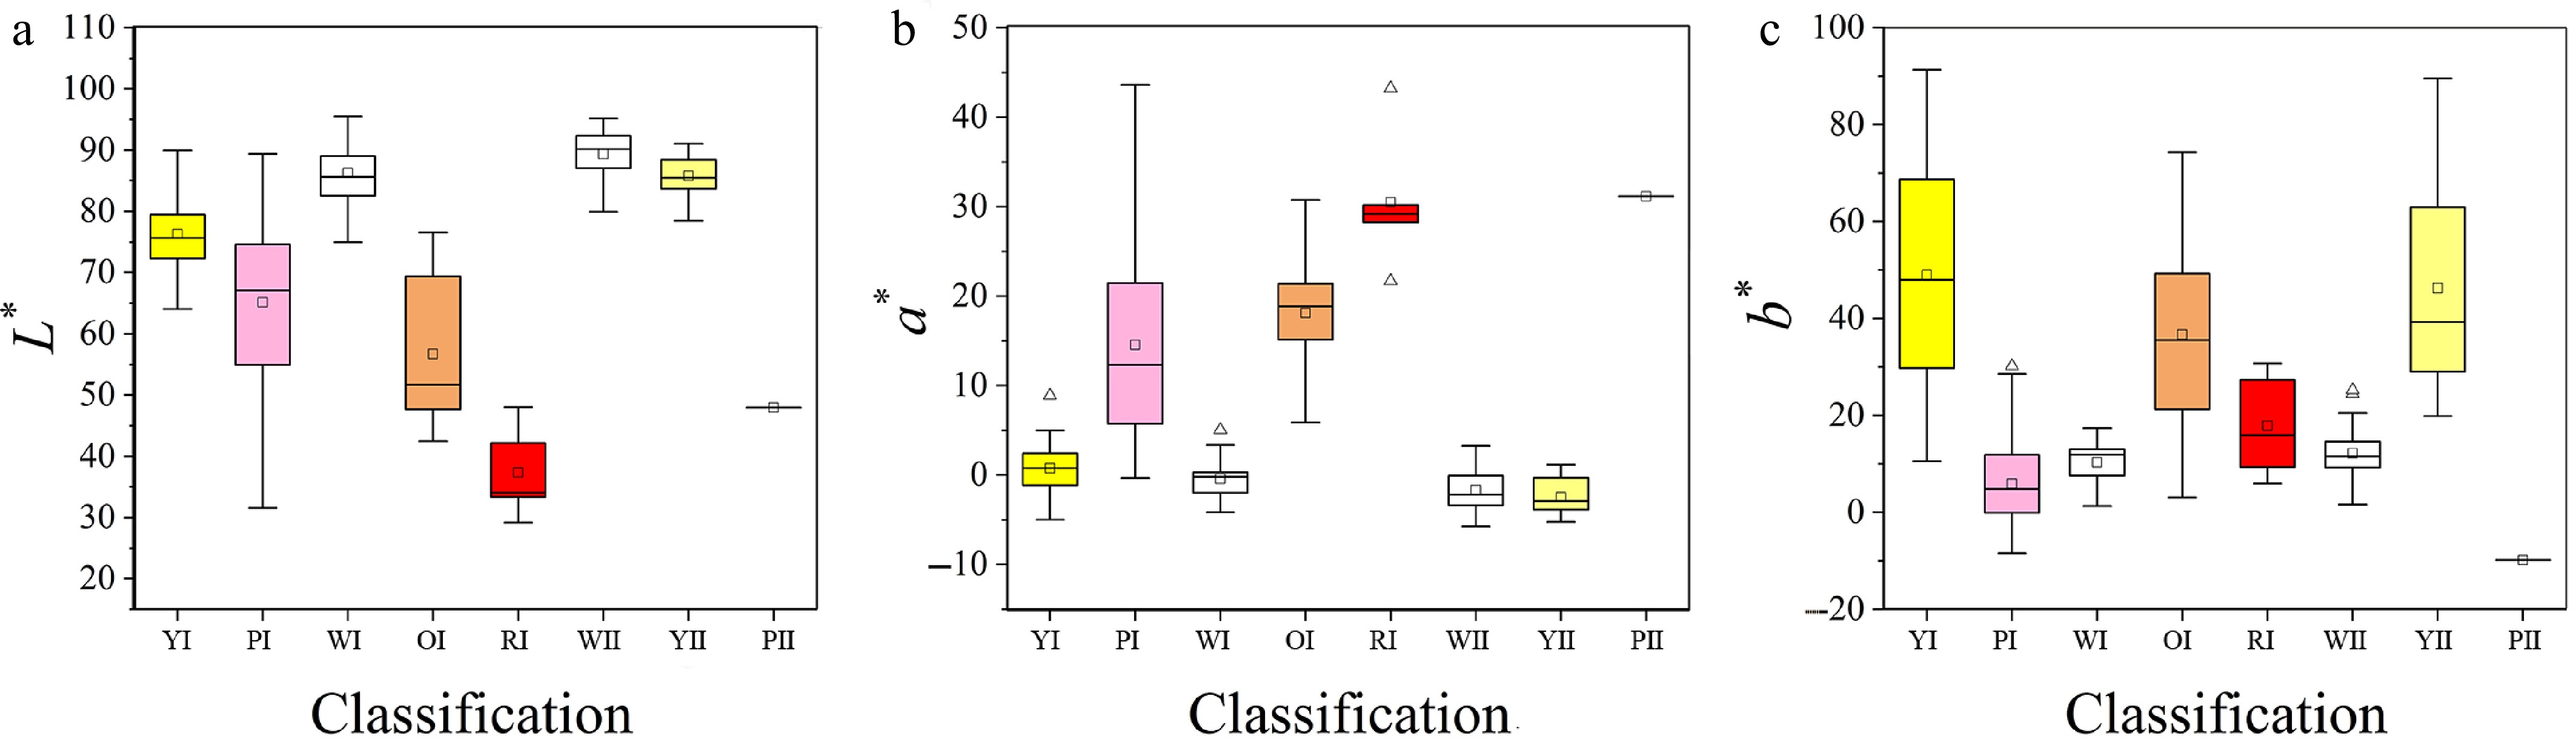
Figure 5.
Distribution of L*, a*, b* values in different color systems. (a)–(e) are the yellow, pink, white, orange, and red color system of Cross I; (f)–(h) are the white, yellow, and pink color system of Cross II. Boxplots show the mean, median, and outliers, box edges represent the 25th and 75th percentiles, and whiskers represent the maximum and minimum data points within 1.5× the interquartile range outside the box edges.
-
Modern chrysanthemum has developed extensive varietal diversity through long-term natural variation and artificial selection. However, challenges such as a narrow genetic base and poor stress resistance persist within the genus, complicating intraspecific genetic improvement. To overcome these limitations, the introduction of novel genetic resources is imperative. Many allied genera of Chrysanthemum possess desirable traits absent in cultivars[31]. A. pacifica, a wild species in the genus Ajania, exhibits strong stress tolerance and silver-colored leaves, making it a valuable resource for enhancing resistance and creating novel germplasm in cultivated chrysanthemums. Early studies on hybrid compatibility between A. pacifica and cultivated chrysanthemums (e.g., 'Olympic Torch' and 'Italian Red') demonstrated the feasibility of intergeneric hybridization, albeit with postzygotic hybridization barriers (manifested as low seed setting rates and germination rate in hybrids). While F1 capitulum displayed limited ornamental value, novel chrysanthemum germplasm with markedly enhanced ornamental traits was obtained through backcrossing[32]. Similarly, the present study observed low seed setting rates and germination rates in direct crosses between A. pacifica and ground-cover chrysanthemums, suggesting persistent hybridization barriers. Notably, crosses utilizing F1 hybrids (e.g., 'LP18' and 'GHJ10') as bridging parents exhibited improved compatibility compared to direct intergeneric hybridization. Although 'GHJ10' as a maternal parent showed low seed setting rates, its seedling germination rate was significantly higher (Table 1). This study constructed a genetic population by hybridizing the F1 generation of A. pacifica with ground-cover chrysanthemums for the first time. The significantly improved seed set and seedling rate demonstrate that the F1 generation, as a bridge parent, can effectively overcome intergeneric hybridization barriers, providing a feasible pathway for distant gene introgression[33].
Genetic variation and heterosis of phenotypic traits
-
Heterosis, primarily arising from parental genetic specificity, refers to the phenomenon where hybrid progeny derived from parents with divergent genetic backgrounds exhibit superior vitality, fecundity, yield, quality, and stress resistance compared to the mid-parental mean[34,35]. As a pivotal breeding strategy in crop improvement, heterosis has been extensively utilized in agriculture despite unresolved debates regarding its complex genetic mechanisms[36,37]. Investigating mid-parent heterosis and over-parent heterosis across hybrid combinations provides insights into heterosis patterns, facilitates optimal chrysanthemum breeding pair selection, and enhances breeding efficiency[38]. Although the population sizes of the progeny from the remaining cross combinations were insufficient for rigorous quantitative genetic analysis, extensive segregation was observed in traits such as plant height, plant crown, flowers, and leaves (Table 2, Supplementary Table S2). This preliminarily confirms the successful introgression and recombination of genetic material from A. pacifica as a parent. Furthermore, key traits such as the silver-white leaf margin stably appeared in multiple combinations, indicating high heritability of this trait and laying a foundation for further research. In the genetic populations of 'LP18' × 'JLLY' and 'LP18' × 'MXY' constructed in this study, phenotypic traits exhibited extensive variation. Traits including PH, PC, RFL, and flower color parameters showed coefficients of variation exceeding 20%, with the highest variability observed in a* and b* values (90.36%–271.87%) (Table 2). Heterosis analysis revealed negative mid-parent dominance values for PH and PC, with a high proportion of individuals below the lower parent, particularly for PC, which is the same as the existing research results[12]. Negative mid-parent dominance values were also observed for NRF, DFL, and a* value in both hybrid combinations, indicating hybrid depression. In contrast, transgressive segregation occurred for RFL, RFW, LL, LW, LPL, and L* value. Notably, LL and LW exceeded the higher parent in 59%–81% of individuals, demonstrating robust heterosis.
Phenotypic traits in ornamental plants are predominantly quantitative. Modern quantitative genetics posits that such traits are governed by a few major genes modified by polygenes. The presence of major genes in parental materials can guide the selection of parents for cross-breeding and the choice of donor parents in backcross breeding. The heritability of major genes directly determines the breeding strategy that breeders should adopt for a given trait. For instance, traits such as leaf length, leaf width, and L* exhibit high major gene heritability (> 50%), indicating they are less influenced by environmental effects and allow efficient selection in early generations[39]. In contrast, other traits show low major gene heritability or significant variation between the two hybrid populations (e.g., plant height, plant crown, floral traits), suggesting they are easily 'masked' or 'modified' by environmental factors and polygenic backgrounds, thereby reducing the accuracy of phenotypic selection and necessitating larger population sizes and more replicated evaluations[12,40]. Mixed inheritance analysis revealed that PH, PC, FD, RFL, RFW, DFL, LL, LW, LPL, L*, a*, and b* values are all controlled by two pairs of major genes. Additive genetic effects dominated trait inheritance, exhibiting stability and controllability that render selection for additive-governed traits highly effective[6]. Traits governed by these effects are more amenable to early-generation selection for breeding outcomes[41,42]. In contrast, DFD conformed to a 0MG model, lacking major gene control, suggesting a complex genetic architecture involving cumulative effects of multiple minor genes rather than singular major loci. The study by Zhang et al.[12] indicated that plant height, leaf length, and leaf width in chrysanthemum are not controlled by major genes, while the plant crown conforms to the A-2 model. Similarly, findings from Zhang et al.[12,29] demonstrated that flower diameter, ray floret length, ray floret width, and the number of tubular florets all fit the 0MG model, whereas the disc floret diameter and tubular floret length align with the 2MG-ADI model governed by two major genes with additive-dominant-epistatic effects. These results differ from the conclusions drawn in the present study. Such discrepancies may arise because the distinction between major genes and polygenes is context-dependent, varying with experimental conditions and resolution: a locus that functions as a major gene under specific circumstances may behave as a minor polygene under different conditions[28]. Moreover, differences in the genetic backgrounds of parental materials can lead to potential biases in the estimation of model and genetic parameters[12], reflecting the inherent complexity and instability of trait inheritance in chrysanthemum.
It should be specifically noted that all genetic analyses in this study were based on phenotypic data obtained from a single environment. The major genes identified and their genetic effects were likewise determined under specific experimental conditions. Changes in environmental factors (e.g., climate, soil, cultivation practices) may influence gene expression and thereby alter the inheritance patterns of traits. Future research should aim to systematically dissect the genotype-by-environment interaction mechanisms by expanding parental genetic diversity, combining high-resolution genetic mapping with multi-environment phenotyping, and leveraging functional genomics approaches. This will enable a more comprehensive understanding of the genetic architecture of chrysanthemum traits and provide guidance for precision breeding.
Segregation pattern and color spectrum distribution of flower color
-
Flower color, as the primary ornamental trait in chrysanthemum ray florets, remains a central research focus[22]. While wild chrysanthemums exhibit limited coloration (yellow, white, and pink), modern breeding technologies have significantly diversified the flower color spectrum[8]. Color manifestation depends on pigment composition and concentration, with anthocyanins and carotenoids serving as key determinants[10]. Phenotypic segregation of flower color occurred in both genetic populations studied. In Cross I, novel orange, red, and white phenotypes emerged in progeny, absent in parental lines. Previous studies established distinct distribution patterns of L*, a*, and b* values parameters across color categories[43]. Similarly, the present results showed elevated and clustered L* value in white and yellow flowers, while red and purple variants exhibited lower L* value with concentrated higher a* value. Other colors displayed relatively lower a* value. The b* value parameter peaked in yellow and orange flowers but remained lower and tightly distributed in red, pink, and purple types (Fig. 5). Correlation analyses between color parameters and pigment content revealed: anthocyanins positively correlated with a* value but negatively with L* and b* values; carotenoids positively associated with b* value; chlorophyll negatively linked to a* value[44,45], suggesting that color variations in hybrid progeny likely result from differential accumulation of anthocyanins, chlorophyll, and carotenoids[46]. Chrysanthemum flower color constitutes a complex quantitative trait governed by multigenic regulation, influenced by both genetic and environmental factors. Elucidating its inheritance patterns advances understanding of color formation mechanisms, enhances breeding precision, and addresses market demands for ornamental diversity. Future efforts should integrate molecular marker-assisted breeding and gene editing technologies to further decode the genetic architecture of chrysanthemum coloration.
-
This study established a genetic population through hybridization between A. pacifica and its F1 progeny with ground-cover chrysanthemums, revealing the genetic mechanisms underlying cross-compatibility, phenotypic trait variation, and heterosis expression. The results demonstrated that using F1 progeny of A. pacifica as crossing parents partially overcame intergeneric hybridization barriers, significantly increasing seed set and seedling survival rates, thereby providing a feasible approach for distant gene introgression. Both hybrid populations exhibited extensive variation in plant height, plant crown, floral traits, and leaf characteristics. Among these, the coefficient of variation for flower color parameters was the highest, reaching 271.87%, indicating substantial potential for flower color differentiation. Heterosis analysis further revealed that hybrid progenies exhibited significant transgressive heterosis in leaf traits and some floral traits, whereas plant height and plant crown generally displayed outbreeding depression, reflecting the complexity of trait inheritance. Genetic analysis using the major gene plus polygene mixed inheritance model indicated that, except for the diameter of the disc floret, all other traits were controlled by two major genes, with additive effects being predominant. This suggests high genetic stability of these traits in early generations, which is conducive to directional selection. In summary, this study elucidates the fundamental genetic patterns of trait inheritance in A. pacifica hybrid progenies, providing theoretical foundations and practical guidance for germplasm innovation and cultivar breeding in chrysanthemum.
This study was supported by the National Natural Science Foundation of China (32271947), the Science, Technology and Innovation Project of Xiongan New Area (2022XAGG0100), and Plant (Tree Species) Planning under the Garden City Initiative (2024-HXFW-445).
-
The authors confirm their contributions to the paper as follows: data curation: Xiang L, Bai J, Yi C, Li D, Tan B, Liu H, Liu C, Zhang N, Tan T, Li H; investigation: Xiang L, Bai J, Liu C, Zhang N, Tan T, Li H; visualization, formal analysis: Xiang L, Bai J; writing−original draft: Xiang L, Bai J, Yi C, Li D, Tan B, Liu H, Tang Y; validation: Yi C, Li D, Tan B, Liu H; methodology: Fu X, Sun M; writing−review and editing, supervision: Fu X, Sun M, Tang Y; project administration, funding acquisition: Sun M; conceptualization: Tang Y. All authors reviewed the results and approved the final version of the manuscript.
-
All data generated or analyzed during this study are included in this published article and its supplementary information files.
-
The authors declare that they have no conflict of interest.
-
# Authors contributed equally: Lijuan Xiang, Jinrong Bai
- Supplementary Table S1 Statistical Analysis of Maternal Self-pollination.
- Supplementary Table S2 Display data for the remaining hybrid combinations.
- Supplementary Table S3 Akaike information criterion (AIC) values of every traits in hybrides of Cross I and Cross II.
- Supplementary Table S4 Test for goodness-of-fit of selected genetic model of Cross I and Cross II.
- Supplementary Table S5 The proportion of color groups and range of L*, a* and b* values in hybrides.
- Supplementary Fig. S1 Capitula phenotypes of hybrids of Ajania pacifica × 'JLLY'.
- Copyright: © 2026 by the author(s). Published by Maximum Academic Press, Fayetteville, GA. This article is an open access article distributed under Creative Commons Attribution License (CC BY 4.0), visit https://creativecommons.org/licenses/by/4.0/.
-
About this article
Cite this article
Xiang L, Bai J, Yi C, Li D, Tan B, et al. 2026. Intergeneric hybridization between genus Ajania and Chrysanthemum: germplasm innovation and genetic variation analysis of key ornamental traits in hybrid progenies. Ornamental Plant Research 6: e006 doi: 10.48130/opr-0025-0050 

Intergeneric hybridization between genus Ajania and Chrysanthemum: germplasm innovation and genetic variation analysis of key ornamental traits in hybrid progenies
- Received: 12 September 2025
- Revised: 07 November 2025
- Accepted: 28 November 2025
- Published online: 02 February 2026
Abstract: Chrysanthemum is an important ornamental plant. However, long-term intrageneric hybridization has led to a narrow genetic background, hindering germplasm innovation and necessitating the introduction of new genes for genetic improvement. Ajania pacifica (Nakai) Bremer et Humphries, a species of the genus Ajania, offers a potential means to introduce its unique traits into chrysanthemums. In this study, hybrid populations were constructed by crossing A. pacifica (and its F1 progeny) with ground-cover chrysanthemum. Genetic variations in 16 phenotypic traits, including plant height, plant crown, floral and leaf characteristics, were analyzed in two hybrid populations. The results demonstrated that hybrids exhibited extensive genetic variation across 16 phenotypic traits (2.76%–271.87%), with simultaneous occurrence of heterosis and hybrid decline, along with significant segregation in flower color. By applying Pearson correlation analysis, and major gene with polygene inheritance analysis, the genetic architecture and effects of these traits were elucidated. Except for disc flower diameter, which lacked major gene control, all other traits were governed by two pairs of major genes, predominantly through additive effects. This study reports for the first time, a systematic genetic analysis of the hybrid progeny between the F1 generation of A. pacifica and modern cultivated chrysanthemums, revealing the potential genetic modes of 16 traits in the hybrid population. The results of the study not only expand the genetic reservoir of chrysanthemum but also clarify the inheritance patterns of phenotypic traits, providing critical theoretical support for developing novel chrysanthemum varieties with optimized phenotypic traits.
-
Key words:
- Ajania pacifica /
- Ground-cover chrysanthemum /
- Intergeneric hybridization /
- Heterosis /
- Genetic analysis