


-
Dose-response relationships are foundational in pharmacology because the effect of almost any compound is not binary, but graded by the dose applied. From such dose-response relationships, we obtain information about the concentration at which half-maximal response occurs (the EC50, commonly expressed as pEC50 = −log10 EC50), the magnitude of the response (effect size), and the slope of the transition. Together, these values provide mechanistic insight into the drug's mechanism of action (MoA). In classical cell-free or cell-based assays that measure, e.g., enzyme inhibition, receptor binding, or phenotypes such as cell viability, fitting a sigmoidal curve to dose-response data qualitatively and quantitatively describes this relationship. While powerful, it has become increasingly clear that the characterization of a pharmacological agent should not stop here because most drugs have more than one target in cells, most of which are not necessarily known. Therefore, the study of drug effects should include an assessment at the systems level to obtain a better appreciation of all desired or undesired MoAs of a compound. The proteome is particularly relevant in this regard as almost all drugs act on proteins, are proteins, or lead to the production or degradation of proteins in a cell-type and organ-specific context. From a mechanistic viewpoint, embedding dose as an axis in proteomic perturbation experiments offers several key advantages. First, discrimination by potency: many compounds show polypharmacology, modulating the abundance or activity of more than one target protein or site of post-translational modification (PTM), often at different doses. Such parallel MoAs can only be distinguished when considering the potency dimension. Second, discrimination by effect size: not all regulated proteins or PTMs show the same magnitude of abundance or activity change in response to drugs. This dimension differentiates subtle modulators from strong effectors, and can indicate the existence of separated pools of target proteins in different cellular localizations, cell populations, or activation states. Third, discrimination by cross-comparison: dose-response parameters provide a quantitative metric for comparing molecules, pathways, cell states, etc., beyond binary 'up/down' classifications.
Despite these advantages, only very few studies have reported proteome-wide experiments using full dose-response measurements. Instead, most experimental designs compare replicate experiments of proteome or PTM changes in response to an often arbitrarily high concentration of a compound. This severely limits the mechanistic interpretability of the data.
The authors have argued for some time[1,2] that dose-response curves are more informative than replicate experiments at all levels of decrypting drug MoA: target deconvolution, pathway engagement, and proteome reprogramming leading to cellular consequences. We further argue that, considering the breathtaking advances in quantitative mass spectrometry-based proteomics over the past 10 years in terms of sensitivity, speed, and accessibility, systems-level full dose-response measurements are now entirely feasible, and should replace less informative experimental strategies.
-
For proteome-scale data, the sheer number of peptides and proteins, as well as their vast abundance range, presents major analytical challenges. Noisy quantification, missing values, non-sigmoidal curves, and a large multiple testing burden make distinguishing genuine drug-regulated curves from noise nontrivial. First, a four-parameter log-logistic function (front plateau, back plateau, slope factor, and the x-value at the curve's inflection point) is fitted to reflect the typical sigmoidal shape of a dose-response curve (Fig. 1a). Finding the dose-response model that describes the underlying relationship best is surprisingly difficult, and requires optimized algorithms. The central question for each fitted model is then: do we have a real dose-response curve or not? This question is of utmost importance because only real dose-response curves have interpretable parameter estimates. A recently developed software tool, CurveCurator[3] addresses these challenges by multi-start regression and classifying regulated vs not-regulated vs unclear curves based on statistical significance (p-values from a recalibrated F-statistic) and biological significance (fold-change) thresholds. All models and the relevance boundary (2D-threshold) can be visualized in a volcano-plot (Fig. 1b). The statistical rigor of CurveCurator effectively controls the false discovery rate (FDR) even in large-scale curve fitting scenarios that may contain millions of dose-response measurements. The approach readily applies to molecular, as well as phenotypic readouts, enabling discrimination of relevant regulated (down or up) from equally informative, not-regulated proteins or PTMs, as well as analytes with high variance in large datasets, without a strict requirement for replicated data points.
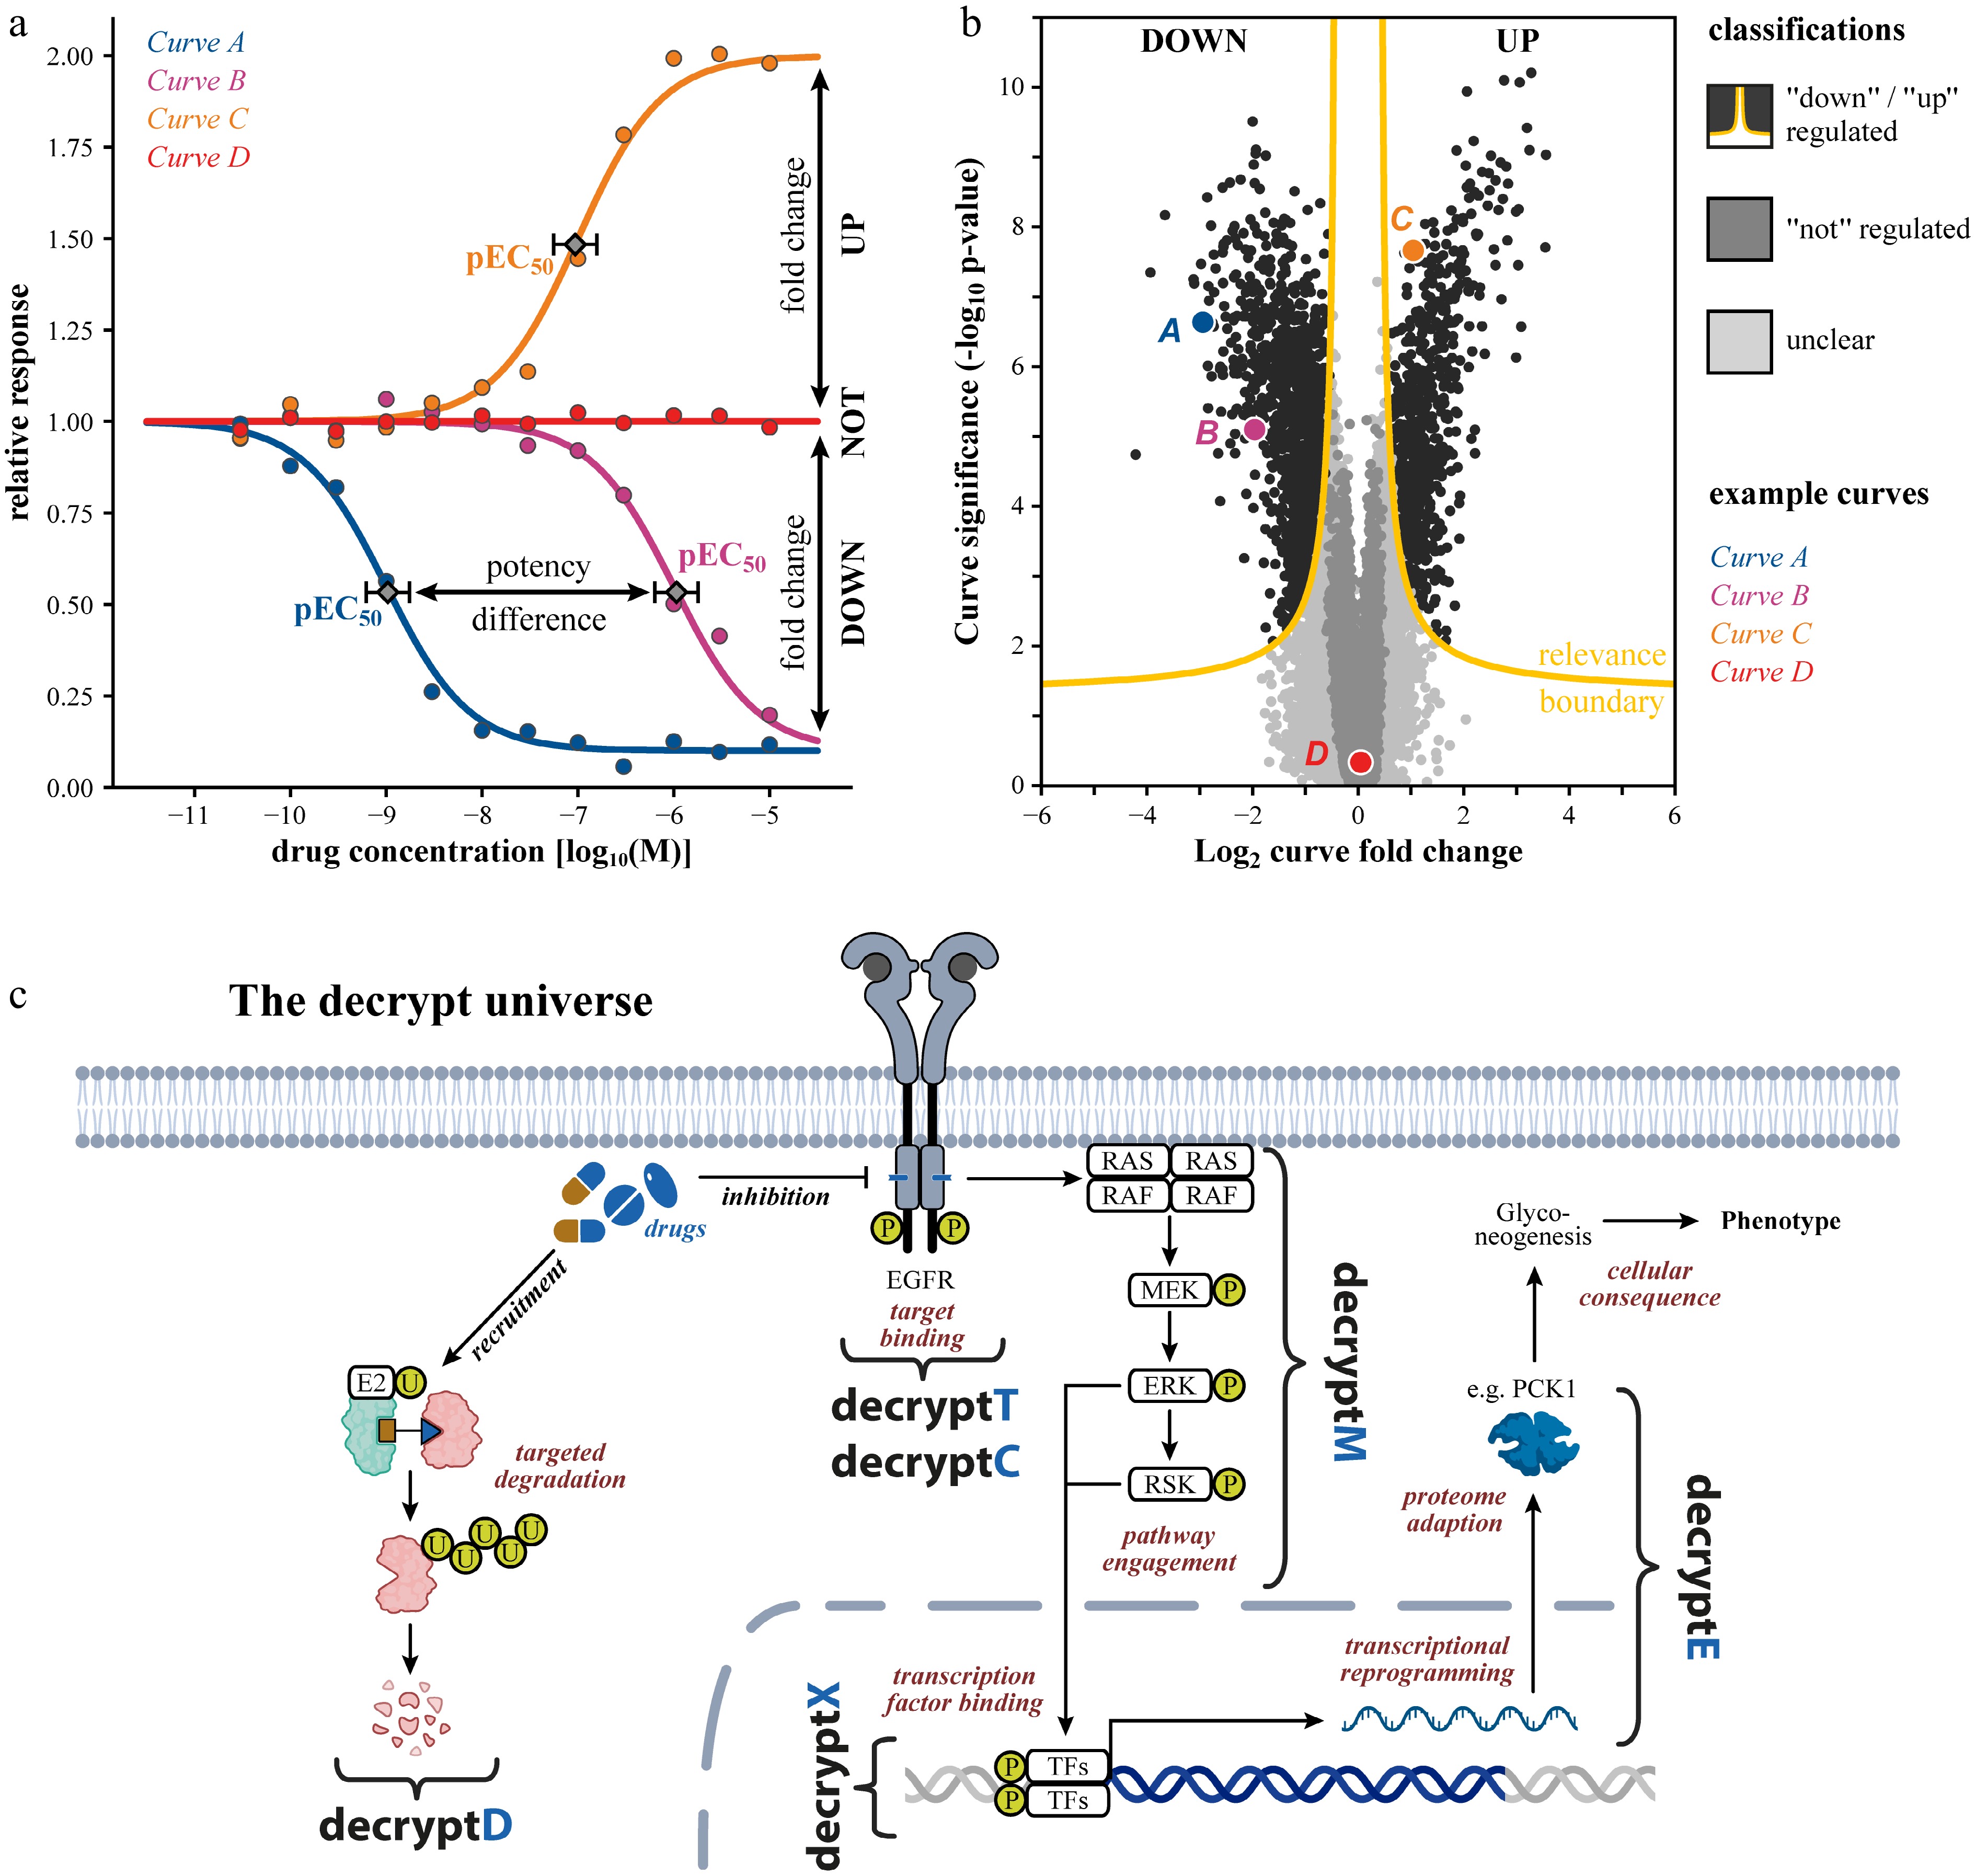
Figure 1.
Tracing drug mechanism of action by dose-dependent proteome- and PTM-wide measurements. (a) Schematic dose response curves illustrating extraction of pEC50: −log10 effective drug concentration to achieve 50% of the maximal effect as quantitative measures of target or pathway potency. (b) Example volcano plot of a typical omics dose-response dataset, where each data point is a dose-response curve. The relevance boundary (combination of fold change and alpha threshold) identifies down- and up-regulated responses with false discovery rate (FDR) control. (c) Schematic of how a drug's mechanism unfolds in a cell: target binding or degradation (decryptT/decryptC/decryptD), pathway engagement (decryptM/decryptX), proteome reprogramming (decryptE), and ultimately cellular consequences. TFs: transcription factors.
Another common secondary question to multiple drug perturbation data sets (after establishing that a response exists), is whether the same protein or PTM shows significantly different potency (ΔpEC50), or efficacy (Δlog2_FC) across treatments. In these cases, it is beneficial to perform multiple independent dose-response experiments with independent curve estimates. A Welch's test can then determine if the estimates are significantly different.
In the sections below, we walk through the logic of measuring and interpreting proteome-wide dose-response data to 'decrypt' drug MoA in a typical cascade, starting with target deconvolution (decryptT for target binding, decryptC for covalent modalities or decryptD for degraders), through pathway engagement (decryptM for protein modifications; decryptX for interactions with RNA or DNA), and proteome reprogramming (decryptE for protein expression), eventually leading to cellular consequences (Fig. 1c). Representative experimental approaches that probe such layers, together with their advantages, limitations, and the added value of dose-response analysis, are summarized in Table 1.
Table 1. Collection of experimental approaches probing each layer of drug mode of action including their advantages, limitations, and the added value of dose-response analysis.
Technique Examples What it's used for How DRC concept adds value Pros/cons and our view Ref. Target binding Affinity enrichment-based Immobilized probes/matrices (Kinobeads, HDAC beads, tailored resins) Capture drug-protein interactions in native proteome; Immobilized matrices enrich stable, high-affinity interactions; PAL uses UV-induced crosslinking to also
capture weak, transient interactions that could otherwise be lost during washes. Both enable identification of direct binders and selectivity profiling.Converts single pulldowns into quantitative DRC allow calculation of Kdapp, EC50; Filters out sticky or nonspecific binders; Reveals relative selectivity across isoforms, families, or complexes. Pros: Use of native lysates preserves PTMs, cofactors, complexes; broad family applicability (kinases, HDACs) or individual compounds; PAL extends to weak/transient binders; enrichment reduces proteome complexity.
Cons: Loses intact-cell context; Immobilization bias; PAL probe derivatization required; unselective photocrosslinking.
Recommendation: Use for quantitative target space mapping and selectivity profiling.[6,8,15,
29]Photoaffinity labeling (PAL) [12,13] Activity enrichment-based 1st-gen family-directed probes (e.g., serine hydrolases, DUBs, kinases) Covalent probes enable labeling of active enzymes or identification of drug targets. Competitive incubations reveal target engagement by blocking probe labeling. First-generation probes profile enzyme family activity, while second-generation approaches achieve proteome-wide reactivity and site-specific ligandability mapping. Single-dose competition assays can overestimate weak or nonspecific interactions, producing false-positives for ligandability. DRC enable quantitative extraction of IC50/Ki values, target occupancy, and relative selectivity across enzymes, nucleophile classes, or reactive cysteines, allowing rigorous ranking of cysteine reactivity and ligandability. Pros: Enables target deconvolution and covalent ligand discovery; isoTOP-ABPP provides site-specific, quantitative readouts. Some probes (e.g., kinase probes XO44) cell-permeable, allowing live cell profiling.
Cons: Probe chemistry and steric bias can influence labeling patterns; Bulky enrichment handles often limit cell permeability; requires well-designed electrophiles tailored to nucleophile classes.
Recommendation: Use for covalent drug profiling and site-specific ligandability mapping. The competition format is also valuable for confirming intracellular target engagement and deconvolution of covalent compounds.[44−46] 2nd-gen proteome-wide (e.g., DecryptC: cysteine-reactivity, isoTOP-ABPP, TRAP) [9−11,
47,48]Denaturation-based (thermal) 2D-TPP, ITDR,
conc-PISA, mTSAInfer drug-target engagement in living cells or lysates via changes in thermal stability and protein solubility after ligand binding. In living cells, PTMs and PPIs influence thermal stability; dose-response curves clarify dose-dependent stabilization, reduce false positives, and rank direct vs indirect targets. Pros: Applicable in intact cells; no compound modification required; Detects diverse binding modes, including allosteric interactions; Dose-response analysis enables ranking and hit prioritization beyond binary hit-calling.
Cons: 2D-TPP requires large sample numbers (dose x temperature); Condensed TPP/iTSA are higher throughput but less sensitive; Indirect effects complicate interpretation; Not all proteins show measurable thermal shifts (false negatives); PTMs and PPIs can cause apparent stability changes (false positives), though DRC mitigates this.
Recommendation: Use to confirm intracellular target engagement, ideally in combination with orthogonal approaches for higher confidence.[18−20,
23,29]Denaturation-based (chemical) iSPP, solvent-induced precipitation (ethanol, acetone), chaotropic/ kosmotropic agents (urea, guanidinium), pH shifts Used to probe protein stability, folding, and ligand binding, particularly useful for thermolabile proteins or systems where temperature-based denaturation is unsuitable. Dose-dependent stabilization reveals specific, saturable ligand binding, distinguishing true from indirect targets. It enables quantitative estimation of apparent affinity (EC50/
pEC50), supports target ranking by stabilization potency, and reduces false positives from indirect or nonspecific effects.Pros: Suitable for proteins and complexes sensitive to heat; reveals ligand-induced stabilization or destabilization; flexible across solvents, salts, and pH, compatible with DRC analysis.
Cons: Can have reduced proteome coverage for very insoluble or membrane-associated proteins; depends on chemical buffer composition.
Recommendation: Use as a complementary approach to thermal profiling when heat is unsuitable, particularly for ligand screening or dose-response target identification.[22−27] Conformational/Accessibility-based Lip-Quant, PELSA Detects ligand-induced structural changes via altered protease or chemical reactivity, supporting target validation and binding-site mapping. DRC analysis confirms ligand-induced protection, ranks stabilization, maps binding sites, and limits indirect false positives. Pros: Can provide site-specific binding information.
Cons: Not all compounds induce structural changes that alter the accessibility of the protein, resulting in false negatives.
Recommendation: Use for precise binding site mapping and target validation, ideally in combination with orthogonal methods to confirm hits and mitigate the risk of missed interactions.[32,33,
49]Pathway modulation/consequence of binding DecryptM Phosphorylation, acetylation, or ubiquitinylation Measures dose-dependent PTM responses to reveal pathway engagement and cellular mechanisms of drug on/off-target activity. Enables separation of direct and indirect effects, clusters PTM sites by shared potency (EC50) to reveal pathway wiring and compares pathway engagement across compounds or cell types. Pros: Provides systems-level resolution of downstream signaling; distinguishes multiple pathways engaged by a drug; links potency information to pharmacological effects; available across different PTMs.
Cons: interpretation can be complicated by parallel pathways or cell-type context.
Recommendation: Use to gain mechanistic insight beyond direct targets, connecting drug binding to functional signaling outcomes. Best applied over multiple doses and, ideally, across different cell models.[1,37−
40]Cellular consequence/adaptation/death DecryptE Drug-induced proteome abundance changes Measures dose-dependent proteome changes to reveal how drugs remodel proteostasis through direct and adaptive effects. Differentiates rapid abundance changes linked to direct target effects from slower, adaptive reprogramming; allows quantification of potency windows; distinguishes primary MoA from secondary downstream effects; and helps correlate molecular changes with phenotypic outcomes. Pros: Provides a global view of proteome remodeling with broad coverage and quantifiable EC50 values, uncovering unexpected drug effects beyond known targets.
Cons: Expression changes are often indirect and slow, complicating mechanistic interpretation; requires careful temporal design.
Recommendation: Use to map systems-level consequences of drug treatment, compare potency windows across pathways and phenotypes, and identify adaptive mechanisms, ideally in combination with faster-acting assays like phosphoproteomics for mechanistic resolution.[2] Phenotypic Cell viability, apoptosis, differentiation, cell cycle arrest, metabolic activity assays Measures the functional consequences of drug treatment on cellular phenotypes across a range of concentrations, providing insight into efficacy, toxicity, and therapeutic windows. Resolves the concentrations at which phenotypic changes arise relative to molecular target engagement, distinguishing direct drug effects from downstream or off-target consequences. Enables correlation of molecular EC50 values with phenotypic outcomes and informs safe, effective dosing ranges. Pros: Directly links molecular perturbations to cellular outcomes; enables ranking of compounds by potency and efficacy; provides translationally relevant data for therapeutic assessment.
Cons: Often integrate multiple direct and indirect mechanisms, complicating mechanistic interpretation; slower phenotypic responses may lag behind molecular changes; high variability may require multiple replicates and careful experimental design.
Recommendation: Use in combination with molecular profiling (e.g., decryptM or decryptE) to map drug potency, mechanism, and therapeutic window, and to validate that molecular engagement translates into functional cellular effects.[2,39,
42,50] -
Typically, the first task in drug MoA studies is to identify which (target) proteins directly interact with a compound of interest. There is a large body of chemical proteomics and chemical biology literature describing how scientists employ competition-binding activity-based proteome profiling (ABPP) or competition-binding affinity purifications (AP) for this purpose (recently reviewed[4]). However, only the integration of a dose-response element into these assays allows estimation of apparent binding affinities (for non-covalent compounds), engagement potencies (for covalent compounds), or degradation efficiency (for degraders and some molecular glues). Several landmark studies have shown the feasibility and utility of dose-response measurements in this context, notably for determining the target space and selectivity profiles of kinase inhibitors[5−7]. In these reports, the authors probed the binding landscape of clinical kinase inhibitors in cancer cells using immobilized, broad-spectrum kinase inhibitors (Kinobeads). By measuring competition across a concentration series, they derived apparent dissociation constants for each pair of > 200 clinical-grade compounds, > 200 kinases, and hundreds of other proteins. From the several hundred thousand resulting dose-response curves, they could measure the relative selectivity of each kinase inhibitor. This would not have been easily achieved using replicate experiments performed at a single concentration (e.g., 1 µM; Fig. 2). Building on this powerful blueprint, many subsequent proteomic target identification studies have incorporated dose-response analysis, extending to inhibitors of HDAC complexes[8], ligands of reactive cysteines[9,10] or lysines[11], natural products and drugs of DNA-binding proteins in conjunction with photo-affinity labeling (PAL)[12−14], or other compounds with unclear MoA such as lipoic acid[15].
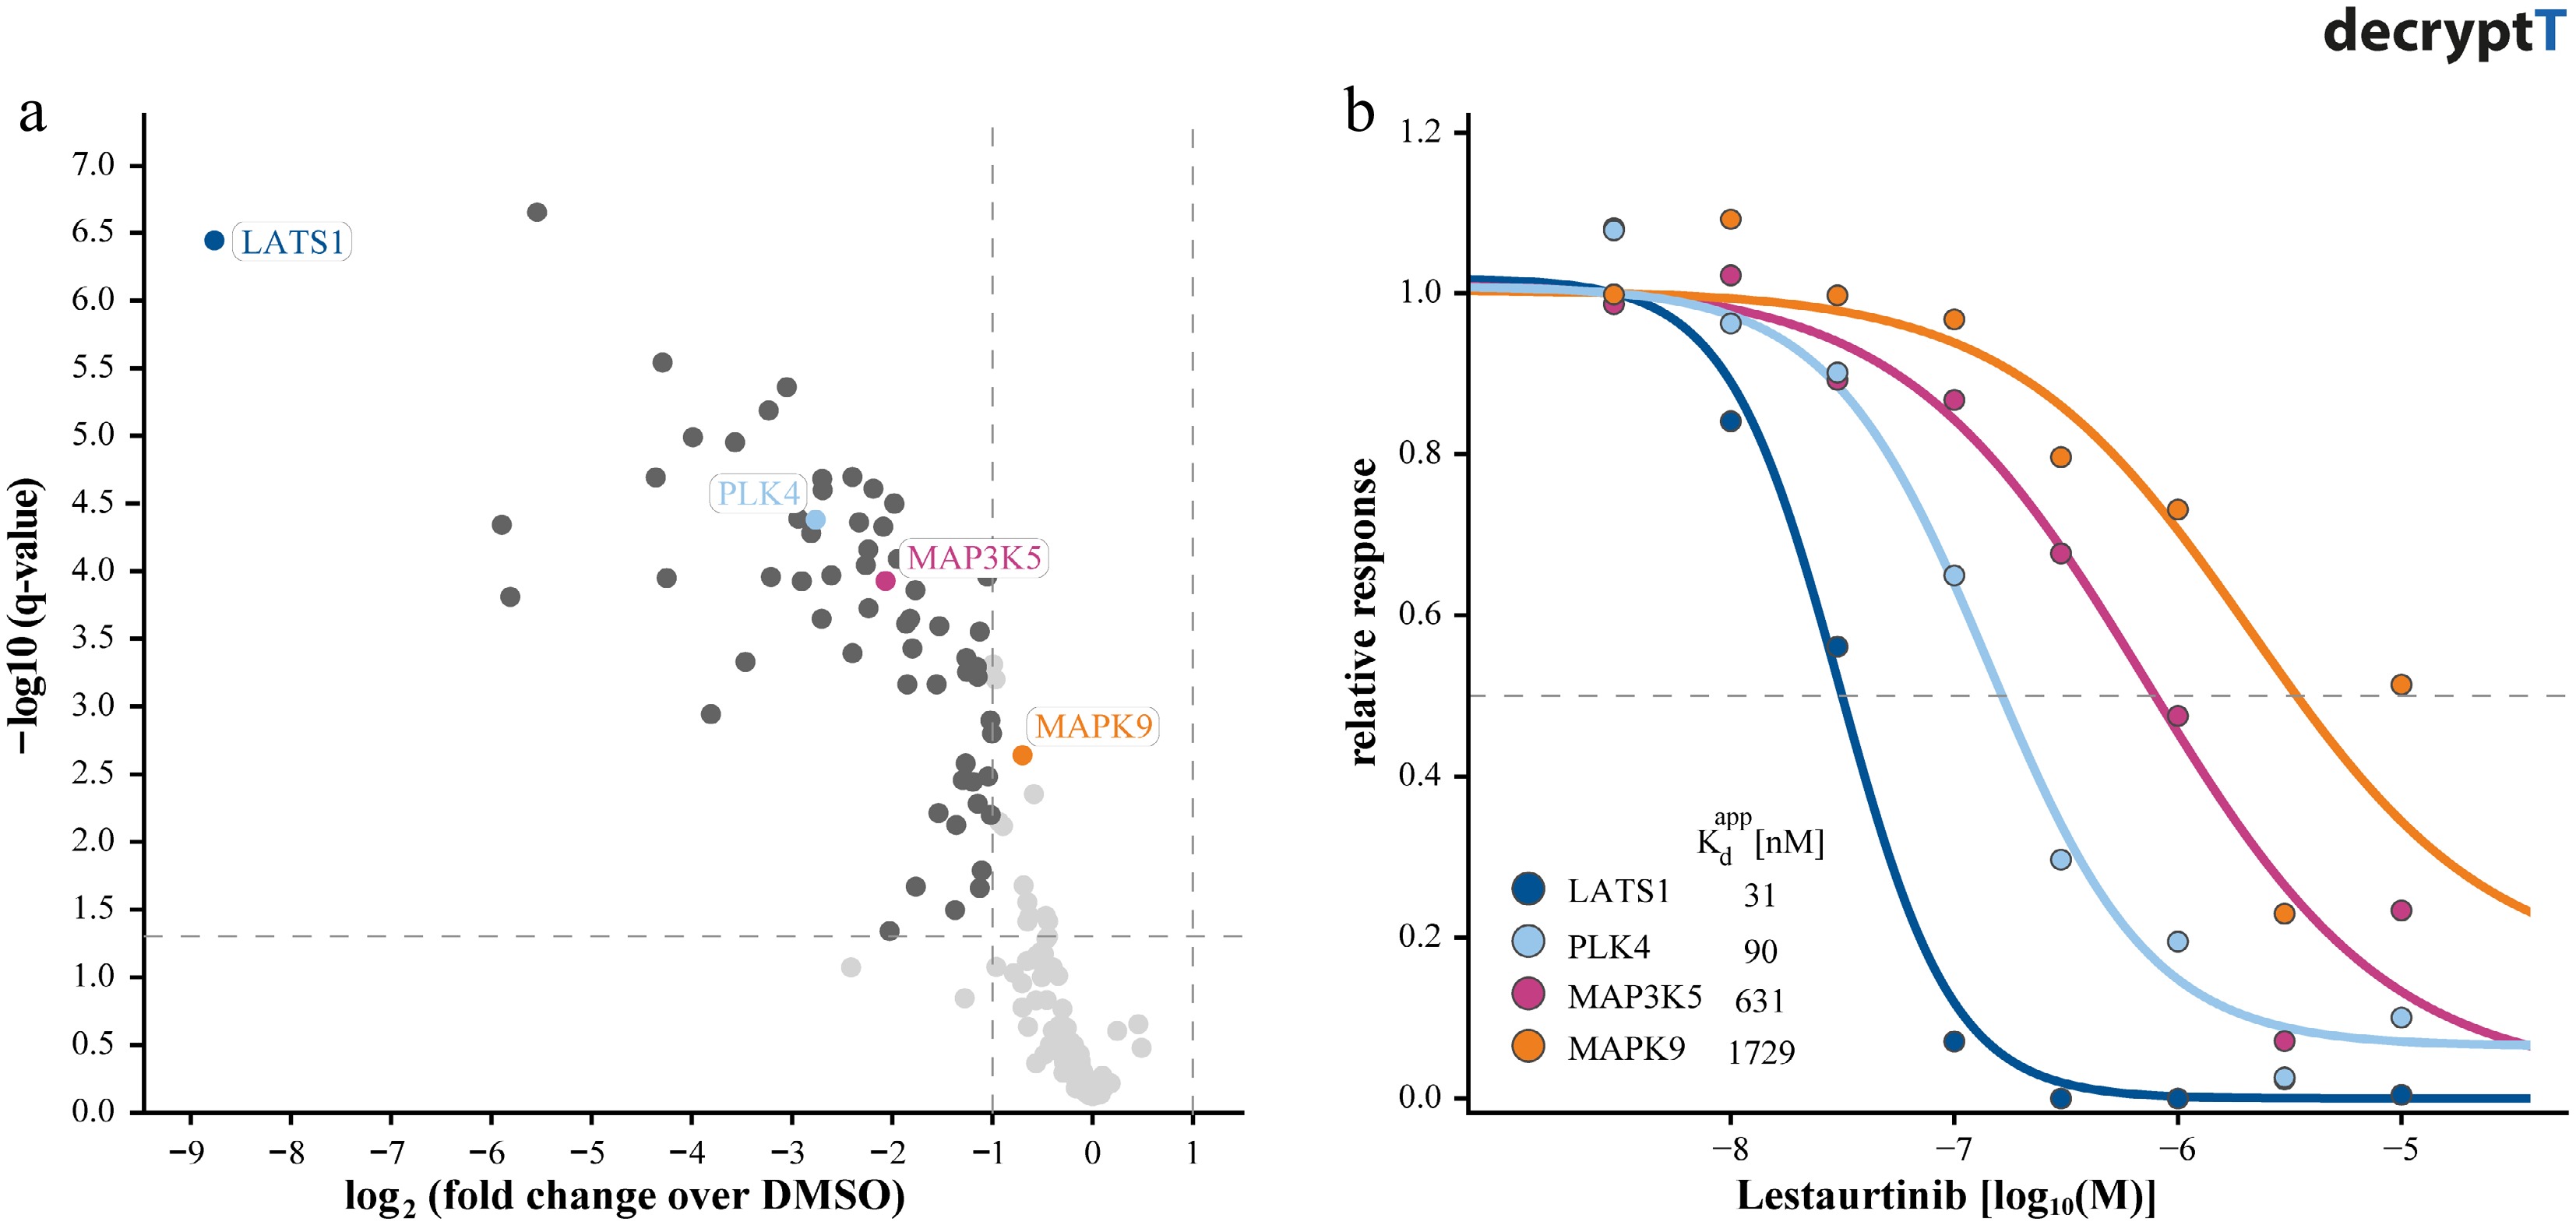
Figure 2.
Distinguishing targets of Lestaurtinib by dose-response competition affinity profiling. (a) Volcano plot showing kinases identified in replicate single-dose (1 µM) competition binding experiments using Kinobeads, illustrating limited selectivity resolution. (b) Corresponding dose-response curves (dose range, 0–30 µM) for selected kinases derived from Kinobead profiling, enabling quantification of apparent binding affinities (pKdapp: −log apparent dissociation constant).
One limitation of affinity- or activity-based proteome profiling methods is that they require the synthesis of suitable chemical probes. Stability-based chemoproteomic approaches are an alternative, measuring compound-induced changes in protein structural stability, typically reflected as increased or decreased resistance to thermal or chemical denaturation or enzymatic degradation (a broad range of methods is reviewed in George et al.[16]). A widely implemented example is thermal proteome profiling (TPP), which quantifies changes in soluble protein abundance after heat-induced unfolding and aggregation. Multiple variations of this principle exist, including full melting-curve formats that quantify compound-induced shifts in protein melting temperature (Tm) by monitoring soluble protein abundance across a thermal gradient[17,18], and condensed formats such as PISA or single-temperature approaches that directly monitor changes in protein solubility. This is distinct from dose-response curves, which would measure soluble protein abundance as a function of ligand concentration to report on engagement potency[19−21]. Complementary approaches rely on chemical denaturation instead of thermal destabilizing proteins by altering solvent polarity or dielectric properties, inducing precipitation, for example, through the use of organic solvents[22−24], chaotropic agents[25], kosmotropic ions[26], or pH shifts[27].
While thermal or chemical shifts measured at a single compound concentration can be useful for target engagement of a known hit, but the magnitude of the shift itself is not proportional to binding affinity[28]. Proteins differ intrinsically in their thermal or chemical stability, and numerous cellular factors, such as PTM or protein-protein interactions, can influence apparent shift size. Embedding a concentration series into these assays therefore provides a more informative readout, by converting a binary yes/no stability effect into a dose-dependent response curve. This supports discrimination between direct and indirect effects, ranking of targets, and permits estimation of apparent engagement potencies—information that cannot be inferred from shift magnitude alone. As an example, the isothermal dose-response (ITDR) configuration of TPP measures protein stabilization (or destabilization) as a function of ligand concentration. Applying ITDR measurements at different temperatures led to the discovery of phenylalanine hydroxylase as an off-target of the HDAC inhibitor Panobinostat[29]. Similarly, the Integral Solvent-Induced Protein Precipitation (iSPP) was recently implemented in a dose-response format to identify the molecular target of a P. falciparum antibiotic[30].
The third widely used class of proteome-wide target identification approaches measures compound-induced protection (or deprotection) of proteins against limited proteolysis. The LiP-MS (limited proteolysis-mass spectrometry) method[31] and the related peptide-centric local stability assay (PELSA)[32] exploit the principle that ligand binding alters protein conformation and thus protease accessibility. Like TPP and related stability-based methods, LiP-MS or PELSA do not require chemical probes and can, in principle, map the drug binding site on the protein. Both methods have been configured to measure the dose-response characteristics of compounds such as the pan-kinase drug Staurosporine by LiP-MS and natural product-inspired drugs, including rapamycin, geldanamycin, tanespimycin, and ganetespib by PELSA[32,33].
-
Having identified candidate targets, some of the next questions to ask are: Does the compound modulate any signaling pathways? If so, which ones are engaged and at what drug concentration? Phosphoproteomics has been applied extensively to investigate these questions. However, the interpretation of much of the published data is complicated by the fact that drugs are typically used at far too high concentrations, often making it difficult or even impossible to distinguish cause and effect[34−36]. Budayeva et al. have addressed this shortcoming in a specific scenario by performing site-specific and dose–response phosphorylation measurements in muscle cell myotubes downstream of activating the receptor tyrosine kinase MUSK[37]. The recently introduced decryptM technology by Zecha et al.[1] is a compelling example of how the potency dimension helps to address these questions in a systematic and pharmacology-minded way. Briefly, cells of interest are treated with a dose range of a drug, lysed, and proteolytically digested; then enrichment workflows (e.g., for phospho-, acetyl-, and ubiquitylated-peptides) are applied before LC-MS/MS quantification across the dose series. For each PTM-bearing peptide, a dose-response curve is fitted as outlined above.
Because many signaling pathways are controlled by reversible protein phosphorylation mediated by specific kinases (and phosphatases), phosphorylation events downstream of the kinase inhibitor drug target respond with similar pEC50 values if part of the same pathway, and comparable in potency to drug-target binding. Hence, the potency dimension can often distinguish two or more pathways that are engaged by the drug in parallel. One can further strengthen such pathway assignments by comparing potency responses of multiple compounds that share a molecular mechanism (typically the same known targets). For instance, if multiple inhibitors of the same kinase produce overlapping potency profiles in downstream phosphorylation sites, the collective data reinforces the mechanistic links. A similar argument can be applied when analyzing the same compound across different cancer cell lines.
The value of decryptM experiments is exemplified in Fig. 3 for the multi-kinase inhibitor Dasatinib. The drug is a very potent (~1 nM) designated BCR-ABL inhibitor used for the treatment of BCR-ABL positive chronic myeloid leukemia (CML), but it also has additional targets with various potencies. Figure 3a summarizes the distributions of phosphosite potencies across three cancer cell lines. Following the logic above, most drug-regulated phosphorylation sites in the CML cell line, K562, have similar potencies and are all downstream of the driver kinase BCR-ABL. In the cutaneous squamous cell carcinoma, A431, which is driven by a genomic EGFR amplification, the picture is entirely different because Dasatinib is only a weak EGFR inhibitor (~1 µM), which is why most drug regulated phosphopeptides cluster around that concentration. Yet another profile is observed for KRAS-mutated A549 lung carcinoma epithelial cells because Dasatinib inhibits a range of kinases in this cell line that are not necessarily present in others.
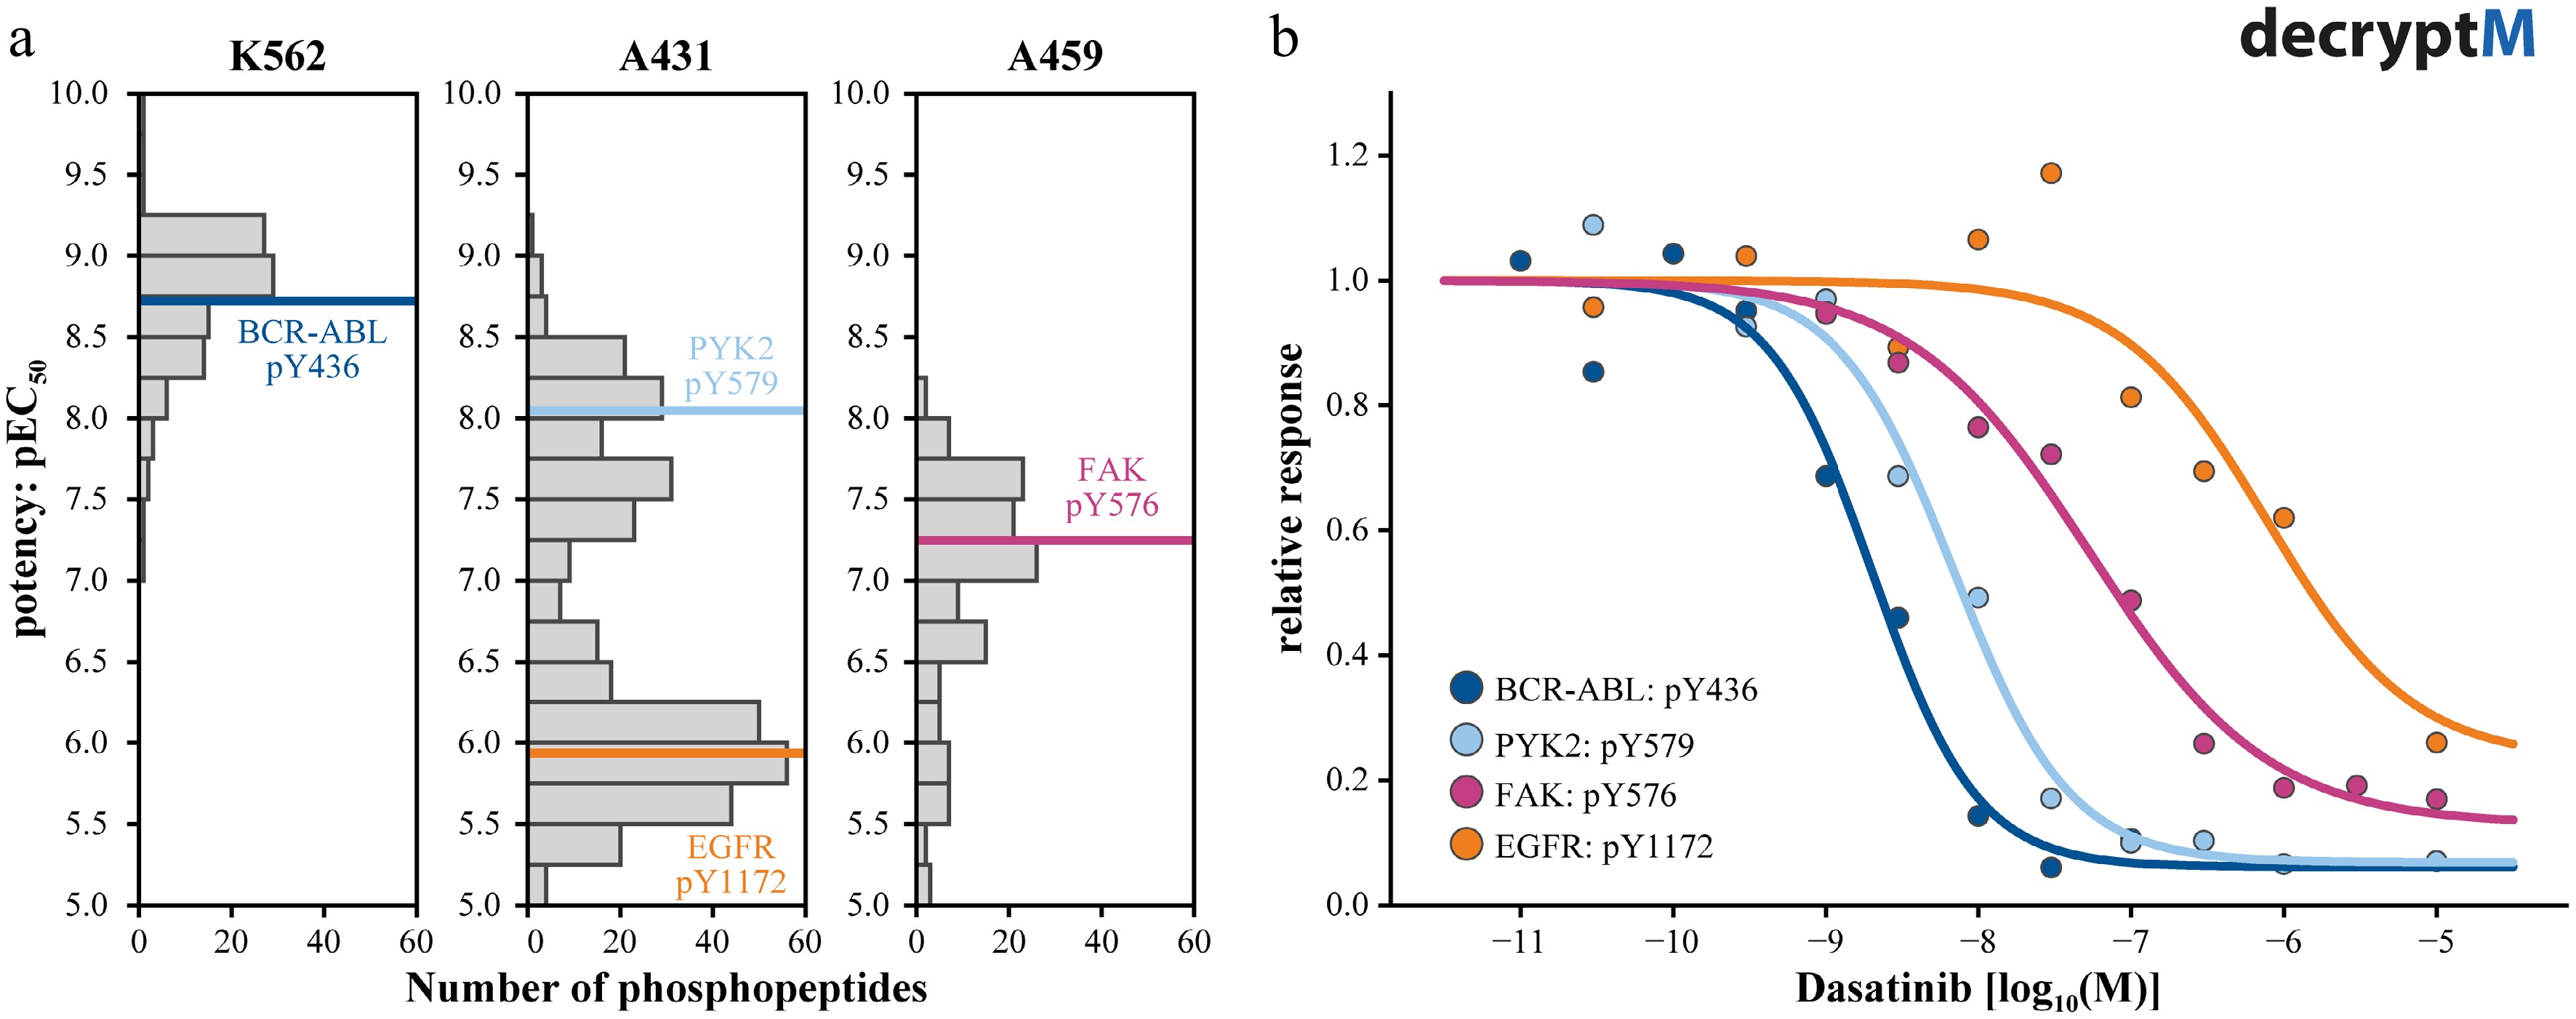
Figure 3.
Measuring pathway engagement by decryptM profiling. (a) Summary plots of the potencies by which phosphopeptides are regulated by Dasatinib showing that the polypharmacology of Dasatinib leads to different profiles in different cell lines. Phosphorylation sites on Datastinib target proteins are marked in color. (b) Dose-response curves of the four examples highlighted in panel (a), illustrating the different potencies with which Dasatinib inhibits its targets and, in turn, leading to different but matching potencies of kinase substrate phosphorylation.
DecryptM profiles thus provide valuable information about drug MoA beyond target proteins and has already led to important insights. For instance, a study investigating Rituximab has illuminated how CD20 binding by the therapeutic antibody leads to overactivation of the MAPK pathway, resulting in cancer cell death[1]. It also provided an explanation for the experimentally observed cell killing synergy of the DNA-damaging agent Gemcitabine in combination with ATR inhibitors[38], and showed that covalent KRAS inhibitors exert their cytostatic effects by first shutting down MAPK signaling, before shifting cancer cells to a quiescent state[39]. DecryptM profiles of protein acetylation unexpectedly showed that HDAC6 shared many substrates with other HDACs[40]. The decryptM approach is still very new. Therefore, all the above examples were published by the same laboratory. Because of its substantial utility, it can be anticipated that the method will find increasing uptake in the community.
-
There are many ways in which drugs can change proteostasis, and the extent to which drugs change proteome expression can vary drastically. Also, these changes can occur directly as a consequence of drug MoA or more indirectly because of cellular adaptation processes. Both are dose-dependent, both contribute to the overall cellular fate, but often operate along different time scales, which may or may not involve transcriptional processes of regulating protein abundance. Studying both transcriptional and proteomic regulation improves understanding of drug MoA because each layer may reveal different parts of the regulatory cascade. While RNA-Seq typically detects early, rapid, and sometimes drastic transcriptional responses, the kinetics and effect sizes of protein expression changes, if any, often do not reflect the behavior on the mRNA level. On the contrary, proteomics measures the actual effectors directly that eventually determine cellular fate. Integrating both mRNA and protein information layers might, therefore, help identify direct and indirect effects and reconstruct a clearer mechanistic chain of events.
Eckert et al.[2] have investigated the dose dependency of drug-induced protein abundance changes (decryptE for protein expression) systematically in a Jurkat T-cell line model for 144 clinical drugs, covering > 8,000 proteins and generating > 1 million dose-response curves. For instance, drugs like pomalidomide induced the degradation of proteins such as IZKF (EC50 of 10 nM), and ZPF91 (EC50 of 270 nM) within minutes to hours, and without changing transcript levels (Fig. 4). Somewhat similarly, methotrexate led to increased abundance of its target protein DHFR without requiring increased transcript levels. The proposed MoA is that methotrexate binding to DHFR releases the protein from its own mRNA so that it can be translated, resulting in increased DHFR abundance[41].
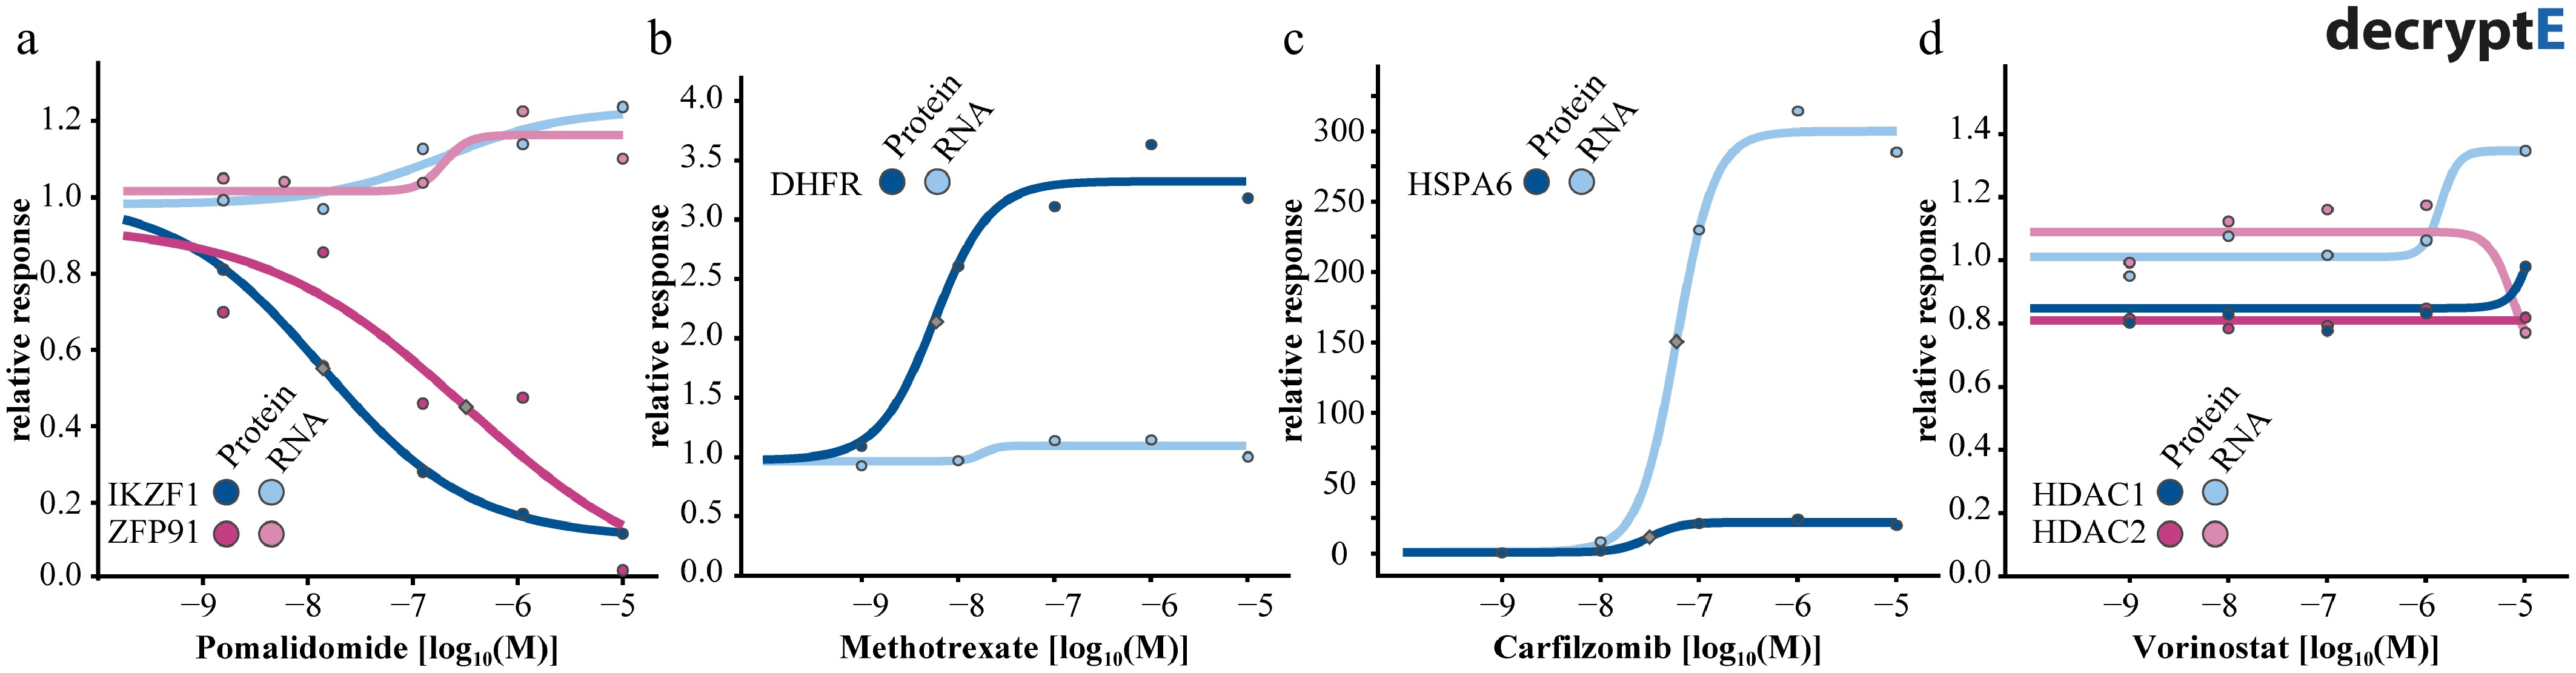
Figure 4.
Dose-response curves for proteins and their mRNA transcripts for (a) the degrader pomalidomide, (b) the DHFR inhibitor methotrexate, (c) the proteoasome inhibitor carfilzomib, and (d) the HDAC1-3 inhibitor vorinostat.
Conversely, drugs like the proteasome inhibitor carfilzomib interfere with a central cellular process (proteasomal protein degradation), and can (indirectly) lead to very widespread changes in protein abundance that often goes along with widespread changes at the transcriptional level, processes that are usually slower (hours to days) than direct drug effects on their target proteins. Carfilzomib creates a 'protein folding crisis' in the cell, resulting from the accumulation of proteins usually bound for degradation. One cellular response is upregulation of transcript and protein levels of the chaperone HSPA6, likely to increase folding capacity. While the effect sizes of this response are very different (~300-fold at the transcript level, ~20-fold at the protein level), the potency dimensions are identical. Yet other drugs such as vorinostat do not appear to have any influence on target protein or transcript abundance. Still, a big surprise was the finding that HDAC inhibitors can lead to the loss of protein expression of T-cell receptor components, likely explaining why the drug is clinically efficacious for the treatment of certain lymphomas and autoimmune diseases but not for solid tumors. A key insight from the Eckert et al. study was that protein abundance of most canonical drug targets did not change in response to drugs. In fact, only ~25% of drugs induced abundance changes in at least one of their known target proteins, and these were often among hundreds to thousands of other proteins that also changed abundance. Therefore, while decryptE experiments often reveal the molecular processes underlying the fate of drug-treated cells, they can generally not be used for the purpose of target identification.
These examples illustrate the challenges inherent to the integration of different layers of regulation and underscore the complexity of drug MoA, which still lacks a comprehensive, system-level understanding. In our view, advancing this field requires a stronger emphasis on dose-response measurements and multi-omics integration rather than evaluating isolated events in single layers and using arbitrary drug concentrations. While the latter might seemingly be easy to understand and interpret, it overlooks the interconnected nature of cellular regulation.
-
Mapping molecular perturbations to phenotypic outcomes (e.g., viability, apoptosis, differentiation, cell cycle arrest, etc.) is a further important step in understanding drug MoA. Recognizing that drugs may exert their direct and indirect effects at many levels of biological regulation and along different time scales, a few studies have extended dose-response measurements across time points and/or OMICs layers. Integrating this data can yield insight into which molecular events correlate best with timed cellular effects and at which dose. An example of such a 2-dimensional time-dose linked analysis was also provided by Eckert et al. on the example of methotrexate and its target DHFR (Fig. 5). While the potency by which the drug led to increased protein abundance remained broadly the same over time, the full effect was only reached after 18 h of drug treatment.
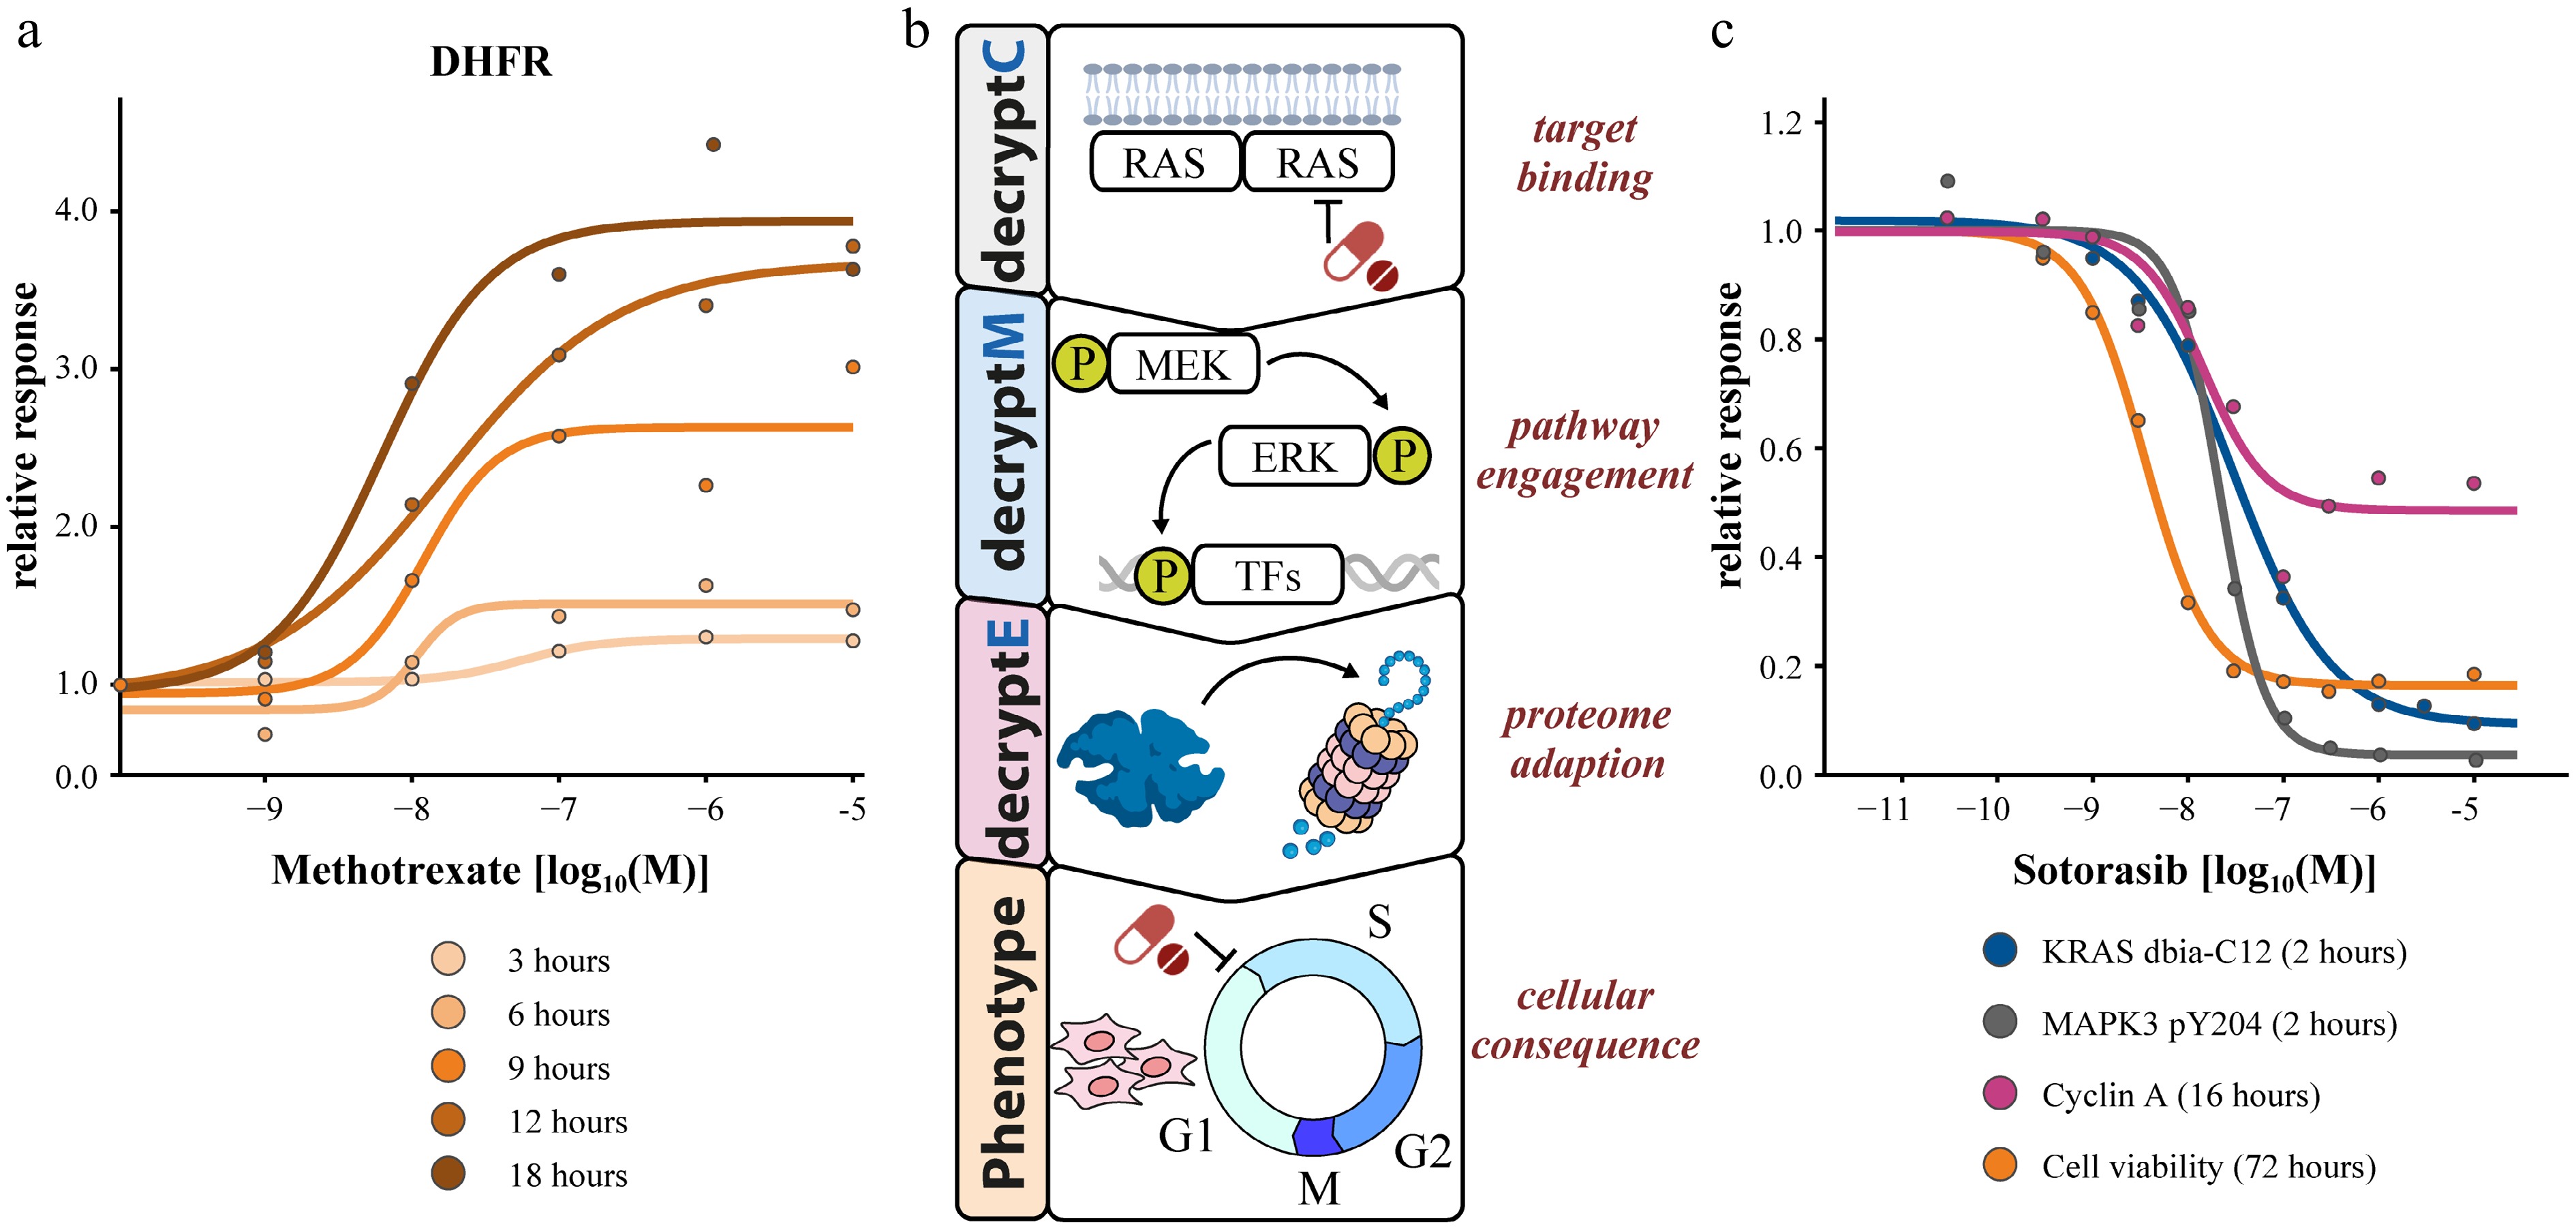
Figure 5.
Multi-dimensional dose-response measurements. (a) 2D time-dose coupling of DHFR abundance changes in response to methotrexate. (b) Multi-decrypt-dimension profiling of the KRAS inhibitor sotorasib revealing potency coherence at all levels of MoA elucidation.
Recently, Kabella et al.[39] demonstrated how all the decrypt levels can come together to elucidate the MoA of (covalent) mutant KRAS inhibitors. They observed very strong consistency between the potencies of the drug in dose-dependent reactive cysteine (target binding, decryptC), phosphoproteome (pathway engagement, decryptM), protein expression (proteome reprogramming, decryptE), and phenotypic (cell viability) profiling experiments (Fig. 5). An additional temporal dimension enabled the authors to separate the immediate mechanistic drug effects on the ERK pathway from the later cellular drug adaptation effects, notably exit from the cell cycle.
The consistency of the potency dimension across OMICs layers may not always be as perfect. Zecha et al.[1] measured cell viability dose-response curves (days of drug incubation) in parallel with PTM curves (hours of drug incubation), and noted that canonical phosphorylation site responses often occurred at slightly lower doses (i.e., more potent) than the phenotypic pEC50. This is consistent with the expectation that signaling modulation precedes phenotypic changes. Eckert et al.[2] also measured phenotypic endpoints (cell metabolic activity and toxicity) across the same dose range used for determining protein expression changes. They also found that most drugs induced protein abundance changes that were more potent than the measured phenotypic effect. This is again consistent with a molecular cascade preceding phenotypic endpoints, which also may reflect a certain buffering capacity of the cell against the effect of drug perturbation.
Another example is Li et al.[42] who measured transcriptomics, proteomics, and phosphoproteomics dose responses at multiple time points to define biological responses for chemical safety assessment. This is interesting because dose-response molecular profiles may help delineate therapeutic windows. In other words, what is the dose range at which target inhibition and pathway modulation occur without triggering broad off-target proteome perturbation? A drug whose binding potency is much lower than the onset of proteome reprogramming has a favorable window. Conversely, narrow windows may predict toxicity. Therefore, multi-omics and time-resolved dose-dependent measurements can inform molecular pharmacology as well as address important translational concerns.
-
The decrypt-technologies presented here are omics-assays where drug effects are tested and measured in one sample at the same time. The first important question is how many different doses should one apply. Due to the omics-nature of the assays, an often recommended statistical power analysis will yield a different answer for each measured analyte because they have different, analyte-specific, inherent variances. Thus, we base our recommendations rather on the following logic. The goal of a well-set-up decrypt experiment is to capture the full sigmoidal behavior of different dose-response profiles. Thus, we strongly recommend using a very broad concentration range (≥ 6 logs), ideally with half-logarithmic spacing. This experimental design ensures that plateaus for on- and off-targets are covered as well as the transition phase between them. Adding even more data points will obviously improve the curve-fitting statistics and the accuracy of the EC50 estimation. Additionally, the inclusion of more than one vehicle control can improve the front plateau estimation, and thus improve the relevance scoring in CurveCurator. Here we note that dose-replicates provide little benefit and should rather be replaced by more drug doses. In other words, an experiment with eight doses in duplicate is inferior to 16 single doses, while the experimental effort is the same. The use of statistical tools like CurveCurator to obtain dose-response parameters that are backed by relevance thresholds and proper FDR control is strictly necessary, because only significant dose-response curves have valid curve estimates. In short, we propose an ideal experimental design that consists of ≥ 12 individual doses plus two controls. If replicates are needed for confidence intervals around the curve estimates to statistically compare two dose-response curves within or across datasets, we recommend to repeat this single-dose design r-times.
A common concern is missing values (NaNs) from mass-spectrometry-based assays and how they affect decrypt-experiments. Unfortunately, there is no single solution that suits all situations, because NaNs occur owing to different reasons. CurveCurator can handle NaNs, and there is generally no need for imputation. However, fewer observations will reduce the power/confidence of the curve. If NaNs are not missing at random, e.g., in decryptT, these NaNs could indicate perfect competition and should not be statistically penalized. In these cases, low-value imputation is an acceptable strategy, but in any case, we recommend careful evaluation of the effects of imputation on results and their interpretation.
The second important question is the choice of an optimal drug exposure time(s) that aligns with the kinetics of anticipated molecular changes. In other words, one needs to be mindful of slow binders (such as HDAC inhibitors), the short timescale of PTM-driven signaling (minutes), the time required for protein expression changes (hours), and the time until phenotypic changes manifest (days). For the longer time scales, we advise time-dose experiments to distinguish signaling from endpoints. In the case of analyzing many compounds, e.g., as part of screening campaigns, we recommend prioritizing molecules by potency (first), and effect size (second) for follow-up work using orthogonal assays to validate the presumed target-to-phenotype hypothesis.
While applicable in many scenarios, dose-resolved proteomic methods have limitations. At a technical level, chromatography-coupled mass spectrometry has dynamic range limits (depending on instrumentation and configuration), which can bias observed dose-response curves to high-abundant analytes. In such cases (or for confirmatory experiments), other readouts such as antibodies can be used for proteins or PTM sites of interest, but the extent to which these are available, and can be practically implemented for confirming hundreds or thousands of dose response curves, is limited.
Not all drugs follow a simple sigmoidal dose-response characteristic in which case other curve-fitting models[43] may be more appropriate, but will also require more dose points for robust statistics. In addition, if a compound modulates the activity of functionally unrelated targets with similar potency, the downstream omics layers may be difficult to interpret. Furthermore, compounds may address, e.g., enzymatic activity without engaging signaling pathways or leading to changes in proteostasis. In such cases, absence of a proteomic response does not equal absence of biological relevance. Obviously, if a certain biology is absent in a cellular model, or the drug cannot permeate the plasma membrane, a possible target effect cannot be observed. Additionally, in heterogeneous cell populations, potency and effect size values may be obscured by opposing or synergistic cellular effects. We also note that many proteins or PTMs with dose-response curves could represent bystanders with no relevance for any biological effect. Because functional validation approaches depend heavily on the initial discovery, it is difficult to make general recommendations. However, it is generally good practice to extend the investigation (in a global or targeted fashion) to additional biologically relevant systems (or controls). Alternative chemical probes can also be a valuable approach, but finding probes that have the same/very similar affinity, selectivity, and MoA as the compound of interest is not trivial. Genetic perturbations are also challenging because they often operate on very different time and effect scales as drug perturbations. Still, a (permanent or conditional) knockout or overexpression system can be informative for certain aspects of drug MoA elucidation such as establishing a particular protein as a driver of a pathway or the mediator of a cellular adaptation or endpoint.
Many extensions of the overall approach can be envisaged. For instance, future opportunities include combining dose-response measurements with sub-cellular fractionation, single-cell, or protein turnover assays. All the work published so far used 2D cell culture models that often only partially reflect the pathology addressed by a drug. While technically more demanding, extension of the approach to spheroids, organoids, animal models, and, eventually, human beings would be highly desirable. Given that the conceptual and statistical framework, as well as the analytical technology, are now in place, such systems-wide dose-response measurements are becoming feasible and hold considerable promise for future applications in mechanistic biology, drug discovery, and pharmacology.
-
Not applicable.
-
The authors confirm their contributions to the paper as follows: NB, FB, NK, AG and BK conceptualized the mini-review. NB, FB and NK analyzed the data. NB, FB, NK and AG visualized the data. BK wrote the manuscript with input from all authors. All authors contributed references, reviewed the results and approved the final version of the manuscript.
-
All data generated or analyzed during this study are included in this published article.
-
The authors thank all members of the Kuster lab for fruitful discussions, assistance with creating data and data analysis that made this mini-review possible. This work was in part funded by the German Science Foundation (SFB/TRR 387, Grant No. 514894665; ProtACTion, Grant No. 525132892; SFB 1321, Grant No. 329628492), the German Cancer Aid (TACTIC, Grant No. 70115201), and the European Research Council (ERC Advanced Grant TOPAS, Grant No. 833710).
-
The authors declare that they have no conflict of interest. Bernhard Kuster is co-founder and shareholder of MSAID, and has no operational role in the company.
-
#Authors contributed equally: Nicola Berner, Florian P. Bayer, Amy George, Nicole Kabella
- Copyright: © 2026 by the author(s). Published by Maximum Academic Press on behalf of China Pharmaceutical University. This article is an open access article distributed under Creative Commons Attribution License (CC BY 4.0), visit https://creativecommons.org/licenses/by/4.0/.
-
About this article
Cite this article
Berner N, Bayer FP, George A, Kabella N, Bergamasco FL, et al. 2026. Proteome-wide dose-response measurements for the characterization of drug mechanism of action. Targetome 2(1): e001 doi: 10.48130/targetome-0025-0011 

Proteome-wide dose-response measurements for the characterization of drug mechanism of action
- Received: 17 October 2025
- Revised: 09 December 2025
- Accepted: 22 December 2025
- Published online: 16 January 2026
Abstract: Almost all drugs exert their effects in a dose-dependent fashion, but a central challenge in drug discovery and pharmacology is to bridge the gap between observed phenotypic and the often complex underlying molecular mechanisms. Important questions to answer are: which proteins are physically bound by the compound, which pathways are engaged in the cell and how is the cell molecularly and physiologically reprogrammed en route to its eventual, drug-determined fate? In light of the advances in quantitative mass spectrometry speed and sensitivity over the past decade, it has become feasible to perform systematic full dose-response experiments at the level of: (1) target deconvolution; (2) pathway engagement; (3) proteome reprogramming; and (4) cellular consequences. Each enables the extraction of potency and effect size information for thousands of proteins and post-translational modification sites in parallel. In this mini-review, the conceptual framework of system-level dose-response measurements is outlined and key published studies are used to illustrate how such data inform successive layers of drug mechanisms of action.
-
Key words:
- Chemical proteomics /
- Drug discovery /
- Mechanism of action /
- Dose-response omics